Restaurants
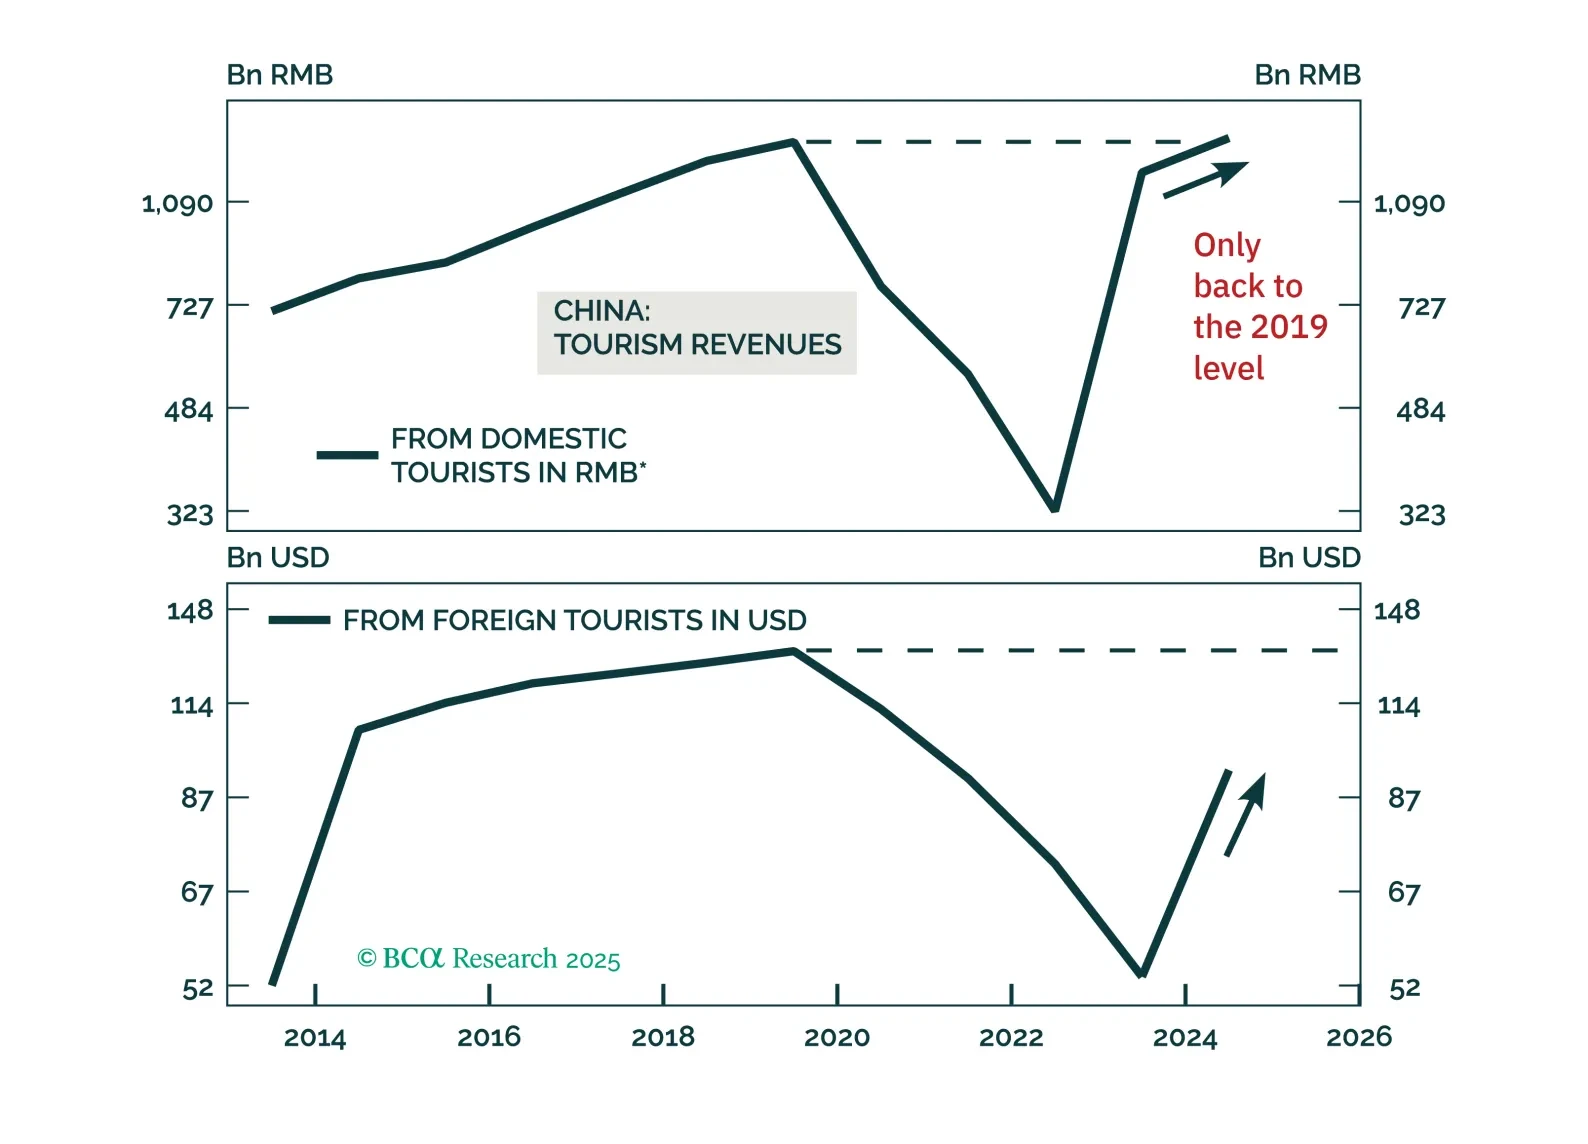
Chinese tourism will continue growing, but investors should be mindful not to overpay for Chinese tourism stocks by extrapolating their past double-digit revenue growth into the future.

Today, we are downgrading the S&P restaurants index from overweight to neutral. Currently, the industry faces a trifecta of challenges: Rising input prices, a stronger dollar, and a shift in consumer spending away from discretionary goods and services towards necessities. Chart 1 Rising Input Costs: Soaring food prices and rising wages for the lowest-paid cohort of the US workers is pressuring US restaurants’ bottom line. Restaurants are trying to offset wage pressures by hiking prices with food away from home CPI climbing 2.2 standard deviations away from its five-year average (Chart 1). A mean reversion move is likely coming, meaning that going forward restaurants will have to absorb some of the cost increases, which will damage their bottom line. Stronger USD: The index is dominated by two multinational players, Starbucks (SBUX) and MacDonald’s (MCD), that command a 40% and 30% weight of the industry, respectively. When averaged together, those two companies derive over 45% of sales from abroad compared to 40% for the S&P 500. Stronger dollar dents companies’ profits by making American goods and services more expensive, and because of the accounting translation effect (Chart 2). Making things worse, US restaurants’ withdrawal from Russia to protest the invasion of Ukraine will have an adverse effect on their sales. McDonald’s announced that closing its extensive network of restaurants in Russia will cost it $50 million a day, or 9% of its revenue. Consumer spending is shifting towards necessities: High inflation in general, and rising prices of food and gasoline weigh on consumer spending, forcing many consumers to allocate a higher share of their spending towards necessities (Chart 3). As the US consumer tightens its belt, restaurants and other discretionary spending categories are likely to come under pressure. Chart 2 Chart 3 Bottom Line: We are downgrading the S&P restaurants index from overweight to neutral, booking a loss of 13.5%.
Highlights This is the second part of the publication, in which we provide an in-depth overview of Hotels, Restaurants, and Airlines, or the “travel complex” as we dubbed it. In last week’s report, we provided an overview of the macroeconomic backdrop, the Delta variant trajectory, and a “deep dive” into the hotel industry. We concluded Hotels is a sound tactical and cyclical investment, and we recommended an overweight. Airlines Less profitable trip mix and excess capacity: Domestic travel has rebounded to 2019 levels, while international and corporate travel are still lagging due to government and corporate restrictions (Chart 1). Some of the excess capacity is being redirected to domestic leisure travel, which has higher volume but is far less profitable. Airline cargo growth is a saving grace. The cost side of the airline business has its own challenges. Airlines have high fixed costs as they own or lease aircraft fleets. This creates a heavy financial burden during downturns. The price of jet fuel has increased to pre-pandemic levels. Labor costs are high due to the unionized work force and rising wages. Profitability is elusive: With airline revenues down 27% YoY in August 2021, and costs on the rise, it is hard to envision profitability without a return of international and business travel. Too much debt: Airlines’ net debt has risen significantly since the pandemic. Without positive cash flow generation, it will become harder and harder for them to meet their debt obligations. We have a negative outlook for airlines and are underweight the S&P Airlines index. Restaurants Defensive: Although the S&P Restaurant Industry resides within the pro-cyclical S&P Consumer Discretionary Index, its composition is nothing but defensive as it is dominated by fast-food chains. Profitable and resilient: Despite the havoc wreaked by Covid, the restaurant industry has not stopped being profitable (Chart 2). With any new Covid variant scare, restaurants will just go back to their “drive-throughs” playbook. Over the course of 2021, restaurant spending has risen by more than 40%. We have a positive outlook for fast-food chains and are overweight the S&P Restaurant index. Feature This is the second part of the publication, in which we provide an in-depth overview of Hotels, Restaurants, and Airlines, or the “travel complex” as we dubbed it. These industries share many drivers of profitability as each provides in-person experiences. They are also highly dependent upon public sentiment regarding the potential dangers and likelihood of Covid infections. Further, consumer confidence and financial wellbeing are at the core of this group’s profitability, as the travel complex is a quintessential discretionary spending category. The recovery of the group was coming along quite well until the Delta variant derailed it in late summer, with reports pouring in about dining rooms closing, airline bookings flagging, and hotel occupancy dipping. What is next? In last week’s report, we provided an overview of the macroeconomic backdrop, the Delta variant trajectory, and a “deep dive” into the hotel industry. We concluded that the Hotels, Resorts, and Cruise Lines industry has significant potential to return to its former “glory”: Delta is cresting, financially healthy US consumers are choosing to spend their money on services and experiences, sell-side forecasts are pointing to surging sales, and hotels have substantial pricing power. The industry is a sound tactical and cyclical investment, and we recommend an overweight. This week we will continue with a deep dive into the Restaurant and Airline industries. Sneak Preview: We like restaurants (overweight) but airlines, not so much (underweight). Chart 1Airline Majors' Traffic Still Has Not Recovered To 2019 Level Chart 2Profitability Is Resilient To Downturns Airlines “To suggest that the airlines should have better prepared for this environment seems akin to suggesting Pompeii should have invested more heavily in firefighting technology.” (JP Morgan, Mar. 22, 2020) Having avoided bankruptcy in 2020 thanks to federal payout support, US passenger airlines recorded $4.3 billion more in pre-tax losses in the first half of 2021. Clearly, this industry’s woes are far from over. Unsurprisingly, airlines have had the worst performance of any industry in the travel complex, underperforming the S&P 500 by 5% over the past year (Chart 3 & Table 1). Importantly, the performance of the industry slumped at the end of the summer, triggered by the Delta variant scare: After several months of steady increases, new ticket sales have dipped. As we noted last week, several major airlines have warned in regulatory filings that their third quarter may not look as rosy as was hoped. American Airlines, Southwest Airlines, and United all noted a deceleration in near-term customer bookings in August and elevated trip cancellations, even in leisure.1 All three have suggested that the Delta variant is having a dampening effect on business. We believe that the Delta variant is cresting. Our base case is that herd immunity is not far off. Of course, the travel complex is vulnerable to any new virus scare (Table 2), and this is a risk that investors need to keep in mind. However, unlike hotels, airlines face multiple other challenges. Chart 3The S&P Airline Industry Index Is Still Under the Pre-pandemic Level Table 1PerformanceTable 2Airline Industry Composition Competitive Landscape The US airline industry generated total operating revenues of $92.7 billion in 2020, down 48.3% from $179.4 billion in 2019. The industry is dominated by five majors, that are included in the S&P 500 index). Macroeconomic Backdrop For Airlines The airline industry is highly cyclical, and its wellbeing is tightly tied to economic growth. As economic activity improves, business travel tends to increase (except when Covid-related restrictions change the normal course of things). As economic growth translates into higher wages and stronger employment gains, leisure travel also takes off. So does the transportation of goods. As we discussed in Part 1 of the report, the economy is currently in a slowdown stage of the business cycle: Growth is slowing but off high levels. As such, even in the absence of Covid-19 or the Delta variant, Airline sales would continue to grow but at a slow pace. US consumers are financially healthy, and while most of the stimulus money has been spent, more and more people are returning to work. Recently, consumer confidence has soured on the back of a resurgence in Covid infections and rising prices (Chart 4, panel 2). However, domestic airline tickets are still cheap, and only fear of infection is keeping Americans grounded. With Delta cresting, people will go back to flying. Chart 4Airlines Are Highly Cyclical Key Drivers Of Profitability: Revenue Vs Expenses Revenue While many industries have been hit hard by the pandemic (brick-and-mortar retail, hotels, restaurants) most have turned the corner and are now profitable. Airlines, however, are still struggling (Chart 5). The good news is that losses have been declining, but the bad news is that the financial situation of most airlines is still precarious. Airlines rely on diverse sources of revenue, and thanks to that, business is starting to recover. The following are the key streams: Fares charged to customers In-flight entertainment, food, and beverages Sales of frequent-flyer credits to hotels, auto rental agencies, credit card issuers Auxiliary charges: Baggage checks, choice of seat, extra leg room Cargo and mail Chart 5Airlines' Revenue Remain Chart 6Airline Majors' Traffic Still Has Not Recovered To 2019 Level Traffic Recovery: Domestic Travel Has Rebounded, While International And Corporate Travel Are Still Lagging Budget airlines are pandemic winners: As of October 2021 compared to October 2019, scheduled available seat miles are down for all the airlines in the S&P 500 index (AAL, LUV, DAL, UAL, and ALK) (Chart 6). Only the budget airlines such as Allegiant, Spirit, and Frontier have a scheduled number of flights above the 2019 watermark. The underlying reason for such a dichotomy is easy to explain. The successful rollout of Covid-19 vaccines in the US has unleashed material pent-up demand for domestic leisure travel, benefiting domestic budget airlines. US domestic seat miles and load factors have recovered to pre-pandemic levels (Chart 7) as consumers have eagerly spent their stimulus checks on travel within the US. Chart 7Domestic Load Factor Has Fallen Below Pre-Pandemic Levels Major airlines are bleeding cash due to high exposure to international and business travel segments: In the meantime, many government and company-imposed restrictions on international and business flights are still in place. Companies are taking a very cautious approach to office re-openings and employee travel, and Zoom has become embedded as a viable corporate communications alternative and a cost-saving tool. As a result, the airline traffic of the majors with high exposure to international (Chart 8) and business travel (Chart 9), is still below the pre-pandemic level. Some of that capacity is being redirected to domestic leisure travel, which has higher volume but is far less profitable. Chart 8In August 2021, US-International Air Travel* Fell 54% Below 2019 Levels Chart 9Since Mid-July, Growth Of Overall And Corporate Ticket Sales Has Slowed Corporate and international travel are the most lucrative revenue segments and are significant in size: Before the pandemic, business travel constituted 30% of all trips. The industry can hardly recover without these segments rebounding. Until that happens, companies will stay unprofitable, and cash burn will continue. Business travel is projected to recover in 2022 at best and 2024 at worst: The US Travel Association projects US business travel to return to the 2019 level in 2024. The Airlines for America Association (A4A) concurs. It projects that airline passenger volumes will return to the 2019 level in 2022 in the best-case scenario and in 2024 in the worst. Airline cargo is a saving grace: With passenger revenues still lagging 2019 levels, many airlines are focusing on the capacity of their cargo units. With global supply chains clogged and shipping costs increasing five-fold over the past few months, this is a profitable niche. Air cargo demand reached its all-time high in 2020 and continues to grow in 2021: US airlines posted a 20.5% increase in demand for international air cargo in July 2021 from the July 2019 actuals (Chart 10). Chart 10For US Airlines, Growth In Air Cargo Continues To Outpace Air Travel By A Large Margin Airlines Compete On Volume: Airfares Are Low Despite the inflationary environment, the price of airfares is still 18% below its 2019 level (-10% annualized), and that is after 7% YoY price increases in 2021 (Chart 11). These are price levels not seen since the 1990s. With all the spare capacity, former international and business travel is now competing to attract domestic leisure passengers. Making things worse, due to prior commitments, airlines continued to grow their fleets throughout the pandemic closures (Chart 12), further increasing capacity and exacerbating competition for passengers as business and international travel are likely to lag, making peak ticket prices and peak revenue elusive (Chart 13). There is also another matter to consider, which is hardly minor. Airline taxes and fees constitute about a quarter of the price of a ticket. According to an example put together by A4A, the base airline fare of $236 has $64 in multiple taxes and fees, making tickets less affordable. Chart 11Airfares Have Fallen by 10% A Year Since The Beginning Of The Pandemic Chart 12Capacity Continues To Increase Chart 13Airfares Are Down 18% From 2019 And 29% From 2014 Sales Growth Analysts expect airline sales growth to stabilize at 60% over the next 12 months. The base effect certainly plays a significant role, but this rate will help the industry to recover. Expenses Airlines have high fixed costs as they own or lease aircraft fleets. This creates a heavy financial burden during downturns, as costs can hardly be cut. Other expenses such as labor and fuel are also sticky. Price Of Jet Fuel Has Increased To Pre-pandemic Levels The cost of jet fuel is one of the most significant input costs for airlines, constituting anywhere between 10% and 30% of revenue (Chart 14). The price of fuel can make a significant difference for an airline’s razor-thin margins. Airlines therefore tend to hedge their fuel exposure. Jet-fuel prices have rebounded to their pre-pandemic level and are up 49% from January 2021 (Chart 14), no longer giving the airline any slack on the cost side. According to Zach Research, at United Airlines the average aircraft fuel price per gallon increased by 66.9% year-over-year to $1.97 in the June quarter. Owing to the uptick in air travel demand witnessed in the June quarter following increased vaccinations, fuel gallons consumed were up 206.4%. Chart 14Price Of Jet Fuel Has Increased To The Pre-pandemic Levels Chart 15Labor Costs Increased Again Labor Costs Are Fixed Due To The Unionized Work Force Labor is another significant line item on the expense side of the airline’s income statement. Normally labor costs constitute 30-40% of sales. During the darkest days of the lockdowns, labor expense soared to 60% of sales (Chart 15). With a highly unionized labor force, layoffs and furloughs require significant payouts. There are also many other conditions in the labor contract that must be met. As a result, as sales tanked, labor costs did not change in the same proportion. Even so, airlines reduced their workforce from 458,000 people in 2019 to 363,000 in November 2020 (Chart 15). Now, with sales growing again, airlines have started rehiring. However, with recent wage rises, new employees are more expensive. Profitability With revenue challenged by a less profitable trip mix, excess capacity, and rising fuel and labor costs, airlines have been losing money for over a year now (Chart 16). While the increase in leisure travel and cargo units is helping, it is hard to envision profitability without a return of international and business travel. With airline revenue down 27% YoY in August 2021, and costs on the rise, profitability is still a long way off (Chart 17). Chart 16Airlines Are Unprofitable… Chart 17…And Are Burning Cash Net Debt Airlines’ net debt has risen significantly since the pandemic, driven by their need to support fixed costs (Chart 18). The increase in net debt was also stimulated by large government support and a low interest-rate environment. The problem is that since airlines are unprofitable, and are burning cash, it is becoming harder and harder for them to meet their debt obligations (Chart 19). While there have not been any high-profile bankruptcies in the US, some European and Asian carriers, such as Norwegian Air and AirAsia Japan Co., had to file for bankruptcy protection. As airlines are expected to continue to burn cash through 2022 their credit ratings have been downgraded (Table 3). We would not be surprised if more bankruptcies or industry consolidations take place in the near term. Chart 18Debt Levels Have Increased Significantly Chart 19Airlines Have Difficulty With Interest Payments Table 3All Airlines Credit Ratings Have Been Downgraded When Will Airlines Thrive Again While revenue lags, the industry will remain vulnerable to shocks and cost headwinds. However, once international and business travel recovers, sales will pick up, and companies will generate positive cash flow. Cash generation is a necessary condition for financial recovery – once airlines arrest the cash burn, they can shift their efforts towards rebuilding profitability and, eventually, repairing their balance sheets. Valuations And Technicals Airlines are trading at 36x forward earnings, which is optically high. However, the Valuations Indicator suggests that airlines are not expensive relative to their own history (Chart 20). The industry is also modestly oversold (Chart 21). Chart 20Airline Are Not Expensive Relative To Own History… Chart 21…And Are Oversold Investment Implications Airlines are slowly recovering from a malaise induced by the pandemic lockdowns. However, the road to recovery will be long. While domestic leisure and cargo traffic has picked up, it will be another couple of years before international and business travel rebounds to the pre-pandemic levels. With fuel and labor costs on the rise, profitability is elusive without those segments. And, even when airlines return to profitability, it will take them years to repair their indebted balance sheets. What is worse, with current levels of debt burden and negative interest coverage, bankruptcies may not be out of the question for some. While airlines may rally with rates rising and cyclicals outperforming, we are negative on the industry on both a cyclical and structural basis. However, if any of our clients wish to trade this industry, there are several liquid ETFs that represent this space (Table 4). If investors chose to be granular and pick individual stocks in this space, they need to be aware of the individual challenges of each airline and their levels of indebtedness vs cash burn. In short, we have a negative outlook for airlines and are underweighting the industry. Table 4Airline ETFs Are Readily Available Restaurants: Defensive Cyclicals Industry Composition Although the S&P Restaurant Industry resides within the pro-cyclical S&P Consumer Discretionary Index, its composition is nothing but defensive. In fact, a more appropriate name would have been the S&P Fast-Food Industry, with MCD and SBUX accounting for 70%+ of the industry market cap (Table 5). Table 5Industry Composition Performance Restaurant Industry performance has been tracking the performance of the S&P 500, lagging the benchmark by only 8% since January 2020 (Chart 22) Chart 22Restaurant Performed Almost In Line With The S&P 500 Restaurants Are “Defensive Cyclicals” Since fast-food prices are generally low, fast-food restaurants tend to be what economists call “inferior” goods, i.e., goods whose sales rise when the economy is in a downward spiral. Restaurants tend to outperform in the slowdown stage of the business cycle (Chart 23), are flat during contraction, and underperform during expansions. Consistent with these expectations, fast-food restaurants also came out as winners of Covid lockdowns: Although sales initially dipped, they quickly recovered as fast-food chains reoriented their business toward drive-throughs and other forms of take-out (Chart 24). Chart 23Fast-Food Restaurants Are Defensive Chart 24Sales Growth Is Recovering Covid While the restaurant business was coming along quite well, concerns emerged at summer’s end that the Delta variant would further delay industry recovery. Chains like McDonald’s and Chick-fil-A announced that they are slowing their dining room re-openings. As data from restaurant analytics firm Black Box Intelligence demonstrates, sales that had grown steadily earlier this summer have fallen.2 We believe that the reaction to the Delta variant is transitory as new infections are cresting. And, in the worst-case scenario, fast-food restaurants in the index will just switch back to their Covid “drive-through playbook,” and will maintain their level of profitability. Restaurant Spending And Profitability Over the course of 2021, US retail sales releases reveal that restaurant spending rose by more than 40%, outpacing the headline number (13%) by a wide margin (Chart 25). While restaurant spending is likely to decelerate over the coming months as pent-up demand for services is satisfied, earnings will continue to improve. This is in line with analyst expectations (Chart 26). Chart 25Restaurant Sales Skyrocketed In 2021 Chart 26Earnings Will Continue to Grow But At A Slower Pace Despite the havoc wreaked by Covid, the restaurant industry has not stopped being profitable, and although margins dipped in the midst of the lockdown, they swiftly rebounded. The 83% YoY print in restaurants FCF is nearly an all-time high reading since the history of the data going back to the 1990s (Chart 27). Debt Is Low Net debt to total assets also echoes the upbeat message highlighting that US dining stocks remain in good financial health (Chart 28). Chart 27Free Cash Flow Is At All-Time High Chart 28Debt Is Low Valuations And Technicals Valuations are not demanding while technicals suggest that the industry is oversold (Chart 29). Chart 29Restaurants Are Oversold & Undervalued Investment Implications The current slowdown stage of the business cycle is favorable for the fast-food industry. This industry is profitable and resilient in downturns. It is also attractively valued. The industry is oversold, which represents a favorable entry point for an overweight position. In short, fast-food restaurants are a sound “cyclical defensive”: They are resilient to downturns, highly profitable, and have healthy balance sheets. We have a positive outlook on the industry and are overweight. A Quick Aside: Toast IPO Before we conclude, a brief note on the new Toast (TOST) IPO is in order. While the stock became public only last week and is not a part of the S&P 500, it is an important newcomer to the stock market. The company is a market leader in cloud-based restaurant management software. Toast’s performance is tied to the health of the overall US restaurant industry. Many of the popular restaurants and fast-food chains are among Toast’s clients. Bottom Line We have a negative outlook for Airlines: This highly cyclical industry is on a long-winding path towards recovery, profitability, and deleveraging. Airlines face multiple challenges and headwinds: Fuel and labor costs are rising, while their most profitable revenue segments, international and business travel, are missing in action. Cash burn is still acute, and profitability is elusive despite all the progress made. We are much more positive on the outlook for the Restaurant Index, which represents some of the largest fast-food chains in the nation. This industry thrives during economic slowdown, is resilient to shocks, and is highly profitable. Irene Tunkel Chief Strategist, US Equity Strategy irene.tunkel@bcaresearch.com Footnotes 1 Travel Investors Need More Drive, WSJ, Sep 12, 2021 2 Restaurants Close Dining Rooms Again as Delta-Driven Infections Spread, WSJ, Sep 13, 2021. Recommended Allocation

BCA Research’s US Equity Strategy service recommends overweighting the Hotels, Resorts, and Cruise Lines industry. The team summarizes this view as follows: The Delta variant is cresting. Their base case is that herd immunity is not far off. Of…
Highlights Covid-19 has wreaked havoc in the markets, but the Hotels, Restaurants & Leisure, and Airline industries have been most affected. These industries constitute what we call the “travel complex” as they share common drivers of profitability: First, they have been significantly affected by restrictions imposed on individuals and businesses in response to Covid-19 and, second, they rely on discretionary spending. Recovery of the group was proceeding swimmingly until the Delta variant derailed it in late summer, with reports pouring in about dining rooms closing, airline bookings flagging, and hotel occupancy dipping. What is next? The Delta variant is cresting. Our base case is that herd immunity is not far off. Of course, the travel complex is vulnerable to any new virus scare, and this is a risk investors need to keep in mind. Rising rates will be a mild tailwind for the group, as it tends to outperform in that regime. But this is not a key driver of its performance. Consumer confidence and financial wellbeing are at the core of this group’s profitability. So far, Americans still have money to spare and generally prefer to spend it on services. It is disconcerting that the Consumer Confidence Indicator has turned, but we are not too alarmed just yet: Jobs are still plentiful, and Americans are going back to work. August retail sales surprised on the upside. In Part 1 of the report this week, we take a deep dive into the Hotel, Resort, and Cruise Lines industry. We find the industry attractive for the following reasons: Hotel occupancy has increased, and the amount of money consumers are prepared to spend in hotel stays has surged. Sales are expected to increase by 75%, albeit from low levels, over the next 12 months. Hotels have also discovered many new sources of revenue. Earnings growth is impossible to estimate since last year the industry was losing money; however, margins have just turned positive. Companies also have significant pricing power to pass on expenses to their guests, and have the ability to mend their margins, eventually going back to the historical 20%. Lastly, the industry is cheap relative to its own history on a forward PE basis. According to our Technical Indicator, it is also oversold. The Hotels, Resorts, and Cruise Lines industry has a significant potential to return to its former “glory”, and we believe that it is a sound tactical and cyclical investment. We recommend overweighing this industry. NB: Please stay tuned for Part 2 of the report, on Restaurants and Airlines, next week. Feature Part 1: Hotels, Resorts And Cruise Lines In this two-part publication, we will provide an in-depth overview of Hotels, Restaurants, and Airlines. These industries constitute what we call the “travel complex” as they share many common drivers of profitability: First, they are the industries most exposed to Covid-related fears as well as corresponding government health directives, and, second, they rely on the discretionary spending of both consumers and businesses. In this publication, we will examine the macroeconomic backdrop for the entire travel complex, and then zoom into the Hotels, Resorts, and Cruise Lines industry (“Hotels”). Next week, we will provide an in-depth overview of Restaurants and Airlines. Sneak preview: We are bullish on Hotels and are overweight this industry in our portfolio. Hotels, Restaurant And Leisure, Along With Airlines, Were The Poster Child For Post-Covid Recovery… Covid-19 has wreaked havoc in the markets, but the travel complex was most affected. Airlines, hotels, and restaurants have suffered tremendous losses, and all have required government bailouts either directly, or indirectly through the Paycheck Protection Program (PPP). The travel complex rebounded mightily as the vaccine became widely available in February, and Americans suffering from cabin fever boarded planes, traveled, and ate out (Chart 1). Chart 1Hotels And Airlines Are Still Trading Below Their Pre-Covid Levels Table 1Travel Complex Is Lagging S&P 500 …Everything Changed This Summer All these positive developments began to reverse over the summer as Delta made its appearance in the US, and even the vaccinated succumbed to fears of infection. Airlines were one of the worst performers in the index. Hotels and restaurants were doing better, but their performance did not shoot the lights out either (Table 1). Restaurants: According to a National Restaurant Association survey of 1,000 adults, in recent weeks nearly one in five Americans say they are no longer going out to restaurants, 9% have canceled existing plans to eat out, and 37% of adults said they ordered delivery or takeout instead of dining in a restaurant. Chains like McDonald’s and Chick-fil-A are slowing their dining room reopenings. As data from restaurant analytics firm Black Box Intelligence demonstrate, sales that had grown steadily earlier this summer have fallen.1 Airlines: Several major airlines have warned in regulatory filings that their third quarter may not look as rosy as hoped. United Airlines has noted a deceleration in customer bookings, while Southwest Airlines reported a continued softness in bookings—even in leisure—and elevated trip cancelations. Similarly, American Airlines has said that, after a strong July, it saw a softness in near-term bookings in August and an increase in near-term cancelations. All three have suggested that the Delta variant is having a dampening effect on business.2 Hotels: Marriott International said that revenue per available room in August of 2021 was down 27% from the 2019 level – a drop from the 23% decline seen in July. However, the CEO of the company sounded sanguine: “The trends seem to be stabilizing as we get into the early days of September”. Most of the decline came from lockdowns in China. The most recent data shows revenue per available room was down 44 percent off 2019 levels — not ideal but an improvement from the 57 percent decline seen a week prior.3 With bad news abundant, the natural question is whether these industries are still a good tactical and cyclical investment. Delta Variant Clearly, a resurgence in infections has had an adverse effect on the travel complex. However, there are early signs that the Covid-19 Delta variant is cresting (Chart 2). Around 75% of the U.S. population has had at least one vaccine shot. Globally, 31.5 million doses/day are being administered. At this rate, it will take just eight months to vaccinate 75% of the global population. Herd immunity is not far off. Our base case is that Covid-19 and its multiple variants are unlikely to disappear, but consumers and businesses are learning how to live with it. We believe that the surge of Delta infections will subside over the fall, and the entire travel complex will continue to recuperate from the Covid-inflicted damage. Of course, the resurgence of Covid-19 cases and newer variants could undermine a recovery. This is a risk investors need to monitor. Chart 2The Covid-19 Delta Variant Is Cresting Macroeconomic Backdrop Rising Rates Are A Tailwind For The Travel Complex Direction and rate of change in yields dictate which US equity sectors and industries will do well. There are many crosscurrents in both economic data and Fed speak currently that obscure the answer to this question. Analysis of the performance of travel industries by rates regime suggests that all of them tend to do better when rates are rising, as higher rates indicate stronger economic growth (Chart 3). Airlines are most sensitive to an economic slowdown and will underperform most if rates stay “lower for longer”. Consumers Still Have Money To Spend On Services But Less Than Before Chart 3Travel Outperforms When Rates Are Rising Travel is a quintessential representation of discretionary spending on services. Consumers travel and eat out when they are confident about the future and have a healthy income and excess savings. Chart 4Disposable Income And Savings Are Returning To Trend The helicopter money drop has increased consumer income and padded their savings. However, income gains were not permanent and, recently, disposable income has returned to trend (Chart 4, Panel 1). Further, much of the excess savings has been spent (Chart 4, Panel 2). In another unpleasant twist, over the past few months, wage gains (4.8%) have lagged price increases (5.2%), reducing the purchasing power of American consumers. In response to these developments, the consumer mood has soured: The Consumer Confidence Indicator has slumped to a six-month low of 114 from 125 a month earlier. The next 12-month inflation expectations have surged to 6.5%. While it is disconcerting that consumer confidence has turned, we are not too alarmed just yet: Jobs are still plentiful, and Americans are likely to go back to work as the majority of children are now attending schools in person. In short, Americans are not destitute, but the pattern of spending is normalizing and returning to the pre-pandemic trend. The August retail sales print at 0.7% surprised on the upside and proves that US consumers have not tightened their belts. It is also a positive for the travel complex that demand for services exceeds demand for goods: Consumer expenditure on goods is above trend and has recently turned, while spending on services is below pre-pandemic levels, and the rebound is running its course (Chart 5). Inflation Is Not A Concern For The Travel Complex CPI readings for the travel complex this summer looked outright scary: In July, airfares were up 19% YoY and the price of hotel stays was up 24% YoY. These numbers have come down to 6.7% and 19.6% in August. Indeed, these readings make us wonder whether travel is still affordable to consumers. The answer is a resounding “yes” – reported surges in prices are a function of a base effect and, compared to the same time two years ago, the two-year CAGR of prices looks reasonable for all the industries (Chart 6). Chart 6Price Increases For The Travel Complex Are Moderate Chart 5Real Spending On Services Is At Pre-Pandemic Levels: Room For Further Rebound Analysis By Industry: Hotels, Resorts, And Cruise Lines Hotels is a $55B industry4 which is forecast to produce 31.4% growth in 2021 (Table 2). Its market cap is $239Bn and it constitutes 0.6% of the S&P 500 index. The US Hotel industry suffered about $125 billion5 in aggregate lost revenues due to the pandemic in 2020. Hotel operators were in total cash-conservation mode – slashing capex budgets by 75%, suspending dividends, and raising capital. Some 670,000 workers lost their jobs or were furloughed – only half of these workers have returned so far (Chart 7). Table 2Hotels (GICS 4) Constituents After a tough year, Hotels have now mostly reopened. Demand is expected to surge by 31.4% YoY in 2021, and per room revenue has reached $94, higher than the pre-Covid-19 level. Many hotels have returned to profitability. However, hotel occupancy in the US is yet to return to the pre-pandemic level: It currently stands at around 50% compared to 70% plus pre-Covid (Chart 8). Chart 7Industry Was Decimated By Covid And Is Recovering Slowly Chart 8Occupancy Rates Are Returning Back To Normal Sources Of Revenue Hotels started to recover during the first half of 2021 and revenues are expected to continue to surge to well above the pre-pandemic level in 2022. Analysts expect hotel sales to rebound by 75% over the next 12 months (Chart 9). There are multiple sources of revenue, and a reduction in business travel and international tourism is likely to be replaced by other creative options. Leisure Travel: Significant pent-up demand has been driving a recovery in hotel stays, but it is mostly in leisure travel. According to AHLA, 56% of consumers say they expect to travel for leisure, roughly the same amount as in an average year. Consumer spending on hotels has rebounded and is close to the pre-pandemic normal (Chart 10). Chart 9Blockbuster Sales Growth Is Expected (Off Low Base) Chart 10Consumers Eagerly Spend On Hotels Business travel is still lagging. According to AHLA, business travel was down by 85% compared to 2019 through April 2021, and since then has only begun ticking up slightly. However, going forward, this trend may turn as companies start positioning their in-person visits as a competitive advantage. Bleisure travel: A new post-Covid trend has developed: Workers combine business travel with leisure, prolonging hotel stays. Another creative idea is “working from a hotel” packages to appeal to remote workers tired of being cooped up at home. International tourism: Covid-related restrictions in the rest of the world, and especially cessation of travel from China, is still denting hotel revenue. With global vaccination rates improving by the day, this segment won’t take long to rebound. Profitability While there is forecast to be a pronounced rebound in hotel sales growth over the next 12 months, it is less obvious whether and when the industry will return to its former levels of profitability (Chart 11). After all, not only was the travel complex damaged by the pandemic, but now hotel operators also incur additional Covid-related cleaning expenses. Currently, analysts expect the next 12 months EPS to rebound to about a quarter of January 2020 trailing EPS ($10 vs $34). While this looks measly, from an investment standpoint it presents an opportunity as eventually, albeit slowly, earnings will return to trend. Historical earnings growth is not calculable as the industry was losing money until very recently. Chart 11Earnings Are Expected To Grow Again Margins And Pricing Power Margins crossed the zero threshold in Q2-2021, but are still almost 20 percentage points below the long-term average (Chart 12). While hotel costs have increased with the pandemic, this industry has significant pricing power to pass on its costs to consumers (Chart 13). Chart 12The Hotel Industry Has Returned To Profitability Chart 13Hotels Have Significant Pricing Power And Can Pass Extra Costs To Guests Valuations And Technicals The Hotels industry is trading at 30x forward PE and on a 5-year normalized basis, it is trading with a discount to the S&P 500, which is unusual (Chart 14). In terms of our Technical Indicator, the industry is somewhat oversold, and now looks more attractive than it did earlier this year (Chart 15). Chart 14Hotels Are Trading With A Discount To S&P 500 Which Is Unusual Chart 15Hotels Are Slightly Oversold Cruise Lines Cruise Lines were the worst-hit and the slowest to recover among the sub-industries, but they are expected to make a comeback in 2022 with a significant surge in revenue growth. Most of the drivers for these companies are similar to Hotels and Resorts – but recovery is delayed due to restrictions that kept cruise ships anchored much longer than initially expected. Investment Implications We stay with our overweight in Hotels, Resorts, and Cruise Lines. We will summarize the reasons: The Delta variant is cresting. Our base case is that herd immunity is not far off. Of course, the industry is also vulnerable to any new virus scare, and this is a risk that investors need to keep in mind. Rising rates will be a mild tailwind for the industry, as it tends to outperform in that regime. But this is not a key driver of its performance. Consumer confidence and financial wellbeing are at the core of Hotel profitability. So far, Americans still have money to spare and prefer to spend it on services. It is disconcerting that the Consumer Confidence Indicator has turned, but we are not too alarmed just yet: Jobs are still plentiful, and Americans are going back to work. Hotel occupancy has increased, and the amount of money consumers are prepared to spend on hotel stays has surged. Sales are expected to increase by 75%, albeit from lower levels, over the next 12 months. Hotels have also discovered many new sources of revenue. Historical earnings growth is not available as until recently the industry was losing money; however, margins have just turned positive. Companies also have the significant pricing power to pass on expenses to their guests and have the ability to mend their margins, eventually going back to the historical 20%. Lastly, the industry is cheap relative to its own history on a forward PE basis. According to our Technical indicator, it is also oversold. The Hotels, Resorts, and Cruise Lines industry has significant potential to return to its former “glory”, and we believe that it is a sound tactical and cyclical investment. We recommend overweighing this industry. Bottom Line The Hotels, Resorts, and Cruise Lines industry has been severely damaged by the pandemic, and the road to recovery may be long. It is also vulnerable to any new virus scare. However, with Delta cresting, financially healthy US consumers choosing to spend their money on services and experiences, sell-side forecasts pointing to surging sales, and companies possessing substantial pricing power mean that we are bullish on the industry. Irene Tunkel Chief Strategist, US Equity Strategy irene.tunkel@bcaresearch.com Footnotes 1 Restaurants Close Dining Rooms Again as Delta-Driven Infections Spread, WSJ, September 13, 2021. 2 Travel Investors Need More Drive, WSJ, September 12, 2021. 3 Hotel Industry News: Marriott CEO Sees Hotels Bouncing Back Quickly After Delta Variant Slump, Skift, September 9, 2021. 4 IBISWorld, August 23, 2021. 5 Oxford Economics. Recommended Allocation
Neutral As reopening of the economy will, at the margin, bring back diners (take out mostly) to restaurants, the two heavyweights that comprise 80% of the market cap of the S&P restaurants group are anything but discretionary. In our view, MCD is defensive and SBUX has become a staple. Thus, as the economy slowly reopens and store traffic picks up, these bellwether stocks will lead this index higher. With regard to macro data, most of the restaurant-relevant releases are looking in the rear view mirror. In other words, the trouncing in restaurant retail sales and employment, food-away-from-home PCE and even the collapse in the Restaurant Performance Index were “known knowns”. Therefore, all of this grim news is already reflected in the 30% drubbing in relative performance from peak-to-trough (see chart). Bottom Line: Lift the S&P restaurants index to neutral from previously underweight, and please see this Monday’s report for additional details.
Highlights Portfolio Strategy The Fed’s unorthodox monetary policy is aimed at quashing volatility, lifting asset prices and debasing the currency, all of which are equity market bullish. Grim, but backward looking, macro data are already reflected in the significant restaurant relative share price correction. Upgrade to neutral. Book profits in the underweight S&P rails portfolio position and lift exposure to neutral on the back of: a.) already reflected grim ISM services data, b.) resilient industry pricing power, c.) firming railroad profit margin backdrop and d.) encouraging signs from our EPS growth model. Recent Changes Augment the S&P restaurants index to neutral, today. Upgrade the S&P railroads index to a benchmark allocation, today. Table 1 Feature The SPX made a fresh run to recovery highs last week, cheering forward looking news of reopening of the economy and neglecting backward looking downbeat employment and PMI releases. Extremely easy fiscal and monetary policies remain the dominant macro themes, and underpin our sanguine equity market view for the coming 9-12 months. While Bill Martin’s infamous 1955 portrayal of the Fed as “the chaperone who ordered the punch bowl removed just when the party was really warming up”,1 the Jay Powell led Fed has done the opposite, and rightly so: it has ordered and delivered a bottomless punchbowl. The Fed’s unorthodox monetary policy is aimed at quashing volatility (Chart 1), lifting asset prices and debasing the currency, all of which are equity market bullish. According to Leo Krippner’s shadow short rates (SSR) estimate, the shadow fed funds rate is negative and should continue to support the SPX (SSR shown inverted, Chart 2). Chart 1Vol Will Melt Chart 2Crumbling Shadow Rates Underpin The SPX… In fact, there are two distinct avenues that declining interest rates underpin equities: First, falling interest rates are a boon to equities via a rising price-to-earnings multiple (SSR shown inverted, Chart 3). While the 12-month forward multiple is above a 20 handle, the highest point since the dotcom bubble era, using second and third fiscal year sell-side profit estimates – which better resemble trend EPS – results in a more tame forward P/E multiple with more upside (Chart 4). Second, while the Fed would never admit to it, it is trying to devalue the US dollar and reflate the global economy, which will indirectly boost S&P 500 revenues. As a reminder, 40% of SPX sales are internationally sourced and thus a falling greenback is a boon to S&P 500 turnover (bottom panel, Chart 5). Chart 3…Via Higher Valuations Keep in mind that most of global trade is conducted in USD and when trade collapses it creates a US dollar shortage (i.e. fewer US dollars are circulating around) that lifts the value of the reserve currency and vice versa. Cognizant of that, the Fed is trying to provide ample US dollar liquidity and aid in pushing the greenback lower (top panel, Chart 5). Chart 4Peer Across The EPS Valley, And Valuations Have Room To Rise Chart 5Depreciating USD Is A Boon For SPX Sales Drilling beneath the SPX’s surface, early-cyclical consumer discretionary equities are the primary beneficiaries of negative SSR. The top panel of Chart 6 shows that over the past three decades relative share prices are the mirror image of interest rates. This cycle, household finances are in order and coupled with generationally low interest rates signal that consumer spending will recover smartly as the economy opens up in coming quarters. Thus, consumer discretionary stocks should sustain their outperformance (middle & bottom panels, Chart 6). A small digression with regard to the reopening of the economy is in order. Pundits have been discussing and showing the three distinct waves of the Spanish flu as the closest parallel with the current pandemic. Chart 7 shows these three waves using UK data, but the UK equity market (and the DOW for that matter) did not really budge back then. Keep in mind this was in the midst of a recession as the Great War was about to end on November 11, 1918 (Remembrance Day). Chart 6Stick With Consumer Discretionary Exposure Chart 7The 1918 UK Parallel, Including Equities While no one really knows how in the long-term this pandemic will affect the economy, the stock market, society in general and consumer behavior in particular, our sense is that uncertainty will continue to recede in the coming months irrespective of the second and third likely waves. Why? Because not only do governments know more about this invisible enemy, but they (and hospitals) will also be more prepared to deal with any future outbreaks. Moreover, given that there is a race to get a novel coronavirus vaccine (and treatment) the world over, a breakthrough will soon materialize; MRNA’s recent FDA phase II clinical trial for their vaccine candidate is a case in point. Receding uncertainty is great news for stock investors. Meanwhile, in recent research we highlighted that early-cyclical interest rate-sensitive equities do in fact lead the GICS1 sector pack in recessionary recoveries based on empirical evidence.2 As a reminder, in mid-April we lifted the S&P consumer discretionary sector to overweight and this week we are updating our views on a hard hit subindex. We are also upgrading a deep cyclical services industry to neutral. Preparing To Dine Out It no longer pays to be underweight the S&P restaurants index; upgrade to neutral today. Not only the reopening of the economy will, at the margin, bring back diners (take out mostly) to restaurants, but the two heavyweights that comprise 80% of the market cap of the S&P restaurants group are anything but discretionary. In our view, MCD is defensive and SBUX has become a staple. Thus, as the economy slowly reopens and store traffic picks up, these bellwether stocks will lead this index higher. Relative share prices have corrected to the twenty-year uptrend line and hover near the previous two breakout points in 2011/12 and 2015/16 where they should find enough support (top panel, Chart 8). With regard to macro data, most of the restaurant-relevant releases are looking in the rear view mirror. In other words, the trouncing in restaurant retail sales and employment, food-away-from-home PCE and even the collapse in the Restaurant Performance Index were “known knowns” (Chart 8). Therefore, all of this grim news is already reflected in the 30% drubbing in relative performance from peak-to-trough. Chart 8Grim Data Priced In Chart 9Dollar The Reflator Domestic restaurant sales should stabilize in the coming months. If the Fed manages to devalue the US dollar (please see discussion above), then even international revenues in general and Chinese sourced sales in particular will rekindle overall industry turnover (Chart 9). Keep in mind that China’s economy reopening is leading the global economy by about six weeks. Importantly, construction spending on restaurants is falling like a stone and this decline in supply and industry capex will provide a much needed offset to free cash flow generation (middle panel, Chart 10). Nevertheless, three key concerns keep us at bay and prevent us from turning outright bullish. First, net debt-to-EBITDA has taken a steep turn for the worst of late, and while it is mostly driven by the shortfall in cash flow, it is still quite unnerving (bottom panel, Chart 11). Second, there is margin trouble that restauranteurs have yet to work out, and a rising wage bill will continue to weigh on profit growth (second panel, Chart 11). Finally, relative valuations are lofty for our liking. On a 12-month forward P/E basis the S&P restaurants index is trading at 53% premium to the SPX and 26% above the historical mean (third panel, Chart 11). Chart 10Supply Restraint Is Positive Chart 11Watch These Risks Netting it all out, grim but backward looking macro data are already reflected in the significant restaurant relative share price correction. Lift exposure to a benchmark allocation. Bottom Line: Lift the S&P restaurants index to neutral for a relative loss of 13.7% since inception. The ticker symbols for the stocks in this index are: BLBG: S5REST – MCD, SBUX, YUMB, CMG, DRI. Upgrade Rails To Neutral Over the past three years we have been mostly on the right side of rails both in bull and bear phases; today we recommend cementing relative gains of 6.4% since inception, and lifting exposure to neutral. Rails are the largest transports subgroup and this services industry is showcasing impressive resilience in times of adversity. True, the latest ISM non-manufacturing survey made for grim reading. Both the headline number and most of the key subcomponents of the survey were tough to digest: the overall survey fell near the GFC lows (bottom panel, Chart 12), the Business Activity Index collapsed to 26%, an all-time low. While this survey can fall anew next month, we deem that extreme pessimism reigns supreme, and as the US economy is slated to reopen some semblance of normality will return in coming months. Tack on the improving export data out of China, and we are cautiously optimistic that rail hauling services will soon stage a comeback (middle panel, Chart 12). Chart 12As Bad As It Gets Chart 13Green Shoots The defensive nature of rails is most evident in industry pricing power (third panel, Chart 13). Railroad selling prices are holding their own despite a sizable drop in volumes. Moreover, CEOs exercised caution and refrained from adding to headcount. Taken together, they are boosting our profit margin proxy, which can serve as a catalyst to lift relative share price momentum out of its recent funk (second panel, Chart 13). Similarly, our 3 factor S&P rail EPS growth model is heralding a pickup in profits in the back half of the year (bottom panel, Chart 13). Despite all these tailwinds, there are some powerful offsets that tame our optimism on railroards. Intermodal rail shipments are a major freight category and thus a key determinant of rail profitability. As consumer confidence remains in freefall, downbeat retail sales will cast a dark shadow on this essential rail freight category (Chart 14). Finally, the industry’s rising debt profile is still a primary concern. Rail executives neglected capex in recent years and instead raised debt in order to retire equity and enhance shareholder value. We continue to view this “investment” backdrop with skepticism and prior to further augmenting exposure to an overweight stance we would want to see an easing on the debt uptake directed at these shareholder friendly activities (Chart 15). Chart 14The Consumer Is A Sore Spot Chart 15Debt Burden Flashing Red In sum, we are compelled to take profits in our underweight S&P rails portfolio position and lift exposure to neutral on the back of: a.) already reflected grim ISM services data, b.) resilient industry pricing power, c.) firming railroad profit margin backdrop and d.) encouraging signs from our EPS growth model. Bottom Line: Lift the S&P railroads index to a benchmark allocation today booking a profit of 6.4% since inception. The ticker symbols for the stocks in this index are: BLBG: S5RAIL – UNP, NSC, CSX, KSU. Anastasios Avgeriou US Equity Strategist anastasios@bcaresearch.com Footnotes 1 https://fraser.stlouisfed.org/title/statements-speeches-william-mcchesney-martin-jr-448/address-new-york-group-investment-bankers-association-america-7800 2 Please see BCA US Equity Strategy Weekly Report, “Fight Central Banks At Your Own Peril” dated April 14, 2020, available at uses.bcaresearch.com. Current Recommendations Current Trades Strategic (10-Year) Trade Recommendations Size And Style Views June 3, 2019 Stay neutral cyclicals over defensives (downgrade alert) January 22, 2018 Favor value over growth April 28, 2020 Stay neutral large over small caps June 11, 2018 Long the BCA Millennial basket The ticker symbols are: (AAPL, AMZN, UBER, HD, LEN, MSFT, NFLX, SPOT, TSLA, V).
Underweight The S&P restaurants index is often mistakenly used as an early cyclical vehicle to express the “vibrant consumer” theme. However, the name of the index is deceiving as MCD and SBUX comprise ~80% of the index’s market cap. Such a heavy tilt toward low-cost dining gives the index its defensive properties; up to very recently the relative share price ratio had been joined at the hip with our defensive sector gauge (top panel, on the next page). We remain underweight the S&P restaurants index and expect that the recent steep divergence with safe haven stocks will narrow via a “catch down” phase in the former. Forward looking profit fundamentals also corroborate that relative share prices have run way ahead of themselves. Real dining PCE is falling like a stone, and has historically been an excellent leading indicator of relative share prices, warning that restaurant stocks are vulnerable to a sizable pullback (PCE shown advanced, middle panel, on the next page). Further, the restaurant performance index is sending a similar message that the relative share price ratio’s path of least resistance remains to the downside (third panel, on the next page). Bottom Line: We remain underweight the S&P restaurants index. The ticker symbols for the stocks in this index are: BLBG: S5REST - MCD, SBUX, YUM, DRI, CMG.
Underweight The S&P restaurants index has had an exceptional month, following surprisingly healthy results from both McDonalds and Starbucks, which collectively represent approximately 80% of the index. We think the move is short-sighted and we would be sellers into the strength. The positive results at these restauranteurs would typically be reflected in outsized forward earnings growth estimates. However, this is not the case; as shown in the second panel, estimates for the S&P restaurants index are falling behind the broad market. Given the index’s rise without a corresponding earnings lift, the valuation multiple has soared and is now at a level 50% higher than the market (third panel). Meanwhile, the index has been dining out on an unhealthy diet of debt and balance sheets are stretched to extreme levels (bottom panel). In the absence of an unlikely surge of cash flow, particularly given the headwinds an appreciating U.S. dollar represents, a painful cycle of belt-tightening lies ahead. Bottom Line: Tepid earnings growth, high valuations and bulging leverage are a recipe for stock price declines in the S&P restaurants index; stay underweight. The ticker symbols for the stocks in this index are: BLBG: S5REST - MCD, SBUX, YUM, DRI, CMG.
Highlights Portfolio Strategy Selling in the S&P cable & satellite index is overdone. Recession type valuations fully reflect the acquirer discount heavyweight CMCSA is still commanding. Lift exposure to neutral. Content providers' assets are highly coveted, and these firms remain in play as media is undergoing a tectonic shift. The industry's demand backdrop is also on the rise, signaling that it no longer pays to underweight the S&P movies & entertainment index. Increasing construction expenditures, ballooning balance sheets, soft relative selling prices and a rising U.S. dollar all suggest that restaurant profits will underwhelm. Downgrade to underweight. Recent Changes Raise the S&P cable & satellite index to neutral today. Lift the S&P movies & entertainment index to a benchmark allocation today. Act on the downgrade alert and trim the S&P restaurants index to underweight today. Table 1 Feature Geopolitical risks held equities hostage last week as President Trump toughened his tariff rhetoric toward China. While the risk of a global trade spat remains acute, the market is becoming desensitized to daily trade-related headlines and remains resilient. Given the plethora of political risks and upcoming midterm elections, I look forward to hearing Greg Valliere's keynote speech in BCA's Toronto Investment Conference on September 24-25. Importantly, last week rising protectionism along with "Three Policy Puts Going Kaput" compelled BCA's Global Investment Strategy service to turn more cautious toward global risk assets over its 6 to 12 month cyclical horizon, prompting them to downgrade global equities from overweight to a neutral stance.1 We have sympathy for this view and acknowledge that the risks to our still sanguine U.S. equity market view, which we have been flagging in recent publications, have increased a notch. We are especially worried about the greenback's appreciation and increasing potential to infiltrate SPX EPS in calendar 2019 (please see Chart 2 and Chart 4 from the June 4th Weekly Report). Given that technology has the highest foreign sales exposure (58% of total sales) among GICS1 sectors, and a 26% market cap weight, we are closely monitoring leading indicators for tech profits. Indeed, for calendar 2019 the S&P tech sector's contribution to S&P 500 profit growth is the highest at 21%, with financials right on its tail at 20% (Chart 1). Energy sector EPS base effects are filtered out in 2019, but industrials, that have a 37% foreign sales exposure and are at the epicenter of President Trump's tariff rhetoric, also explain 13% of SPX EPS growth in calendar 2019 (Chart 1). Chart 1Contribution To S&P 500 2019 EPS Growth In fact, over a structural (2-3 year) time horizon we are aligned with BCA's more bearish equity outlook. We have been advocating this longer term thesis in our travels visiting BCA clients (please download our latest marketing slide deck here that highlights our bearish secular equity market view). Importantly, the three signposts we are monitoring to help us time the end of the business cycle, and thus equity bull market, are: a yield curve inversion (leading indicator), doubling in year-over-year oil prices based on monthly dataset (coincident indicator) and a mega-merger announcement either in tech or biotech space (confirming anecdotal indicator). There are currently no ticks in any of these three boxes, and we conclude that the S&P 500 has yet to peak for the cycle (Chart 2). Crucially, the Fed is inflating a massive bubble by staying too easy for too long. It is rather obvious to us that the U.S. economy is firing on all cylinders with real non-residential investment growing near 10% in Q1, but the real fed funds rate is still near the zero line (Chart 3). In addition, recent Fed minutes signaled that the Fed is willing to take some inflation risk, which will further push equity markets into steeper disequilibrium. It would be unprecedented for the cycle to end with the real fed funds rate glued to zero (Chart 3). Chart 2Recession Indicators Chart 3Real Fed Funds Rate Is Still Zero! Moreover, the U.S. economy just received a two year fiscal stimulus injection which is rare in both duration and magnitude during the late stages of the expansion and thus inherently inflationary. Worrisomely, the last time this happened was in the mid-to-late 1960s that led to the inflationary 1970s (please see Chart 1 and Table 2 from our October 9th "Can Easy Fiscal Offset Tighter Monetary Policy?" Weekly Report). Tack on the starting point of a World War-like debt-to-GDP ratio and the only regulatory mechanism for government profligacy is the bond market (Chart 4). Chart 4Interest Rates Have Nowhere To Go But Up Another way to make the debt arithmetic work is if one believes the White House's real GDP projections of 3%+ as far as the eye can see, which stand in marked contrast to the IMF's, the CBO's and the Fed's own projections (Chart 5). Therefore, the path of least resistance for interest rates is higher as a way to slow down the economy and also rein in debt excesses. Typically, this overheating late in the cycle is synonymous with a blow off phase in equities (Chart 6), before the bottom falls out. Chart 5Don't Believe The White House Chart 6Blow Off Phase In sum, while BCA downgraded global equities to neutral last week on a cyclical time horizon, we are deviating from the BCA House View and still believe that the S&P 500 will make new all-time highs in absolute terms before the next recession hits. This week we are making a few subsurface changes to the S&P consumer discretionary sector, but we maintain an underweight allocation to this interest rate-sensitive sector. New Media Landscape: (Pipelines Vs. Content Providers) Vs. Netflix At last count Netflix broke into the top 25 largest companies (market cap based) in the S&P 500, and if it keeps up its frenetic pace it is on track to surpass Boeing. While legacy media giants had a chance to scoop up Netflix in the past few years, its current stratospheric valuation makes it uneconomical and nonsensical. Instead, the specter of Netflix, as well as other tech giants circling the space, has accelerated an inter- and intra-industry consolidation (bottom panel, Chart 7). Why? Because Netflix not only went straight to the consumer on a new medium, the internet, and sped up cord cutting, but also blurred industry lines by becoming a content provider producing its own original content in addition to offering third party content. The media landscape is thus still trying to adjust to the Netflix induced "creative destruction" and media executives are scrambling to compete with/protect legacy franchises from Netflix. The recently cleared AT&T/Time Warner merger has intensified the bidding war of remaining crown jewel assets in the legacy content media world. We were well positioned for this shake up in the space as we went underweight the media complex in early March.2 But now, we deem that the easy money has been made and most of the negative narrative is reflected in bombed out relative valuations despite depressed relative profit and sales growth estimates (second & third panels, Chart 7). As a result we recommend lifting exposure back to benchmark in the broad S&P media index. Beyond these industry related intricacies, the macro backdrop is starting to turn in favor of media outfits, warning that it no longer pays to be bearish. Chart 8 shows that relative consumer outlays on media have spiked recently. The implication is that industry revenue growth has more upside. BCA's ad spending indicator also corroborates this firming top line growth message, as does the latest ISM services survey that remains squarely above the 50 boom/bust line on a broad array of measures. Unsurprisingly, this budding demand recovery has translated into a pick up in industry pricing power with our media selling price gauge even surpassing overall inflation. The implication is that media profits could surprise to the upside. Chart 7M&A Frenzy Continues Chart 8Overlooked Demand Recovery While our sense is that pipelines (S&P cable & satellite index) are the likely losers and content providers (S&P movies & entertainment) are the likely winners from the ongoing broad media deck reshuffling, the way we are executing the S&P media upgrade to neutral is by lifting both the S&P cable & satellite and S&P movies & entertainment sub-indexes to neutral. On the cable front, M&A activity is weighing heavily on relative share prices as index heavyweight Comcast is a possible acquirer of the Murdoch empire assets. However, this bellwether company is not a pure pipeline play and were it to win the FOX-related assets bidding war, it would further diversify its cash flow. Monetizing those assets involves execution risk, especially as the legacy cable business is wrestling with decelerating selling prices and still has to contend with cord cutting (top & middle panels, Chart 9). Encouragingly, the bottom panel of Chart 9 shows that likely all the negative news flow is already baked into compelling relative valuations. With regard to the content providers, not only are some of these assets currently caught up in a bidding war, but every remaining independent content provider is now in play, and deal hungry investment bankers are aggressively pitching M&A to media (and likely other industry) CEOs. Macro headwinds are also morphing into tailwinds for the S&P movies & entertainment group. Consumer confidence is pushing multi decade highs and given the fact that the economy is at full employment any increase in discretionary consumer incomes will likely further boost recreation outlays (Chart 10). Industry pricing power is also expanding at a healthy clip at a time when industry executives are showing labor restraint (Chart 11). If selling prices stay firm on the back of improving demand as we expect, then movies & entertainment profit margins will enter an expansion phase (middle panel, Chart 10). Chart 9Cable's Blues Are ##br##Well Discounted Chart 10Firming ##br##Recreation Outlays... Chart 11And Recovering Operating Metrics##br## Remain Underappreciated None of this rosy outlook is reflected in cyclically low S&P movies & entertainment relative valuations (bottom panel, Chart 10). Bottom Line: Book relative profits of 13.5% in the S&P cable & satellite index since inception and lift to neutral. Boost the S&P movies & entertainment index to a benchmark allocation for a relative loss of 8.3% since the early March inception. As a result the broad S&P media index also commands a neutral weighting. The ticker symbols for the stocks in the S&P cable & satellite and S&P movies & entertainment indexes are: BLBG: S5CBST - CMCSA, CHTR, DISH and BLBG: S5MOVI - DIS, FOXA, FOX, VIAB, respectively. Portion Control In Restaurants Restauranteurs are eternal optimists; at least that is the lesson we take from the National Restaurant Association's Restaurant Performance Index (RPI) which only rarely dips below the expansion line (Chart 12, second panel). However, changes in this overly optimistic sentiment survey are useful as they closely lead the S&P restaurants index's relative performance. This indicator has recently rolled over and we think the timing is right to turn negative on restaurants (Chart 12, bottom panel). The recent evaporation of industry pricing power echoes the RPI's early indications of a downturn (Chart 13, second panel). In view of how tightly it moves with relative industry sales, the growth outlook for restaurants has darkened considerably. The underlying driver of weakening pricing power is the industry's collapsing share of the consumer's wallet over the past two years, which has been at least as destructive to industry growth as the Great Recession (Chart 13, bottom panel). While both relative consumption and sales, which move in lockstep, have been staging a recovery in 2018, they both remain firmly in deflationary territory. Meanwhile, industry wages - the largest input cost - have been expanding above trend for the better part of the past four years (Chart 14, second panel). Though restaurant wage growth has recently slowed considerably it has not been enough to bring our margin proxy out of negative territory, implying sliding relative earnings growth is set to continue (Chart 14, bottom panel). Chart 12Optimism Reigns In Restaurants Chart 13Falling Pricing Should Weigh On Sales Chart 14Labor Costs Are A Profit Headwind A rising U.S. dollar is an additional profit headwind for this heavily internationally-geared consumer discretionary sub-index. Despite dollar strength offering an input cost tailwind via lower food commodity costs, declining translation of foreign profits will likely swamp those gains. McDonald's and Starbucks, which together represent 80% of the weight of the S&P restaurants index, had 62% and 49%, respectively, of their locations outside the U.S. at the end of last year. To compensate for a tough profit outlook, restaurants have embarked on a construction spending spree that shows no signs of abating (Chart 15, second panel). The predictable result has been a near-doubling of leverage ratios over the past three years (Chart 15, bottom panel). A weak profit backdrop signals that relief from these levels will be hard to find. Chart 15Restaurants Are Binging On Debt Chart 16Valuations Do Not Reflect Risks Valuations have been treading water at above-normal levels for several years (Chart 16, second and third panels). Perky valuations seem poised for a fall given the cloudy profit outlook and the higher risk premium that recently geared up balance sheets typically command. Bottom Line: Still-high valuations are not supported by falling returns in an increasingly capital intensive industry. Accordingly, we are pulling the trigger on last month's downgrade alert on the S&P restaurants index and moving to an underweight allocation. The ticker symbols for the stocks in this index are: BLBG: S5REST - MCD, SBUX, YUM, DRI, CMG. What Does All This Mean For The S&P Consumer Discretionary Index? Chart 17Stay Underweight Consumer Discretionary Despite the S&P media's heavy weighting in the broad consumer discretionary sector, our S&P restaurants downgrade sustains the below benchmark allocation in the S&P consumer discretionary sector. Importantly, the three key factors weighing on this early-cyclical sector we identified in early March remain intact: rising fed funds rate, quantitative tightening and higher prices at the pump (Chart 17). Meanwhile, were we to exclude AMZN from the day the S&P included it in the SPX and the S&P 500 consumer discretionary index (November 21st, 2005), then the vast majority of consumer discretionary stocks are actually following the typical historical relationship with the Fed's tightening cycle (middle panel, Chart 17). Put differently, the equal weighted S&P consumer discretionary relative share price ratio is indeed following the Fed's historical tightening path (bottom panel, Chart 17). Bottom Line: Earnings underperformance will eventually result in relative share price underperformance. Stay underweight the S&P consumer discretionary index. Anastasios Avgeriou, Vice President U.S. Equity Strategy anastasios@bcaresearch.com 1 Please see BCA Global Investment Strategy Special Report, "Three Policy Puts Go Kaput: Downgrade Global Equities To Neutral," dated June 19, 2018, available at gis.bcaresearch.com. 2 Please see BCA U.S. Equity Strategy Weekly Report, "Reflective Or Restrictive?" dated March 12, 2018, available at uses.bcaresearch.com. Current Recommendations Current Trades Size And Style Views Favor value over growth Favor large over small caps