Sectors
BCA Research’s US Investment Strategy service argues that despite investor worries, while several malls are likely to fail in in 2020 and 2021 their disappearances are not likely to hurt the economy. Retail properties do not undergird the banking system…

Highlights President Trump is making a comeback in our quantitative election model. An upgrade from our 35% odds of a Trump win is on the horizon, pending a fiscal relief bill. The Fed’s pursuit of “maximum employment,” the necessities of the pandemic response, fiscal largesse, a US shift toward protectionism, and the strategic need to counter China will pervade either candidate’s presidency. A Democratic “clean sweep” would add insult to injury for value stocks, but these stocks don’t have much more downside relative to growth stocks. Trump’s tariffs, or Biden’s taxes, will hit the outperformance of Big Tech, as will the recovery of inflation expectations. Feature More than at any time in recent US history, voters believe that the 2020 election is definitive in charting two distinct courses for the country (Chart 1). No doubt 2020 is an epic election with far-reaching implications. However, from an investment point of view, a Trump and a Biden administration have more in common than consensus holds. Chart 1An Epic Choice About The US’s Future
Trump Versus Biden: Tariffs Versus Taxes
Trump Versus Biden: Tariffs Versus Taxes
The US political parties have finalized their policy platforms, giving investors greater clarity about what policies the parties will try to implement over the next four years.1 While the presidential pick is critical for American foreign and trade policy, the Senate is just as important as the president for US equity sectors. The only dramatic changes would come if the Democrats achieved a clean sweep of government – yet this result is likely as things stand today (Chart 2). Investors should prepare. It would prolong the suffering of value stocks relative to growth stocks by hitting the US health care and energy sectors hard. Chart 2“Blue Wave” Still The Likeliest Scenario
Trump Versus Biden: Tariffs Versus Taxes
Trump Versus Biden: Tariffs Versus Taxes
The State Of Play A “Blue Wave” is still the likeliest outcome – and that’s where the stark policy differences emerge. The race is tightening. Our quantitative election model looks at state leading indicators, margins of victory in 2016, the range of the president’s approval rating, and a “time for change” variable that gives the incumbent party an advantage if it has not been in the White House for eight years. The model now shows Florida as a toss-up state with a 50% chance of flipping back into the Republican fold (Chart 3). Chart 3Florida Now 50/50 In Our Election Quant Model – 45% Chance Of Trump Win
Trump Versus Biden: Tariffs Versus Taxes
Trump Versus Biden: Tariffs Versus Taxes
As long as the economy continues recovering between now and November 3, Florida should flip and Trump should go from 230 Electoral College votes to 259. One other state – plus one of the stray electoral votes from either Nebraska or Maine, which Trump is like to get – would deliver him the Oval Office again. The model says that Trump has a 45% chance of victory, up from 42% last month. Subjectively, we are more pessimistic than the model. Pandemic, recession, and social unrest have taken a toll on voters and unemployment is nearly three times as high as when Trump’s approval rating peaked in March. Consumer confidence is weak, albeit making an effort to trough. Voters take their cue from the jobs market more than the stock market, although the stock rally is certainly helpful for the incumbent. We await the completion of a new fiscal relief bill in Congress before upgrading Trump to closer to our model’s odds and the market consensus of 45%. Another Social Lockdown? COVID-19 subsiding in the US a boon for Trump in final two months of campaign. The first concern for the next president is COVID-19. On the surface Trump and Biden are diametrically opposed. President Trump is obviously disinclined to impose a new round of lockdowns and the Republican platform calls for normalizing the economy in 2021. By contrast, the Democrats claim they will contain the virus even at a high economic cost. Biden says he will be willing to shut down the entire US economy again if scientists deem it necessary.2 There is apparently political will for new draconian lockdowns – but it is not likely to be sustained after the election unless the next wave of the virus is overwhelming (Chart 4). Biden will need to be cognizant of the economy if he is to succeed. Chart 4Biden Has Some Support For Another Lockdown
Trump Versus Biden: Tariffs Versus Taxes
Trump Versus Biden: Tariffs Versus Taxes
However, it is doubtful that Trump would refuse to lock down the economy in his second term if his advisers told him it was necessary. After all, it is Trump, not Biden, who implemented the lockdowns this year. Arguably he reopened the economy too soon with the election in mind. But if that is true, then it isn’t an issue for his second term, since he can’t run for president a third time. This is a theme we often come back to: reelection removes a critical impediment to Trump’s policies in a second term as opposed to his first. Bottom Line: The coronavirus outbreak and the country’s top experts will decide if new lockdowns are warranted, regardless of president, but the bar for a complete shutdown is high. COVID-19 is subsiding in both the US and in countries like Sweden that never imposed draconian lockdowns (Chart 5). Still, given that the equity market has recovered to pre-COVID highs, investors would be wise to hedge against a bad outcome this winter. Chart 5Pandemic Subsiding In US And ‘Laissez-Faire’ Sweden
Trump Versus Biden: Tariffs Versus Taxes
Trump Versus Biden: Tariffs Versus Taxes
Maximum Employment The monetary policy backdrop will be ultra-dovish regardless of the presidency. The Fed is now pursuing average inflation targeting and “maximum employment,” according to Fed Chairman Jay Powell, speaking virtually on August 27 at the Kansas City Fed’s annual Jackson Hole summit. This means that if Trump wins, he will not have to fight running battles with Powell over rate hikes. The monetary backdrop for either president will be more reminiscent of that faced by President Obama from 2009-12 – extremely accommodative. It is possible that Trump’s “growth at all costs” attitude could lead to speculative bubbles that the Fed would need to prick. Already the NASDAQ 100 is off the charts. Elements of froth reminiscent of the dotcom bubble era are mushrooming (Chart 6). Nobody has any idea yet how the Fed will square its maximum employment mission with the need to prevent financial instability, but it will err on the side of low rates. Chart 6Frothy NDX
Frothy NDX
Frothy NDX
Chart 7The Mother Of All V-Shapes
The Mother Of All V-Shapes
The Mother Of All V-Shapes
Biden will be more likely to tamp down financial excesses through executive orders – or to deter excesses through taxes if he controls the Senate. But there is no reason the executive branch would be more vigilant than the Fed itself. Higher inflation will push real rates down and weaken the dollar almost regardless of who wins the presidency. Trump’s trade wars – and any major conflict with China – would tend to prop up the greenback relative to Biden’s less hawkish, more multilateral, approach. But either way the combination of debt monetization, twin deficits, and global economic recovery spells downside for the dollar. This in turn spells upside for the S&P500 and inflation-friendly (or deflation-unfriendly) equity sectors in the longer run (Chart 7). Fiscal Largesse The next president will struggle with a massive fiscal hangover resembling late 1940s. The Fed’s new strategy ensures that fiscal policy will prove the driving factor in the US macro outlook. Regardless of who wins the election, the budget deficit will fall from its extreme heights amid the COVID-19 crisis over the next four years (Chart 8). If government spending falls faster than private activity recovers, overall demand will shrink and the economy will be foisted back into recession. Chart 8Budget Deficit Will Decrease As Economy Normalizes
Budget Deficit Will Decrease As Economy Normalizes
Budget Deficit Will Decrease As Economy Normalizes
The deep 1948-49 recession occurred because of the government’s climbing down from wartime levels of spending (Chart 9). Premature fiscal tightening would jeopardize the 2021 recovery. Yet neither candidate is a fiscal hawk. Trump is a big spender; Biden is a Democrat. The House Democrats will control the purse strings. Republican senators, the only hawkish actors left, are not all that hawkish in practice. They agreed with Trump and the Democrats in passing bipartisan spending blowouts from 2017-20. They will likely conclude another such deal just before the election. Chart 9Sharp Deficit Correction Would Jeopardize Recovery
Sharp Deficit Correction Would Jeopardize Recovery
Sharp Deficit Correction Would Jeopardize Recovery
So Trump would maintain high levels of spending without raising taxes; Biden would spend even more, albeit with higher taxes. Table 1Biden Would Raise $4 Trillion In Revenue Over Ten Years
Trump Versus Biden: Tariffs Versus Taxes
Trump Versus Biden: Tariffs Versus Taxes
On paper, Biden would add a net ~$2 trillion to the US budget deficit over ten years, as shown in Tables 1 and 2. But these are loose costings. Nobody knows anything until actual legislation is produced. The risk to spending levels lies to the upside until the employment-to-population ratio improves (Chart 10). Trump’s net effect on the deficit is even harder to estimate because the Republican Party platform is so vague. What we know is that Trump couldn’t care less about deficits. Back of the envelope, if Congress permanently cut the employee side of the payroll tax for workers who earn less than $8,000 per month, as Trump has suggested, the deficit would increase by roughly $4.8 trillion over ten years.3 Table 2Biden Would Spend $6 Trillion In Programs Over Ten Years
Trump Versus Biden: Tariffs Versus Taxes
Trump Versus Biden: Tariffs Versus Taxes
Chart 10Massive Labor Slack Will Encourage Government Spending
Massive Labor Slack Will Encourage Government Spending
Massive Labor Slack Will Encourage Government Spending
House Democrats will hardly agree to any major new tax cuts – and certainly not gigantic ones that would “raid Social Security.” This accusation will be popular and Trump will want to avoid it during the campaign as well – his 2020 platform does not explicitly mention the payroll tax. Many of Trump’s other proposals would focus on extending the Tax Cut and Jobs Act. For example, it is possible that Trump could extend the full expensing of companies’ depreciation costs for capital purchases, set to expire in 2022 and 2026, to the tune of $419 billion over ten years.4 Thus the overall contribution of government spending to GDP growth will be higher than in the recent past. This trend was established prior to COVID (Chart 11). The rise of populism supports this prediction, as Trump has always insisted he will never cut mandatory (entitlement) spending – a major change to Republican orthodoxy now enshrined in its policy platform. Chart 11Government Role To Increase In America
Government Role To Increase In America
Government Role To Increase In America
Chart 12No Cuts To Defense Likely Either
No Cuts To Defense Likely Either
No Cuts To Defense Likely Either
Meanwhile Biden is not only rejecting spending cuts but also coopting the profligate spending agenda of the left wing of his party. Practically speaking, social spending cannot be cut by Trump – and yet Biden cannot cut defense spending much either, since competition with Russia and China is growing (Chart 12). The common thread in both party platforms is fiscal largesse at a time of monetary dovishness, i.e. reflation. Other Common Denominators Market is overrating Biden’s China friendliness. Both Trump and Biden promise to build infrastructure, energize domestic manufacturing, and lower pharmaceutical prices. The two candidates are competing vociferously over who will bring more American manufacturing jobs home. President Trump won the Republican nomination in 2016 partly because he stole the Democrats’ thunder on “fair trade” over “free trade.” Biden’s agenda is effusive on these Trump (and Bernie Sanders) themes – his party sees an existential risk in the Rust Belt if it cannot steal that thunder back. The manufacturing agenda centers on China-bashing. China runs the largest trade surplus with the US, it has a negative image in the public eye, and it has alarmed the military-industrial complex by rising to the status of a peer strategic competitor over the technologies of tomorrow. Where Trump once spoke of a “border adjustment tax,” or a Reciprocal Trade Act, Biden speaks openly of a carbon border tax: “the Biden Administration will impose carbon adjustment fees or quotas on carbon-intensive goods from countries that are failing to meet their climate and environmental obligations.”5 China’s coal-guzzling economy would obviously be the prime target. It is true that Biden will seek to engage China and reset the relationship. He will probably maintain Trump’s tariff levels or even slap a token new tariff, but he will then settle down for a two-track policy of dialogue with China and coalition-building with the democracies. The result may be a reprieve from strategic tensions for a year or so. Investors are exaggerating Biden’s positive impact on China relations, judging by the correlation of China-exposed US equities with the Democrats’ odds of winning. The truth is that Biden will maintain the Obama administration’s “Pivot to Asia,” which was about countering China. The secular power struggle will persist and China-exposed stocks, especially tech, will be the victims (Chart 13). Chart 13Market Over-Optimistic About Biden Vis-à-Vis China
Market Over-Optimistic About Biden Vis-à-Vis China
Market Over-Optimistic About Biden Vis-à-Vis China
Senate election will likely tip with White House – but checks and balances are best for equities. Control of the Senate will determine whether the big differences between the two candidates materialize. Biden can’t raise taxes without the Senate; Trump can’t wage trade wars of choice as Congress is supreme over commerce and could take his magic tariff wand away from him. Trump can use executive orders to pare back immigration, but he cannot force the House Democrats to approve a southern border wall. In fact, he dropped “the Wall” from his agenda this time around. (It didn’t help that former Trump adviser Steve Bannon has been arrested for allegedly scamming people out of their money to pay for a wall.) Biden will be far looser on immigration than Trump and the reviving economy will attract foreign workers. But the Obama administration showed that during times of high unemployment, even Democrats have a limit to the influx they will allow (Chart 14). Meanwhile Biden can use executive orders to impose aspects of his version of the Green New Deal, but he cannot pass carbon pricing laws or other sweeping climate policy if Republican Senators are there to stop him. For this reason, a divided government is likely to produce three cheers from the markets. The single most market-positive scenario is Biden plus a Republican Senate, which suggests a moderation of the trade war and yet no new taxes. Second best would be Trump with a Democratic Congress that would clip his wings on tariffs, but enable him to veto any anti-market laws. The stock market’s performance to date is more reminiscent of a “gridlock” election outcome, in which the two parties split the executive and legislative branches of government in some way, as opposed to a unified single-party government (Chart 15). Chart 14Immigration Faces Limits Even Under Democrats
Trump Versus Biden: Tariffs Versus Taxes
Trump Versus Biden: Tariffs Versus Taxes
Chart 15Stock Market Expects Gridlock?
Stock Market Expects Gridlock?
Stock Market Expects Gridlock?
Investors should not be complacent, however, because the political polling so far suggests that the Senate race is on a knife’s edge. The balance of power will tilt whichever way the heavily nationalized, heavily polarized White House race tilts (Chart 16). A “blue sweep” is still a fairly high probability. Indeed a Biden win will most likely produce a Democratic sweep while a Trump win will produce the status quo. Chart 16Tight Senate Races Will Turn On White House Race
Trump Versus Biden: Tariffs Versus Taxes
Trump Versus Biden: Tariffs Versus Taxes
Biden’s Agenda After A Blue Sweep Democrats would remove the filibuster – another big difference in outcomes. Biden is more likely to benefit from Democratic control of Congress if he wins. He is also more likely to rely on his top advisers and the party apparatus. Hence the Democratic platform matters more than the Republican platform in this cycle. Investors should set as their base case that a new president will largely succeed in passing his top one or two priorities. Less conviction is warranted after the initial rush of policymaking, as political capital will fall and the economic context will change. But in the honeymoon period, a president can get a lot done, especially if his party controls Congress. Investors would have been wrong to bet against George W. Bush’s Economic Growth and Tax Relief Act (2001), Barack Obama’s Affordable Care Act (2009), or Trump’s Tax Cut and Jobs Act (2017). Yet they could never have known that COVID-19 would strike in Trump’s fourth year and overturn the very best macroeconomic forecasts. Critically, if Democrats take the Senate, our base case is that they will remove the filibuster, i.e. the use of debate to block legislation. Biden has suggested that he would look at doing so. President Obama recently linked it to racist Jim Crow laws of the late nineteenth and early twentieth centuries, making it hard for party members to defend keeping the filibuster. Senate minority leader Charles Schumer (D, NY) has signaled a willingness to change the Senate rules if he becomes majority leader. Removing the filibuster would change the game of US lawmaking, enabling the Senate to pass laws with a simple majority of 51 votes – i.e. 50 plus a Democratic vice president. This is entirely within reach. While a handful of moderate Democratic senators may oppose such a dramatic move at first, the Democratic Party leadership will corral its members once it faces the reality of the 60-vote requirement blocking its agenda. The party will remember the last time it took power after a national crisis, in 2009, and the frustrations that the filibuster caused despite having at that time a much stronger Senate majority than it can possibly have in 2021. Populism is rife in the US and it is all about shattering norms. Moreover, the filibuster has already been eroding over the past two administrations (vide judicial appointments). Revoking it would enable Democrats to pass a lot more ambitious legislation, and many more laws, than in previous administrations. This is important because Biden’s agenda is more left-wing than some investors realize given his history as a traditional Democrat. In order to solidify the increasingly powerful progressive faction of his party, symbolized by Vermont Senator Bernie Sanders, Biden created task forces to merge his agenda with that of Sanders. Sanders and his fellow progressive Senator Elizabeth Warren of Massachusetts have much more influence in the party than their 35% share of the Democratic primary vote implies. The youth wing of the party shares their enthusiasm for Big Government. Here are the key structural changes that matter to investors: Offering public health insurance – A public health option will benefit from government subsidies and thus outcompete private options, reducing their pricing power. The lowest income earners will be enrolled in the program automatically, rapidly boosting its size (Chart 17). Enabling Medicare to negotiate drug prices – Medicare’s drug spending is equivalent to almost 45% of Big Pharma’s total sales. Enabling this government program to bargain with companies over prices will push down prices substantially. However, the sector’s performance is not really tied to election dynamics because President Trump is also pledging to cap drug prices – it is an effect of populism (Chart 18). Doubling the federal minimum wage – The wage will rise from $7.25 to $15 per hour, hitting low margin franchises and small businesses alike. Chart 17Health Care Gives Back Gains After Biden Nomination
Health Care Gives Back Gains After Biden Nomination
Health Care Gives Back Gains After Biden Nomination
Chart 18Big Pharma Faces Onslaught From Both Parties
Big Pharma Faces Onslaught From Both Parties
Big Pharma Faces Onslaught From Both Parties
Eliminating carbon emissions from power generation by 2035 – Countries are already rapidly shifting from coal to natural gas, but the Biden agenda would attempt to move rapidly away from fossil fuels completely (Chart 19). If legislation passes it will revolutionize the energy sector. Prohibiting “right to work” laws – This is only one example of a sweeping pro-labor agenda that would involve an extensive regulatory push and possibly new laws. New laws would prevent states from passing “right to work” laws that give workers more freedoms to eschew labor unions. The removal of the filibuster makes this possible. Moreover Biden will be aggressive in using executive orders to implement a pro-labor agenda, going further than Bill Clinton or Barack Obama attempted to do in recognition of the party’s shift to the left of the political spectrum. Chart 19Blue Sweep Would Bring Climate Policy Onslaught
Trump Versus Biden: Tariffs Versus Taxes
Trump Versus Biden: Tariffs Versus Taxes
Subsidizing college tuition and low-income housing. US housing subsidies currently make up 25% of domestic private investment in housing and Biden’s government would roll out a significant expansion of these programs. Granting Washington, DC statehood – This is unlikely to happen as two-thirds of Americans are against it. But without the filibuster, Democrats could conceivably railroad it through. Trump’s Agenda Trump’s signature is tariffs – and globally exposed stocks know it. If Trump wins, his domestic legislative agenda will be stymied, other than laws directly aimed at fighting the pandemic and reviving the economy. As mentioned, Trump is unlikely to pass a law building a wall on the southern border. It is conceivable that Trump could pass a comprehensive immigration reform bill with House Democrats, but that is not a priority on the platform and Trump would have to pivot toward compromise. That would depend on Democrats winning the Senate or forcing him to negotiate with the House. Hence a Trump second term will mostly focus on foreign and trade policy. The Republican platform is aggressive on economic decoupling from China, which is ranked third behind tax cuts and pandemic stockpiles.6 Trump, vindicated on protectionism, would likely go after other trade surplus nations. The Chinese could offer some concessions, producing a Phase Two deal early in his second term to avoid sweeping tariffs and encourage him to wage trade war against Europe (Chart 20). Chart 20Trump = Global Trade War
Trump = Global Trade War
Trump = Global Trade War
Trump’s foreign policy would consist of reducing US commitments abroad. Withdrawing from Afghanistan and other scattered conflicts is hardly a game changer. Shifting some forces back from Germany and especially South Korea is far more consequential. It will create power vacuums. But the US is not likely to abandon the allies wholesale. Chart 21Defense Stocks Will Get Wind In Sails
Defense Stocks Will Get Wind In Sails
Defense Stocks Will Get Wind In Sails
Trump has moderated his positions on NATO and other defense priorities over his first term. It is possible he could revert back to his original preferences in a second term, however, so global power vacuums and geopolitical multipolarity will remain a major source of risk for global investors. He will probably also succeed in maintaining large defense spending, despite a Democratic House, given the reality of great power struggle with China and Russia. Geopolitical multipolarity means that defense stocks will continue to enjoy a tailwind from demand both at home and abroad (Chart 21). Investment Takeaways Energy sector struggles most under Democrats. Biden and Trump are both offering reflationary agendas. Where the two agendas diverge most notably, the impacts are largely market-negative – Trump via tariffs, Biden via taxes. The current signals from the market suggest that growth stocks benefit more from a Democratic clean sweep than value stocks (bottom panel, Chart 22). However, the general collapse in value stocks versus growth suggests that there is not much more downside even if the Democrats win (top panel, Chart 22), especially if the 10-year yield rises, as we have been writing in recent research: a selloff in the bond market is the last QE5 puzzle-piece to fall into place. Fed policy, fiscal largess, and the dollar’s decline will support a global cyclical recovery and downtrodden value stocks regardless of the president. The difference is that Biden would slow their relative recovery by piling regulatory burdens on energy as well as health care, which in the US context are a value play. As a reminder, and contrary to popular belief, health care stocks are the largest constituent of the S&P value index with a market cap weight of 21%.7 Trump’s populist “growth at any cost” and deregulatory agenda would persist in a second term and clearly favor value. Yet, if his trade wars get out of hand, they would also weigh on the recovery of these stocks. The difference is that tech stocks are not priced for a Phase Two trade war. If Trump wins it will be a rude awakening. Not to mention that Trump and populist Republicans will seek to target the tech sector for what is increasingly flagrant favoritism in political and cultural debates. Democrats are much more clearly aligned with tech. While they have ambitions of reining in the tech giants as part of the progressive drive against corporate power writ large, Joe Biden will struggle to take on Big O&G, Big Pharma, Big Insurance, and Big Tech at the same time in a single four-year term. The logical conclusion is that he will spare Silicon Valley, which maintained a powerful alliance with the Obama administration. He cannot afford to betray his progressive base when it comes to climate policy, so the Obama alliance with domestic O&G producers will suffer. Tech will face regulatory risks but they will not be existential. Chart 22Not Much Downside Left For Value Stocks
Not Much Downside Left For Value Stocks
Not Much Downside Left For Value Stocks
The fact that the final version of the Democratic Party platform did not contain a section on removing federal subsidies for fossil fuels is merely rhetorical.8 The one clear market reaction from this election cycle is the energy sector’s abhorrence of Democratic policies (Chart 23). The difference is that energy is priced for it whereas tech is priced for perfection. Chart 23Energy Sector Loses From Blue Sweep
Energy Sector Loses From Blue Sweep
Energy Sector Loses From Blue Sweep
Matt Gertken Geopolitical Strategist mattg@bcaresearch.com Anastasios Avgeriou US Equity Strategist anastasios@bcaresearch.com Footnotes 1 In this report we work from the latest policy platforms available. See “Trump Campaign Announces President Trump’s 2nd Term Agenda: Fighting For You!” Trump Campaign, donaldjtrump.com ; and the draft “2020 Democratic Party Platform” Democratic National Committee, demconvention.com. 2 Bill Barrow, “Biden Says he’d shut down economy if scientists recommended,” Associated Press, August 23, 2020, abcnews.go.com. 3 See Seth Hanlon and Christian E. Weller, “Trump’s Plan To Defund Social Security,” Center for American Progress, August 12, 2020, americanprogress.org; “The 2020 Annual Report Of The Board Of Trustrees Of The Federal Old-Age And Survivors Insurance And Federal Disability Insurance Trust Funds,” Social Security Administration, April 22, 2020, ssa.gov. 4 Erica York, “Details And Analysis Of The CREATE JOBS Act,” Tax Foundation, July 30, 2020, taxfoundation.org. 5 See “The Biden Plan For A Clean Energy Revolution And Environmental Justice,” Biden Campaign, joebiden.com. 6 A Democratic Congress could take back the constitutional power over commerce that it delegated to the president back in the 1960s-70s, limiting Trump’s ability to wage trade war. If Republicans hold the Senate, they still might restrain Trump’s protectionism, as they did with his threatened Mexico tariffs in early 2019, but they would not do so until he has already taken a major disruptive action. 7 See “S&P 500 Value,” S&P Dow Jones Indices, spglobal.com. 8 Andrew Prokop, “The Democratic Platform, Explained,” Vox, August 18, 2020, vox.com.
Highlights Several malls are likely to fail in 2020 and 2021, but the overall economy will emerge unscathed … : Although lenders will recover a good bit less than par and equity holders will be wiped out, the losses will not create an observable macroeconomic drag. … because no critical element of the financial system has concentrated exposure to them: The amounts involved are not that large and the banking system’s stake is negligible. Malls disrupted the existing retailing footprint during their rise, and now it’s their turn to be disrupted: Creative destruction is natural and healthy. It will be a net positive for the economy if obsolete malls make way for more productive uses of their space. Feature As detailed in the first part of our Mallpocalypse Special Report, enclosed shopping malls are under pressure from a variety of forces. Department stores, which have typically anchored malls, are in the throes of a protracted structural decline; the apparel retailers that fill most of the leasable area between the anchors are in disarray; and e-commerce continues to take share from brick-and-mortar retailers. The pandemic, which forced many malls to close for an extended period and will likely undermine foot traffic until an effective vaccine is available, intensified the pressure. It pushed several national store chains into bankruptcy, emboldened many of their peers to stop paying rent and stymied malls’ pivot to gyms, movie theaters, restaurants and entertainment centers to fill their vacant spaces. Property analysts and investors estimate that the weakest 25% of malls face the possibility of extinction. Their owners’ equity stakes are likely to be wiped out and their lenders will recover considerably less than par. This installment examines the macroeconomic consequences of mall investors’ losses and the obsolescence of a formerly important aspect of the capital stock. Our view is that the malls’ demise does not constitute a macro threat; the mallpocalypse is not the commercial real estate analogue of the subprime crisis. Mall Exposures Are Diffused The sparks generated by the subprime mortgage collapse helped fuel the conflagration of the global financial crisis because they eroded commercial banks’ capital base; hobbled two major investment banks such that counterparties refused to deal with them; brought about declines in the prices of homes, which constitute a meaningful share of the collateral of the US banking system; and crippled the massive multi-line insurer that had been the biggest seller of the credit default swaps that the major banks and broker-dealers were using to hedge some of their residential mortgage exposures. With so many of the biggest players circling the wagons, liquidity dried up, credit spreads blew out and a major financial crisis ensued. No bank or major bank counterparty is sitting on a pile of mall mortgages. Mall failures will not have anything close to the same impact. Retail properties do not undergird the banking system like single-family homes and exposure to them is diffused across owners and creditors that can sustain losses without setting off broad ripple effects. More than half of US malls1 are owned by publicly traded REITs with the remaining ownership scattered among several privately held specialist investors. Developing and owning real estate is a leveraged pursuit and mall owners aren’t shy about borrowing, especially Simon Property Group (SPG), the largest player in the space (Table 1). Like some of its mall REIT peers, and nearly all its shopping center/strip mall counterparts, however, it does the bulk of its borrowing via bond issues. The effect is to reduce the concentration of creditor exposures; instead of borrowing from a bank or a syndicate of banks, SPG and many other publicly traded REITs sell bonds to a range of institutional investors. The mortgages it does take out predominantly wind up being securitized and dispersed across the institutional investor community. Table 1Large US Mall Owners
Mallpocalypse, Part 2: Who’s On The Hook?
Mallpocalypse, Part 2: Who’s On The Hook?
Creditor exposures to mall owners are thereby atomized, making losses a micro issue rather than a macro one. Distributing credit losses across a wide swath of investors neutralizes the systemic risk posed by any given borrower or common group of borrowers. Alan Greenspan was compelled to recant his spectacularly ill-timed praise for securitization’s risk-mitigating properties, but it was conceptually sound. Residential mortgage securitization wasn’t the problem per se, it was that the private-label mortgage market had become a largely closed system in which the banks swapped positions with one another, amplifying counterparty exposures within the banking system without anyone seeming to care, if indeed they were aware. Table 2Top 15 Holders Of SPG Debt
Mallpocalypse, Part 2: Who’s On The Hook?
Mallpocalypse, Part 2: Who’s On The Hook?
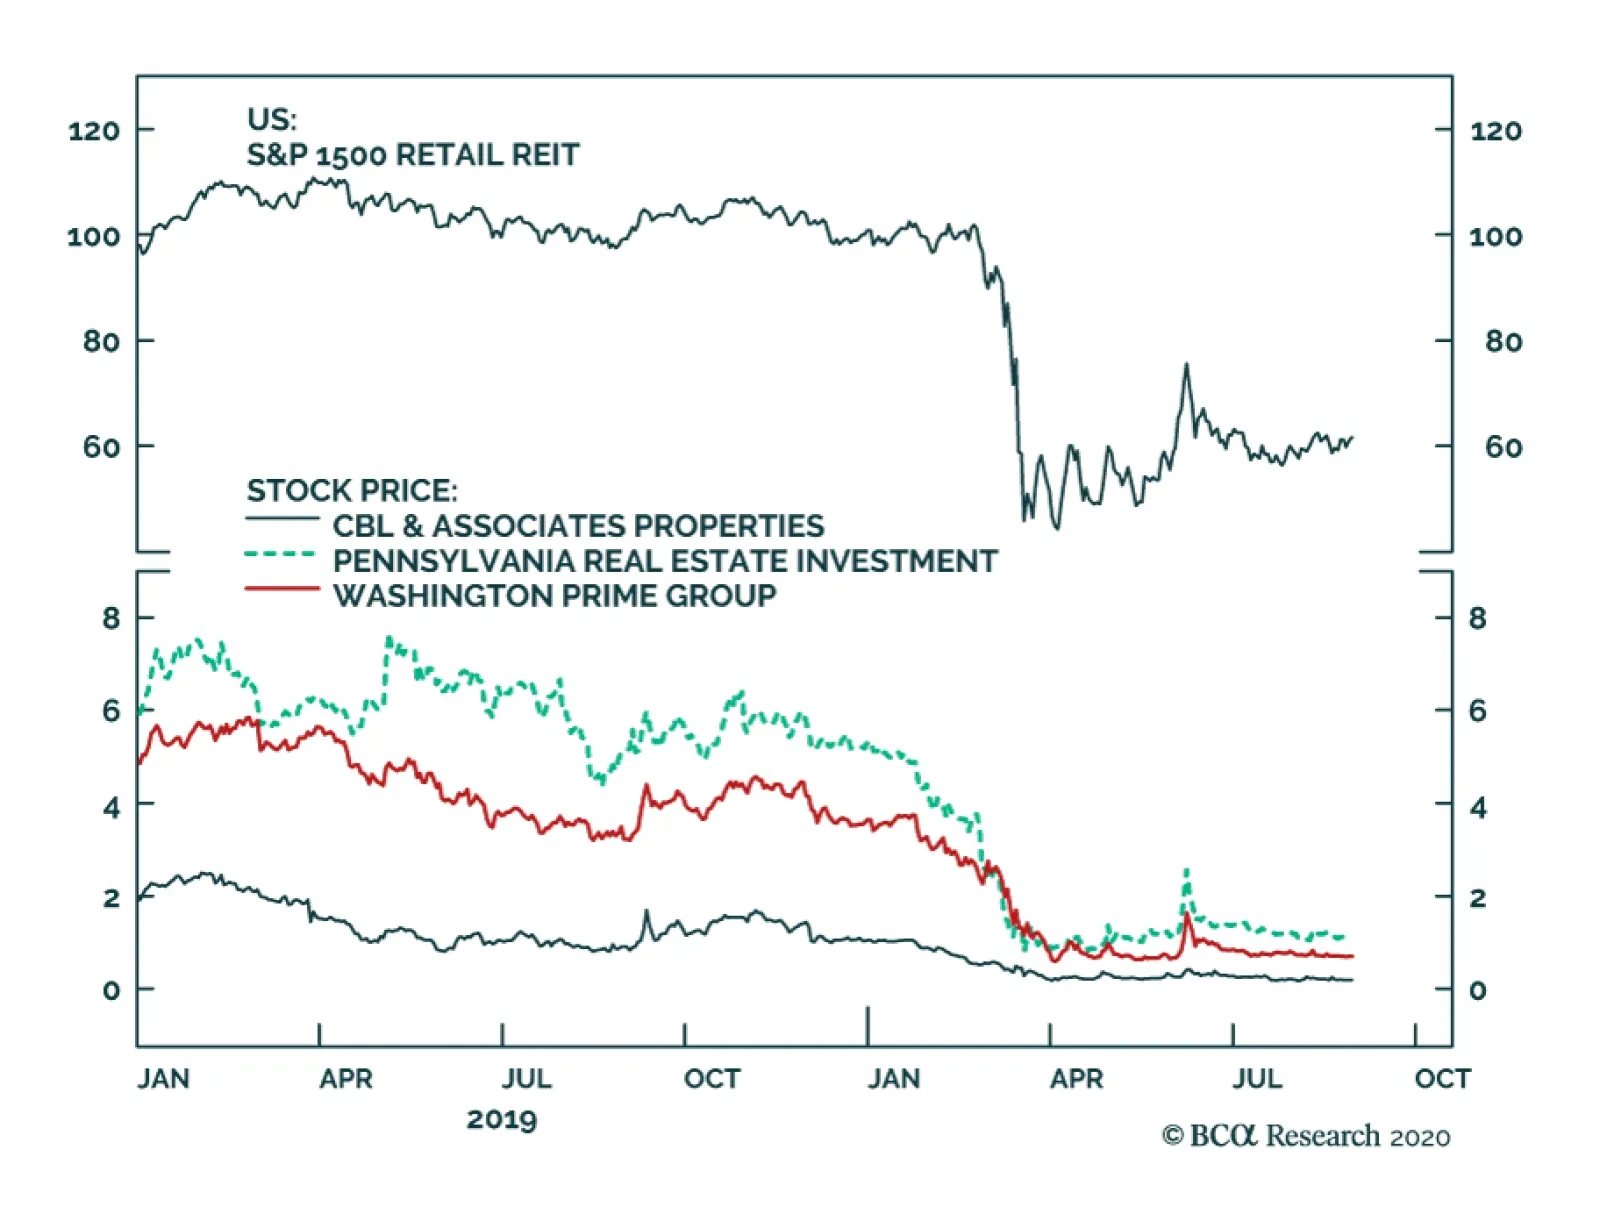
The primary owners of SPG’s bonds are the dominant index ETF sponsors, insurers and active mutual fund managers (Table 2). They are unlevered investors whose involvement diversifies exposure to credit losses away from the banks, thereby dissipating systemic risk. Although their losses cause financial conditions to tighten at the margin as spreads widen in response, they don’t disrupt financial intermediation in the way that sizable bank losses do. The worst outcome is a barely observable decline in funds available for consumption or investment and marginal employment declines as defaulting borrowers and their chastened creditors tighten their belts. Institutional investors are agents for the wealthier households that own a disproportionate share of financial instruments. They have a low marginal propensity to consume, which is to say that their consumption patterns are relatively insensitive to one-off income reversals and their investment losses don’t therefore perturb the broad economy. Equity holders in ailing mall REITs may have their stakes wiped out (Chart 1, bottom panel), adding insult to the injuries retail REIT investors have already sustained so far this year (Chart 1, top panel), but no critical intermediaries are shareholders and the overall market cap of retail REITs is not meaningful. Chart 1Trees Falling In Abandoned Mall Courtyards Do Not Make A Sound
Trees Falling In Abandoned Mall Courtyards Do Not Make A Sound
Trees Falling In Abandoned Mall Courtyards Do Not Make A Sound
The Big Short 2.0 Investors who foresaw a future in which e-commerce wipes out department stores and other national chains with sizable mall footprints have sought out ways to bet against malls. Many of them have gravitated to selling the CMBX 6 Index (Box 1). The trade has been talked about so much in credit circles over the last few years that the financial media have labeled it The New Big Short, after the book and movie about investors who anticipated the wreckage of the subprime crisis. The New York Times devoted an article to it last week, and Bloomberg, The Wall Street Journal and countless credit market blogs have been following it for a while. Box 1: The CMBS Insurance Marketplace Credit default swaps (CDS), developed in the mid-nineties as a tool for hedging lending exposures, have become a wildly popular way for investors to bet on the fate of a given bond issue or security. Bonds can be quite illiquid relative to equities, and CDS vastly ease the process of obtaining exposure to them. They are effectively an insurance contract in which the protection buyer pays the protection seller a flat annual fee to indemnify the buyer against missed or partial interest or principal payments. The CMBX indices provide a reference point for buying and selling protection on a large basket of commercial mortgage backed securities (CMBS). They are composed of 25 equally weighted CMBS of common vintage, each of which contains at least 40 loans, and they are divided into quality tranches from AAA to BB, based on the level of credit enhancement provided to each tranche. The BB tranche absorbs losses first, then the BBB- tranche, and so on, up to the AAA tranche. The protection seller is said to go long the index while the buyer shorts it. CMBX trades between counterparties are zero-sum. They produce no aggregate increase or decrease in wealth because the longs’ and the shorts’ return profiles are perfect inverses. The weakest mall REITs aren't long for this world, but their ultimate demise will not trigger any broader repercussions. The CMBX 6, consisting of whole loans issued in 2012, became the darling of the retail bears because a comparatively large 44% of the face value of its mortgages backed retail properties (27% non-mall retail, 17% malls). As of late 2019, the index contained loans on 37 malls (Table 3). Publicly traded REITs have a stake in 26 of the 37 malls in the index and account for 70% of the outstanding principal balance. Table 3Mall Mortgages In The CMBX 6 Index
Mallpocalypse, Part 2: Who’s On The Hook?
Mallpocalypse, Part 2: Who’s On The Hook?
Live By Disruption, Die By Disruption Obsolete malls are not likely to hurt the macroeconomy. Their disappearance will reslice the pie, creating micro winners and losers, but it shouldn’t cause it to shrink. Unwanted malls are a drag on the capital stock, because they’re not worth the cost of maintaining them, and converting the sites to better uses should act to boost productivity. Creative destruction is a positive feature of capitalism and a sign of economic health. The macro-economy didn't suffer when malls disrupted traditional downtown shopping districts and there's no reason to think it will now that the malls themselves are being disrupted. To those inclined to think we’re being cavalier about economic shifts and the near-term disruptions they provoke, we would point to the decades when the malls themselves were the disruptors. Mall construction – and branch department stores – thrived amidst the city-to-suburb migration that unfolded across the ‘50s, ‘60s and ‘70s. Population and wealth flooded out of the cities and into the suburbs, leaving some nasty micro-level scars as once-thriving retail quarters in the urban core became derelict. That outmigration did not produce a wave of bank failures, however. Citing Detroit’s experience in the ‘50s through the ‘70s in its Special Report examining the potential commercial real estate impact of a sizable uptake in work-from-home arrangements, our Global Investment Strategy service found no evidence that urban flight imposed undue stress on the financial system.2 Outmigration was also pervasive along the mid-Atlantic I-95 corridor in those decades. Suburbs of New York, Philadelphia and Washington, DC all experienced phenomenal growth while their core metropolitan areas shrank (Chart 2, top three panels). Even a growing city like Atlanta (Chart 2, bottom panel) saw its surrounding suburban counties welcome six times as many net new residents over the period. Chart 2City And Suburb Net Population Change By Decade
Mallpocalypse, Part 2: Who’s On The Hook?
Mallpocalypse, Part 2: Who’s On The Hook?
Despite inevitable home price declines in several city neighborhoods and reduced demand for retail and office space, aggregate residential (Chart 3) and commercial mortgage performance (Chart 4) held up quite well and there was no uptick in bank failures (Chart 5). Inflation helped to hold down defaults then in a way it won’t now, but the bottom line is that the shift in consumer preferences toward shopping malls did not feed broader disruptions, even though credit exposures were nearly entirely concentrated within the banking system. With exposure to mall operators’ equity, mortgages and unsecured loans widely dispersed away from the banking system, and retail accounting for only a modest share of commercial property value (Chart 6), the shift away from shopping malls will not have broader macro consequences. Chart 3Urban Flight Didn't Undermine Residential ...
Urban Flight Didn't Undermine Residential ...
Urban Flight Didn't Undermine Residential ...
Chart 4... Or Commercial Mortgage Performance
... Or Commercial Mortgage Performance
... Or Commercial Mortgage Performance
Chart 5Urban Flight Didn't Promote Bank Stress
Urban Flight Didn't Promote Bank Stress
Urban Flight Didn't Promote Bank Stress
Of Diamonds And Malls The forces behind the rise and fall of malls closely resemble the forces that drove the postwar waves of stadium construction: population shifts, increased reliance on automobiles and fashion’s impermanence. For the first half of the twentieth century, professional baseball’s sixteen franchises were spread across just ten cities. Its geographic footprint stretched from Boston to Washington on the Atlantic seaboard and along the Ohio River, the Great Lakes and the Mississippi to Chicago and St. Louis. The spread of franchises beyond the northeast and industrial midwest has tracked and foreshadowed the southern and westward movement of the population. Franchise moves, expansion and the mothballing of old city-center stadiums without parking led to a multi-decade boom in stadium construction that roughly coincided with the boom in mall construction. On undeveloped parcels on their outskirts, one city after another erected bland, utilitarian stadiums that were as uniform as the malls that had begun to dot suburban highway interchanges. They were hulking concrete structures with synthetic Astro-turf surfaces that could host baseball in the spring and summer and football in the winter, with capacity for between 50,000 and 70,000 fans and their cars. The early ‘90s witnessed a new stadium construction boom, motivated by franchises’ desire to reconfigure their seating to maximize revenues from businesses who used the games as a vehicle for entertaining clients. Stadiums without luxury boxes and enclosed suites were swiftly seen as obsolete. The popularity of Baltimore’s new park (1992), showcasing a retro design that hearkened back to the days of center city stadiums with brick facades and asymmetric quirks, made the stadiums of the sixties and seventies look hopelessly passé. The stock of dual-sport, artificial turf stadiums with concrete facades was eradicated over the next decade-plus, including Houston’s iconic Astrodome. The first fully enclosed stadium, billed as “the eighth wonder of the world” upon its 1965 opening, was the subject of rapturous national media coverage akin to the attention lavished on Southdale, the first mall, a decade before. The conversion of the stadiums did not bring ruin for any franchise, its municipal host,3 or the syndicate of banks and muni bond buyers that financed it. In cities where the new stadiums have been built closer to the center of town, the new ballparks have been a catalyst for a range of commercial and residential development. The broadly positive impact of scrapping faded stadiums for newer, better designed replacement stock looks like what we might expect from the scrapping of obsolete malls to make way for properties able to make better use of the space. Investment Implications Investors should not fear negative economic or market consequences from the retirement of underperforming malls. Their exit will not produce investment losses on a scale that slows the economy or interrupts banks’ intermediation function. Specialist real estate investors may find several opportunities in an industry in which the three most important factors are location, location and location. Credit and equity analysts and PMs may well find ways to profit from micro distinctions, but the lack of macro impacts means the demise of a meaningful share of the country’s malls does not have asset allocation implications. Investors in US assets will continue to be best served by taking their asset allocation cues from the fiscal and monetary policy backdrop. Mallpocalypse may be a clever phrase, but culling the nation’s underperforming malls from the capital stock won’t have adverse impacts on financial markets or the broad economy. Doug Peta, CFA Chief US Investment Strategist dougp@bcaresearch.com Footnotes 1 There are around 1,300 malls in the US, including outlet malls and lifestyle centers. 2 Please see the August 28, 2020 Global Investment Strategy Special Report, "Working From Home, Urban Flight, And Commercial Real Estate Loans: How Bad Can Things Get?" available at gis.bcaresearch.com. 3 The merits of using public funds to subsidize stadium construction for private concerns are hotly contested. Taking the existing level of public subsidies as a given, however, successful facilities upgrades confer an overall economic benefit, even if it involves a transfer of wealth from taxpayers to private entities.
Stick With This Juggernaut
Stick With This Juggernaut
Software stocks have been on a tear. This defensive-tech index has bested the SPX by 34% year-to-date, and in absolute terms is up a whopping 45%. While such a breakneck pace is clearly unsustainable, and a short-term breather is in order, software stocks have been high-flying as they are trying to satisfy investors’ insatiable appetite for cloud exposure. True, some recent IPO activity is reminiscent of the dotcom bubble excesses (re:BIGC doubled in a mere 5 trading days) as investors are scrambling to gain any cloud exposure at any price. Circling back to the S&P software index, encouragingly this has been a capex-led advance, as software outlays now capture a larger slice of corporate budgets (top panel). As a result, software stocks have rallied along side swelling profits (second panel). Granted, valuations are trading at a large premium versus the broad market, however, the 12-month forward P/E is hovering near the historical average and way below the 1990s peak (middle panel). When corrected for the long-term growth rate, the relative P/E/G ratio is near parity and below the historical mean (bottom & fourth panels). Bottom Line: While software stocks have run too far too fast, appear expensive to the naked eye and a near-term breather is needed, the earnings-led advance keeps us on the cyclically bullish side. The ticker symbols for the stocks in the S&P software index are: BLBG: S5SOFT – MSFT, ADBE, CRM, ORCL, INTU, NOW, ADSK, ANSS, SNPS, CDNS, FTNT, PAYC, CTXS, NLOK, TYL.
BCA Research's Global Investment Strategy service in a recent report assessed the risks to the US banking system from a potential downturn in commercial real estate. In a scenario of high CRE loan losses alone scenario, the result is an overall CRE…
Dear Client, I am on vacation this week. Instead of our regular report, we are sending you a Special Report from my colleague Jonathan LaBerge. Jonathan explores the risks posed to commercial real estate and the banking system from work from home policies and the potential for urban flight towards less populated and more affordable areas. I hope you find his report insightful. Best regards, Peter Berezin, Chief Global Strategist Highlights Despite pronouncements that the “office is dead,” there are several arguments against the idea that working from home policies or urban flight will become broad-based and spell disaster for commercial real estate loans and the economy. However, the reality is that no one truly knows what the office environment will look like as a result of COVID-19. It is quite likely to be negative on balance for owners of office properties, but it is not yet clear whether it will be a marginal or catastrophic effect. Within the US, small banks clearly have more commercial real estate loan exposure than large banks. Applying the recent Dodd-Frank Act Stress Test (DFAST) to small US banks highlights that roughly 2/3rds of small banks might need to raise capital in the scenario modeled by the Fed, underscoring that forbearance and fiscal relief are essential to avoid a very widespread erosion in small bank capital. Still, of the nearly 5,100 banks included in our analysis, only 5 would see their equity capital wiped out by the simulated losses. Incorporating outsized, Work From Home (WFH)-driven CRE loan losses into our test of small banks highlights that WFH policies may act as a moderate “kicker” to severe pandemic-related bank loan losses were they to occur. But it is clear that the latter is by far the core risk facing both the US economy and its financial system. To the extent that the “white flight” phenomenon of the 1950s to 1970s is a reasonable historical analogue for large-scale urban flight today, the experience of Michigan in the 1960s suggests that it would not likely cause widespread problems in the housing market and/or systemic stress in the banking system. But even if large-scale urban flight does not initially occur due to time-saving WFH policies or health & safety concerns, there are some concerning parallels to the severe decay and decline of the city of Detroit that could play out over the coming few years in America’s cities if not prevented by policymakers. This could spur large-scale urban flight for reasons unrelated to WFH policies. The possibility of inadequate fiscal support is the chief risk to our positive cyclical stance towards risk assets and must be continually monitored by investors over the next several months. We expect large bank outperformance at some point over the coming year, reinforcing our positive stance towards value over growth. Feature Chart 1Rising CRE Prices And Deteriorating Fundamentals, Even Before The Pandemic
Rising CRE Prices And Deteriorating Fundamentals, Even Before The Pandemic
Rising CRE Prices And Deteriorating Fundamentals, Even Before The Pandemic
Concern had already been growing among investors over the past few years about the potentially systemic implications of a possible crash in sky-high US commercial real estate (CRE) prices. Chart 1 highlights that overall CRE prices have doubled over the past decade, which has occurred alongside falling real rents (and thus deteriorating fundamentals) in most CRE subcategories. But the COVID-19 pandemic has introduced new risks for US CRE that many investors view as potentially acute. CMBS delinquency rates surged in May and June (but fell in July), led by accommodation and retail properties. And while multifamily and office delinquencies have so far remained low, many investors have questioned whether this can continue if recently enacted work from home policies become permanent and “urban flight” towards less populated and more affordable areas durably takes hold in major US cities. In this report we focus on the issue of WFH policies, the potential for urban flight, and the risk that these factors may pose to the CRE loans of small domestically-chartered US banks (sometimes informally referred to as “community banks”). There are arguments for and against the idea that work from home policies and/or migration out of city centers will have an extremely negative impact on office properties, but the truth is that it is currently a risk of largely unknown magnitude. It is not likely to be positive for owners of office properties, but it is yet unclear how negative it will be. As a result, we address the question as a “what if?” scenario, by stress testing small bank balance sheets. We conclude that the impact of potential WFH-driven CRE loan losses on the banking system is minor compared with the core risks facing the economy and its capital markets: The deeply negative impact of the COVID-19 pandemic on production and spending, and the risk that fiscal relief will fall short of what is required. Did COVID-19 Really Kill The Office? Chart 2Employers Found That Teleworking Worked Well
Working From Home, Urban Flight, And Commercial Real Estate Loans: How Bad Can Things Get?
Working From Home, Urban Flight, And Commercial Real Estate Loans: How Bad Can Things Get?
In mid-to-late March, COVID-19 was spreading rapidly in industrialized economies. Following recommended or mandatory stay at home orders from governments, most office-based businesses rapidly shifted to WFH arrangements as an emergency response. However, in the month or two following the beginning of stay at home orders, several national US surveys found many office workers preferred the flexibility afforded by WFH arrangements. Many employers, correspondingly, found that the productivity of their employees did not suffer while working from home, or that it even improved (Chart 2). These findings led many in the business community to conclude that WFH policies are not, in fact, emergency measures that will ultimately be reversed and instead reflect the “new normal” for work. The arrangement ostensibly appears to be a win-win scenario for workers and firms: Employees save time and money not commuting to the office and gain more control over their work schedules, and businesses save money on the rental or purchase of office space. The conclusion for many in the marketplace has thus been that “the office is dead,” with the focus shifting to the potential investment implications. When thinking about the potential consequences that permanent and widespread WFH options may have, there are two distinct issues that must be considered. The first is the degree to which these policies will push up office property vacancy rates, and the second is whether the availability of WFH policies will cause significant urban flight towards less populated and more affordable areas. On the margin, we agree that both events will occur at least to some degree, and thus are likely to be highly unwelcome developments for owners of prime central business district real estate. This is in line with the conclusions of a recent Special Report by my colleague Garry Evans.1 But there are at least a few arguments against the idea that these trends will occur en masse, or that they will spell economic disaster on their own: While surveys show that many employees expect to continue to work remotely after the pandemic ends, these results likely reflect the desire to retain some flexibility afforded by WFH policies. In terms of office property utilization, there is a large difference between an employee never working from an office again and permanently working from home one day per week, and many surveys that have been conducted on the topic are not structured to distinguish between the two. Surveys that specifically ask how long employees expect it will take for them to return to the office and that include “never” as a possible answer imply a considerably lower impact on office space utilization than other surveys would suggest (Chart 3). If the percentage of never-returning workers shown in Chart 3 (5%-7%) is accurate and maps closely to the expected rise in the office vacancy rate, Chart 4 highlights that the corresponding increase in vacancy would not be unprecedented: It rose from roughly 8% in 2000 to 17% in 2003, without causing a disastrous collapse in office property prices (they fell, but not enormously). Today the vacancy rate would be rising from a much higher level than in 2000, but the point is that very significant changes have occurred in the vacancy rate before without substantially destabilizing the office property market. Chart 3Employers Found That Teleworking Worked Well
Working From Home, Urban Flight, And Commercial Real Estate Loans: How Bad Can Things Get?
Working From Home, Urban Flight, And Commercial Real Estate Loans: How Bad Can Things Get?
For offices that reopen before the end of the pandemic, the need for physical distancing will act to at least somewhat restrain a rise in the vacancy rate over the coming several months, as it implies the need for more physical space per employee rather than less. Chart 4Large, Non-Impactful Rises In The Office Vacancy Rate Have Occurred Before
Large, Non-Impactful Rises In The Office Vacancy Rate Have Occurred Before
Large, Non-Impactful Rises In The Office Vacancy Rate Have Occurred Before
Some surveys suggest that Americans are already starting to change their minds about their desire to move out of the city. In April and early-May, upwards of 35%-40% of people responding to a Harris poll said that the pandemic made them want to live either in a rural area more than 21 miles outside of a major city or a suburb within 10 miles of a major city. As of late-July / early-August, that number had fallen to 26% (Chart 5), with only 9% reporting that it is “very likely.” This suggests that the end or reduction of lockdown measures may have returned a sense of normality for many Americans, and that the ultimate degree of urban flight may end up being considerably smaller than some investors expect. Chart 5Few People Say It Is Very Likely They Will Move Due To COVID-19
Working From Home, Urban Flight, And Commercial Real Estate Loans: How Bad Can Things Get?
Working From Home, Urban Flight, And Commercial Real Estate Loans: How Bad Can Things Get?
Finally, the example set by Facebook in May suggests that employees who wish to work from home permanently and relocate to more affordable areas will experience salary reductions, as part of a plan to “localize employees' compensation.”2 If adopted on a widespread basis among firms offering their employees the option to permanently work from home, localized compensation will very likely erode some of the cost advantages of moving to a cheaper area, and thus is likely to result in even fewer employees choosing permanent WFH arrangements. However, even after considering these arguments, the bottom line for investors is that no one truly knows what the office environment will look like as a result of COVID-19, because it hinges both on the evolution/resolution of the pandemic as well as potentially ephemeral human sentiment and behavior – both of which are extraordinarily difficult to predict with high accuracy. It is quite likely to be negative on balance for owners of office properties, but it is not yet clear whether it will be a marginal or catastrophic effect. As such, we agree that the chance of a major and lasting shock to the holders of US commercial real estate loans warrants a thorough investigation, focused on its potential to affect the stability of the US financial system. We first present an overview of CRE exposure for all US banks, and then examine in detail the risk facing small domestically-chartered US banks. Reviewing US Bank CRE Exposure Table 1 presents an overview of CRE loan exposure for domestically-chartered US banks from the Fed’s H.8 data release (Assets and Liabilities of Commercial Banks in the United States), as well as a breakdown in exposure for large and small banks. Investors should note that different definitions of “large banks” exist in the US, and in the H.8 release they are defined as the top 25 domestically-chartered banks ranked by domestic assets. Table 1Most US Commercial Real Estate Loans Are Held By Small Banks
Working From Home, Urban Flight, And Commercial Real Estate Loans: How Bad Can Things Get?
Working From Home, Urban Flight, And Commercial Real Estate Loans: How Bad Can Things Get?
Table 1 highlights two points. First, while CRE loans account for approximately 13% of total US domestically-chartered bank assets, exposure is clearly more concentrated for smaller banks than for the largest banks. CRE loans account for a full 1/4th of total assets for small banks, compared to just 6% for the top 25 domestic banks. Given this, the focus of our report will be on small rather than large bank exposure to CRE loans. Second, the table makes it clear that loans backed by nonfarm nonresidential structures account for just 2/3rds of total CRE exposure; the remaining exposure is to apartment buildings, construction and land development loans, and farmland. While not shown in Table 1, bank call reports also highlight that 1-4 family residential construction loans are included in the overall construction and land development category, accounting for up to 20% of those loans for small domestically-chartered banks. Chart 6Office Properties Make Up About 40% Of The Value Of Commercial Structures
Working From Home, Urban Flight, And Commercial Real Estate Loans: How Bad Can Things Get?
Working From Home, Urban Flight, And Commercial Real Estate Loans: How Bad Can Things Get?
Unfortunately, it is difficult to break down small bank nonfarm nonresidential structure exposure by property type from a top-down perspective. Chart 6 highlights that office properties (including all financial buildings) make up approximately 37% of the current-cost net stock of US nonresidential commercial and health care structures, whereas office loans make up approximately 30%-40% of those included in US commercial mortgage-backed securities. For the purposes of our analysis, we assume that 40% of small domestically-chartered US banks’ nonfarm nonresidential property loans are secured by office properties. Stress Testing Small US Banks The first step in stress testing small US bank CRE exposure is to simply apply the recent Dodd-Frank Act Stress Test (DFAST) that was focused on large banks to the approximately 5,100 small banks in the US. We use Q1 bank call reports (which we use as a pre-COVID benchmark) sourced from the Federal Financial Institutions Examination Council (FFIEC) to test the breadth of the impact on small banks, and include essentially all US banks in our list except the top 25 banks by assets (those designated as “large” in the Fed’s H.8 release). The Federal Reserve recently released the 2020 DFAST results, which examined the impact on capital ratios of 33 large US banks in a “severely adverse” economic scenario. The scenario modeled by the Fed resulted in $553 billion in projected losses on loans and other positions for the banks included in the test over a 2-year period, of which $433 billion were from accrual loan portfolios (Table 2). These projected loan losses corresponded to a 6.3% loan portfolio loss rate; for comparison, Chart 7 highlights that this would represent even higher losses than what occurred during the worst two-year period following the global financial crisis (Q1 2009 – Q4 2010) by roughly one percentage point. Table 2The Fed’s Recent Stress Test Modeled A 6.3% Loan Loss Rate Over 2 Years
Working From Home, Urban Flight, And Commercial Real Estate Loans: How Bad Can Things Get?
Working From Home, Urban Flight, And Commercial Real Estate Loans: How Bad Can Things Get?
Chart 7The Fed's Main Loss Scenario Is Meaningfully Worse Than What Occurred After 2008
The Fed's Main Loss Scenario Is Meaningfully Worse Than What Occurred After 2008
The Fed's Main Loss Scenario Is Meaningfully Worse Than What Occurred After 2008
In combination with additional provisioning, these assumed losses caused a 1.8% projected decline in the aggregate tier 1 capital ratio for the 33 firms participating in the stress test – from 13.6% to 11.8% – and a 1.7% projected decline in the common equity tier 1 capital ratio – from 12% to 10.3% (Table 3). While these declines are not trivial, they are far from a disastrous outcome for the US financial system. The capital ratios shown in Table 3 are relative to risk-weighted assets, and it is important to note that the projected change in capital ratios shown do not match the projected loan losses (plus provisioning) as a percent of risk-weighted assets. This is because projected losses are netted out against the banks’ projected pre-provision net revenue (“PPNR”) in the Fed’s exercise. In short, while the banks’ capital ratios declined roughly 2% in the DFAST scenario, simulated loan losses amounted to roughly 4% of risk-weighted assets and about 1/3rd of tier 1 common equity capital. Table 3Large Bank Capital Ratios Fell In The Stress Test, But Not Dramatically So
Working From Home, Urban Flight, And Commercial Real Estate Loans: How Bad Can Things Get?
Working From Home, Urban Flight, And Commercial Real Estate Loans: How Bad Can Things Get?
To avoid the need to project PPNR for thousands of small US banks, we use these loan loss metrics (4% of risk-weighted assets and 33% of tier 1 common equity capital) from the 2020 DFAST to represent whether any individual small bank would likely have to raise capital. We also use the overall portfolio loan loss rate of 6.3% to stress small bank balance sheets, rather than a set of loan loss rates by loan type. Chart 8In The Fed’s Main Stress Test Scenario, Many Small Banks Would Likely Have To Raise Capital
Working From Home, Urban Flight, And Commercial Real Estate Loans: How Bad Can Things Get?
Working From Home, Urban Flight, And Commercial Real Estate Loans: How Bad Can Things Get?
Chart 8 illustrates the number of small US banks that would “fail” the stated tier 1 common equity and risk-weighted asset thresholds given the DFAST assumptions. Roughly 64% of small banks would fail the equity test and 94% would fail the risk-weighted assets test. Weighting these results by bank assets rather than the number of banks does not generate a materially different result; instead, 63% and 97% of small bank assets would be held by banks failing the equity and risk-weighted assets tests, respectively. This exercise clearly highlights how much better capitalized large US banks are relative to smaller banks, and underscores that the existing forbearance programs and fiscal relief are essential to avoid a very widespread erosion in small bank capital. Still, of the nearly 5,100 banks included in our analysis, only 5 would see their equity capital wiped out by the simulated losses – meaning that while widespread capital raising and the accompanying tightening in lending standards would undoubtedly have a major impact on the economy and capital markets, the solvency of the US banking system is not in question in the scenario modeled by the Fed. Stress Testing Outsized CRE Losses As noted above, we employed the same average loan portfolio loss rate across all loan categories when testing the impact of the DFAST scenario on small banks, including commercial real estate loans. In order to gauge the specific risks facing commercial properties if recent WFH trends persist, we perform two additional exercises. First, we raise CRE loan losses beyond what was assumed in the DFAST scenario (see Box 1) while employing the same 6.3% loan loss rate on all other loan types to measure the incremental WFH effect on small bank balance sheets in a very negative economic scenario. Second, we examine a high CRE loan loss scenario alone, in order to isolate the potential impact of sustained WFH policies. Box 1Simulating Outsized CRE Loan Loss Rates
Working From Home, Urban Flight, And Commercial Real Estate Loans: How Bad Can Things Get?
Working From Home, Urban Flight, And Commercial Real Estate Loans: How Bad Can Things Get?
The assumptions detailed in Box 1 result in an overall CRE loan loss estimate of 11.1%, versus the 6.3% assumed in the DFAST. Chart 9 replicates the DFAST scenario shown in Chart 8 but with our outsized CRE loss rate, whereas Chart 10 highlights the isolated impact (i.e., without any losses assumed for other loan categories). Chart 9Adding Outsized CRE Loans To The Stress Test Scenario Only Moderately Increases “Failure”
Working From Home, Urban Flight, And Commercial Real Estate Loans: How Bad Can Things Get?
Working From Home, Urban Flight, And Commercial Real Estate Loans: How Bad Can Things Get?
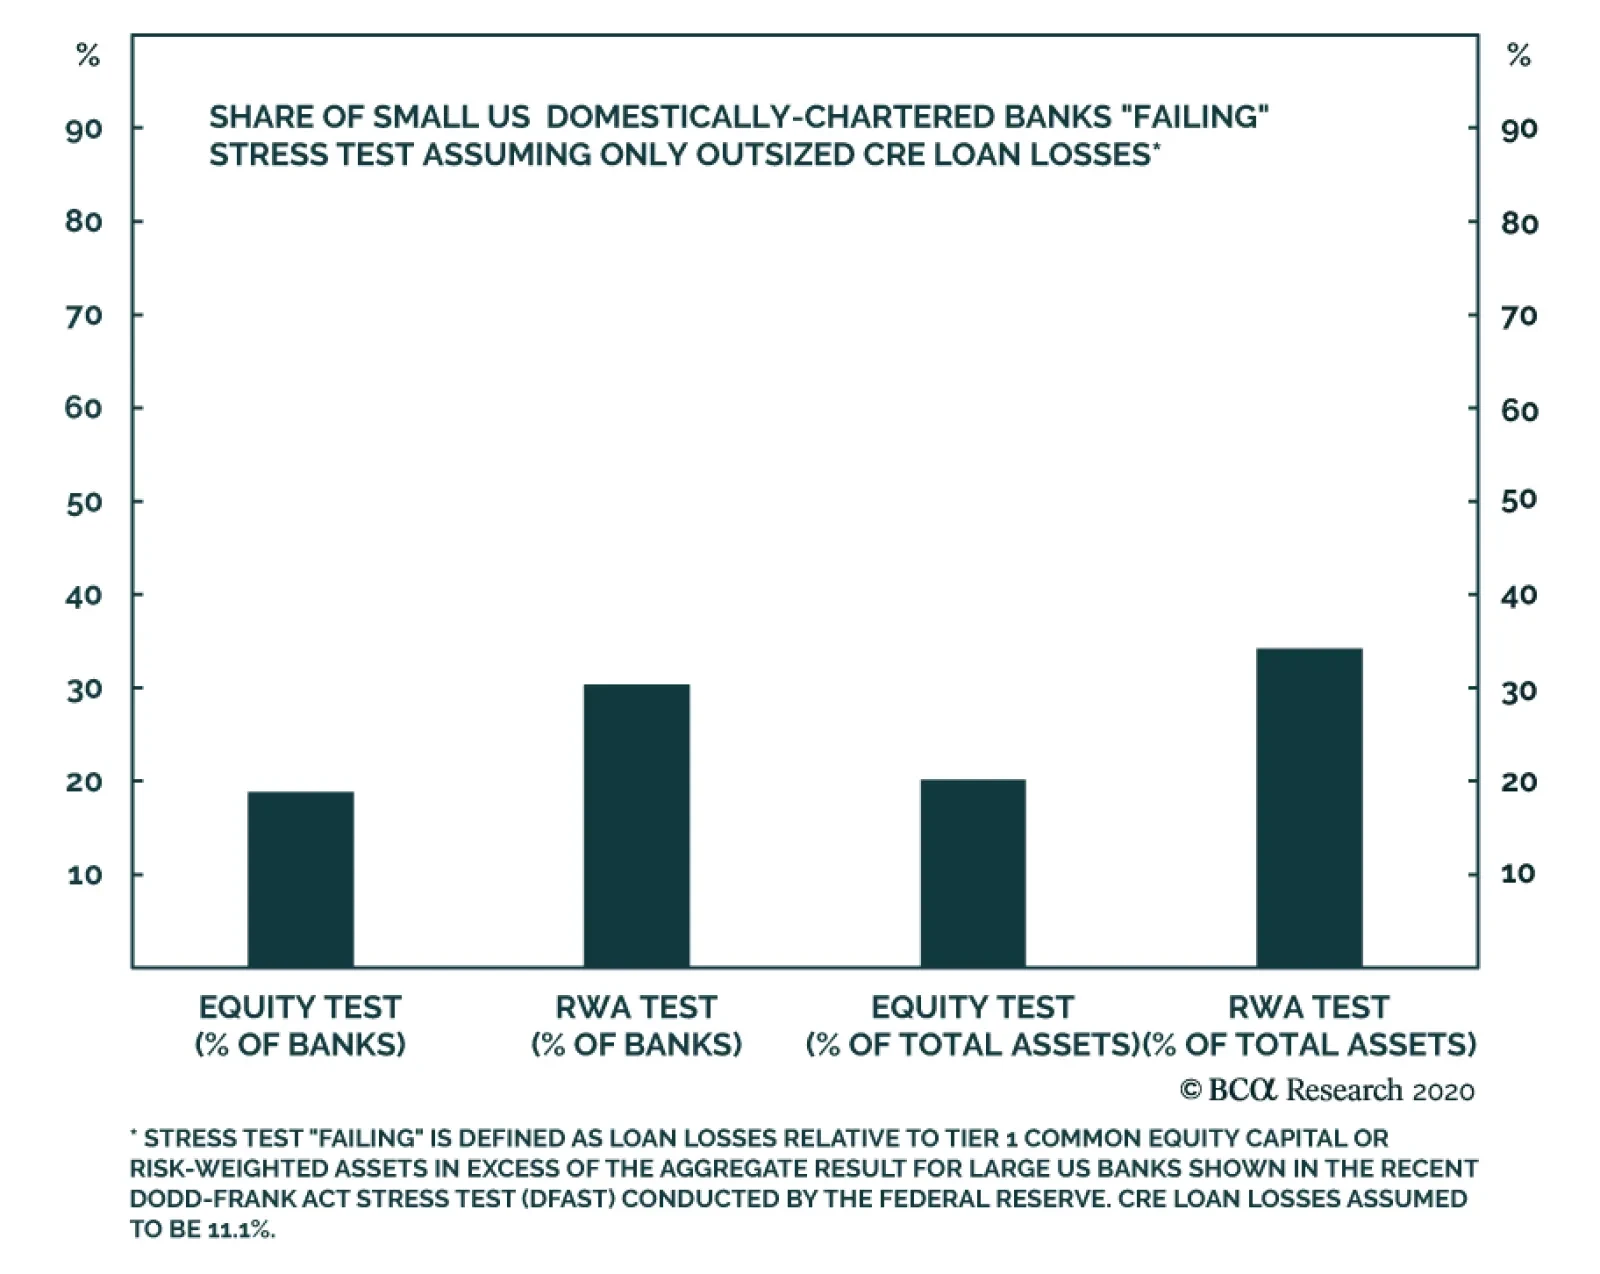
Chart 10Big CRE Losses Alone, With No Other Loan Losses, Would Be A Relatively Minor Problem
Working From Home, Urban Flight, And Commercial Real Estate Loans: How Bad Can Things Get?
Working From Home, Urban Flight, And Commercial Real Estate Loans: How Bad Can Things Get?
Two important observations emerge from Charts 9 and 10. First, despite the fact that small US banks carry disproportionately higher exposure to commercial real estate loans than large banks, it seems clear that the isolated effect of WFH policies on CRE loans, even in the extreme, do not amount to a major risk for the banking system. 80% of small US banks would pass our equity capital test, and 70% would pass the risk-weighted assets test, with absolutely devastating and unprecedented office and retail property losses but no losses outside of their commercial real estate portfolio. Second, while our outsized CRE losses would raise the number of banks that fail our equity capital test relative to the base DFAST scenario (from 64% to 74%), it is clear that this pales in comparison to the effect of the other loan losses assumed in the Fed’s stress test. The bottom line for investors is that while WFH policies may act as a “kicker” to severe pandemic-related bank loan losses were they to occur, it is clear that the latter is by far the core risk facing both the US economy and its financial system. Outsized Residential Real Estate Losses: The Elephant In The Room As noted above, the results shown in Charts 8 - 10 only include outsized losses on nonresidential CRE loans (excluding multifamily) in order to test the risk to bank balance sheets of widespread and continued use of highly permissive WFH policies and significantly reduced demand for office properties. On top of that, banks also face the risk of additional potential disruptions to residential real estate loans if the WFH phenomenon morphs into full-blown urban flight. In this scenario, migration out of densely-populated urban areas towards considerably cheaper suburbs and exurbs could possibly lead to significant house price declines in richly-valued metro-areas, leading in turn to defaults on underwater mortgages. Table 2 highlighted that the Fed’s base 2020 DFAST scenario assumed a 1.5% loan loss rate on first-lien mortgages, and a 3.1% loss rate on junior liens and HELOCs over a two-year period. Unfortunately for investors, it is exceedingly difficult to pinpoint the magnitude of urban migration that would be necessary to cause loss rates in line with the DFAST scenario or higher, forcing us to rely on an inferential approach based on historical example. Chart 11“White Flight” In The US: An Analogue For Urban Flight Today?
Working From Home, Urban Flight, And Commercial Real Estate Loans: How Bad Can Things Get?
Working From Home, Urban Flight, And Commercial Real Estate Loans: How Bad Can Things Get?
The only meaningful historical analogue that we can identify for the idea of WFH-driven urban flight is the “white flight” phenomenon that occurred in the US from the 1950s to 1970s. During this period, many white middle-class Americans moved from increasingly racially mixed city centers to racially homogenous suburban or exurban areas. The city of Detroit is often cited as an example of the "white flight" phenomenon. Chart 11 shows Detroit’s white population over time, and highlights the sharp decline in the number of white residents that occurred during the 1950s and 1960s. The white share of Detroit’s population fell earlier, beginning after WWII, but this mostly reflected larger increases of the non-white population. Actual “white flight” occurred during the 50s and 60s, when several episodes of racial violence occurred in the United States. In Detroit, this was most clearly epitomized by the 12th Street Riot in 1967, which involved Federal troop deployment and resulted in over 40 deaths and the damage or destruction of over 2,500 businesses. Did “white flight” cause widespread problems for urban housing markets and/or systemic stress in the banking system? Table 4 and Chart 12 suggest that the answer is no. Table 4 highlights that the median real house price in Michigan rose in the 1960s, grew faster than nationwide house prices, and was modestly higher than the national average in 1970. While it is very likely that this reflects outsized suburban house price gains and that urban center prices fell, Chart 12 highlights that there was no noticeable uptick in US banking failures as a share of total depository institutions in the 1960s. Chart 13 also highlights that the late-1960s did not exhibit any particularly unusual behavior for bank stock prices, after considering interest rates and the state of the business cycle. Table 4Real Michigan Home Prices “Outperformed” The US In The 60s
Working From Home, Urban Flight, And Commercial Real Estate Loans: How Bad Can Things Get?
Working From Home, Urban Flight, And Commercial Real Estate Loans: How Bad Can Things Get?
Chart 12No Uptick In Bank Failures In The 1960s
No Uptick In Bank Failures In The 1960s
No Uptick In Bank Failures In The 1960s
Chart 13No Unusual Bank Underperformance In The 1960s
No Unusual Bank Underperformance In The 1960s
No Unusual Bank Underperformance In The 1960s
The US economy is very different today than it was in the 1960s, and it is possible that “white flight” serves as an insufficient analogue for potential urban flight today. It is also true that real house prices today are considerably higher than in the 1960s and thus have room to fall further. Nevertheless, based on the Detroit experience, our best inference (for now) is that urban flight does not pose a risk of outsized mortgage loan losses for banks. This is reinforced by the fact that mortgage interest rates have fallen to a record low and have the potential to fall even further based on their spread to 30-year Treasury yields (Chart 14), which may act to boost house prices outright or cushion any potential declines. Chart 14Low And Potentially Lower Mortgage Rates Will Help Cushion Any House Prices Declines
Low And Potentially Lower Mortgage Rates Will Help Cushion Any House Prices Declines
Low And Potentially Lower Mortgage Rates Will Help Cushion Any House Prices Declines
Is The Real Risk To Cities Urban Flight, Or Urban Blight? In our view, the city of Detroit is a useful case study for two reasons. First, as noted above, it provides us with some sense of whether urban flight has the potential to pose a systemic threat to the financial system. But, second, it also serves as an example of another potential risk of the COVID-19 pandemic: urban “blight,” or decay. Chart 15Progressive Post-War Deindustrialization Hammered Cities Like Detroit
Progressive Post-War Deindustrialization Hammered Cities Like Detroit
Progressive Post-War Deindustrialization Hammered Cities Like Detroit
The economic and sociological decay of the city of Detroit has taken place over several decades and has been caused by multiple factors whose relative importance is still debated today. But broadly-speaking, Detroit’s decline can be boiled down to three interacting and self-reinforcing sets of factors: Sociological factors: the general post-WWII trend towards suburbanization, rising levels of violent crime, the “white flight” phenomenon, and the outright decline in Detroit’s population that began in the 1950s; Economic factors: the progressive deindustrialization of the US economy that began in the early 1950s, as well as the debilitating effects of high inflation and energy prices in the 1970s and the double-dip recession of the early-1980s on manufacturing employment (Chart 15); Policy factors: the negative impact on city finances, tax competitiveness, and service quality from the previous two factors, as well as poor governance and outright corruption. Even if large-scale urban flight does not initially occur due to time-saving WFH policies or pandemic-related health & safety concerns, there are some worrying parallels to Detroit’s experience that could play out over the coming few years in America’s cities that could cause similarly self-reinforcing effects if not prevented by policymakers. On the economic front, very acute income and wealth inequality arrayed against stout house price gains over the past decade have made home ownership unaffordable for some, increasing the allure of urban flight even if localized compensation programs apply. In addition, the pandemic has most severely affected small retail businesses, raising the specter of a “hollowed out” or abandoned urban retail landscape which could push consumers to avoid shopping and travelling downtown. On the policy front, there is a clear risk that inadequate state & local government funding could contribute to a potential downward spiral of higher taxes, reduced city services, and economic decay – similar to what occurred in Detroit. Chart 16 highlights that the financial situation of state & local governments following the global financial crisis caused persistent fiscal drag for several years into the expansion that followed. This significant fiscal drag contributed importantly to the subpar nature of the expansion, and the odds that this will occur again without federal funding are high. Chart 16 shows that the contribution to real GDP growth from state & local government spending has again turned negative, and the US Center on Budget and Policy Priorities is currently forecasting state budget shortfalls of approximately $555 billion over state fiscal years 2020-2022 – in line with the $510 billion cumulative shortfall that occurred from 2009-2011.4 Finally, in this scenario, the sociological factor somewhat mimicking Detroit’s experience could be a significant rise in urban crime (especially if violent). This could cause urban flight for reasons totally unrelated to WFH policies, but if it occurred it would likely reinforce both the failure of urban center businesses and the deterioration in state & local government finances (risking a downward spiral). Chart 17 highlights that murders have already significantly increased this year in major American cities (by mid-year) relative to 2019, although other types of violent crimes have fallen.5 A trend of rising urban crime could also be sparked or accelerated if recent calls to cut police department funding in favor of other social services succeed, and if those newly funded initiatives fail to effectively prevent criminal activity. Chart 16Persistent State & Local Fiscal Drag Must Be Prevented This Time
Persistent State & Local Fiscal Drag Must Be Prevented This Time
Persistent State & Local Fiscal Drag Must Be Prevented This Time
Chart 17Will US Cities Become Unsafe?
Working From Home, Urban Flight, And Commercial Real Estate Loans: How Bad Can Things Get?
Working From Home, Urban Flight, And Commercial Real Estate Loans: How Bad Can Things Get?
While this scenario is far from our base case view, it underscores how urban flight and the accompanying second round effects on commercial real estate loans and the banking system could occur following the pandemic even if not triggered by WFH policies. It also underscores the great importance of Federal fiscal relief efforts: not only to households and businesses, but as well to state & local governments. Investment Conclusions Our analysis above points to three main investment conclusions: First, while there are arguments for and against the idea of significant CRE losses stemming from the widespread adoption of permanent WFH policies and the potential for large-scale urban flight, the uncertainty surrounding the question will likely linger for the coming few months, at a minimum. This suggests that the equity risk premium applied to bank stock prices may remain elevated in the near term. Chart 18Large US Banks Unduly Cheap
Large US Banks Unduly Cheap
Large US Banks Unduly Cheap
Second, while large-cap banks may struggle to outperform in the near term due to this elevated risk premium, it is clear that large banks are far less susceptible than small banks to not only potential CRE loan losses, but also to the severely adverse economic scenario modeled in the Fed’s recent stress test. Our calculations suggest that large bank capital ratios would only marginally decline from the ending ratios shown in the DFAST scenario even with the outsized CRE loan loss scenarios that we used to stress test small bank balance sheets, and we highlighted how the Fed’s main stress test scenario involved 2-year loan losses in excess of what occurred in 2009-2010. Consequently, the collapse in large-cap bank valuation ratios seems unwarranted (Chart 18), and we would expect large banks to outperform the broad market at some point over the coming 6-12 months (and possibly even over the coming 0-3 months). This is also consistent with our expectation that value stocks are likely to outperform growth stocks at some point over the coming year.6 Third, while investors are often right to ask what risk they are “missing,” our analysis above highlights that the impact of potential WFH-driven CRE loan losses on the banking system is minor compared with the core risk facing the economy and its capital markets: The deeply negative impact of the COVID-19 pandemic on production and spending, and the risk that fiscal relief will fall short of what is required. This need for relief extends very significantly to state & local governments, and a failure to adequately resolve the substantial state budget shortfalls that will occur due to the pandemic and its aftermath would all but guarantee a repeat of the persistent fiscal drag that contributed to the subpar nature of the recent economic expansion. Our base case view remains that US policymakers will do what is necessary to avoid a very negative economic outcome and that the hiccup in congressional negotiations is temporary, but the possibility of inadequate fiscal support is the chief risk to our positive cyclical stance towards risk assets and must be continually monitored by investors over the next several months. Stay tuned! Jonathan LaBerge, CFA Vice President Special Reports Footnotes 1 Please see Global Asset Allocation / Global Investment Strategy Special Report, “The World After COVID-19: What Will Change, What Will Not?” dated August 7, 2020. 2 “Facebook employees could receive pay cuts as they continue to work from home,” USA Today, dated May 21, 2020. 3 Please see US Investment Strategy Special Report, “Mallpocalypse, Part 1: An Overnight Collapse Decades In The Making,” dated August 17, 2020 for the first of two reports presenting a detailed analysis of the challenges facing US retail properties. 4 Elizabeth McNichol and Michael Leachman, “States Continue to Face Large Shortfalls Due to COVID-19 Effects,” Center on Budget and Policy Priorities, Updated July 7, 2020. 5 Jeff Asher and Ben Horwitz, “It’s Been ‘Such a Weird Year.’ That’s Also Reflected in Crime Statistics.,” The New York Times, Updated August 24, 2020. 6 Please see Global Investment Strategy Weekly Report, “The Return Of Nasdog,” dated August 21, 2020. Global Investment Strategy View Matrix
Working From Home, Urban Flight, And Commercial Real Estate Loans: How Bad Can Things Get?
Working From Home, Urban Flight, And Commercial Real Estate Loans: How Bad Can Things Get?
Current MacroQuant Model Scores
Working From Home, Urban Flight, And Commercial Real Estate Loans: How Bad Can Things Get?
Working From Home, Urban Flight, And Commercial Real Estate Loans: How Bad Can Things Get?
Highlights The strength in global semiconductor sales in recent months has been due to one-off factors stemming from pandemic-related lockdowns. As the one-off demand surge subsides, global semiconductor sales will decline modestly toward the end of this year. In the near term, global semiconductor stock prices are vulnerable due to overbought conditions, excessive valuations and demand disappointment. The global semiconductor industry is at the epicenter of the US-China confrontation, and more US restrictions on chips sales to China are probable. This is another risk for this sector's share prices. Nevertheless, the structural outlook for global semiconductor demand is constructive. Its CAGR may rise from 3% during 2014-2019 to 5% during 2020-2024. Feature Investor euphoria has taken hold of semiconductor stocks. Global semiconductor stock prices have skyrocketed by 68% from March lows and 96% from December 2018 lows. Meanwhile, global semiconductor sales during March-June rose only by 5% from a year ago. As a result, the ratio of market cap for global semiconductor stocks relative to global semiconductor sales has reached its highest level since at least the inception of data in 2003 (Chart II-1). Chart II-1Global Semi Sector: Market Cap-To-Sales Ratio Has Surged
Global Semi Sector: Market Cap-To-Sales Ratio Has Surged
Global Semi Sector: Market Cap-To-Sales Ratio Has Surged
With semi equity multiples very elevated, their share prices have become even more sensitive to global semiconductor demand growth. Hence, the focus of this report is to try to gauge the strength of global semiconductor demand, both in the near term and structurally. The strength in global semiconductor sales in recent months has been due to one-off factors stemming from the lockdowns. Near-term semiconductor stock prices could disappoint due to weak chip demand from the smartphone sector and diminishing purchases of personal computers (PCs) and servers. However, structurally, we are positive on global semiconductor demand, which is underpinned by the continuing rollout of 5G networks and phones, a wider adoption of data centers, and further technological advancements in artificial intelligence (AI), cloud computing, edge computing and smaller nodes for chip manufacturing (Box II-1). Box II-1 Key Technologies Underpinning Potential Global Semiconductor Demand AI refers to the simulation of human intelligence in machines, for example, computers that play chess and self-driving cars. The goals of AI include learning, reasoning and perception. Cloud computing is the delivery of computing services – including servers, storage, databases, networking, software, analytics and intelligence – over the Internet (“the cloud”) to offer faster innovation, flexible resources and economies of scale. Edge computing is a form of distributed computing, which brings computation and data storage closer to where it is needed, to improve response times and save bandwidth. Technology node refers to the width of line that can be processed with a minimum width in the semiconductor manufacturing industry, such as technology nodes of 10 nanometers (nm), 7nm, 5nm and 3nm. The smaller the nodes are, the more advanced they are. Near-Term Headwinds Semiconductor demand worldwide grew by 6% year-on-year in the first half of this year. There has been a remarkable divergence between world semiconductor sales and the global business cycle (Chart II-2). The divergence between semiconductor sales and economic activity was most striking in the US and China. Semiconductor sales in China rose by 5% year-on-year in Q12020, and in the US they grew by 29% year-on-year in Q22020, despite a contraction in their aggregate demand during the same period. By contrast, Q2 annual growth of semiconductors sales was -2.2% for Japan, -17% for Europe and 1.8% for Asia ex. China and Japan (Chart II-3). Chart II-2World Semi Sales Diverged From The Global Business Cycle
World Semi Sales Diverged From The Global Business Cycle
World Semi Sales Diverged From The Global Business Cycle
Chart II-3Strong Semi Sales In The US And China, But Not Elsewhere
Strong Semi Sales In The US And China, But Not Elsewhere
Strong Semi Sales In The US And China, But Not Elsewhere
The reasons why the US and China posted a surge in semiconductor demand while Europe and Japan experienced a contraction in domestic semiconductor sales are as follows: Most data center investment is occurring in the US and China. Chart II-4 shows that 40% of global hyperscale data centers are operating in the US, much larger than any other countries/regions. China, in turn, ranked second, with a global share of 8%. Chart II-4The US Has The Most Global Hyperscale Data Centers
September 2020
September 2020
Demand contraction in Europe and Japan is due to semiconductor demand in these regions mainly originating from the automobile sector, where production was severely hit by the global pandemic. About 37% of European semiconductor sales were from last year’s automotive market. We believe the divergence between global economic activity and semiconductor sales, as demonstrated by Chart II-2 on page 3, has been due to one-off factors, as the global pandemic lockdowns have spurred semiconductor demand. Such a one-off demand boost will likely dissipate in the coming months. Traditional PCs and tablets: There has been a surge in demand for traditional PCs1 and tablets in the past six months. This was due to the significant increase in online activities, such as working from home, education, e-commerce, gaming and entertainment. Data from the International Data Corporation (IDC) has revealed that shipments of traditional PCs and tablets in volume terms had a strong year-on-year growth of 11.2% and 18.6%, respectively, in the period of April-June (Chart II-5). Looking forward, even renewed lockdowns will not lead to a similar rush to buy these products. Many households are already equipped to work from home and for other online activities. With many countries gradually opening their economies, such demand will diminish. The traditional PC and tablet sectors together account for about 13% of global chip demand (Chart II-6). Chart II-5Personal Computers Sales Have Surged Amid Lockdowns
Personal Computers Sales Have Surged Amid Lockdowns
Personal Computers Sales Have Surged Amid Lockdowns
Server demand: Another major semiconductor demand contribution in Q2020 was from the server sector, which spiked by 21% year-on-year (Chart II-7). The surge in online activities triggered a strong demand for cloud services and remote work applications, both of which require computer servers to run on. Chart II-6The Breakdown Of Global Semiconductor Sales By Type Of Usage
September 2020
September 2020
However, demand from the server sector is also set to diminish in 2H2020 and Q1 2021. Provided the inventories at major data center operators, including Microsoft, Google and Amazon, remain at high levels,2 global cloud service providers will likely reduce their orders of servers next quarter.3 Enterprises will also likely cut their investment in computer servers in 2H2020, as many of them had already increased their purchases of servers to prepare employees and business processes for remote working. We expect global server demand growth to soften in 2H2020. The Digitimes Research forecasted a 5.6% quarter-on-quarter contraction in 3Q2020 and a further cut in global sever shipment in the 4Q2020.2 The global server sector accounts for about 10% of global chip demand and, together with PCs and tablets, they make for 23% (please refer to Chart II-6 on page 5). Further, the smartphone sector – accounting for 27% of global semiconductor demand – will continue struggling in H2 this year. Chart II-7Server Sales Have Surged Amid Lockdowns
Server Sales Have Surged Amid Lockdowns
Server Sales Have Surged Amid Lockdowns
Chart II-8Global Smartphone Shipments Will Likely Remain Weak In 2020H2
Global Smartphone Shipments Will Likely Remain Weak In 2020H2
Global Smartphone Shipments Will Likely Remain Weak In 2020H2
The global total smartphone demand has been hit severely, as households delayed their new smartphone purchases. According to Canalys’ data, global smartphone shipments dropped by 13% and 14% year-on-year in Q1 and Q2, respectively. We expect smartphone shipments to continue contracting over the next three-to-six months (Chart II-8). We believe global consumers will remain cautious in their spending on discretionary goods, such as smartphones, due to lowered incomes and increased job uncertainty. The IDC also forecasted that global smartphone shipments would not grow until 1Q2021.4 The Chinese smartphone sales showed a considerable weakness in July, with a 35% year-on-year contraction, which is much deeper than the 20% decline in H1 this year. 5G smartphone shipments also slowed last month, with a 21% drop from the previous month. The global semiconductor industry is at the epicenter of the US-China confrontation. Bottom Line: The strength in global semiconductor sales in recent months has been due to one-off factors stemming from the lockdowns. As this one-off demand subsides, global semiconductor sales will decline modestly toward the end of this year. Given the overbought conditions and the elevated equity valuations, global semiconductor stocks are currently vulnerable to near-term disappointments in semiconductor demand. At The Epicenter Of The US-China Rivalry Semiconductors are at the epicenter of the US-China confrontation. Ultimately, the US-China contention is about future technological dominance. That is access to technology and the capability to develop new technologies. China currently accounts for about 35% of the global semiconductor demand. US restrictions on semi producers worldwide to supply semiconductors to Chinese buyers constitute a major risk to semiconductor stock prices. On August 17, the US announced fresh sanctions that restrict all US and foreign semiconductor companies from selling chips developed or produced using US software or technology to Huawei, without first obtaining a license. In May, the US had already limited companies, such as the Taiwan Semiconductor Manufacturing Company (TSMC), from making and supplying Huawei with its self-designed chips. In addition, the US recently threatened bans on Chinese-owned apps TikTok and WeChat, and signaled that it could soon restrict Alibaba’s operations in the US. Chart II-9Global Semi Companies' Sales To China Are Substantial
September 2020
September 2020
The global semiconductor sector is highly vulnerable to further escalation in the tension between these two superpowers. Major global semiconductor companies’ sales are heavily exposed to China, and their revenue from China ranges from 16% to 50% of total (Chart II-9). We have been puzzled why global semi share prices have been rallying in spite of US limitations on semiconductor shipments to Huawei and its affiliated entities. One explanation could be that the Chinese companies that are not affiliated with Huawei are able to import semiconductors and then supply them to Huawei. If this is true, the US will have no other choice but to limit all semiconductor sales to China. This will be devastating for global semi producers given their large exposure to China. In anticipation of US punitive policies limiting its access to semiconductors, China had boosted its semiconductor imports over the past 12 months (Chart II-10, top panel). Chinese imports of integrated circuits rose by 12% year-on-year in 1H2020, which is much higher than the 5% year-on-year increase in Chinese semiconductor demand during the same period (Chart II-10, bottom panel). This gap suggests the country had restocked its semiconductor inventories. China has particularly restocked its imports of non-memory chips with imports of processor & controller and other non-memory chips in H1, surging by 30% and 20%, respectively, in US dollar terms (Chart II-11). For memory chips, the contraction in Chinese imports was mainly due to a decline in global memory chip prices. Chart II-10China Had Likely Restocked Its Semi Inventories
China Had Likely Restocked Its Semi Inventories
China Had Likely Restocked Its Semi Inventories
Chart II-11Strong Chinese Imports In Non-Memory Chips
Strong Chinese Imports In Non-Memory Chips
Strong Chinese Imports In Non-Memory Chips
Bottom Line: The global semiconductor industry is at the epicenter of the US-China confrontation, and more restrictions on sales to China are probable. In turn, the restocked semiconductor inventory in China raises the odds of weakening mainland semiconductor import demand in H2 of this year. Structural Tailwinds Table II-1Global Semiconductor Demand CAGR Forecast Over 2020-2024 By Device
September 2020
September 2020
We are optimistic on structural global semiconductor demand. Its nominal CAGR may rise from 3% during 2014-2019 to 5% during 2020-2024 in US dollar terms. Table II-1 shows our demand growth forecasts for global chips in the main consuming sectors over the next five years. The major contributing sectors during 2020-2024 will be 5G smartphones, servers, industrials, electronics and automotive manufacturing. The underlying driving forces are the continuing rollout of 5G networks and phones, the development of data centers, and further technological advancements in AI, cloud computing and edge computing. Currently, the world is still in the early stages of 5G network development. AI, cloud computing and edge computing are constantly evolving. With increasing adoption of 5G smartphones, computer servers and IoT devices, global semiconductor demand is in a structural uptrend (Box II-2). Box II-2 Key Components For The Virtual World In Development Data centers and cloud computing allow data to be stored and applications to be running off-premises and to be accessed remotely through the internet. Edge computing allows data from Internet of things (IoT) devices to be analyzed at the edge of the network before being sent to a data center or cloud. IoT devices contain sensors and mini-computer processors that act on the data collected by the sensors via machine learning. The IoT is a growing system of billions of devices — or things — worldwide that connect to the internet and to each other through wireless networks. AI technology empowers cloud computing, edge computing and IoT devices. 5G is at the heart of the IoT industry transformation, making a world of everything connected possible. Chart II-125G Phone Shipments In China Will Continue To Rise
5G Phone Shipments In China Will Continue To Rise
5G Phone Shipments In China Will Continue To Rise
5G Smartphone Currently, China is the world’s largest 5G-smartphone consumer and the leading 5G-adopter in the world. According to Digitimes Research, global 5G smartphone shipments will reach over 250 million units in 2020, with 170 million (68%) in China and only 80 million units in the world ex. China. Looking forward, 5G smartphone shipments are set to accelerate worldwide over the coming years. The 5G phone shipments in China will continue to rise. The 5G phone sales penetration rate in China is likely to rise from 60% in July to 95% by the end of 2022. In such a case, we estimate that the monthly Chinese 5G phone shipments will increase from the current 16 million units to about 25-30 million units in 2022 (Chart II-12). In the rest of the world, the 5G smartphone adoption pace will also likely speed up over the next five years. The 5G phone selling prices in the world outside China will drop, as more models are introduced and become more affordable. 5G smartphone prices have already fallen in China and will inevitably fall elsewhere. Chinese 5G smartphone producers will ship their low-priced 5G phones overseas, putting pressure on other producers to lower their prices. The 5G infrastructure development is accelerating in China and will accelerate in the rest of the world. Both China and South Korea have been very aggressive in their respective 5G network development. As of the end of June, China's top three carriers: China Mobile, China Unicom, and China Telecom – which together serve more than 1.6 billion mobile users in the country – had installed 400,000 5G base stations against an annual target of 500,000. In comparison, as of April 2020, American carriers had only put up about 10,000 5G base stations.5 As the US is competing with China on the 5G front, the country will likely boost its investment in 5G network development aggressively over the next five years in order to catch up to, or even exceed, China. Importantly, the 5G smartphone has more silicon content than 4G smartphones. More silicon content means higher semiconductor value. Rising 5G smartphone sales and higher silicon content together will more than offset the loss in semiconductor sales due to falling global 4G smartphone shipments. Overall, global semiconductor stock prices have diverged from their sales and profits. Based on our analysis, we expect a CAGR growth of 4% in semiconductor demand from the global smartphone sector over the next five years, slightly lower than the 5% in previous five years (Table II-1 on page 10). This also takes into consideration that the 5G network will be more difficult and more expensive to develop than the 4G network. Servers Global server shipment growth will be highly dependent on both the pace and the scale of data center development (Box II-3). Data centers account for over 60% of global server demand. Box II-3 Data Centers There are four main types of data centers – enterprise data centers, managed services data centers, colocation data centers, and cloud data centers. Data centers can have a wide range of number of servers. Corporate data centers tend to have either 200 (small companies), or 1000 servers (large companies). In comparison, a hyperscale data center usually has a minimum of 5,000 servers linked with an ultra-high speed, high fiber count network. Outsourcing and a move towards the cloud are driving the growth of the hyperscale data center. Instead of companies investing in physical hardware, they can rent server space from a cloud provider to both save their data and reduce costs. Amazon, Microsoft, Google, Apple and Alibaba are all top global cloud service providers. The more hyperscales to be built up, the higher the demand for servers. In 2019, about 13% of the total number of data centers in China were of the hyperscale and large-scale varieties. The plan of new infrastructure development announced earlier this year by Beijing was aiming to increase the number of hyperscale and large-scale data centers in China. Among current data centers either under construction or to be developed in the near future, 36% of them are hyperscale and large-scale data centers. The future growth of data centers is promising. The global trend of data localization6 due to the concerns of data privacy and national security will also bolster a boom of data centers over the next five years. A growing number of countries are adopting data localization requirements, such as China, Russia, Indonesia, Nigeria, Vietnam and some EU countries. While the Chinese data center market is expected to expand by a CAGR of about 28% over 2020-2022,7 a report recently released by Technavio forecasted the global data center industry’s CAGR at over 17% during 2019-2023. We forecast that the global semiconductor demand from servers will grow at a CAGR of 12% over 2020-2024. IoTs Technological advancements in AI, cloud computing and edge computing, in combination with 5G network development, will facilitate the IoTs adoption. According to the GSMA,8 46 operators in 24 markets had launched commercially available 5G networks by 30 January 2020. It forecasted that global IoT connections will be increased from 12 billion mobile devices in 2019 to 25 billion in 2025 with a CAGR at 13%.9 IoTs chips include the Artificial Intelligence of Things (AIoT) – a powerful convergence of AI and the IoT. IoTs is an interconnected network of physical devices. Every device in the IoT is capable of collecting and transferring data through the network. Looking forward, global demand of AI chips and IoT chips will have significant potential to grow with creation of “smarter manufacturing”, “smarter buildings”, “smarter cities”, etc. AI applications can be used in manufacturing processes to render them smarter and more automated. Productivity will be enhanced as machines achieve significantly improved uptime while also reducing labor costs. There are plenty of upsides in industrial semiconductor demand (Chart II-13). We expect the CAGR of industrial electronics to increase from 3.4% during 2014-2019 to 8% during 2020-2024. AI applications can create smart buildings by increasing connectivity across enterprise assets, enabling home network infrastructure (e.g., routers and extenders) and employing home-security devices (e.g., cameras, alarms and locks). AI applications can be used to create smart cities. A smart city is an urban area that uses different types of IoT electronic sensors to collect data. Insights gained from that data are used to manage assets, resources and services efficiently; in return, that data is used improve operations across the city. China has already developed about 750 trial sites of smart cities with different degrees of smartness in the past decade. As AI and 5G technology advances, the existing smart cities’ “smartness” will be upgraded and new trial smart cities will be implemented. Based on IDC data, China’s investment in smart cities will rise at a CAGR of 13.5% over 2020-2023 (Chart II-14). Globally, the U.S., Japan, European countries and other nations are also actively developing smart cities. According to a new study conducted by Grand View Research, the global smart cities market size is expected to grow at a CAGR of 24.7% from 2020 to 2027.10 Chart II-13Plenty Of Upside In Industrial Semi Demand
Plenty Of Upside In Industrial Semi Demand
Plenty Of Upside In Industrial Semi Demand
Chart II-14China’s Investment In Smart Cities Will Continue To Grow
September 2020
September 2020
Automotive We expect the global automotive chip market to grow at a CAGR of 9% during 2020-2024, as in 2014-2019. The increase in consumption of semiconductors by the auto industry will continue to be driven by the market evolution toward autonomous, connected, electric and shared mobility. Most new vehicles now include some level of advanced driver assist systems (ADAS), such as adaptive cruise control, automatic brakes, blind spot monitoring, and parallel parking. The whole industry is progressing toward fully autonomous vehicles in the coming years. Increasing adoption of automotive chips and recovering car sales will revive automotive chip sales. In addition, rising penetration of new energy vehicles (NEVs) is beneficial to semiconductor sales, as NEVs contain higher semiconductor content than conventional vehicles. Conventional vehicles contain an average of a $330 value of semiconductor content while hybrid electric vehicles can contain up to $1,000 and $3,500 worth of semiconductors.11 Regarding other sectors, we are also positive on structural demand of storage and consumer electronics. AI applications generate vast volumes of data — about 80 exabytes per year, which is expected to increase by about tenfold to 845 exabytes by 2025.12 In addition, developers are now using more data in AI and deep learning (DL) training, which also increases storage requirements. With massive potential demand for storage, we estimate a CAGR of 7% over 2020-2024 (Table II-1 on page 10). A recent report from ABI Research predicts that the COVID-19 pandemic will increase global sales of wearables (such as a Fitbit or Apple Watch) by 29% to 30 million shipments of the devices this year. With contribution from wearables, we expect global semiconductor demand from the consumer sector to grow at a CAGR of 3% over 2020-2024, the same rate as in the previous five years. Bottom Line: Continuing rollout of 5G networks and phones, development of data centers, and further technological advancements in AI and cloud computing will provide tailwinds to structural global semiconductor demand, accelerating its CAGR growth from 3% during 2014-2019 to 5% during 2020-2024. Valuations And Investment Conclusions Most global semiconductor stocks are currently over-hyped. Critically, both DRAM and NAND prices have been deflating since January, reflecting weak demand for memory chips. Yet, share prices of memory producers have rallied (Chart II-15). Overall, global semiconductor stock prices have diverged from their sales and profits (Chart II-16). Chart II-15Falling Memory Prices Pose Risk To Memory Stocks
Falling Memory Prices Pose Risk To Memory Stocks
Falling Memory Prices Pose Risk To Memory Stocks
Chart II-16Global Semiconductor Stocks Have Deviated From Profits
Global Semiconductor Stocks Have Deviated From Profits
Global Semiconductor Stocks Have Deviated From Profits
Consequently, the multiples of semiconductor stocks have spiked to multi-year highs (Chart II-17). Even after adjusting for negative US real bond yields, valuations of semiconductor stocks are not cheap. Chart II-18 illustrates the equity risk premium for global semiconductor stocks is at the lower end of its range of the past 10 years. The ERP is calculated as forward earnings yield minus 10-year US TIPS yields. Chart II-17Global Semi Stocks: Elevated Valuations
Global Semi Stocks: Elevated Valuations
Global Semi Stocks: Elevated Valuations
Chart II-18Equity Risk Premium For Global Semi Stocks Is Historically Low
Equity Risk Premium For Global Semi Stocks Is Historically Low
Equity Risk Premium For Global Semi Stocks Is Historically Low
It is impossible to time a correction or know what the trigger would be (US-China tensions have been our best guess). Nevertheless, we do not recommend chasing semiconductor stocks higher due to their overstretched technicals and valuations on the one hand and potential weakening demand in H2 on the other. In addition, the ratio of global semi equipment stock prices relative to the semi equity index correlates with absolute share prices of global semi companies. This is because equipment producers are higher-beta as they outperform during growth accelerations and underperform during growth slumps. The basis is that semi manufacturers have to purchase equipment if there is actual strong demand coming up and vice versa. The recent underperformance by global semi equipment stocks relative to the semi equity index might be an early sign of a potential reversal in semi share prices in absolute terms (Chart II-19). Chart II-19A Signal Of A Potential Reversal In Semi Share Prices
A Signal Of A Potential Reversal In Semi Share Prices
A Signal Of A Potential Reversal In Semi Share Prices
Meanwhile, we believe the subsector- memory chip stocks - will outperform the overall semiconductor index amidst the potential correction, because they have lagged and are less over-extended. Finally, we remain neutral on Taiwanese and Korean bourses within the EM equity space for now. Escalation in US-China confrontation, as well as their exposure to semiconductors, put these bourses at near-term risk. That said, we are reluctant to underweight these markets because fundamentals in EM outside North Asia remain challenging. Ellen JingYuan He Associate Vice President Emerging Markets Strategy Footnotes 1 Traditional PCs are comprised of desktops, notebooks, and workstations. 2 Global server shipments to contract 5.6% sequentially in 3Q2020, says Digitimes Research 3 Global server shipments forecast to increase by 5% this year: TrendForce 4 IDC Expects Worldwide Smartphone Shipments to Plummet 11.9% in 2020 Fueled by Ongoing COVID-19 Challenges 5 America does not want China to dominate 5G mobile networks 6 “Data localization” can be defined as the act of storing data on a device that is physically located within the country where the data was created. Data localization requirements are governmental obligations that explicitly mandate local storage of personal information or strongly encourage local storage through data protection laws that erect stringent legal compliance obligations on cross-border data transfers. 7 The big data center industry ushered in another outbreak 8 The GSMA represents the interests of mobile operators worldwide, uniting more than 750 operators with almost 400 companies in the broader mobile ecosystem, including handset and device makers, software companies, equipment providers and internet companies, as well as organizations in adjacent industry sectors. 9 GSMA: 5G Moves from Hype to Reality – but 4G Still King 10 Smart Cities Market Size Worth $463.9 billion By 2027 11 The Automotive Semiconductor Market – Key Determinants of U.S. Firm Competitiveness 12 AI is data Pac-Man. Winning requires a flashy new storage strategy.
Highlights A weak dollar and low bond yields have pushed up the S&P 500 more than anticipated. Cyclical forces favor loftier stock prices in 12 months. Froth creates short-term vulnerabilities that higher yields could catalyze. The lack of yield curve control along with an improving economic outlook and a decline in deflationary risks indicate that Treasury yields will move toward 1% in the coming months. Long-term investors should begin to add small-cap stocks to their core US holdings. Feature The S&P 500 recent all-time high flies in the face of a long list of tactical indicators that flag an elevated risk of correction. The strength of the US equity market is a testament to the power of policy stimulus, the perceived invincibility of tech titans and the hopes that the powerful economic recovery will continue. Although equities will climb in the coming year, a move up in yields should transfer the leadership from tech and growth stocks to value and traditional cyclicals. While these shifts usually do not spell the end of bull runs, often they generate periods of elevated volatility, especially when the displaced leaders account for 40% of market capitalization. Small-cap stocks look increasingly attractive. A Post Mortem We have been cyclically bullish since late March,1 but on June 25th we warned that the S&P 500 would churn between 2800 and 3200 for the rest of the summer.2 This view did not materialize for several reasons. We underestimated the impact of a weak dollar, which has given a second life to the equity bull market. When expressed in euros, the S&P 500 has been flat since June 5 (Chart I-1). Relative to gold, the S&P 500 is down by 9% since June 8, which further highlights how equities have been supported by a weak US currency and a plentiful money supply. Meanwhile, the S&P 500 has outperformed the EURO STOXX 50 by 7.8% since June 5; however, when we factor in the effect of the strong euro, US equities have steadily underperformed the Eurozone benchmark since early May (Chart I-1, bottom panel). Low bond yields have also buttressed US equities. Near-zero interest rates have allowed the valuation of growth stocks to hit extraordinary levels. The NASDAQ trades at 32-times 2020 earnings and 27-times 2021 EPS. The S&P tech is valued at 29-times 2020 EPS and 25-times next year’s profits. In the most extreme cases, the five tech stocks that have accounted for 31.7% of market gains since March 23 (Apple, Amazon, Microsoft, Alphabet and Facebook) trade on average at 40-times 2020 EPS and 32-times 2021 earnings. Low bond yields have also buttressed US equities. Importantly, COVID-19 has had a positive influence on these same tech stocks. According to our European Investment Strategy colleagues, while spending on restaurant, entertainment and retail collapsed during the pandemic, outlays surged on Amazon, Apple products, Netflix subscriptions, etc.3 At the apex of the crisis, online retail sales expanded by 26.3% annually in the US, while bricks-and-mortar sales contracted by an unprecedented -17.7%. Meanwhile, global shipments of personal computers and servers are expanding by 11.2% and 21.5% annually, respectively (Chart I-2, top panel). Therefore, the largest sector of the S&P 500 is outperforming relative to the rest of the market (Chat I-2, bottom panel). As long as investors continue to expect COVID-19 to affect consumer behavior, they will pay a premium for tech stocks that benefit from the pandemic. Chart I-1The Weak Dollar Is Fueling The Recent Rally
The Weak Dollar Is Fueling The Recent Rally
The Weak Dollar Is Fueling The Recent Rally
Chart I-2Earnings Have Supported Tech Stocks
Earnings Have Supported Tech Stocks
Earnings Have Supported Tech Stocks
Can Stocks Remain Unscathed? The outlook for stocks is positive, but near-term risks have not dissipated because short-term market conditions remain frothy. Watch for higher bond yields as the force to concretize the tactical risks. The following cyclical forces continue to act as crucial tailwinds for equities: The equity risk premium (ERP) remains low. Computations of ERP must factor in the expected expansion of earnings. To incorporate this alteration, we assume that long-term cash flows will grow in line with potential nominal GDP growth. However, we must also consider the absence of stability of the ERP’s mean. After this adjustment, the ERP is still consistent with significant additional gains for the S&P 500 (Chart I-3). Monetary policy is extraordinarily accommodative. Even when we account for the S&P 500’s elevated multiples, the exceptional jump in the BCA Monetary Indicator is large enough to push up equity prices (Chart I-4). Moreover, the strength of US housing activity indicators confirms that the Federal Reserve has pulled the right levers to boost domestic economic activity. For example, the NAHB Housing Market Index has reached a 22-year record, building permits in July grew at their fastest monthly rate in 30 years, and the Mortgage Applications Index for purchases rocketed to a 11-year high in August. Chart I-3A Low ERP Underpins Equities...
A Low ERP Underpins Equities...
A Low ERP Underpins Equities...
Chart I-4...So Does Monetary Policy
...So Does Monetary Policy
...So Does Monetary Policy
The US economy continues to heal. For stocks to climb further on a cyclical basis, the market will need more than five tech giants leading the charge. Hence, earnings expectations for the rest of the market must also mount. Practically, the economy must recover its output loss and the pandemic must ebb. For now, the four-week moving average of initial unemployment claims is drifting lower, and the ISM New Orders-to-Inventories spread is consistent with a faster and more solid business cycle upswing. The ERP is still consistent with significant additional gains for the S&P 500. The global industrial sector outlook is brightening. Manufacturing and trade disproportionately contribute to fluctuations in global economic activity, therefore, they exert an outsized influence on the earnings of non-tech multinationals. The strength in Singapore’s electronics shipments indicates that our Global Industrial Activity Nowcast will accelerate (Chart I-5, top panel). Moreover, the rapid expansion in China’s credit flows points to a marked increase in Chinese imports, which will help industrial and commodity exporters around the world (Chart I-5, bottom panel). Core producer prices have bottomed. Core producer prices are a direct input in the corporate sector’s pricing power. A trough in this inflation gauge leads to stronger EPS and widening profit margins for the S&P 500 (Chart I-6). Chart I-5The Global Industrial Cycle Is Turning The Corner
The Global Industrial Cycle Is Turning The Corner
The Global Industrial Cycle Is Turning The Corner
Chart I-6Easing Deflationary Pressures Will Help Profits
Easing Deflationary Pressures Will Help Profits
Easing Deflationary Pressures Will Help Profits
Investors should still wait to allocate new funds to the stock market. The stock market’s near-term outlook remains marked by short-term froth that dampens our cyclical optimism, especially because the market advance has been concentrated in a small group of equities. Chart I-7Tactical Froth
Tactical Froth
Tactical Froth
The Exposure Index of the National Association of Active Investment Managers has hit 100.1 (Chart I-7). Such a lofty reading indicates that the price of stocks already incorporates optimistic expectations. From a contrarian perspective, this development boosts the probability that swing traders will face disappointments in the near future and will sell their equity holdings. Similarly, the put/call ratio is near a 10-year low, which confirms that traders have bought a lot of upside exposure to stocks without much protection against a pullback. This level of confidence is often a precursor to a significant correction. Finally, our Tactical Strength Indicator is 1.7-sigma above its mean. Historically, when this risk gauge has hit a reading above 1.3, there is a good probability that the S&P 500 will correct or move sideways (Chart I-8). A catalyst must emerge for those aforementioned vulnerabilities to morph into a correction. If Treasury yields move closer to 1%, then stocks will experience a significant pullback of 10% or more as the market rotates away from the leadership of growth stocks. This risk would be especially salient if real yields move up. As Chart I-9 illustrates, falling TIPS yields have been a pillar of the powerful rally of growth stocks. Moreover, low real yields are arithmetically necessary to justify the current level of market multiples exhibited by the S&P 500 (Chart I-9, bottom panel). Chart I-8The S&P 500 Is Vulnerable To A Correction
The S&P 500 Is Vulnerable To A Correction
The S&P 500 Is Vulnerable To A Correction
Chart I-9Falling Real Yields Have Helped Growth Stocks
Falling Real Yields Have Helped Growth Stocks
Falling Real Yields Have Helped Growth Stocks
Growth and high-P/E ratio stocks are heavily represented in the tech and healthcare sectors, which together account for 42% of the S&P 500. This means that higher yields will likely temporarily drag down the entire market. Ultimately, leadership changes are painful events, but they rarely mark the end of bull markets. Can Yields Move Up? Chart I-10Positive Signs For Inflation
Positive Signs For Inflation
Positive Signs For Inflation
It is time to tweak our bond market view because yields should soon move higher. For the past five months, we have written that yields offer minimal downside and that their asymmetric risk profile made government bonds an unappealing investment. We underweighted this asset class relative to stocks and recommended investors bet on higher inflation breakeven rates. However, forces are aligning to expect real rates to rise and thus, nominal yields should move up. The sequencing of the market’s response to QE increasingly favors lower bond prices. Our US Equity Strategy team recently highlighted that in 2009 stocks were the first asset to reflect the implementation of QE1 by the Fed.4 A weaker dollar followed. Bond yields started to perk up only after the USD deteriorated by enough, after stock prices had climbed by enough and after corporate spreads had narrowed by enough to ease financial conditions to stimulate the economy. So far, 2020 echoes the 2009 pattern and our Financial Conditions Index is more stimulatory than it was prior to the COVID-19 outbreak (see Chart III-36 in Section III). Chart I-11Commodities Point To Higher Yields...
Commodities Point To Higher Yields...
Commodities Point To Higher Yields...
Inflation momentum confirms the risks to bonds. The apex of the deflationary shock has already passed. In July, core CPI excluding shelter rose by 0.84% month-on-month, which was the highest reading since 1981 when the Fed was combating the most violent inflation outbreak in generations. The upturn in core producer prices also warns that the annual inflation rate of core CPI should accelerate meaningfully by early 2021 (Chart I-10). The dollar’s weakness is another inflationary force. Import prices from China have already bottomed, which points to an escalation in goods inflation in the coming months. Firming commodity prices constitute another risk for yields. Our Commodities Advance/Decline line has recently broken out. This technical development is consistent with higher commodity prices and higher bond yields (Chart I-11). Rallying natural resources are inflationary, but they also indicate that the global economy is strengthening, which should put upward pressure on real interest rates. Strength in the housing sector also confirms that government bond yields have upside. As we highlighted above, a robust housing market is an important validation that monetary policy is very accommodative. By definition, the objective of loose policy is to boost future economic activity and eradicate deflationary pressures. The surge in lumber indicates bond prices are showing downside risk (Chart I-12). Additionally, the upswing in mortgage issuance is occurring as the Treasury and corporations boost their borrowings, which will generate more demand to use savings generated in the economy. The price of those savings will be higher real interest rates. Chart I-12...Especially Lumber
...Especially Lumber
...Especially Lumber
The ebbing of COVID-19 also suggests that economic activity has scope to accelerate. Moreover, the House of Representatives reconvened to address the problems plaguing the US Postal Service ahead of the November elections. This early return to work gives Washington another opportunity to negotiate the stimulus bill that it failed to pass earlier this month. We still expect such a bill to ultimately become law because both Democrats and Republicans have too much to lose in November if the economy relapses in response of political paralysis. Declining infections and increased government support will bolster aggregate demand and put upward pressure on rates. The stock market’s near-term outlook remains marked by short-term froth that dampens our cyclical optimism. Market dynamics are also very negative for bonds. Our Valuation Index highlights that Treasurys are incredibly expensive (Chart I-13, top panel). Moreover, our Composite Technical Indicator remains overbought, though it has lost momentum. In this context, the lack of appetite for yield curve control or more QE demonstrated by the Federal Open Market Committee creates a genuine danger for bonds. Without these policies, bond yields will have trouble resisting the upward push created by our rising US Pipeline Inflation Pressures Index, our rebounding Nominal Cyclical Spending proxy (which is an average of the ISM Manufacturing headline index and Prices Paid component), and the uptick in the amount of liquidity sitting on commercial banks’ balance sheets (Chart I-14). Chart I-13Treasurys Are Expensive And Losing Momentum
Treasurys Are Expensive And Losing Momentum
Treasurys Are Expensive And Losing Momentum
Chart I-14Building Cyclical Risks For Bonds
Building Cyclical Risks For Bonds
Building Cyclical Risks For Bonds
Thus, equities are at risk on a tactical basis because we anticipate that 10-year Treasury yields may climb towards 1%, including a rise in TIPS yields. The US election creates an additional near-term hurdle for stocks. As we wrote last month, President Trump will likely become more belligerent toward the US’s trading partners in the coming months. Moreover, Vice-President Joe Biden, who has a comfortable lead in the polls including in key swing states such as Florida, Michigan, Pennsylvania, and Wisconsin wants to cancel half of the 2017 tax cuts.5 Small Over Big Long-term investors should expect stocks to beat bonds on a 5- to 10-year horizon, but equities will generate paltry real returns compared with the past 40 years. Elevated valuations for US equities are consistent with long-term annualized real rates of return of only 0.5% (Chart I-15). Moreover, the long-term outlook for profit margins is poor. As we wrote three months ago, mounting populism will result in redistributive policies that will lift the share of wages relative to GDP.6 Moreover, the shift of the US population to the left on economic matters will push up corporate tax rates. Increased labor costs and corporate taxes are negative for profit margins. If profit margins normalize, then equities will probably underperform the uninspiring expected returns implied by current market multiples. The surge in lumber indicates bond prices are showing downside risk. Investors can still generate generous returns through geographical and sectoral selection. We have highlighted how value stocks, industrials and materials, and EM and European equities will likely beat US equities.7 This month we will explore how US small-cap equities are also well placed to best the dismal projected real returns offered by their large-cap counterparts. Our BCA Relative Technical Indicator shows that small-cap stocks are 1.8-sigma oversold when compared with the S&P 500, which indicates a capitulation among investors toward these equities. The bifurcation is even greater if we compare small-cap equities with the S&P 100’s mega-caps that have driven up the US market in recent years. Incorporating these influences, our Cyclical Capitalization Indicator has moved in favor of small-cap stocks, which suggests that small-cap stocks will be rerated if the yield curve can steepen further (Chart I-16). Equities are at risk on a tactical basis because we anticipate that 10-year Treasury yields may climb towards 1%. Chart I-15Valuations And Profit Margins Threaten Long-Term Stock Returns
Valuations And Profit Margins Threaten Long-Term Stock Returns
Valuations And Profit Margins Threaten Long-Term Stock Returns
Chart I-16Indicators Favor Small Cap Stocks
Indicators Favor Small Cap Stocks
Indicators Favor Small Cap Stocks
Chart I-17A Debt Turnaround Would Help Small Cap Stocks
A Debt Turnaround Would Help Small Cap Stocks
A Debt Turnaround Would Help Small Cap Stocks
Debt dynamics could also increasingly beneficial to small-cap equities. In the past few years, the heavy debt-to-EBITDA of smaller firms created a major headwind for small-cap investors. The indebtedness of small-cap stocks often decreases relative to large-caps when an economic recovery begins. This shift in leverage portends an increase in small-caps’ relative future returns (Chart I-17). Our negative bias toward the dollar and our positive view on commodities also benefit small-cap stocks. Since the early 1990s, increasing real commodity prices and a falling Dollar Index have coexisted with a robust performance of small-cap firms (Chart I-18). The negative US balance-of-payment dynamics, coupled with escalating inflation risks, will continue to weigh on the dollar, especially as various large EM nations try to diversify their reserves and payment systems away from the dollar.8 Meanwhile, a declining dollar, expanding global growth, monetary debasement, populism, inflation and a lack of investment in supply, all will accentuate the appeal of natural resources. The sectoral bias of small-cap indices will capitalize on these trends. Chart I-18Small Is Beautiful
Small Is Beautiful
Small Is Beautiful
Chart I-19Small Cap Stocks Like Higher Yields
Small Cap Stocks Like Higher Yields
Small Cap Stocks Like Higher Yields
Finally, cyclical timing is also moving in favor of small-cap firms. Since 2014, the Russell 2000 has outperformed the S&P 500 when real yields moved higher (Chart I-19). Small-cap firms display a more marked pro-cyclicality than large firms. Additionally, the S&P 500 growth bias implies that the US large-cap benchmark underperforms the small cap indices when real yields increase. Mathieu Savary Vice President The Bank Credit Analyst August 27, 2020 Next Report: September 24, 2020 II. Global Semiconductor Stocks: A Hiatus Is Overdue In A Structural Bull Market The strength in global semiconductor sales in recent months has been due to one-off factors stemming from pandemic-related lockdowns. As the one-off demand surge subsides, global semiconductor sales will decline modestly toward the end of this year. In the near term, global semiconductor stock prices are vulnerable due to overbought conditions, excessive valuations and demand disappointment. The global semiconductor industry is at the epicenter of the US-China confrontation, and more US restrictions on chips sales to China are probable. This is another risk for this sector's share prices. Nevertheless, the structural outlook for global semiconductor demand is constructive. Its CAGR may rise from 3% during 2014-2019 to 5% during 2020-2024. Investor euphoria has taken hold of semiconductor stocks. Global semiconductor stock prices have skyrocketed by 68% from March lows and 96% from December 2018 lows. Meanwhile, global semiconductor sales during March-June rose only by 5% from a year ago. As a result, the ratio of market cap for global semiconductor stocks relative to global semiconductor sales has reached its highest level since at least the inception of data in 2003 (Chart II-1). Chart II-1Global Semi Sector: Market Cap-To-Sales Ratio Has Surged
Global Semi Sector: Market Cap-To-Sales Ratio Has Surged
Global Semi Sector: Market Cap-To-Sales Ratio Has Surged
With semi equity multiples very elevated, their share prices have become even more sensitive to global semiconductor demand growth. Hence, the focus of this report is to try to gauge the strength of global semiconductor demand, both in the near term and structurally. The strength in global semiconductor sales in recent months has been due to one-off factors stemming from the lockdowns. Near-term semiconductor stock prices could disappoint due to weak chip demand from the smartphone sector and diminishing purchases of personal computers (PCs) and servers. However, structurally, we are positive on global semiconductor demand, which is underpinned by the continuing rollout of 5G networks and phones, a wider adoption of data centers, and further technological advancements in artificial intelligence (AI), cloud computing, edge computing and smaller nodes for chip manufacturing (Box II-1). Box II-1 Key Technologies Underpinning Potential Global Semiconductor Demand AI refers to the simulation of human intelligence in machines, for example, computers that play chess and self-driving cars. The goals of AI include learning, reasoning and perception. Cloud computing is the delivery of computing services – including servers, storage, databases, networking, software, analytics and intelligence – over the Internet (“the cloud”) to offer faster innovation, flexible resources and economies of scale. Edge computing is a form of distributed computing, which brings computation and data storage closer to where it is needed, to improve response times and save bandwidth. Technology node refers to the width of line that can be processed with a minimum width in the semiconductor manufacturing industry, such as technology nodes of 10 nanometers (nm), 7nm, 5nm and 3nm. The smaller the nodes are, the more advanced they are. Near-Term Headwinds Semiconductor demand worldwide grew by 6% year-on-year in the first half of this year. There has been a remarkable divergence between world semiconductor sales and the global business cycle (Chart II-2). The divergence between semiconductor sales and economic activity was most striking in the US and China. Semiconductor sales in China rose by 5% year-on-year in Q12020, and in the US they grew by 29% year-on-year in Q22020, despite a contraction in their aggregate demand during the same period. By contrast, Q2 annual growth of semiconductors sales was -2.2% for Japan, -17% for Europe and 1.8% for Asia ex. China and Japan (Chart II-3). Chart II-2World Semi Sales Diverged From The Global Business Cycle
World Semi Sales Diverged From The Global Business Cycle
World Semi Sales Diverged From The Global Business Cycle
Chart II-3Strong Semi Sales In The US And China, But Not Elsewhere
Strong Semi Sales In The US And China, But Not Elsewhere
Strong Semi Sales In The US And China, But Not Elsewhere
The reasons why the US and China posted a surge in semiconductor demand while Europe and Japan experienced a contraction in domestic semiconductor sales are as follows: Most data center investment is occurring in the US and China. Chart II-4 shows that 40% of global hyperscale data centers are operating in the US, much larger than any other countries/regions. China, in turn, ranked second, with a global share of 8%. Chart II-4The US Has The Most Global Hyperscale Data Centers
September 2020
September 2020
Demand contraction in Europe and Japan is due to semiconductor demand in these regions mainly originating from the automobile sector, where production was severely hit by the global pandemic. About 37% of European semiconductor sales were from last year’s automotive market. We believe the divergence between global economic activity and semiconductor sales, as demonstrated by Chart II-2 on page 3, has been due to one-off factors, as the global pandemic lockdowns have spurred semiconductor demand. Such a one-off demand boost will likely dissipate in the coming months. Traditional PCs and tablets: There has been a surge in demand for traditional PCs9 and tablets in the past six months. This was due to the significant increase in online activities, such as working from home, education, e-commerce, gaming and entertainment. Data from the International Data Corporation (IDC) has revealed that shipments of traditional PCs and tablets in volume terms had a strong year-on-year growth of 11.2% and 18.6%, respectively, in the period of April-June (Chart II-5). Looking forward, even renewed lockdowns will not lead to a similar rush to buy these products. Many households are already equipped to work from home and for other online activities. With many countries gradually opening their economies, such demand will diminish. The traditional PC and tablet sectors together account for about 13% of global chip demand (Chart II-6). Chart II-5Personal Computers Sales Have Surged Amid Lockdowns
Personal Computers Sales Have Surged Amid Lockdowns
Personal Computers Sales Have Surged Amid Lockdowns
Server demand: Another major semiconductor demand contribution in Q2020 was from the server sector, which spiked by 21% year-on-year (Chart II-7). The surge in online activities triggered a strong demand for cloud services and remote work applications, both of which require computer servers to run on. Chart II-6The Breakdown Of Global Semiconductor Sales By Type Of Usage
September 2020
September 2020
However, demand from the server sector is also set to diminish in 2H2020 and Q1 2021. Provided the inventories at major data center operators, including Microsoft, Google and Amazon, remain at high levels,10 global cloud service providers will likely reduce their orders of servers next quarter.11 Enterprises will also likely cut their investment in computer servers in 2H2020, as many of them had already increased their purchases of servers to prepare employees and business processes for remote working. We expect global server demand growth to soften in 2H2020. The Digitimes Research forecasted a 5.6% quarter-on-quarter contraction in 3Q2020 and a further cut in global sever shipment in the 4Q2020.10 The global server sector accounts for about 10% of global chip demand and, together with PCs and tablets, they make for 23% (please refer to Chart II-6 on page 5). Further, the smartphone sector – accounting for 27% of global semiconductor demand – will continue struggling in H2 this year. Chart II-7Server Sales Have Surged Amid Lockdowns
Server Sales Have Surged Amid Lockdowns
Server Sales Have Surged Amid Lockdowns
Chart II-8Global Smartphone Shipments Will Likely Remain Weak In 2020H2
Global Smartphone Shipments Will Likely Remain Weak In 2020H2
Global Smartphone Shipments Will Likely Remain Weak In 2020H2
The global total smartphone demand has been hit severely, as households delayed their new smartphone purchases. According to Canalys’ data, global smartphone shipments dropped by 13% and 14% year-on-year in Q1 and Q2, respectively. We expect smartphone shipments to continue contracting over the next three-to-six months (Chart II-8). We believe global consumers will remain cautious in their spending on discretionary goods, such as smartphones, due to lowered incomes and increased job uncertainty. The IDC also forecasted that global smartphone shipments would not grow until 1Q2021.12 The Chinese smartphone sales showed a considerable weakness in July, with a 35% year-on-year contraction, which is much deeper than the 20% decline in H1 this year. 5G smartphone shipments also slowed last month, with a 21% drop from the previous month. The global semiconductor industry is at the epicenter of the US-China confrontation. Bottom Line: The strength in global semiconductor sales in recent months has been due to one-off factors stemming from the lockdowns. As this one-off demand subsides, global semiconductor sales will decline modestly toward the end of this year. Given the overbought conditions and the elevated equity valuations, global semiconductor stocks are currently vulnerable to near-term disappointments in semiconductor demand. At The Epicenter Of The US-China Rivalry Semiconductors are at the epicenter of the US-China confrontation. Ultimately, the US-China contention is about future technological dominance. That is access to technology and the capability to develop new technologies. China currently accounts for about 35% of the global semiconductor demand. US restrictions on semi producers worldwide to supply semiconductors to Chinese buyers constitute a major risk to semiconductor stock prices. On August 17, the US announced fresh sanctions that restrict all US and foreign semiconductor companies from selling chips developed or produced using US software or technology to Huawei, without first obtaining a license. In May, the US had already limited companies, such as the Taiwan Semiconductor Manufacturing Company (TSMC), from making and supplying Huawei with its self-designed chips. In addition, the US recently threatened bans on Chinese-owned apps TikTok and WeChat, and signaled that it could soon restrict Alibaba’s operations in the US. Chart II-9Global Semi Companies' Sales To China Are Substantial
September 2020
September 2020
The global semiconductor sector is highly vulnerable to further escalation in the tension between these two superpowers. Major global semiconductor companies’ sales are heavily exposed to China, and their revenue from China ranges from 16% to 50% of total (Chart II-9). We have been puzzled why global semi share prices have been rallying in spite of US limitations on semiconductor shipments to Huawei and its affiliated entities. One explanation could be that the Chinese companies that are not affiliated with Huawei are able to import semiconductors and then supply them to Huawei. If this is true, the US will have no other choice but to limit all semiconductor sales to China. This will be devastating for global semi producers given their large exposure to China. In anticipation of US punitive policies limiting its access to semiconductors, China had boosted its semiconductor imports over the past 12 months (Chart II-10, top panel). Chinese imports of integrated circuits rose by 12% year-on-year in 1H2020, which is much higher than the 5% year-on-year increase in Chinese semiconductor demand during the same period (Chart II-10, bottom panel). This gap suggests the country had restocked its semiconductor inventories. China has particularly restocked its imports of non-memory chips with imports of processor & controller and other non-memory chips in H1, surging by 30% and 20%, respectively, in US dollar terms (Chart II-11). For memory chips, the contraction in Chinese imports was mainly due to a decline in global memory chip prices. Chart II-10China Had Likely Restocked Its Semi Inventories
China Had Likely Restocked Its Semi Inventories
China Had Likely Restocked Its Semi Inventories
Chart II-11Strong Chinese Imports In Non-Memory Chips
Strong Chinese Imports In Non-Memory Chips
Strong Chinese Imports In Non-Memory Chips
Bottom Line: The global semiconductor industry is at the epicenter of the US-China confrontation, and more restrictions on sales to China are probable. In turn, the restocked semiconductor inventory in China raises the odds of weakening mainland semiconductor import demand in H2 of this year. Structural Tailwinds Table II-1Global Semiconductor Demand CAGR Forecast Over 2020-2024 By Device
September 2020
September 2020
We are optimistic on structural global semiconductor demand. Its nominal CAGR may rise from 3% during 2014-2019 to 5% during 2020-2024 in US dollar terms. Table II-1 shows our demand growth forecasts for global chips in the main consuming sectors over the next five years. The major contributing sectors during 2020-2024 will be 5G smartphones, servers, industrials, electronics and automotive manufacturing. The underlying driving forces are the continuing rollout of 5G networks and phones, the development of data centers, and further technological advancements in AI, cloud computing and edge computing. Currently, the world is still in the early stages of 5G network development. AI, cloud computing and edge computing are constantly evolving. With increasing adoption of 5G smartphones, computer servers and IoT devices, global semiconductor demand is in a structural uptrend (Box II-2). Box II-2 Key Components For The Virtual World In Development Data centers and cloud computing allow data to be stored and applications to be running off-premises and to be accessed remotely through the internet. Edge computing allows data from Internet of things (IoT) devices to be analyzed at the edge of the network before being sent to a data center or cloud. IoT devices contain sensors and mini-computer processors that act on the data collected by the sensors via machine learning. The IoT is a growing system of billions of devices — or things — worldwide that connect to the internet and to each other through wireless networks. AI technology empowers cloud computing, edge computing and IoT devices. 5G is at the heart of the IoT industry transformation, making a world of everything connected possible. Chart II-125G Phone Shipments In China Will Continue To Rise
5G Phone Shipments In China Will Continue To Rise
5G Phone Shipments In China Will Continue To Rise
5G Smartphone Currently, China is the world’s largest 5G-smartphone consumer and the leading 5G-adopter in the world. According to Digitimes Research, global 5G smartphone shipments will reach over 250 million units in 2020, with 170 million (68%) in China and only 80 million units in the world ex. China. Looking forward, 5G smartphone shipments are set to accelerate worldwide over the coming years. The 5G phone shipments in China will continue to rise. The 5G phone sales penetration rate in China is likely to rise from 60% in July to 95% by the end of 2022. In such a case, we estimate that the monthly Chinese 5G phone shipments will increase from the current 16 million units to about 25-30 million units in 2022 (Chart II-12). In the rest of the world, the 5G smartphone adoption pace will also likely speed up over the next five years. The 5G phone selling prices in the world outside China will drop, as more models are introduced and become more affordable. 5G smartphone prices have already fallen in China and will inevitably fall elsewhere. Chinese 5G smartphone producers will ship their low-priced 5G phones overseas, putting pressure on other producers to lower their prices. The 5G infrastructure development is accelerating in China and will accelerate in the rest of the world. Both China and South Korea have been very aggressive in their respective 5G network development. As of the end of June, China's top three carriers: China Mobile, China Unicom, and China Telecom – which together serve more than 1.6 billion mobile users in the country – had installed 400,000 5G base stations against an annual target of 500,000. In comparison, as of April 2020, American carriers had only put up about 10,000 5G base stations.13 As the US is competing with China on the 5G front, the country will likely boost its investment in 5G network development aggressively over the next five years in order to catch up to, or even exceed, China. Importantly, the 5G smartphone has more silicon content than 4G smartphones. More silicon content means higher semiconductor value. Rising 5G smartphone sales and higher silicon content together will more than offset the loss in semiconductor sales due to falling global 4G smartphone shipments. Overall, global semiconductor stock prices have diverged from their sales and profits. Based on our analysis, we expect a CAGR growth of 4% in semiconductor demand from the global smartphone sector over the next five years, slightly lower than the 5% in previous five years (Table II-1 on page 10). This also takes into consideration that the 5G network will be more difficult and more expensive to develop than the 4G network. Servers Global server shipment growth will be highly dependent on both the pace and the scale of data center development (Box II-3). Data centers account for over 60% of global server demand. Box II-3 Data Centers There are four main types of data centers – enterprise data centers, managed services data centers, colocation data centers, and cloud data centers. Data centers can have a wide range of number of servers. Corporate data centers tend to have either 200 (small companies), or 1000 servers (large companies). In comparison, a hyperscale data center usually has a minimum of 5,000 servers linked with an ultra-high speed, high fiber count network. Outsourcing and a move towards the cloud are driving the growth of the hyperscale data center. Instead of companies investing in physical hardware, they can rent server space from a cloud provider to both save their data and reduce costs. Amazon, Microsoft, Google, Apple and Alibaba are all top global cloud service providers. The more hyperscales to be built up, the higher the demand for servers. In 2019, about 13% of the total number of data centers in China were of the hyperscale and large-scale varieties. The plan of new infrastructure development announced earlier this year by Beijing was aiming to increase the number of hyperscale and large-scale data centers in China. Among current data centers either under construction or to be developed in the near future, 36% of them are hyperscale and large-scale data centers. The future growth of data centers is promising. The global trend of data localization14 due to the concerns of data privacy and national security will also bolster a boom of data centers over the next five years. A growing number of countries are adopting data localization requirements, such as China, Russia, Indonesia, Nigeria, Vietnam and some EU countries. While the Chinese data center market is expected to expand by a CAGR of about 28% over 2020-2022,15 a report recently released by Technavio forecasted the global data center industry’s CAGR at over 17% during 2019-2023. We forecast that the global semiconductor demand from servers will grow at a CAGR of 12% over 2020-2024. IoTs Technological advancements in AI, cloud computing and edge computing, in combination with 5G network development, will facilitate the IoTs adoption. According to the GSMA,16 46 operators in 24 markets had launched commercially available 5G networks by 30 January 2020. It forecasted that global IoT connections will be increased from 12 billion mobile devices in 2019 to 25 billion in 2025 with a CAGR at 13%.17 IoTs chips include the Artificial Intelligence of Things (AIoT) – a powerful convergence of AI and the IoT. IoTs is an interconnected network of physical devices. Every device in the IoT is capable of collecting and transferring data through the network. Looking forward, global demand of AI chips and IoT chips will have significant potential to grow with creation of “smarter manufacturing”, “smarter buildings”, “smarter cities”, etc. AI applications can be used in manufacturing processes to render them smarter and more automated. Productivity will be enhanced as machines achieve significantly improved uptime while also reducing labor costs. There are plenty of upsides in industrial semiconductor demand (Chart II-13). We expect the CAGR of industrial electronics to increase from 3.4% during 2014-2019 to 8% during 2020-2024. AI applications can create smart buildings by increasing connectivity across enterprise assets, enabling home network infrastructure (e.g., routers and extenders) and employing home-security devices (e.g., cameras, alarms and locks). AI applications can be used to create smart cities. A smart city is an urban area that uses different types of IoT electronic sensors to collect data. Insights gained from that data are used to manage assets, resources and services efficiently; in return, that data is used improve operations across the city. China has already developed about 750 trial sites of smart cities with different degrees of smartness in the past decade. As AI and 5G technology advances, the existing smart cities’ “smartness” will be upgraded and new trial smart cities will be implemented. Based on IDC data, China’s investment in smart cities will rise at a CAGR of 13.5% over 2020-2023 (Chart II-14). Globally, the U.S., Japan, European countries and other nations are also actively developing smart cities. According to a new study conducted by Grand View Research, the global smart cities market size is expected to grow at a CAGR of 24.7% from 2020 to 2027.18 Chart II-13Plenty Of Upside In Industrial Semi Demand
Plenty Of Upside In Industrial Semi Demand
Plenty Of Upside In Industrial Semi Demand
Chart II-14China’s Investment In Smart Cities Will Continue To Grow
September 2020
September 2020
Automotive We expect the global automotive chip market to grow at a CAGR of 9% during 2020-2024, as in 2014-2019. The increase in consumption of semiconductors by the auto industry will continue to be driven by the market evolution toward autonomous, connected, electric and shared mobility. Most new vehicles now include some level of advanced driver assist systems (ADAS), such as adaptive cruise control, automatic brakes, blind spot monitoring, and parallel parking. The whole industry is progressing toward fully autonomous vehicles in the coming years. Increasing adoption of automotive chips and recovering car sales will revive automotive chip sales. In addition, rising penetration of new energy vehicles (NEVs) is beneficial to semiconductor sales, as NEVs contain higher semiconductor content than conventional vehicles. Conventional vehicles contain an average of a $330 value of semiconductor content while hybrid electric vehicles can contain up to $1,000 and $3,500 worth of semiconductors.19 Regarding other sectors, we are also positive on structural demand of storage and consumer electronics. AI applications generate vast volumes of data — about 80 exabytes per year, which is expected to increase by about tenfold to 845 exabytes by 2025.20 In addition, developers are now using more data in AI and deep learning (DL) training, which also increases storage requirements. With massive potential demand for storage, we estimate a CAGR of 7% over 2020-2024 (Table II-1 on page 10). A recent report from ABI Research predicts that the COVID-19 pandemic will increase global sales of wearables (such as a Fitbit or Apple Watch) by 29% to 30 million shipments of the devices this year. With contribution from wearables, we expect global semiconductor demand from the consumer sector to grow at a CAGR of 3% over 2020-2024, the same rate as in the previous five years. Bottom Line: Continuing rollout of 5G networks and phones, development of data centers, and further technological advancements in AI and cloud computing will provide tailwinds to structural global semiconductor demand, accelerating its CAGR growth from 3% during 2014-2019 to 5% during 2020-2024. Valuations And Investment Conclusions Most global semiconductor stocks are currently over-hyped. Critically, both DRAM and NAND prices have been deflating since January, reflecting weak demand for memory chips. Yet, share prices of memory producers have rallied (Chart II-15). Overall, global semiconductor stock prices have diverged from their sales and profits (Chart II-16). Chart II-15Falling Memory Prices Pose Risk To Memory Stocks
Falling Memory Prices Pose Risk To Memory Stocks
Falling Memory Prices Pose Risk To Memory Stocks
Chart II-16Global Semiconductor Stocks Have Deviated From Profits
Global Semiconductor Stocks Have Deviated From Profits
Global Semiconductor Stocks Have Deviated From Profits
Consequently, the multiples of semiconductor stocks have spiked to multi-year highs (Chart II-17). Even after adjusting for negative US real bond yields, valuations of semiconductor stocks are not cheap. Chart II-18 illustrates the equity risk premium for global semiconductor stocks is at the lower end of its range of the past 10 years. The ERP is calculated as forward earnings yield minus 10-year US TIPS yields. Chart II-17Global Semi Stocks: Elevated Valuations
Global Semi Stocks: Elevated Valuations
Global Semi Stocks: Elevated Valuations
Chart II-18Equity Risk Premium For Global Semi Stocks Is Historically Low
Equity Risk Premium For Global Semi Stocks Is Historically Low
Equity Risk Premium For Global Semi Stocks Is Historically Low
It is impossible to time a correction or know what the trigger would be (US-China tensions have been our best guess). Nevertheless, we do not recommend chasing semiconductor stocks higher due to their overstretched technicals and valuations on the one hand and potential weakening demand in H2 on the other. In addition, the ratio of global semi equipment stock prices relative to the semi equity index correlates with absolute share prices of global semi companies. This is because equipment producers are higher-beta as they outperform during growth accelerations and underperform during growth slumps. The basis is that semi manufacturers have to purchase equipment if there is actual strong demand coming up and vice versa. The recent underperformance by global semi equipment stocks relative to the semi equity index might be an early sign of a potential reversal in semi share prices in absolute terms (Chart II-19). Chart II-19A Signal Of A Potential Reversal In Semi Share Prices
A Signal Of A Potential Reversal In Semi Share Prices
A Signal Of A Potential Reversal In Semi Share Prices
Meanwhile, we believe the subsector- memory chip stocks - will outperform the overall semiconductor index amidst the potential correction, because they have lagged and are less over-extended. Finally, we remain neutral on Taiwanese and Korean bourses within the EM equity space for now. Escalation in US-China confrontation, as well as their exposure to semiconductors, put these bourses at near-term risk. That said, we are reluctant to underweight these markets because fundamentals in EM outside North Asia remain challenging. Ellen JingYuan He Associate Vice President Emerging Markets Strategy III. Indicators And Reference Charts We continue to favor stocks at the expense of bonds, but equities are increasingly vulnerable because short-term sentiment and positioning measures are growing increasingly stretched. Three forces can prompt a correction. First, a rebound in yields toward 1% would cause turbulence for the S&P 500, because the index is dominated by growth stocks that are highly sensitive to fluctuations in the risk-free rate. Second, a dollar bounce would hurt the S&P 500 because a depreciating USD has fueled the US stock market rally since June. Finally, the US presidential election is drawing nearer; hence, the risk of potentially damaging political headlines is growing. Despite these short-term risks, the main pillar supporting the rally remains intact: global monetary conditions are highly accommodative and the chance of inflation moving high enough to spook central bankers is minimal in the near future. Additionally, the fiscal spigots are open and governments around the world will ultimately continue to support their economies. Hence, any correction in the S&P 500 is unlikely to move beyond 15% or a level of 2900. Our cyclical indicators confirm the positive backdrop for stocks. While our Valuation Indicator has reached overvalued territory, our Monetary Indicator remains extremely accommodative. Moreover, our Technical Indicator is now flashing a clear buy signal. Putting all those forces together, our Intermediate-Term Indicator continues to support equities. Finally, our Revealed Preference Indicator strongly argues in favor of staying invested in equities. That being said, our Speculation Indicator has surged back up, thus the volatility of the rally should increase. Bonds remain extremely unappealing. Our Bond Valuation Index shows Treasurys as prohibitively expensive and our Composite Technical Indicator continues to lose momentum. So far, government bond yields have managed to remain stable at very low levels even if they have not declined further. Nonetheless, bonds have underperformed equities, which is a trend that will remain in place for many more quarters. Moreover, the pick-up in commodity prices and in various gauges of the business cycle suggests that bond yields should soon move higher, especially because the Fed is far from enthused at the concept of yield curve control. Our Cyclical Bond Indicator has turned higher and will soon flash an outright sell signal. The dollar continues to weaken after its recent breakdown. For now, the USD’s weakness has been concentrated among DM currencies. For the dollar to weaken further, EM currencies must begin to rally more markedly than they have until now, especially in Latin America. The firmness of the CNY is a good sign for the EM complex, but another clear up-leg in global growth must emerge before EM currencies can fully blossom. As a result, we are likely to have entered a temporary period of consolidation for the US dollar. The extremely oversold nature of our Dollar Composite Technical Indicator supports the idea that the dollar needs to digest its recent losses before its poor fundamentals force it lower once again. Finally, commodities have been a prime beneficiary of the weakness in the dollar and the combination of stable yields and improving economic activity. Our Composite Technical Indicator is now well into overbought territory which makes natural resource prices vulnerable to a pullback. A move up in yields as well as a short-term rebound in the dollar will likely catalyze any underlying technical risks to commodities. Gold will be particularly vulnerable to any such pullback, especially if higher real yields are the cause of the correction in natural resource prices. Despite these short-term worries, the outlook for commodities remains bright. As a result, we would use any correction to add exposure to the commodity complex. EQUITIES: Chart III-1US Equity Indicators
US Equity Indicators
US Equity Indicators
Chart III-2Willingness To Pay For Risk
Willingness To Pay For Risk
Willingness To Pay For Risk
Chart III-3US Equity Sentiment Indicators
US Equity Sentiment Indicators
US Equity Sentiment Indicators
Chart III-4Revealed Preference Indicator
Revealed Preference Indicator
Revealed Preference Indicator
Chart III-5US Stock Market Valuation
US Stock Market Valuation
US Stock Market Valuation
Chart III-6US Earnings
US Earnings
US Earnings
Chart III-7Global Stock Market And Earnings: Relative Performance
Global Stock Market And Earnings: Relative Performance
Global Stock Market And Earnings: Relative Performance
Chart III-8Global Stock Market And Earnings: Relative Performance
Global Stock Market And Earnings: Relative Performance
Global Stock Market And Earnings: Relative Performance
FIXED INCOME: Chart III-9US Treasurys And Valuations
US Treasurys And Valuations
US Treasurys And Valuations
Chart III-10Yield Curve Slopes
Yield Curve Slopes
Yield Curve Slopes
Chart III-11Selected US Bond Yields
Selected US Bond Yields
Selected US Bond Yields
Chart III-1210-Year Treasury Yield Components
10-Year Treasury Yield Components
10-Year Treasury Yield Components
Chart III-13US Corporate Bonds And Health Monitor
US Corporate Bonds And Health Monitor
US Corporate Bonds And Health Monitor
Chart III-14Global Bonds: Developed Markets
Global Bonds: Developed Markets
Global Bonds: Developed Markets
Chart III-15Global Bonds: Emerging Markets
Global Bonds: Emerging Markets
Global Bonds: Emerging Markets
CURRENCIES: Chart III-16US Dollar And PPP
US Dollar And PPP
US Dollar And PPP
Chart III-17US Dollar And Indicator
US Dollar And Indicator
US Dollar And Indicator
Chart III-18US Dollar Fundamentals
US Dollar Fundamentals
US Dollar Fundamentals
Chart III-19Japanese Yen Technicals
Japanese Yen Technicals
Japanese Yen Technicals
Chart III-20Euro Technicals
Euro Technicals
Euro Technicals
Chart III-21Euro/Yen Technicals
Euro/Yen Technicals
Euro/Yen Technicals
Chart III-22Euro/Pound Technicals
Euro/Pound Technicals
Euro/Pound Technicals
COMMODITIES: Chart III-23Broad Commodity Indicators
Broad Commodity Indicators
Broad Commodity Indicators
Chart III-24Commodity Prices
Commodity Prices
Commodity Prices
Chart III-25Commodity Prices
Commodity Prices
Commodity Prices
Chart III-26Commodity Sentiment
Commodity Sentiment
Commodity Sentiment
Chart III-27Speculative Positioning
Speculative Positioning
Speculative Positioning
ECONOMY: Chart III-28US And Global Macro Backdrop
US And Global Macro Backdrop
US And Global Macro Backdrop
Chart III-29US Macro Snapshot
US Macro Snapshot
US Macro Snapshot
Chart III-30US Growth Outlook
US Growth Outlook
US Growth Outlook
Chart III-31US Cyclical Spending
US Cyclical Spending
US Cyclical Spending
Chart III-32US Labor Market
US Labor Market
US Labor Market
Chart III-33US Consumption
US Consumption
US Consumption
Chart III-34US Housing
US Housing
US Housing
Chart III-35US Debt And Deleveraging
US Debt And Deleveraging
US Debt And Deleveraging
Chart III-36US Financial Conditions
US Financial Conditions
US Financial Conditions
Chart III-37Global Economic Snapshot: Europe
Global Economic Snapshot: Europe
Global Economic Snapshot: Europe
Chart III-38Global Economic Snapshot: China
Global Economic Snapshot: China
Global Economic Snapshot: China
Mathieu Savary Vice President The Bank Credit Analyst Footnotes 1 Please see The Bank Credit Analyst "April 2020," dated March 26, 2020, available at bca.bcaresearch.com 2 Please see The Bank Credit Analyst "July 2020," dated June 25, 2020, available at bca.bcaresearch.com 3 Please see European Investment Strategy "An Economy Without Mouths Or Noses Will Lose 10 Percent Of Jobs," dated July 30, 2020, available at eis.bcaresearch.com 4 Please see US Equity Strategy "Inversely Correlated," dated August 25, 2020, available at uses.bcaresearch.com 5 Please see The Bank Credit Analyst "August 2020," dated July 30, 2020, available at bca.bcaresearch.com 6 Please see The Bank Credit Analyst "June 2020," dated May 28, 2020, available at bca.bcaresearch.com 7 Please see The Bank Credit Analyst "August 2020," dated July 30, 2020, available at bca.bcaresearch.com 8 Diversifying away from the dollar does not mean that the USD will lose its reserve status. However, a return to the share of FX reserves that prevailed in the first half of the 1990s will hurt the dollar, especially because the US net international investment position has fallen from -4.6% of GDP in 1992 to -57% today. 9 Traditional PCs are comprised of desktops, notebooks, and workstations. 10 Global server shipments to contract 5.6% sequentially in 3Q2020, says Digitimes Research 11 Global server shipments forecast to increase by 5% this year: TrendForce 12 IDC Expects Worldwide Smartphone Shipments to Plummet 11.9% in 2020 Fueled by Ongoing COVID-19 Challenges 13 America does not want China to dominate 5G mobile networks 14 “Data localization” can be defined as the act of storing data on a device that is physically located within the country where the data was created. Data localization requirements are governmental obligations that explicitly mandate local storage of personal information or strongly encourage local storage through data protection laws that erect stringent legal compliance obligations on cross-border data transfers. 15 The big data center industry ushered in another outbreak 16 The GSMA represents the interests of mobile operators worldwide, uniting more than 750 operators with almost 400 companies in the broader mobile ecosystem, including handset and device makers, software companies, equipment providers and internet companies, as well as organizations in adjacent industry sectors. 17 GSMA: 5G Moves from Hype to Reality – but 4G Still King 18 Smart Cities Market Size Worth $463.9 billion By 2027 19 The Automotive Semiconductor Market – Key Determinants of U.S. Firm Competitiveness 20 AI is data Pac-Man. Winning requires a flashy new storage strategy.
Trim Staples To A Below Benchmark Allocation
Trim Staples To A Below Benchmark Allocation
Underweight Our recent downgrade in the S&P hypermarkets index to underweight also pushed the overall S&P consumer staples sector to a below benchmark allocation. According to our mid-April research on what sectors investors should avoid during recessionary recoveries, consumer staples stocks trail the SPX on average by 660bps one year following the SPX trough. The current macro backdrop corroborates this analysis and underscores that the path of least resistance is lower for relative staples share prices. Not only is the ISM manufacturing survey on fire, but also consumer confidence is making an effort to trough (ISM manufacturing and consumer confidence shown inverted). Bottom Line: Downgrade the S&P consumer staples index to underweight. For more details, please refer to the most recent Weekly Report.
Highlights ‘Value’ sector profits are in terminal decline. Bank profits are in terminal decline, because private sector credit is now ‘maxed out’, and the intermediation between borrowers and savers can be done more cost-effectively by the blockchain. Oil and gas profits are in terminal decline, because we now rely less on the energy stored in ‘chemical bonds’ of portable fossil fuels, and rely more on the energy of ‘moving electrons’ generated from unportable alternative energy sources. Basic resources profits are in terminal decline, because we now rely less on the ‘physical stuff’ that requires basic resources. As such, structurally overweighting the value-heavy European market versus the growth-heavy US market is a ‘widow maker’ trade. The caveat is that a vicious snapback out of growth into value is possible when a universally accepted treatment for Covid-19 is found. Or if bond yields spike. This would create a burst of outperformance from Europe, but any such snapback would be a brief interruption to the mega downtrend. Fractal trade: Long RUB/CZK. Feature Chart of the WeekValue' Has Underperformed For 12 Years... But The Mega Downtrend Isn't Over
Value' Has Underperformed For 12 Years... But The Mega Downtrend Isn't Over
Value' Has Underperformed For 12 Years... But The Mega Downtrend Isn't Over
I have just returned from a summer holiday, on which I took a clean break from the financial markets. A clean break that is highly recommended for anybody who looks at the markets day in, day out. Nevertheless, I made two market-relevant observations. First, that having to wear a face mask on an aeroplane was an unpleasant experience. Tolerable for a short-haul flight lasting a couple of hours, but something that would be unbearable for the duration of a long-haul flight. Second, that even the most popular bars and restaurants in the most popular places were operating at half capacity. They were fully booked, yet the requirements of physical distancing at the bar, and between tables, meant that their operating capacity and revenues had collapsed. Worse, the owners feared a further hit in the winter when eating and drinking in their outdoors spaces became impossible. The use of face masks and physical distancing cripples any economic activity that requires you to have your (uncovered) mouth and nose in proximity to others. These first-hand experiences simply confirm the message in An Economy Without Mouths Or Noses Will Lose 10 Percent Of Jobs.1 The use of face masks and physical distancing cripples any economic activity that requires you to have your (uncovered) mouth and nose in proximity to others – like flying, or drinking and eating out. Hence, if governments remove the financial incentives for employers to retain workers while the pandemic is still rampant, expect structural unemployment to rise sharply. In which case, expect bond yields to remain ultra-low, and where possible, go even lower. And expect ‘growth’ sectors to continue outperforming ‘value’ sectors. Explaining Recent Market Action Returning to the financial markets after a break, several things stood out. Apple has become America’s first $2 trillion company, while HSBC’s share price is within a whisker of its 2008 crisis low. This vignette encapsulates that growth sectors – broadly defined as tech and healthcare – have been roaring ahead, while value sectors – broadly defined as banks, oil and gas, and basic resources – have been struggling. Hence, the growth-heavy S&P500 has reached a new all-time high, while the value-heavy FTSE100 and other European indexes are still deeply in the red for 2020 and have recently drifted lower (Chart I-2). The combined effect is that the strong recovery in global stocks has taken a breather. Chart I-2US Market At All-Time High, But European Markets Still Deeply In The Red
US Market At All-Time High, But European Markets Still Deeply In The Red
US Market At All-Time High, But European Markets Still Deeply In The Red
In turn, the breather in the stock market explains the recent support to the dollar. Significantly, the 2020 evolution of the dollar is a perfect mirror-image of the stock market. Nothing more, nothing less. If the stock market gives back some of its gains, expect the countertrend strengthening in the dollar to continue (Chart I-3). Chart I-3The Dollar Is A Mirror-Image Of The Stock Market
The Dollar Is A Mirror-Image Of The Stock Market
The Dollar Is A Mirror-Image Of The Stock Market
Yet the best performing major asset-class in 2020 is not growth equities, nor is it gold. Instead, it is the US 30-year T-bond, which has returned a spectacular 32 percent (Chart I-4). Chart I-4The Best Performing Major Asset-Class Is The 30-Year T-Bond
The Best Performing Major Asset-Class Is The 30-Year T-Bond
The Best Performing Major Asset-Class Is The 30-Year T-Bond
Suddenly, everything becomes crystal clear. If the ultra-long bond has surged, then other ultra-long duration investments must also surge. Within equities, this means that growth sectors, whose profits are skewed to the very distant future, must receive a huge boost to their valuations. Whereas value sectors whose profits are not growing will receive a smaller (or no) valuation boost. In fact, the value sectors have a much bigger structural problem. Not only are their profits not growing. Their profits are in terminal decline. Since 2008, Overweighting Value Has Been A ‘Widow Maker’ In the 34 years through 1975-2008, value trebled relative to growth.2 Albeit, with the occasional vicious countertrend move, such as the dot com bubble. But through 2009-2020, the tables turned. For the past 12 years, value has structurally underperformed growth and given back around half of its 1975-2008 outperformance (Chart of the Week). This means that for the past 12 years ‘proxy’ value versus growth positions have also structurally underperformed. The best example of such a proxy position is overweighting the value-heavy European market or Emerging Markets versus the growth-heavy US market. Since 2008, underweighting the US market has been a ‘widow maker’ trade. A widow maker trade is when you are on the wrong side of a megatrend. A widow maker trade is when you are on the wrong side of a megatrend. It is a widow maker because it can kill your career, or your finances, or both. The big danger is that a widow maker trade can last for decades. As the uptrend in value versus growth lasted more than three decades, there is no reason to suppose that the downtrend cannot also last a very long time. What drove value’s outperformance for 34 years, and what is driving its underperformance for the past 12 years? The simple answer is the structural trend in profits. Until 2008, the profits of banks, oil and gas, and basic resources kept up with, or even beat, the profits of technology and healthcare. This, combined with the higher yield on these value sectors, resulted in the multi-decade 200 percent outperformance of value versus growth. But since 2008, while the profits of technology and healthcare have continued their strong uptrends, the profits of banks, oil and gas, and basic resources have entered major structural downtrends. It is our high conviction view that these declines are terminal, and the reasons are nothing to do with the pandemic (Chart I-5). Chart I-5Value Sector Profits Are In A Major Structural Downtrend
Value Sector Profits Are In A Major Structural Downtrend
Value Sector Profits Are In A Major Structural Downtrend
Sector Profit Outlooks In One Sentence Each When a sector’s profits flip from a multi-decade uptrend to a multi-decade downtrend, it is almost unheard of for them to reflip into a new uptrend. Essentially, the sector has entered a terminal decline. As strong believers in brevity, we can summarise the reason for the terminal declines in one sentence per sector, as follows: When a sector’s profits flip from a multi-decade uptrend to a multi-decade downtrend, it is almost unheard of for them to reflip into a new uptrend. Bank profits are in terminal decline, because private sector credit is now ‘maxed out’, and the intermediation between borrowers and savers can be done more cost-effectively by the blockchain (Chart I-6). Chart I-6Bank Profits In Terminal Decline
Bank Profits In Terminal Decline
Bank Profits In Terminal Decline
Oil and gas profits are in terminal decline, because we now rely less on the energy stored in ‘chemical bonds’ of portable fossil fuels, and rely more on the energy of ‘moving electrons’ generated from unportable alternative energy sources (Chart I-7). Chart I-7Oil And Gas Profits In Terminal Decline
Oil And Gas Profits In Terminal Decline
Oil And Gas Profits In Terminal Decline
Basic resources profits are in terminal decline, because we now rely less on the ‘physical stuff’ that requires basic resources (Chart I-8). Chart I-8Basic Resources Profits In Terminal Decline
Basic Resources Profits In Terminal Decline
Basic Resources Profits In Terminal Decline
Conversely: Technology profits can grow, because we now rely more on information, ideas, and advice, and over half of the world’s population is still not connected to the internet (Chart I-9). Chart I-9Technology Profits Continue To Grow
Technology Profits Continue To Grow
Technology Profits Continue To Grow
Healthcare profits can grow, because as economies (and people) mature, they spend a much greater proportion of their income on healthcare to improve the quality and quantity of life (Chart I-10). Chart I-10Healthcare Profits Continue To Grow
Healthcare Profits Continue To Grow
Healthcare Profits Continue To Grow
Nevertheless, a vicious snapback out of growth into value is possible. Indeed, it is to be expected when a universally accepted treatment for Covid-19 is found. Or if bond yields spike. But any such snapback, even if vicious, will be a brief countertrend rally in a terminal decline. This is because the megatrends driving down value sector profits were already in place long before the pandemic hit. The pandemic just gave the megatrends an extra nudge. This is our high conviction view. Fractal Trading System* This week’s recommended trade is long RUB/CZK, with the profit target and symmetrical stop-loss set at 5 percent. In other trades, the explosive rallies in precious metals reached exhaustion as anticipated by their fragile fractal structures. This has taken our short gold versus lead position into profit. However, short silver was stopped out before its rally eventually ended. The rolling 1 year win ratio now stands at 60 percent. Chart I-11RUB/CZK
RUB/CZK
RUB/CZK
When the fractal dimension approaches the lower limit after an investment has been in an established trend it is a potential trigger for a liquidity-triggered trend reversal. Therefore, open a countertrend position. The profit target is a one-third reversal of the preceding 13-week move. Apply a symmetrical stop-loss. Close the position at the profit target or stop-loss. Otherwise close the position after 13 weeks. * For more details please see the European Investment Strategy Special Report “Fractals, Liquidity & A Trading Model,” dated December 11, 2014, available at eis.bcaresearch.com. Dhaval Joshi Chief European Investment Strategist dhaval@bcaresearch.com Footnotes 1 Please see the European Investment Strategy Weekly Report "An Economy Without Mouths Or Noses Will Lose 10 Percent Of Jobs", dated July 30, 2020 available at eis.bcaresearch.com. 2 In total return terms. Fractal Trading System Cyclical Recommendations Structural Recommendations Closed Fractal Trades Trades Closed Trades Asset Performance Currency & Bond Equity Sector Country Equity Indicators Bond Yields Chart II-1Indicators To Watch - Bond Yields
Indicators To Watch - Bond Yields
Indicators To Watch - Bond Yields
Chart II-2Indicators To Watch - Bond Yields
Indicators To Watch - Bond Yields
Indicators To Watch - Bond Yields
Chart II-3Indicators To Watch - Bond Yields
Indicators To Watch - Bond Yields
Indicators To Watch - Bond Yields
Chart II-4Indicators To Watch - Bond Yields
Indicators To Watch - Bond Yields
Indicators To Watch - Bond Yields
Interest Rate Chart II-5Indicators To Watch - Interest Rate Expectations
Indicators To Watch - Interest Rate Expectations
Indicators To Watch - Interest Rate Expectations
Chart II-6Indicators To Watch - Interest Rate Expectations
Indicators To Watch - Interest Rate Expectations
Indicators To Watch - Interest Rate Expectations
Chart II-7Indicators To Watch - Interest Rate Expectations
Indicators To Watch - Interest Rate Expectations
Indicators To Watch - Interest Rate Expectations
Chart II-8Indicators To Watch - Interest Rate Expectations
Indicators To Watch - Interest Rate Expectations
Indicators To Watch - Interest Rate Expectations