Sectors

Lightening Up On Defensives
Lightening Up On Defensives
Underweight We have been adding cyclical exposure to the portfolio and lightening up on defensives and as a continuation of this shift we recently downgraded the S&P hypermarkets group to underweight. The economy is reopening and thus it no longer pays to seek refuge in safe haven hypermarket equities. In fact, most of the macro indicators we track suggest the recession is over that will sustain severe downward pressure on relative share prices. The chart on the right shows that the ISM manufacturing new orders subcomponent has slingshot from below 30 to north of 60, junk spreads are probing all-time lows, consumer confidence has troughed and small and medium enterprises hiring intentions are on the mend. Bottom Line: Trim the S&P hypermarkets index to underweight. The ticker symbols for the stocks in this index are: BLBG S5HYPC – WMT, COST. For more details, please refer to this Monday’s Weekly Report.
Highlights Portfolio Strategy Softening operating metrics, the falling US dollar, the reopening of the economy, all suggest that investors should avoid hypermarket stocks. A firming macro backdrop, the USD’s recent drop, along with the bearish signals from financial variables, all concur that investors should start a program of modestly shedding consumer staples exposure. Recent Changes Downgrade the S&P hypermarkets index to underweight, today. This move also pushes our S&P consumer staples sector to a modest below benchmark allocation. Table 1
Lessons From The 1940s
Lessons From The 1940s
Feature In our March 23 Weekly Report, when we identified 20 reasons to start buying equities, we published a cycle-on-cycle profile (Chart 1, top panel) of how the SPX performs following a greater than 20% drawdown. History suggested that, on average, new all-time highs would emerge sometime in early 2022! Unfortunately, this assessment proved offside as the S&P 500 made fresh all-time closing highs last week, less than five months from the March 23 trough. Chart 1Overstretched
Overstretched
Overstretched
Nevertheless, comparing the current unprecedented SPX rebound with the historical recessionary profile remains instructive as it highlights how excessively stretched equities currently appear. The bottom panel of Chart 1 warns that the SPX is vulnerable to a snapback, were the SPX to return to the historical mean or median recovery profile. Likely rising (geo)political risks could serve as a near-term catalyst for a healthy pullback. Importantly, all of the SPX’s return since the March lows is due to the multiple expansion and then some, as forward EPS have taken a beating (not shown). Equities are long duration assets and given the drubbing in the discount rate, the forward P/E multiple has done all the heavy lifting. Chart 2 puts some historical context to the S&P 500 forward P/E going back to 1979 using I/B/E/S data. Empirical data supports finance theory and shows that the 40-year bull market in bond prices has caused a structural upshift to the SPX forward P/E. Chart 2Moving In Opposite Directions
Moving In Opposite Directions
Moving In Opposite Directions
While low rates explain the near all-time highs in the SPX forward P/E, looking ahead we doubt that the SPX multiple can expand much further if we assume that the easy assist from ZIRP is behind us and will not repeat; i.e. the Fed will refrain from wrecking the US banking system by exploring NIRP. In contrast, our analysis suggests that a selloff in the bond market is the missing ingredient that will ignite a massive rotation out of growth stocks and into value and propel deep cyclicals versus defensives to uncharted territory. More specifically, the rallies in copper prices, crude oil and the CRB Raw Industrials index need confirmation from the bond market that they are demand, rather than supply driven. This backdrop will also shift equity returns within deep cyclicals away from a handful of tech stocks and toward other beaten down high operating leverage sectors (i.e. energy, industrials and materials) as we posited in our recent August 3 Special Report “Top 10 Reasons To Start Nibbling On Cyclicals At The Expense Of Defensives”. Zooming out and observing how investors have moved capital from one asset class to the next in the aftermath of QE5 is in order (Chart 3). First, the SPX enjoyed a V-shaped recovery from the March 23 lows. Then in early-May, as we first posited in our May 11 Weekly Report, the big EURUSD up-move was set in motion and investors started piling into short USD positions taking cue from the Fed’s QE5 that was directly targeting the US dollar with liquidity swaps. The debasing of the dollar served as a global reflator. Now the final piece of the QE5 puzzle is the bond market. Chart 3 highlights that in order for QE to work, counterintuitively a selloff in the bond market would confirm that the economy is healing and is ready to start standing on its own two feet. The jury is still out. With regard to the Fed’s remaining bullets, yield curve control (YCC) is one unorthodox tool that the FOMC could choose to deploy in the coming years. On that front, turning back in time and drawing parallels with the 1940s is instructive. In 1942 the Fed, at the behest of the Treasury, pegged long-term interest rates at 2.5% and ballooned its balance sheet in order to finance the government’s expenditures during WWII. The Fed surrendered its independence, and this YCC unwarrantedly stayed in place until 1951 when in the midst of the Korean War, the Treasury-Federal Reserve Accord finally ended the peg of government long-dated bond interest rates.1 Chart 3Bonds Yields Are Left To Rally
Bonds Yields Are Left To Rally
Bonds Yields Are Left To Rally
Chart 4WWII-Like Starting Point
WWII-Like Starting Point
WWII-Like Starting Point
Chart 4 shows the ebbs and flows of the US government’s total debt-to-GDP ratio and fiscal deficit as a percentage of output since 1940. While the debt-to-GDP profile fell from 1945 onward owing partially to a tight fiscal ship that the US subsequently ran, it troughed when the US floated the greenback. Since then, the US has been fiscally irresponsible running large budget deficits and the debt-to-GDP ratio has never looked back and very recently went parabolic (top panel, Chart 4). Charts 5 & 6 take a closer look at some macro variables in the 1940s and Charts 7 & 8 compare them to today. Chart 5The…
The…
The…
Chart 6…1940s…
…1940s…
…1940s…
First, YCC did not prevent the late-1948 recession (Chart 5, shaded areas). Crudely put, monetary stimulus is not a panacea for boom/bust cycles. Second, M2 growth was climbing at a 30%/annum rate, the money multiplier was on a secular advance and money velocity was surging especially in the first half of the 1940s (Chart 6). As a result and as expected, YCC caused three significant inflationary jumps (bottom panel, Chart 6) that aided the US government in bringing down the massive debt-to-GDP ratio (i.e. inflating its way out of a debt trap) that it had accumulated via large deficits in the front half of the 1940s (top panel, Chart 5). Third, interest rates were a coiled spring and once the Treasury-Fed Accord was signed, they exploded higher (fourth panel, Chart 5). Finally, equities fared well during the first three years of YCC until the end of WWII, but then suffered an outsized setback until mid-1949, before recovering and taking out the 1945 highs in 1951 (bottom panel, Chart 5). Chart 7...Compared With…
...Compared With…
...Compared With…
Chart 8…Today
…Today
…Today
Were the Fed to embark on YCC in the near-future in order to monetize the US government’s deficits, there are a few parallels to draw with the 1940s especially given that the starting point of debt-to-GDP is similar to the WWII figure (top panel, Chart 4). The Fed would likely lose its independence. This would be a paradigm shift. The Fed would crowd out fixed income investors, and flood the market with US dollars. M2 money stock would continue to surge. Few investors will be chasing US dollar assets including equities. The path of least resistance would be significantly lower for the US dollar as foreign investors would flee. This debt monetization along with a depreciating currency and swelling money supply would result in inflation rearing its ugly head, especially given that import prices would soar. What is difficult to envision is how the economy would perform during an inflationary impulse. Our sense is that the risk of stagflation would rise significantly, especially given the current inverse correlation between M2 growth and the velocity of money.2 In the stagflationary 1970s, any liquidity injections via higher M2 growth failed to translate into rising money velocity. Importantly, the “Nixon shock” effectively ended the Bretton Woods system and floated the US dollar causing a 40% devaluation from peak-to-trough (Chart 9). Tack on the oil related supply shock and stagflation reigned supreme in the 1970s, owing to cost-push inflation. Chart 9Dollar The Reflator
Dollar The Reflator
Dollar The Reflator
In contrast during the 1940s, demand-pull inflation hit the economy rather hard, as the US was retooling its industrial base to win WWII alongside its allies. Also the US dollar was linked to gold since the Gold Reserve Act of 1934 and ten years later the Bretton Woods international monetary agreement ushered in the era of fixed exchange rates, which is a big difference from the 1970s.3 As a reminder, from a political perspective venturing down the inflation avenue is the least painful way of dealing with a debt burden, rather than pursuing tight fiscal policy which is synonymous with political suicide. From an equity perspective, owning commodity-levered sectors and other hard asset-linked equities including REITs would make sense as we highlighted in our recent inflation Special Report. Health care stocks would also shine in case of an inflationary spurt according to empirical evidence that we highlighted in the same Special Report. On the flip side, our inflation Special Report also revealed that shedding telecom services and utilities would be wise and most importantly avoiding technology stocks. Tech stocks are disinflationary beneficiaries as they are mired in constant deflation and have built business models not only to withstand, but also to thrive in deflation. Inflation is a tech killer as these growth stocks suffer when the discount rate spikes and causes valuations to move from a premium to a discount. Nevertheless, deflation/disinflation is more likely in the coming 12-to-18 months, whereas inflation is at least two-to-three years away as we mentioned in our recent inflation Special Report. This week we continue to augment our cyclicals versus defensives portfolio bent and take our defensive exposure down a notch by downgrading consumer staples to a modest below benchmark allocation via a downgrade in the S&P hypermarkets index. Downgrade Hypermarkets To Underweight… Last summer we upgraded the S&P hypermarkets index to overweight as we were preparing the portfolio to withstand a recessionary shock given that the yield curve had inverted. Fast forward to the March carnage in the equity markets and this defensive move served our portfolio well. However, we did not want to overstay our welcome and set a stop in order to exit this position that was triggered in late-March netting our portfolio 26% in relative gains. More recently, we have been adding cyclical exposure to the portfolio and lightening up on defensives and as a continuation of this shift we are now compelled to downgrade the S&P hypermarkets to underweight. The economy is reopening and thus it no longer pays to seek refuge in safe haven hypermarket equities. In fact most of the macro indicators we track suggest the recession is over that will sustain severe downward pressure on relative share prices. Chart 10 shows that the ISM manufacturing new orders subcomponent has slingshot from below 30 to north of 60, junk spreads are probing all-time lows, consumer confidence has troughed and small and medium enterprises hiring intentions are on the mend. Moreover, the extraordinary fiscal expansion has brought spending forward and PCE is all but certain to skyrocket when the Q3 GDP figures get released in late-October, signaling that the easy money has been made in Big Box retailers (top panel, Chart 11). Similarly, discretionary spending should pick up the slack from staple-related purchases, further dampening the need to own hypermarket shares (middle & bottom panels, Chart 11). Chart 10Rebounding Macro
Rebounding Macro
Rebounding Macro
Chart 11Returning to Normality
Returning to Normality
Returning to Normality
On the operating front, while WMT is making strides in its online presence and offering mix, non-store retail sales are on a tear dominated by King AMZN (as a reminder we are overweight the S&P internet retail index). This is a secular trend and should continue unabated and in a relative sense continue to weigh on hypermarket profitability (bottom panel, Chart 12). Finally, a significant tailwind is turning into a severe headwind for this industry: import price inflation. The US dollar has reversed course and it is in a freefall. Historically, the greenback has been an excellent leading indicator of import price inflation and the current message is grim for hypermarket razor thin profit margins (import prices shown inverted, Chart 13). Chart 12Amazonification Is On Track
Amazonification Is On Track
Amazonification Is On Track
Chart 13Currency Headwinds
Currency Headwinds
Currency Headwinds
Adding it all up, softening operating metrics, the falling US dollar, the reopening of the economy, all suggest that investors should avoid hypermarket stocks. Bottom Line: Trim the S&P hypermarkets index to underweight. The ticker symbols for the stocks in this index are: BLBG S5HYPC – WMT, COST. …Which Pushes Consumer Staples To A Below Benchmark Allocation The downgrade in the S&P hypermarkets index tilts our S&P consumer staples sector to a modest below benchmark allocation. Countercyclical consumer staples stocks served their purpose and provided the support to our portfolio in the front half of the year when we needed them most. Now that the economic reopening is gaining steam and the government, the health care system and society are all ready to effectively deal with a flare up in the pandemic, the allure of defensive positioning has diminished. In other words, COVID-19 is currently a known known risk versus an unknown unknown risk early in the year, and defending against it now is more successful. Moreover, according to our mid-April research on what sectors investors should avoid during recessionary recoveries, consumer staples stocks trail the SPX on average by 660bps one year following the SPX trough. The current macro backdrop corroborates this analysis and underscores that the path of least resistance is lower for relative share prices. Not only is the ISM manufacturing survey on fire, but also consumer confidence is making an effort to trough (ISM manufacturing and consumer confidence shown inverted, Chart 14). Meanwhile, financial market variables emit a similarly bearish signal for safe haven staples stocks. Following a brief spike in the bond-to-stock ratio (BSR), the BSR has recently resumed its downdraft (top panel, Chart 15). Volatility has all but collapsed since soaring to over 80 in March, as the Fed has orchestrated a quashing of all asset class volatilities (middle panel, Chart 15). Lastly, the pairwise correlation between stocks in the S&P 500 has also nosedived bringing some semblance of normality back into equity markets (bottom panel, Chart 15). All three of these financial market variables will continue to exert downward pressure on relative share prices. Chart 14V-shaped Recovery…
V-shaped Recovery…
V-shaped Recovery…
Chart 15...Across The Board
...Across The Board
...Across The Board
On the US dollar front, while consumer goods manufacturers get a P&L translation gain from a depreciating currency, their export exposure is on par with the SPX and does not provide a relative advantage. In marked contrast, empirical evidence shows that relative profitability moves in tandem with the greenback and the USD recent weakness will undercut consumer staples profitability (bottom panel, Chart 16), especially via climbing input cost inflation. In sum, a firming macro backdrop, the US dollar’s recent drop, along with the bearish signals from financial variables, all concur that investors should start a program of modestly shedding consumer staples exposure. Bottom Line: Downgrade the S&P consumer staples index to underweight. Chart 16Mind the Gap
Mind the Gap
Mind the Gap
Anastasios Avgeriou US Equity Strategist anastasios@bcaresearch.com Footnotes 1 https://www.richmondfed.org/publications/research/special_reports/treasury_fed_accord/background 2 The velocity of money “is the number of times one dollar is spent to buy goods and services per unit of time. If the velocity of money is increasing, then more transactions are occurring between individuals in an economy.” Source: Federal Reserve Bank of St. Louis. 3 Our colleagues from The Bank Credit Analyst recently illustrated how a strong dollar is good for the US economy on a medium term basis. Current Recommendations Current Trades Strategic (10-Year) Trade Recommendations
Drilling Deeper Into Earnings
Drilling Deeper Into Earnings
Size And Style Views July 27, 2020 Overweight cyclicals over defensives April 28, 2020 Stay neutral large over small caps June 11, 2018 Long the BCA Millennial basket The ticker symbols are: (AAPL, AMZN, UBER, HD, LEN, MSFT, NFLX, SPOT, TSLA, V). January 22, 2018 Favor value over growth
Dear Client, I will be on vacation next week. Instead of our regular report, we will be sending you a Special Report from my colleague Jonathan LaBerge. Jonathan will explore the risks posed to commercial real estate and the banking system from work-from-home policies and the potential for urban flight towards less populated and more affordable areas. I hope you find his report insightful. Best regards, Peter Berezin, Chief Global Strategist Highlights The Nasdaq 100 index is up 31% since the start of the year. The “Awesome 8” stocks (Amazon, Apple, Facebook, Google, Microsoft, Netflix, Nvidia, and Tesla) have gained a staggering 59%. Will tech outperformance continue? There are five reasons to think it will not: 1) The dismantling of pandemic lockdown measures, hopefully facilitated by a vaccine later this year, could shift some spending from the online realm back to brick-and-mortar stores; 2) Interest rates are unlikely to fall much further, which will remove one of the tailwinds propelling tech outperformance; 3) Tech valuations are now quite stretched; 4) Many marquee tech companies have become so big that further gains in market share may be difficult to achieve; 5) Regulatory and tax policy changes could negatively impact a number of prominent tech names. A pivot in market leadership from tech to non-tech is likely to foster the outperformance of value over growth and non-US over US stocks. Are The Awesome 8 At Risk Of Becoming The Awful 8? After plunging alongside the rest of the stock market in March, tech stocks have roared back. The tech-heavy Nasdaq 100 is up 31% since the start of the year. The “Awesome 8” stocks (Amazon, Apple, Facebook, Google, Microsoft, Netflix, Nvidia, and Tesla) have gained a staggering 59% on a market cap-weighted basis. Meanwhile, the median US stock has lost 14% this year (Chart 1). Will tech outperformance continue? There are five reasons to think it will not: Reason #1: The dismantling of pandemic lockdown measures could shift some spending from the online realm back to brick-and-mortar stores The pandemic has led to a major reallocation of spending from brick-and-mortar stores to online retailers. Sales at US online stores increased by 25% year-over-year in July versus -1% at physical stores (Chart 2). According to Bank of America, after rising steadily from about 5% in 2009 to 16% in 2019, the US e-commerce penetration rate has jumped to 33%, representing more than ten years of growth in only a few months. Chart 1Awesome 8 Propelling Tech Stocks To New Highs
Awesome 8 Propelling Tech Stocks To New Highs
Awesome 8 Propelling Tech Stocks To New Highs
Chart 2Will The Dismantling Of Lockdown Measures Bring Brick-And-Mortar Retailers Back To Life?
Will The Dismantling Of Lockdown Measures Bring Brick-And-Mortar Retailers Back To Life?
Will The Dismantling Of Lockdown Measures Bring Brick-And-Mortar Retailers Back To Life?
There is little doubt that we are still in the midst of a secular transition towards e-commerce. However, it is likely that the dismantling of lockdown measures – hopefully facilitated by the release of a vaccine later this year – will bring back some spending to brick-and-mortar stores. This could produce a temporary air pocket in sales for online sellers, a risk that does not seem to be fully discounted (Chart 3). Chart 3Online Retail Spending Could Slow, At Least Temporarily, As Shopping Malls Reopen
The Return Of Nasdog
The Return Of Nasdog
Chart 4The Pandemic Has Caused Global Server And PC Shipments To Surge
The Pandemic Has Caused Global Server And PC Shipments To Surge
The Pandemic Has Caused Global Server And PC Shipments To Surge
Meanwhile, other tech companies that have benefited from the pandemic could face headwinds. Netflix saw its global subscriber count jump 27% in the second quarter relative to a year earlier. If someone did not bother to purchase a Netflix subscription in March or April, how likely is it that they will subscribe for the first time in September? Along the same lines, global PC and server shipments surged to multi-year highs earlier this year as millions of people were forced to work from home (Chart 4). This likely brought demand for computers and peripheral equipment forward, which could produce a spending vacuum over the next few quarters. Reason #2: Interest rates are unlikely to fall much further, which will remove one of the tailwinds propelling tech outperformance Technology companies are used to cutting prices on older models as newer, more innovative versions come to market. In this sense, deflation is built into their business models. Many tech companies also trade on long-term growth prospects, which means that changes in discount rates have a disproportionately greater impact on the present value of their cash flows than for slower growing companies. All this means that tech stocks tend to outperform in environments where inflation and interest rates are falling. Chart 5Higher Bond Yields Will Benefit Financials
Higher Bond Yields Will Benefit Financials
Higher Bond Yields Will Benefit Financials
We do not expect inflation to surge over the next two years. Nevertheless, the deflationary impulse from the pandemic is likely to abate as spare capacity is absorbed and overall demand recovers. Likewise, bond yields are likely to rise modestly over the next 12 months. Higher bond yields will benefit bank shares (Chart 5). Reason #3: Tech valuations have gotten increasingly stretched Based on full-year estimates, the Nasdaq 100 trades at 32-times 2020 earnings and 27-times 2021 earnings. The Awesome 8 stocks are even more pricey, trading at 43-time and 34-times this year’s and next year’s earnings, respectively (Table 1). Table 1Equity Valuations: Tech Versus Non-Tech
The Return Of Nasdog
The Return Of Nasdog
Outside the IT sector, the S&P 500 trades at 26-times 2020 earnings and 20-times 2021 earnings. It should be noted that these numbers overstate how expensive the non-tech part of the S&P 500 index really is because Amazon resides in the consumer discretionary sector while Facebook, Google, and Netflix sit in the communication sector. In fact, only three of the Awesome 8 are in the S&P 500 IT sector (Tesla has yet to be admitted into the S&P 500, despite having a market cap that would now make it the 10th most valuable company in the index, right ahead of P&G). While the PE ratio on tech stocks is still well below the nosebleed levels reached during the dot-com bubble, other valuation measures are approaching their prior peaks. The S&P 500 IT sector now trades at 6.2-times sales, not far below the peak price-to-sales of 7.8 reached in 2000. Tech stocks trade at 9.6-times book value, the highest level since early 2001, and more than double their peak valuation level in 2007 (Chart 6). Reason #4: Many marquee tech companies have become so big that further gains in market share may be difficult to achieve The Nasdaq’s lofty valuation presumes that earnings will continue to rise at a rapid pace for many years to come. That has certainly been true for the past decade. The Nasdaq 100 enjoyed annualized earnings per share growth of 16% since 2010, 2.5-times the pace of the S&P 500 index and 3.2-times faster than the non-IT constituents of the S&P 500. Indeed, most of the outperformance of tech stocks can be chalked up to their faster earnings growth (Chart 7). Chart 6Tech Stocks: Some Valuation Measures Are Quite Stretched
Tech Stocks: Some Valuation Measures Are Quite Stretched
Tech Stocks: Some Valuation Measures Are Quite Stretched
Chart 7Most Of The Outperformance Of Tech Stocks Can Be Attributed To Faster Earnings Growth
Most Of The Outperformance Of Tech Stocks Can Be Attributed To Faster Earnings Growth
Most Of The Outperformance Of Tech Stocks Can Be Attributed To Faster Earnings Growth
But will such earnings growth continue? That is far from certain. Bottom-up estimates foresee earnings per share among Nasdaq 100 members rising by 20% in 2021. This is actually below the projected earnings growth of 27% for the S&P 500. One sees a similar pattern within S&P 500 sectors: The IT sector is expected to see earnings growth of 15% in 2021 compared with 31% for non-IT sectors (Table 2). Table 2Earnings Growth Projections
The Return Of Nasdog
The Return Of Nasdog
Admittedly, the faster projected earnings growth of non-tech companies in 2021 will constitute a reversal of this year’s pandemic-induced earnings collapse, from which tech was largely insulated. Thus, there is a base effect at work. Nevertheless, if most investors focus mainly on annual growth rates, they could become enamoured with non-tech stocks, at least temporarily. Looking further out, the rapid growth in tech earnings could decelerate as many of today’s marquee tech companies struggle to expand market share. Close to three-quarters of US households already have an Amazon Prime account. Slightly over half have a Netflix account. Nearly 70% have a Facebook account. Google commands 92% of the internet search market. Together, sites owned by Google and Facebook generate about 60% of all online advertising revenue. New opportunities for growth will undoubtedly arise, but there is no guarantee that today’s leaders will be able to take advantage of them. History is littered with tech companies that failed to keep up with a changing world: RCA, Kodak, Polaroid, Atari, Commodore, Novell, Digital, Sinclair, Wang, Iomega, Corel, Netscape, Altavista, AOL, Compaq, Sun, Lucent, 3Com, Nokia, and RIM were all major players in their respective industries, only to fade into oblivion. Stock market investors were very lucky that companies such as Microsoft, Cisco, Nvidia, Qualcomm, Oracle, Amazon, and Netflix issued shares to the public at an early stage in their development (Table 3). All seven had market caps below $1 billion when they went public. Such hidden gems are becoming less common: The number of publicly listed companies in the US is still well below what it was two decades ago (Chart 8). The median age of tech companies at the time of their IPO has risen from around 7 years in the 1990s to 11 years in 2019 (Chart 9). Table 3Big Gains From Once Small Companies
The Return Of Nasdog
The Return Of Nasdog
Chart 8The Number Of US Publicly Listed Companies Is Not What It Once Was
The Number Of US Publicly Listed Companies Is Not What It Once Was
The Number Of US Publicly Listed Companies Is Not What It Once Was
Chart 9Tech Companies Entering The Public Arena Are Now More Mature
The Return Of Nasdog
The Return Of Nasdog
Reason #5: Regulatory and tax policies could negatively impact a number of prominent tech names Historically, the US government has taken a laissez-faire approach towards the tech sector. As an avowedly pro-business party, the Republicans were happy to espouse deregulation and low corporate taxes, while lauding Silicon Valley’s dynamism and global dominance. The Democrats also had a cozy relationship with the tech sector. As Chart 10 shows, political donations from tech company employees are heavily skewed towards Democratic candidates. Chart 10Tech Company Employees Donate Heavily Towards Democrats
The Return Of Nasdog
The Return Of Nasdog
Things may not be as easy for the tech sector going forward, however. Conservatives have accused social media companies of stifling their voices. According to a recent Pew Research study, 53% of conservative Republicans favor increasing government regulation of big tech companies, up from 42% in 2018 (Chart 11). For their part, Democrats have expressed concerns about the growing monopoly power of tech companies and their perceived insouciant attitude towards consumer privacy. Chart 11Conservatives Favor Increased Government Regulation Of Big Tech Companies
The Return Of Nasdog
The Return Of Nasdog
A Biden administration would not be as tough on tech companies as say, an Elizabeth Warren administration. Nevertheless, Biden has said that breaking up big tech companies is "something we should take a really hard look at."1 He has also argued that online platforms should not be granted legal immunity for user-generated content. On the tax side, Biden has vowed to reverse half of Trump’s corporate tax cuts, while introducing a minimum 15% corporate tax. The latter could disproportionately affect a number of prominent tech companies that have taken full advantage of the current tax code to minimize their tax liabilities. Meanwhile, tech companies are increasingly finding themselves in the crossfire between China and the US. While Joe Biden would not be as quick to impose unilateral tariffs on China as Donald Trump, BCA Research’s geopolitical strategists warn that the rivalry between the two nations will intensify over the coming decade as they reduce their economic interdependency and vie for military advantage in Asia.2 This could have adverse implications for tech firms’ ability to maximize global market share, never mind optimizing global supply chains. Pivot Towards Value And International Stocks Tech stocks are overrepresented in growth indices, while financials dominate value indices (Table 4). Thus, it is not surprising that the relative performance of tech versus financial stocks has closely mirrored the relative performance of growth versus value stocks (Chart 12). If tech stocks shift from being leaders to laggards, value stocks will shift from being laggards to leaders. Table 4Breaking Down Growth And Value By Sector
The Return Of Nasdog
The Return Of Nasdog
Chart 12The Relative Performance Of Tech Stocks Has Closely Mirrored The Relative Performance Of Growth Versus Value
The Relative Performance Of Tech Stocks Has Closely Mirrored The Relative Performance Of Growth Versus Value
The Relative Performance Of Tech Stocks Has Closely Mirrored The Relative Performance Of Growth Versus Value
Chart 13The Valuation Gap Between Value And Growth Is Larger Today Than At The Height Of The Dot-Com Bubble
The Valuation Gap Between Value And Growth Is Larger Today Than At The Height Of The Dot-Com Bubble
The Valuation Gap Between Value And Growth Is Larger Today Than At The Height Of The Dot-Com Bubble
Value stocks usually appear “cheap” in relation to growth stocks, but the valuation gap is much larger today than in the past – larger, in fact, than at the height of the dot-com bubble (Chart 13). Despite their name, growth stocks usually underperform value stocks when global growth is on the upswing (Chart 14). Provided that progress is made towards developing a vaccine, global growth should remain above trend over the next 12 months, giving value stocks a lift. Chart 14Growth Stocks Usually Underperform Value Stocks When Global Growth Is On The Upswing
Growth Stocks Usually Underperform Value Stocks When Global Growth Is On The Upswing
Growth Stocks Usually Underperform Value Stocks When Global Growth Is On The Upswing
Value stocks also generally do better when the US dollar is weakening. Recall that tech stocks did phenomenally well in the late 1990s when the dollar was rising, but faltered during the period of dollar weakness from 2001 to 2008 (Chart 15). As we discussed last week, the dollar is likely to depreciate further in the months ahead. Chart 15Value Stocks Generally Do Better When The US Dollar Is Weakening
Value Stocks Generally Do Better When The US Dollar Is Weakening
Value Stocks Generally Do Better When The US Dollar Is Weakening
Chart 16Stronger Global Growth And A Weaker US Dollar Tend To Be Good News For Non-US Stocks
Stronger Global Growth And A Weaker US Dollar Tend To Be Good News For Non-US Stocks
Stronger Global Growth And A Weaker US Dollar Tend To Be Good News For Non-US Stocks
Stronger global growth and a weaker US dollar tend be good news for non-US stocks (Chart 16). As US tech stocks enter a holding pattern, stock markets outside the US will assume the upper hand. Investors should reallocate equity capital towards value stocks and overseas stock markets. Peter Berezin Chief Global Strategist peterb@bcaresearch.com Footnotes 1 Hunter Woodall, “2020 hopeful Biden says he’s open to breaking up Facebook,” The Associated Press, May 13, 2019. 2 Please see Geopolitical Strategy Weekly Report, “A Tech Bubble Amid A Tech War,” dated July 31, 2020. Global Investment Strategy View Matrix
The Return Of Nasdog
The Return Of Nasdog
Current MacroQuant Model Scores
The Return Of Nasdog
The Return Of Nasdog
Dear clients, The Foreign Exchange Strategy will take a summer break next week. We will resume our publication on September 4th. Best regards, Chester Ntonifor, Vice President Foreign Exchange Strategy Feature The economy of Hong Kong SAR1 has been held under siege by two tectonic forces. With the highest share of exports-to-GDP in the world, and at very close proximity to China, the epicenter of the pandemic shock, economic growth has been knocked down hard. The second shock to Hong Kong’s economy has been political instability. The extradition bill that was proposed in February 2019, followed by the enactment of the national security law this past June, has been accompanied by cascading street-wide protests and social unrest. The spirit of the bill is that crimes committed in Hong Kong can be trialed in China. The US has moved to impose sanctions on Hong Kong, as it no longer sees the city-state as autonomous, the latest of which is revoking its extradition treaty with the former colony. Some commentators have defined this as the end of the one country, two systems socio-economic model that has been in place since the handover from British rule in 1997. From a currency perspective, these shocks put in question the sustainability of the Hong Kong dollar (HKD) peg. Historically, currency pegs more often than not fail, especially in the midst of both geopolitical and economic turmoil. This was the story of the Asian Financial crisis in the late 1990s, and the Mexican peso crisis earlier that decade. Is the Hong Kong dollar destined for the same fate? If so, what are the potential adjustments in the exchange rate? Finally, what indicators can investors look to as a guide for any pending adjustment? A Historical Perspective Chart 137 Years Of Stability
37 Years Of Stability
37 Years Of Stability
The HKD is no stranger to shifting exchange-rate regimes. Over the last 170 years, it has been linked to the Chinese yuan, backed by silver, pegged to the British pound, free-floating, and, since 1983, tied to the US dollar. Therefore, a bet on the unsustainability of the peg is historically justified. That said, the stability of the peg to the US dollar has survived 37 years of economic volatility, suggesting the Hong Kong Monetary Authority (HKMA) has been able to successfully navigate a post-Bretton Woods currency era (Chart 1). Beginning as a bi-metallic monetary regime in the early 19th century, the HKD was initially linked to gold and silver prices, akin to the commodity–monetary standard that dominated that era. When Britain colonized Hong Kong in 1841, and as new trade alliances developed, the drawbacks of the bi-metallic monetary standard became apparent. As bilateral trade boomed, adjustments to imbalances (surpluses or deficits) could not occur through the exchange rate since it was fixed. Therefore, they had to occur through the real economy. This led to very volatile and destabilizing domestic prices. The stability of the peg to the US dollar has survived 37 years of economic volatility. Most Anglo-Saxon countries finally converted from bi-metallic exchange rates to the gold standard in the late 1800s, and strong ties to China dictated that Hong Kong naturally adopted the silver dollar in 1863. However, the silver system had the same drawbacks as the bi-metallic standard. Specifically, when your money supply is fixed, any increase in output leads to “few dollars chasing many goods.” This is synonymous with falling prices, just as “many dollars chasing few goods” is synonymous with rising inflation. The petri dish for this phenomenon was the post-World War I construction boom. A fixed money supply under the gold (and silver) standard meant rapidly falling prices globally. By the late 1920s, most countries had overvalued exchange rates relative to gold (and silver), that exerted powerful deflationary forces on their domestic economies. This forced most Western governments to debase fiat money vis-à-vis gold to stop price deflation. Correspondingly, China had to abandon the silver standard in November 1935, with Hong Kong shortly following suit. At the time of debasement, the United Kingdom was the leading economic power. As a colony, it made sense for the Hong Kong government to link the HKD to the British pound. The established rate was GBP/HKD 16, giving birth to the currency board system (Chart 2). Meanwhile, as a trading hub, a peg with an international currency made sense. The problems there were two-fold. First, the pound was still gold-linked. And second, Britain’s subsequent decline in economic power was accompanied by a series of sudden and dramatic devaluations in the pound, which was hugely disruptive to Hong Kong’s financial system. By 1972, the British government decided to float the pound, which effectively ended the GBP/HKD peg. Chart 2A History Of The HKD Peg
A History Of The HKD Peg
A History Of The HKD Peg
In July 1972, the authorities made the decision to peg the Hong Kong dollar to the US dollar at USD/HKD 5.65, which was another policy mistake. The switch made sense given the rising economic power of the US, as well as rising trade links (Chart 3). However, the dollar was also under a crisis of confidence following the Nixon devaluation in 1971. In February 1973, the HKD was freely floated. Chart 3The Peg Is Usually Against The Dominant Economic Power
The Peg Is Usually Against The Dominant Economic Power
The Peg Is Usually Against The Dominant Economic Power
Counter-intuitively, the free-floating era for HKD was arguably the most volatile for its domestic economy. For one, discipline in monetary policy was gone. Money and credit growth exploded, inflation hit double-digits, home prices soared and the trade balance massively deteriorated. Political instability was also rife, given the uncertainty surrounding the end of British claims on the island. As the dialogue included China’s reclaim of political control over Hong Kong, there was uncertainty over the rule of law. This cocktail of political and economic uncertainty led to a 33% depreciation in the HKD between mid-1980 and October 1983. Panicked policymakers returned to the US dollar peg. Paul Volcker, then Federal Reserve chairperson, was establishing himself as the world’s most credible central banker, having dropped US inflation from almost 15% in 1980 to below 3% by 1983. Economic and financial links with the US also justified a peg. In August of 1983, the authorities announced a USD/HKD fixed rate of 7.80, which has remained in place since. The Current Peg: Advantages And Disadvantages Chart 4Fiscal Prudence In Hong Kong
Fiscal Prudence In Hong Kong
Fiscal Prudence In Hong Kong
The advantage of the HKD peg is that the choice of the nominal anchor, the US dollar, renders it credible. First, the US dollar is an international reserve currency dominating international trade, which helps to facilitate settlements while instilling confidence among transacting participants. As a financial hub, this is crucial for Hong Kong. Meanwhile, such an anchor imposes fiscal discipline, since government deficits cannot be monetized by money printing. In the case where the government tries to be profligate, the rise in inflation will lower real rates and lead to capital outflows. This will force the HKMA to sell US dollars and absorb local currency. In the extreme case, the central bank can run out of reserves, causing the peg to collapse. Indeed, over the past several years, government debt in Hong Kong has been close to nil (Chart 4). The drawback of a fixed exchange rate regime is that a country or a region relinquishes control over independent monetary policy. In the case of Hong Kong, this means that interest rates are determined by the actions of the US Fed. Such a marriage was justified when the business cycles between the two economies were in sync, but in times of economic divergences, the fixed exchange rate leads to economic volatility. Chart 5Currency Peg And Internal Devaluation
Currency Peg And Internal Devaluation
Currency Peg And Internal Devaluation
Chart 6Hong Kong Interest Rates In The Late 90's
Hong Kong Interest Rates In The Late 90's
Hong Kong Interest Rates In The Late 90's
This divergence was clearly evident in the 1990s, as falling interest rates in the US supercharged a housing and stock market bubble in Hong Kong. When the Asian crisis finally came around in 1997, the lack of exchange-rate flexibility led to a vicious internal devaluation (Chart 5). A prolonged period of high unemployment and stagnant wages was needed for Hong Kong to finally improve its competitiveness. Most importantly, in 1998, in the depths of the Asian financial crisis, the peg attracted a concerted attack from speculators who believed a devaluation of the Hong Kong dollar alongside other regional currencies was inevitable. Their assault inflicted considerable pain, driving short-term HKD interest rates (Chart 6) and wiping out over a quarter of the local stock market in a matter of weeks. At the time, the Hong Kong government was successful in fending off the speculative attacks by intervening massively in both the foreign exchange and equity markets. Is An Adjustment Pending? If So, When? Chart 7USD/HKD And Interest Rate Spreads
USD/HKD And Interest Rate Spreads
USD/HKD And Interest Rate Spreads
As the above narrative suggests, the HKD is no stranger to socio-economic shocks and speculative attacks, and it has, more recently, weathered them pretty well. The more immediate question is whether the shift in the political landscape could be potent enough to crack the peg this time around. While plausible, it is unlikely for a few reasons. First, the HKD continues to trade on the stronger side of the peg as US interest rates have collapsed, wiping off any positive carry that would have catalyzed outflows. Fluctuations in the USD/HKD within the 7.75-7.85-band track the Libor-Hibor spread pretty closely (Chart 7). A currency board has unlimited ability to defend the strong side of the peg, since it can print currency and absorb foreign reserves (print HKDs and use these to buy USDs in this case). On the weak side, these foreign exchange reserves are drawn down. Therefore, any threat to the peg should be preceded by consistent trading on the weaker side, questioning the HKMA’s ability to keep selling FX reserves to defend the peg. Fluctuations in the USD/HKD within the 7.75-7.85-band track the Libor-Hibor spread pretty closely. Second, the Hong Kong peg remains extremely credible, since the entire monetary base is backed over two times by FX reserves (Chart 8). Even as a percentage of broad money supply, Hong Kong reserves are ample and very high by historical standards (Chart 8, bottom panel). Meanwhile, since 1983, the currency board system has undergone a number of reforms and modifications, allowing it to adapt to the changing macro environment. This represents a powerful insurance policy for the HKMA’s ability to defend the currency peg, significantly enhancing the system’s credibility. Chart 8Ample Foreign Exchange Reserves
Ample Foreign Exchange Reserves
Ample Foreign Exchange Reserves
Chart 9Hong Kong Runs Recurring Surpluses
Hong Kong Runs Recurring Surpluses
Hong Kong Runs Recurring Surpluses
Third, ever since the peg was instituted, Hong Kong has mostly run budget surpluses. As a result, government debt in Hong Kong is almost non-existent, as we illustrate above. This has removed any incentive to monetize spending, which remains an open argument in the US, Japan or even the euro area. One of our favored metrics on the health of a currency is the basic balance, and on this basis, Hong Kong scores much more favorably than the US. While Hong Kong has transitioned from being a goods exporter to that of services, it remains extremely competitive, with a healthy current account surplus of 5% of GDP (Chart 9). These recurring surpluses have propelled Hong Kong to one of the biggest creditors in the world, with a net international investment position that is a whopping 430% of GDP and rising (Chart 10). Chart 10Hong Kong Is A Net Creditor To The World
The Hong Kong Dollar Peg And Socio-Economic Debate
The Hong Kong Dollar Peg And Socio-Economic Debate
Fourth, over the past few years, productivity in Hong Kong has outpaced that of the US and most of its trading partners (Chart 11). This has lifted the fair value of the currency tremendously. This means it is more like that when the peg adjusts, the outcome will be HKD appreciation. On a real effective exchange rate basis, the HKD is not that overvalued compared to the US dollar, after accounting for the massive increase in relative productivity (Chart 12). It is notable that during the Asian financial crisis, currencies like the Thai bhat were massively overvalued, which is why the adjustment was back down toward fair value. Chart 11Hong Kong Is Highly Productive
Hong Kong Is Highly Productive
Hong Kong Is Highly Productive
Chart 12Trade-Weighted HKD Is Slightly Expensive
Trade-Weighted HKD Is Slightly Expensive
Trade-Weighted HKD Is Slightly Expensive
Fifth, there is a strong incentive for both Beijing and Hong Kong to defend the peg, because the relevance of Hong Kong is no longer as a shipping port, but as a financial center. The peg reduces volatility, as transactions are essentially dollarized. The relevance of Hong Kong in Asia can be seen by looking at the market capitalization of the Hang Seng index compared to that of the Topix index in Tokyo or the Shanghai Composite index. Any escalation in the US-China trade war, especially in the technology sphere, will only lead to more listings on the Hong Kong stock exchange. Equity flows through the HK-Shanghai and HK-Shenzhen stock connect program are rising, suggesting the market still considers Hong Kong an important intermediary in doing business with China (Chart 13). On the political front, the most potent risk is that the US Treasury moves to unilaterally limit access to US dollars by Hong Kong banks. While this was discussed by President Trump’s top advisers, it was also dismissed as unwise due to the potential shock to the global financial system. Meanwhile, with massive swap lines with the Fed, Hong Kong’s international banks can always draw on US liquidity. Tariffs on Hong Kong goods are another option, but this again will not really deal a severe blow to the peg, since Hong Kong mainly re-exports, with very little in the way of domestic goods exports (Chart 14). Chart 13Hong Kong Is An Important Financial Center
Hong Kong Is An Important Financial Center
Hong Kong Is An Important Financial Center
Chart 14Hong Kong Is Partially Insulated From Tariffs
Hong Kong Is Partially Insulated From Tariffs
Hong Kong Is Partially Insulated From Tariffs
Property Market Blues The property market is the one area in Hong Kong where a sanguine view is difficult to paint. Hong Kong is one of the most unaffordable cities on the planet, and high income inequality has been a reason behind resident angst. The gini coefficient, a measure of inequality in a society, is more elevated in Hong Kong compared to Singapore, China or even South Africa. After years of loose monetary policy, property prices in Hong Kong have completely decoupled from fundamentals. Housing is even more unaffordable now than it was back in 1997, and domestic leverage is very high. With such a high debt stock, even a gradual uptick in interest rates will have a significant impact on the debt service burden (Chart 15). Stocks and real estate prices are positively correlated, suggesting deleveraging pressures will likely be quite high if both unravel (Chart 16). Chart 15High Debt Service Burden##br## In Hong Kong
High Debt Service Burden In Hong Kong
High Debt Service Burden In Hong Kong
Chart 16Hong Kong Stocks Are Tied To The Property Market
Hong Kong Stocks Are Tied To The Property Market
Hong Kong Stocks Are Tied To The Property Market
However, there are offsetting factors. First, it is unlikely that interest rates in Hong Kong (or anywhere in the developed world for that matter) will rise anytime soon. COVID-19 has provided “carte blanche” in terms of global stimulus. More importantly, the US is at the forefront of this campaign, meaning interest rates in Hong Kong will remain low for a while. Second, in recent history, Hong Kong has proven that it has the resilience to handle volatility in the property markets. During the Asian crisis, property prices fell by 60%, yet no bank went bust. Share prices also collapsed but are much higher today, suggesting the drop was a buying opportunity. And with such a low government debt burden, any systemic threat to banks will nudge the authorities to bail out important companies and sectors. In terms of asset markets, the performance of the Hang Seng index relative to the S&P 500 is purely a function of interest rates. The US stock market is dominated by technology and healthcare that do well when interest rates fall, while banks and real estate dominate the Hong Kong market. So rising rates hurt the US stock market much more than Hong Kong (Chart 17). Meanwhile, the recent turmoil has made Hong Kong assets very cheap relative to its sister-city, Singapore (Chart 18). This suggests that a lot of the potential equity outflows have already occurred, based on today’s situation. Chart 17Interest Rates And The Hong Kong Stock Market
Interest Rates And The Hong Kong Stock Market
Interest Rates And The Hong Kong Stock Market
Chart 18Hong Kong Has Cheapened Relative To Singapore
Hong Kong Has Cheapened Relative To Singapore
Hong Kong Has Cheapened Relative To Singapore
The Future Of The Peg A peg to the Chinese RMB makes sense. The Hong Kong economy is now heavily tied to the Chinese economy, with over 50% of exports going to China (previously mentioned Chart 3). However, that will sound the death knell for Hong Kong’s status as a financial center, since the US dollar remains very much a reserve currency. There is also a risk that if Beijing uses RMB depreciation as a weapon in a blown-out confrontation with the US in the coming years, it will threaten the sustainability of the HKD peg, since it could inflate asset bubbles. What is more likely is that the option of re-pegging to the RMB comes many years down the road, when the yuan has become a fully convertible currency. The recent turmoil has made Hong Kong assets very cheap relative to its sister-city, Singapore. There is the option to assume another currency board akin to Singapore. This option makes sense, since this would give the HKMA scope to link to cheaper currencies, such as the yen and euro. Such an overhaul will require significant technical expertise and political will from both Beijing and Hong Kong. It is not very clear what the cost/benefit outcome would be of this initiative, but it is worth considering since the RMB itself is managed against other currencies. Finally, there is always the option to fully float the peg, but this is likely to increase volatility. As well, for policymakers, it makes sense to continue pegging the exchange rate to the US dollar as it depreciates against major currencies, since it ends up easing financial conditions for Hong Kong concerns. Chester Ntonifor Foreign Exchange Strategist chestern@bcaresearch.com Footnotes 1 Special Administrative Region of the People's Republic of China Trades & Forecasts Forecast Summary Core Portfolio Tactical Trades Limit Orders Closed Trades
Highlights The strength in global semiconductor sales in recent months has been due to one-off factors stemming from pandemic-related lockdowns. As the one-off demand surge subsides, global semiconductor sales will decline modestly toward the end of this year. In the near term, global semiconductor stock prices are vulnerable due to overbought conditions, excessive valuations and demand disappointment. The global semiconductor industry is at the epicenter of the US-China confrontation, and more US restrictions on chips sales to China are probable. This is another risk for this sector's share prices. Nevertheless, the structural outlook for global semiconductor demand is constructive. Its CAGR may rise from 3% during 2014-2019 to 5% during 2020-2024. Feature Investor euphoria has taken hold of semiconductor stocks. Global semiconductor stock prices have skyrocketed by 68% from March lows and 96% from December 2018 lows. Meanwhile, global semiconductor sales during March-June rose only by 5% from a year ago. As a result, the ratio of market cap for global semiconductor stocks relative to global semiconductor sales has reached its highest level since at least the inception of data in 2003 (Chart 1). Chart 1Global Semiconductor Sector: Market Cap-To-Sales Ratio Has Surged
Global Semiconductor Sector: Market Cap-To-Sales Ratio Has Surged
Global Semiconductor Sector: Market Cap-To-Sales Ratio Has Surged
With semi equity multiples very elevated, their share prices have become even more sensitive to global semiconductor demand growth. Hence, the focus of this report is to try to gauge the strength of global semiconductor demand, both in the near term and structurally. Near-term semiconductor stock prices could disappoint due to weak chip demand from the smartphone sector and diminishing purchases of personal computers (PCs) and servers. However, structurally, we are positive on global semiconductor demand, which is underpinned by the continuing rollout of 5G networks and phones, a wider adoption of data centers, and further technological advancements in artificial intelligence (AI), cloud computing, edge computing and smaller nodes for chip manufacturing (Box 1). Box 1 Key Technologies Underpinning Potential Global Semiconductor Demand AI refers to the simulation of human intelligence in machines, for example, computers that play chess and self-driving cars. The goals of AI include learning, reasoning and perception. Cloud computing is the delivery of computing services – including servers, storage, databases, networking, software, analytics and intelligence – over the Internet (“the cloud”) to offer faster innovation, flexible resources and economies of scale. Edge computing is a form of distributed computing, which brings computation and data storage closer to where it is needed, to improve response times and save bandwidth. Technology node refers to the width of line that can be processed with a minimum width in the semiconductor manufacturing industry, such as technology nodes of 10 nanometers (nm), 7nm, 5nm and 3nm. The smaller the nodes are, the more advanced they are. Near-Term Headwinds Chart 2World Semiconductor Sales Diverged From The Global Business Cycle
World Semiconductor Sales Diverged From The Global Business Cycle
World Semiconductor Sales Diverged From The Global Business Cycle
Semiconductor demand worldwide grew by 6% year-on-year in the first half of this year. There has been a remarkable divergence between world semiconductor sales and the global business cycle (Chart 2). The divergence between semiconductor sales and economic activity was most striking in the US and China. Semiconductor sales in China rose by 5% year-on-year in Q12020, and in the US they grew by 29% year-on-year in Q22020, despite a contraction in their aggregate demand during the same period. By contrast, Q2 annual growth of semiconductors sales was -2.2% for Japan, -17% for Europe and 1.8% for Asia ex. China and Japan (Chart 3). The reasons why the US and China posted a surge in semiconductor demand while Europe and Japan experienced a contraction in domestic semiconductor sales are as follows: Most data center investment is occurring in the US and China. Chart 4 shows that 40% of global hyperscale data centers are operating in the US, much larger than any other countries/regions. China, in turn, ranked second, with a global share of 8%. Chart 3Strong Semiconductor Sales In The US And China, But Not Elsewhere
Strong Semiconductor Sales In The US And China, But Not Elsewhere
Strong Semiconductor Sales In The US And China, But Not Elsewhere
Chart 4The US Has The Most Global Hyperscale Data Centers
Global Semiconductor Stocks: A Hiatus Is Overdue In A Structural Bull Market
Global Semiconductor Stocks: A Hiatus Is Overdue In A Structural Bull Market
Demand contraction in Europe and Japan is due to semiconductor demand in these regions mainly originating from the automobile sector, where production was severely hit by the global pandemic. About 37% of European semiconductor sales were from last year’s automotive market. We believe the divergence between global economic activity and semiconductor sales, as demonstrated by Chart 2 on page 3, has been due to one-off factors, as the global pandemic lockdowns have spurred semiconductor demand. Such a one-off demand boost will likely dissipate in the coming months. Traditional PCs and tablets: There has been a surge in demand for traditional PCs1 and tablets in the past six months. This was due to the significant increase in online activities, such as working from home, education, e-commerce, gaming and entertainment. Data from the International Data Corporation (IDC) has revealed that shipments of traditional PCs and tablets in volume terms had a strong year-on-year growth of 11.2% and 18.6%, respectively, in the period of April-June (Chart 5). Looking forward, even renewed lockdowns will not lead to a similar rush to buy these products. Many households are already equipped to work from home and for other online activities. With many countries gradually opening their economies, such demand will diminish. The traditional PC and tablet sectors together account for about 13% of global chip demand (Chart 6). Chart 5Personal Computers Sales Have Surged Amid Lockdowns
Personal Computers Sales Have Surged Amid Lockdowns
Personal Computers Sales Have Surged Amid Lockdowns
Chart 6The Breakdown Of Global Semiconductor Sales By Type Of Usage
Global Semiconductor Stocks: A Hiatus Is Overdue In A Structural Bull Market
Global Semiconductor Stocks: A Hiatus Is Overdue In A Structural Bull Market
Chart 7Server Sales Have Surged Amid Lockdowns
Server Sales Have Surged Amid Lockdowns
Server Sales Have Surged Amid Lockdowns
Server demand: Another major semiconductor demand contribution in Q2020 was from the server sector, which spiked by 21% year-on-year (Chart 7). The surge in online activities triggered a strong demand for cloud services and remote work applications, both of which require computer servers to run on. However, demand from the server sector is also set to diminish in 2H2020 and Q1 2021. Provided the inventories at major data center operators, including Microsoft, Google and Amazon, remain at high levels,2 global cloud service providers will likely reduce their orders of servers next quarter.3 Enterprises will also likely cut their investment in computer servers in 2H2020, as many of them had already increased their purchases of servers to prepare employees and business processes for remote working. We expect global server demand growth to soften in 2H2020. The Digitimes Research forecasted a 5.6% quarter-on-quarter contraction in 3Q2020 and a further cut in global sever shipment in the 4Q2020.2 The global server sector accounts for about 10% of global chip demand and, together with PCs and tablets, they make for 23% (please refer to Chart 6 on page 5). Further, the smartphone sector – accounting for 27% of global semiconductor demand – will continue struggling in H2 this year. The global total smartphone demand has been hit severely, as households delayed their new smartphone purchases. According to Canalys’ data, global smartphone shipments dropped by 13% and 14% year-on-year in Q1 and Q2, respectively. The strength in global semiconductor sales in recent months has been due to one-off factors stemming from the lockdowns. Chart 8Global Smartphone Shipments Will Likely Remain Weak In 2020H2
Global Smartphone Shipments Will Likely Remain Weak In 2020H2
Global Smartphone Shipments Will Likely Remain Weak In 2020H2
We expect smartphone shipments to continue contracting over the next three-to-six months (Chart 8). We believe global consumers will remain cautious in their spending on discretionary goods, such as smartphones, due to lowered incomes and increased job uncertainty. The IDC also forecasted that global smartphone shipments would not grow until 1Q2021.4 The Chinese smartphone sales showed a considerable weakness in July, with a 35% year-on-year contraction, which is much deeper than the 20% decline in H1 this year. 5G smartphone shipments also slowed last month, with a 21% drop from the previous month. Bottom Line: The strength in global semiconductor sales in recent months has been due to one-off factors stemming from the lockdowns. As this one-off demand subsides, global semiconductor sales will decline modestly toward the end of this year. Given the overbought conditions and the elevated equity valuations, global semiconductor stocks are currently vulnerable to near-term disappointments in semiconductor demand. At The Epicenter Of The US-China Rivalry Semiconductors are at the epicenter of the US-China confrontation. Ultimately, the US-China contention is about future technological dominance. That is access to technology and the capability to develop new technologies. The global semiconductor industry is at the epicenter of the US-China confrontation. China currently accounts for about 35% of the global semiconductor demand. US restrictions on semi producers worldwide to supply semiconductors to Chinese buyers constitute a major risk to semiconductor stock prices. On August 17, the US announced fresh sanctions that restrict all US and foreign semiconductor companies from selling chips developed or produced using US software or technology to Huawei, without first obtaining a license. In May, the US had already limited companies, such as the Taiwan Semiconductor Manufacturing Company (TSMC), from making and supplying Huawei with its self-designed chips. In addition, the US recently threatened bans on Chinese-owned apps TikTok and WeChat, and signaled that it could soon restrict Alibaba’s operations in the US. Chart 9Global Semi Companies' Sales To China Are Substantial
Global Semiconductor Stocks: A Hiatus Is Overdue In A Structural Bull Market
Global Semiconductor Stocks: A Hiatus Is Overdue In A Structural Bull Market
The global semiconductor sector is highly vulnerable to further escalation in the tension between these two superpowers. Major global semiconductor companies’ sales are heavily exposed to China, and their revenue from China ranges from 16% to 50% of total (Chart 9). We have been puzzled why global semi share prices have been rallying in spite of US limitations on semiconductor shipments to Huawei and its affiliated entities. One explanation could be that the Chinese companies that are not affiliated with Huawei are able to import semiconductors and then supply them to Huawei. If this is true, the US will have no other choice but to limit all semiconductor sales to China. This will be devastating for global semi producers given their large exposure to China. In anticipation of US punitive policies limiting its access to semiconductors, China had boosted its semiconductor imports over the past 12 months (Chart 10, top panel). Chinese imports of integrated circuits rose by 12% year-on-year in 1H2020, which is much higher than the 5% year-on-year increase in Chinese semiconductor demand during the same period (Chart 10, bottom panel). This gap suggests the country had restocked its semiconductor inventories. China has particularly restocked its imports of non-memory chips with imports of processor & controller and other non-memory chips in H1, surging by 30% and 20%, respectively, in US dollar terms (Chart 11). For memory chips, the contraction in Chinese imports was mainly due to a decline in global memory chip prices. Chart 10China Had Likely Restocked Its Semi Inventories
China Had Likely Restocked Its Semi Inventories
China Had Likely Restocked Its Semi Inventories
Chart 11Strong Chinese Imports In Non-Memory Chips
Strong Chinese Imports In Non-Memory Chips
Strong Chinese Imports In Non-Memory Chips
Bottom Line: The global semiconductor industry is at the epicenter of the US-China confrontation, and more restrictions on sales to China are probable. In turn, the restocked semiconductor inventory in China raises the odds of weakening mainland semiconductor import demand in H2 of this year. Structural Tailwinds Table 1Global Semiconductor Demand CAGR Forecast Over 2020-2024 By Device
Global Semiconductor Stocks: A Hiatus Is Overdue In A Structural Bull Market
Global Semiconductor Stocks: A Hiatus Is Overdue In A Structural Bull Market
We are optimistic on structural global semiconductor demand. Its nominal CAGR may rise from 3% during 2014-2019 to 5% during 2020-2024 in US dollar terms. Table 1 shows our demand growth forecasts for global chips in the main consuming sectors over the next five years. The major contributing sectors during 2020-2024 will be 5G smartphones, servers, industrials, electronics and automotive manufacturing. The underlying driving forces are the continuing rollout of 5G networks and phones, the development of data centers, and further technological advancements in AI, cloud computing and edge computing. Currently, the world is still in the early stages of 5G network development. AI, cloud computing and edge computing are constantly evolving. With increasing adoption of 5G smartphones, computer servers and IoT devices, global semiconductor demand is in a structural uptrend (Box 2). Box 2 Key Components For The Virtual World In Development Data centers and cloud computing allow data to be stored and applications to be running off-premises and to be accessed remotely through the internet. Edge computing allows data from Internet of things (IoT) devices to be analyzed at the edge of the network before being sent to a data center or cloud. IoT devices contain sensors and mini-computer processors that act on the data collected by the sensors via machine learning. The IoT is a growing system of billions of devices — or things — worldwide that connect to the internet and to each other through wireless networks. AI technology empowers cloud computing, edge computing and IoT devices. 5G is at the heart of the IoT industry transformation, making a world of everything connected possible. 5G Smartphone Currently, China is the world’s largest 5G-smartphone consumer and the leading 5G-adopter in the world. According to Digitimes Research, global 5G smartphone shipments will reach over 250 million units in 2020, with 170 million (68%) in China and only 80 million units in the world ex. China. Looking forward, 5G smartphone shipments are set to accelerate worldwide over the coming years. Chart 125G Phone Shipments In China Will Continue To Rise
5G Phone Shipments In China Will Continue To Rise
5G Phone Shipments In China Will Continue To Rise
The 5G phone shipments in China will continue to rise. The 5G phone sales penetration rate in China is likely to rise from 60% in July to 95% by the end of 2022. In such a case, we estimate that the monthly Chinese 5G phone shipments will increase from the current 16 million units to about 25-30 million units in 2022 (Chart 12). In the rest of the world, the 5G smartphone adoption pace will also likely speed up over the next five years. The 5G phone selling prices in the world outside China will drop, as more models are introduced and become more affordable. 5G smartphone prices have already fallen in China and will inevitably fall elsewhere. Chinese 5G smartphone producers will ship their low-priced 5G phones overseas, putting pressure on other producers to lower their prices. The 5G infrastructure development is accelerating in China and will accelerate in the rest of the world. Both China and South Korea have been very aggressive in their respective 5G network development. As of the end of June, China's top three carriers: China Mobile, China Unicom, and China Telecom – which together serve more than 1.6 billion mobile users in the country – had installed 400,000 5G base stations against an annual target of 500,000. In comparison, as of April 2020, American carriers had only put up about 10,000 5G base stations.5 As the US is competing with China on the 5G front, the country will likely boost its investment in 5G network development aggressively over the next five years in order to catch up to, or even exceed, China. Importantly, the 5G smartphone has more silicon content than 4G smartphones. More silicon content means higher semiconductor value. Rising 5G smartphone sales and higher silicon content together will more than offset the loss in semiconductor sales due to falling global 4G smartphone shipments. Based on our analysis, we expect a CAGR growth of 4% in semiconductor demand from the global smartphone sector over the next five years, slightly lower than the 5% in previous five years (Table 1 on page 10). This also takes into consideration that the 5G network will be more difficult and more expensive to develop than the 4G network. Servers Global server shipment growth will be highly dependent on both the pace and the scale of data center development (Box 3). Data centers account for over 60% of global server demand. The future growth of data centers is promising. The global trend of data localization6 due to the concerns of data privacy and national security will also bolster a boom of data centers over the next five years. A growing number of countries are adopting data localization requirements, such as China, Russia, Indonesia, Nigeria, Vietnam and some EU countries. While the Chinese data center market is expected to expand by a CAGR of about 28% over 2020-2022,7 a report recently released by Technavio forecasted the global data center industry’s CAGR at over 17% during 2019-2023. We forecast that the global semiconductor demand from servers will grow at a CAGR of 12% over 2020-2024. Box 3 Data Centers There are four main types of data centers – enterprise data centers, managed services data centers, colocation data centers, and cloud data centers. Data centers can have a wide range of number of servers. Corporate data centers tend to have either 200 (small companies), or 1000 servers (large companies). In comparison, a hyperscale data center usually has a minimum of 5,000 servers linked with an ultra-high speed, high fiber count network. Outsourcing and a move towards the cloud are driving the growth of the hyperscale data center. Instead of companies investing in physical hardware, they can rent server space from a cloud provider to both save their data and reduce costs. Amazon, Microsoft, Google, Apple and Alibaba are all top global cloud service providers. The more hyperscales to be built up, the higher the demand for servers. In 2019, about 13% of the total number of data centers in China were of the hyperscale and large-scale varieties. The plan of new infrastructure development announced earlier this year by Beijing was aiming to increase the number of hyperscale and large-scale data centers in China. Among current data centers either under construction or to be developed in the near future, 36% of them are hyperscale and large-scale data centers. IoTs Technological advancements in AI, cloud computing and edge computing, in combination with 5G network development, will facilitate the IoTs adoption. According to the GSMA,8 46 operators in 24 markets had launched commercially available 5G networks by 30 January 2020. It forecasted that global IoT connections will be increased from 12 billion mobile devices in 2019 to 25 billion in 2025 with a CAGR at 13%.9 IoTs chips include the Artificial Intelligence of Things (AIoT) – a powerful convergence of AI and the IoT. IoTs is an interconnected network of physical devices. Every device in the IoT is capable of collecting and transferring data through the network. Looking forward, global demand of AI chips and IoT chips will have significant potential to grow with creation of “smarter manufacturing”, “smarter buildings”, “smarter cities”, etc. AI applications can be used in manufacturing processes to render them smarter and more automated. Productivity will be enhanced as machines achieve significantly improved uptime while also reducing labor costs. There are plenty of upsides in industrial semiconductor demand (Chart 13). We expect the CAGR of industrial electronics to increase from 3.4% during 2014-2019 to 8% during 2020-2024. AI applications can create smart buildings by increasing connectivity across enterprise assets, enabling home network infrastructure (e.g., routers and extenders) and employing home-security devices (e.g., cameras, alarms and locks). AI applications can be used to create smart cities. A smart city is an urban area that uses different types of IoT electronic sensors to collect data. Insights gained from that data are used to manage assets, resources and services efficiently; in return, that data is used improve operations across the city. China has already developed about 750 trial sites of smart cities with different degrees of smartness in the past decade. As AI and 5G technology advances, the existing smart cities’ “smartness” will be upgraded and new trial smart cities will be implemented. Based on IDC data, China’s investment in smart cities will rise at a CAGR of 13.5% over 2020-2023 (Chart 14). Globally, the U.S., Japan, European countries and other nations are also actively developing smart cities. According to a new study conducted by Grand View Research, the global smart cities market size is expected to grow at a CAGR of 24.7% from 2020 to 2027.10 Chart 13Plenty Of Upside In Industrial Semiconductor Demand
Plenty Of Upside In Industrial Semiconductor Demand
Plenty Of Upside In Industrial Semiconductor Demand
Chart 14China’s Investment In Smart Cities Will Continue To Grow
Global Semiconductor Stocks: A Hiatus Is Overdue In A Structural Bull Market
Global Semiconductor Stocks: A Hiatus Is Overdue In A Structural Bull Market
Automotive We expect the global automotive chip market to grow at a CAGR of 9% during 2020-2024, as in 2014-2019. The increase in consumption of semiconductors by the auto industry will continue to be driven by the market evolution toward autonomous, connected, electric and shared mobility. Most new vehicles now include some level of advanced driver assist systems (ADAS), such as adaptive cruise control, automatic brakes, blind spot monitoring, and parallel parking. The whole industry is progressing toward fully autonomous vehicles in the coming years. Increasing adoption of automotive chips and recovering car sales will revive automotive chip sales. In addition, rising penetration of new energy vehicles (NEVs) is beneficial to semiconductor sales, as NEVs contain higher semiconductor content than conventional vehicles. Conventional vehicles contain an average of a $330 value of semiconductor content while hybrid electric vehicles can contain up to $1,000 and $3,500 worth of semiconductors.11 Regarding other sectors, we are also positive on structural demand of storage and consumer electronics. AI applications generate vast volumes of data—about 80 exabytes per year, which is expected to increase by about tenfold to 845 exabytes by 2025.12 In addition, developers are now using more data in AI and deep learning (DL) training, which also increases storage requirements. With massive potential demand for storage, we estimate a CAGR of 7% over 2020-2024 (Table 1 on page 10). A recent report from ABI Research predicts that the COVID-19 pandemic will increase global sales of wearables (such as a Fitbit or Apple Watch) by 29% to 30 million shipments of the devices this year. With contribution from wearables, we expect global semiconductor demand from the consumer sector to grow at a CAGR of 3% over 2020-2024, the same rate as in the previous five years. Bottom Line: Continuing rollout of 5G networks and phones, development of data centers, and further technological advancements in AI and cloud computing will provide tailwinds to structural global semiconductor demand, accelerating its CAGR growth from 3% during 2014-2019 to 5% during 2020-2024. Valuations And Investment Conclusions Most global semiconductor stocks are currently over-hyped. Critically, both DRAM and NAND prices have been deflating since January, reflecting weak demand for memory chips. Yet, share prices of memory producers have rallied (Chart 15). Overall, global semiconductor stock prices have diverged from their sales and profits. Overall, global semiconductor stock prices have diverged from their sales and profits (Chart 16). Chart 15Falling Memory Prices Pose Risk To Memory Stocks
Falling Memory Prices Pose Risk To Memory Stocks
Falling Memory Prices Pose Risk To Memory Stocks
Chart 16Global Semiconductor Stocks Have Deviated From Profits
Global Semiconductor Stocks Have Deviated From Its Profits
Global Semiconductor Stocks Have Deviated From Its Profits
Consequently, the multiples of semiconductor stocks have spiked to multi-year highs (Chart 17). Even after adjusting for negative US real bond yields, valuations of semiconductor stocks are not cheap. Chart 18 illustrates the equity risk premium for global semiconductor stocks is at the lower end of its range of the past 10 years. The ERP is calculated as forward earnings yield minus 10-year US TIPS yields. It is impossible to time a correction or know what the trigger would be (US-China tensions have been our best guess). Nevertheless, we do not recommend chasing semiconductor stocks higher due to their overstretched technicals and valuations on the one hand and potential weakening demand in H2 on the other. Chart 17Global Semiconductor Stocks: Elevated Valuations
Global Semiconductor Stocks: Elevated Valuations
Global Semiconductor Stocks: Elevated Valuations
Chart 18Equity Risk Premium For Global Semi Stocks Is Historically Low
Equity Risk Premium For Global Semi Stocks Is Historically Low
Equity Risk Premium For Global Semi Stocks Is Historically Low
In addition, the ratio of global semi equipment stock prices relative to the semi equity index correlates with absolute share prices of global semi companies. This is because equipment producers are higher-beta as they outperform during growth accelerations and underperform during growth slumps. The basis is that semi manufacturers have to purchase equipment if there is actual strong demand coming up and vice versa. The recent underperformance by global semi equipment stocks relative to the semi equity index might be an early sign of a potential reversal in semi share prices in absolute terms (Chart 19). Chart 19A Signal Of A Potential Reversal In Semi Share Prices
A Signal Of A Potential Reversal In Semi Share Prices
A Signal Of A Potential Reversal In Semi Share Prices
Meanwhile, we believe the subsector- memory chip stocks - will outperform the overall semiconductor index amidst the potential correction, because they have lagged and are less over-extended. Finally, we remain neutral on Taiwanese and Korean bourses within the EM equity space for now. Escalation in US-China confrontation, as well as their exposure to semiconductors, put these bourses at near-term risk. That said, we are reluctant to underweight these markets because fundamentals in EM outside North Asia remain challenging. Ellen JingYuan He Associate Vice President ellenj@bcaresearch.com Footnotes 1Traditional PCs are comprised of desktops, notebooks, and workstations. 2Global server shipments to contract 5.6% sequentially in 3Q2020, says Digitimes Research 3Global server shipments forecast to increase by 5% this year: TrendForce 4IDC Expects Worldwide Smartphone Shipments to Plummet 11.9% in 2020 Fueled by Ongoing COVID-19 Challenges 5America does not want China to dominate 5G mobile networks 6“Data localization” can be defined as the act of storing data on a device that is physically located within the country where the data was created. Data localization requirements are governmental obligations that explicitly mandate local storage of personal information or strongly encourage local storage through data protection laws that erect stringent legal compliance obligations on cross-border data transfers. 7The big data center industry ushered in another outbreak 8The GSMA represents the interests of mobile operators worldwide, uniting more than 750 operators with almost 400 companies in the broader mobile ecosystem, including handset and device makers, software companies, equipment providers and internet companies, as well as organizations in adjacent industry sectors. 9GSMA: 5G Moves from Hype to Reality – but 4G Still King 10Smart Cities Market Size Worth $463.9 billion By 2027 11The Automotive Semiconductor Market – Key Determinants of U.S. Firm Competitiveness 12AI is data Pac-Man. Winning requires a flashy new storage strategy.
Feature Feature ChartThe Sales Of Makeup And Perfumes Collapsed, But The Sales Of Hair Care And Skin Care Grew
The Sales Of Makeup And Perfumes Collapsed, But The Sales Of Hair Care And Skin Care Grew
The Sales Of Makeup And Perfumes Collapsed, But The Sales Of Hair Care And Skin Care Grew
The pandemic era is diminishing our close quarters intimacy with people, which raises a fascinating question. In a world of social and physical distancing, widespread use of face coverings, and virtual meetings on Zoom or Skype, is it still important to look good? Is it important to smell good? And perhaps the most fascinating question of all: is it important to feel good? The so-called ‘lipstick effect’ is a putative counter-cyclical phenomenon during recessions in which the demand for small treats and pick-me-ups increases while other spending is shrinking. One theory is that it is based on the basic human desire to feel good, even during hard times. When budgets are squeezed, people simply cut out large extravagances and substitute them with small luxuries, epitomised by lipstick. The lipstick effect was first recorded during the Great Depression. Between 1930 and 1933, unemployment in Germany surged to six million. But thanks to the booming demand for its cosmetics, the German firm Beiersdorf could boast that it did not have to lay off a single worker. Across the Atlantic, the same was true. When US economic output shrank by a third, cosmetics were one of the few products whose sales grew. The lipstick effect was also observed during the Great Recession. Between September 2008 and January 2009 when US consumer spending shrank, the sales of cosmetics bucked the downtrend, and grew (Chart I-2). Chart I-2Cosmetics Sales Grew In The 2008 Recession...
Cosmetics Sales Grew In The 2008 Recession...
Cosmetics Sales Grew In The 2008 Recession...
The Lipstick Effect Is Working In An Evolved Form Fast forward to 2020, and the pandemic-induced economic slump is the one recession in which we would expect not to observe the lipstick effect. After all, if you are in lockdown, or must maintain physical distancing with other people, or must wear a face covering when near other people, what is the point of wearing makeup or perfume? The sales of cosmetics and fragrances collapsed in the 2020 recession… Just as we would expect, between February and April this year, the US sales of cosmetics and fragrances collapsed by 18 percent, exactly in line with the plunge in US consumer spending. On the face of it, the lipstick effect does not work under a facemask (Chart I-3). Chart I-3...But Shrank In The 2020 Recession
...But Shrank In The 2020 Recession
...But Shrank In The 2020 Recession
Yet on closer examination, the lipstick effect is working, albeit in an evolved form. While the sales of makeup and perfumes have collapsed in 2020, the sales of skincare and haircare products are growing (Chart I-1). As the pandemic took hold and forced hair and beauty salons to shutter, people replaced salon visits with at-home care routines. And interestingly, even in the Great Recession of 2008-09, the US sales of haircare and non-cosmetic personal products outperformed the sales of cosmetics (Chart I-4-Chart I-7). Chart I-4Hair Care And Skin Care Sales Grew In The 2008 Recession...
Hair Care And Skin Care Sales Grew In The 2008 Recession...
Hair Care And Skin Care Sales Grew In The 2008 Recession...
Chart I-5...And Grew In The 2020 ##br##Recession
...And Grew In The 2020 Recession
...And Grew In The 2020 Recession
Chart I-6Total Personal Products Sales Grew In The 2008 Recession...
Total Personal Products Sales Grew In The 2008 Recession...
Total Personal Products Sales Grew In The 2008 Recession...
Chart I-7...And Have Held Up Well In The 2020 Recession
...And Have Held Up Well In The 2020 Recession
...And Have Held Up Well In The 2020 Recession
In fact, 60 percent of the total beauty market comprises skincare and haircare products compared with 30 percent for makeup and perfumes (Chart I-8). It turns out that the cosmetics and personal products firms that have a diversified exposure to all segments of the beauty market are the ones that outperform in hard times as well as good. And it turns out that these companies are European. Chart I-8Skin Care And Hair Care Dominates The Beauty Market
Does The Lipstick Effect Work Under A Facemask?
Does The Lipstick Effect Work Under A Facemask?
The European Cosmetics Sector Is Outperforming In hard times, the European cosmetics sector, led by L’Oréal, has consistently outperformed the US cosmetics sector, led by Estee Lauder, and the Japanese cosmetics sector, led by Shiseido. In hard times, the European cosmetics sector, led by L’Oréal, has consistently outperformed. Specifically, the 12-month forward earnings for the European cosmetics sector barely declined in the 2008-09 recession and have barely declined in the 2020 recession. In contrast, the forward earnings for the US and Japanese cosmetics sectors collapsed both then and now (Chart I-9). Chart I-9The European Cosmetics Sector Has Been Recession-Proof
The European Cosmetics Sector Has Been Recession-Proof
The European Cosmetics Sector Has Been Recession-Proof
Furthermore, the latest quarterly reports show that while operating profits for L’Oréal are down by around 20 percent from a year ago, the operating profits for Estee Lauder and Shiseido have slumped by more than 80 percent.1 As a result, the L’Oréal share price took a much smaller hit than those of Estee Lauder and Shiseido in both the 2008 and the 2020 stock market crashes (Chart I-10 and Chart I-11). Chart I-10L’Oréal Took A Smaller Hit Than Estee Lauder And Shiseido In 2008…
L'Oreal Took A Smaller Hit Than Estee Lauder And Shiseido In 2008...
L'Oreal Took A Smaller Hit Than Estee Lauder And Shiseido In 2008...
Chart I-11…And In ##br##2020
...And In 2020
...And In 2020
An important reason for L’Oréal’s consistent outperformance is its diversified product range. L’Oréal acknowledges that for both its consumer products and luxury divisions “the health crisis triggered a sharp deceleration in the makeup market”. But the hit to makeup was counterbalanced by continued strong growth in skin care thanks, for example, to the launch of serums in its Revitalift range. Additionally, its hair care products grew thanks to Fructis Hair Food plus very strong performance in the “highly dynamic home-use hair colour market”. Estee Lauder confirms that “Covid-19 and its various impacts have influenced consumer preferences due to the closures of offices, retail stores and other businesses and the significant decline in social gatherings”. While the demand for makeup and fragrance has slumped, the demand for skin care and hair care products has been more resilient. The trouble is that hair care accounts for less than 4 percent of Estee Lauder’s total sales. Meanwhile, the collapse in makeup sales has forced goodwill asset impairments to several of its makeup brands causing the 80 percent collapse in its overall profits. Likewise, Shiseido blames the 83 percent slump in its operating profits largely on “a product mix deterioration” which outweighed prompt cost-saving measures in response to the rapid deterioration of the market environment. Another vulnerability is that Shiseido’s sales are highly concentrated in Asia. By comparison, L’Oréal benefits from geographical diversification, with sales almost equally split between Europe, the Americas, and Asia (Table I-1). Table I-1L’Oréal Benefits From Geographical Diversification
Does The Lipstick Effect Work Under A Facemask?
Does The Lipstick Effect Work Under A Facemask?
The European Personal Products Sector Is Also Outperforming Turning to the general personal products sector, the leading companies are Unilever and Beiersdorf in Europe, Procter & Gamble, Colgate-Palmolive, and Kimberly Clark in the US, and Kao in Japan. In the personal products sector too, Europe has consistently outperformed the US and Japan. In the personal products sector too, Europe has consistently outperformed the US and Japan. Indeed, while the European sector’s profits have steadily grown through the past decade, the US sector’s profits have been going nowhere since the mid-2010s (Chart 1-12). Chart I-12The European Personal Products Sector’s Profits Have Grown Through The Past Decade
The European Personal Products Sector's Profits Have Grown Through The Past Decade
The European Personal Products Sector's Profits Have Grown Through The Past Decade
One reason for the European personal products sector’s reliable growth is that both Unilever and Beiersdorf are highly exposed to the beauty sector – in fact, Unilever has an even larger market share than Estee Lauder (Chart I-13). And as we have just seen, a diversified exposure to all segments of the beauty sector – makeup, fragrances, skin care, and hair care – should produce resilient growth in all economic backdrops. Pre-pandemic, and potentially once the pandemic is over, makeup and fragrances were/will be the growth drivers. Whereas during the pandemic, skin care and hair care are the drivers. Chart I-13Unilever Is A Big Player In Beauty
Does The Lipstick Effect Work Under A Facemask?
Does The Lipstick Effect Work Under A Facemask?
A final point is that despite the superior and safer growth prospects of the European cosmetics and personal products companies, they are not generally more richly valued than their peers in the US and Japan (Table I-2 and Table I-3). Table I-2The European Cosmetics Sector Is Not More Expensive
Does The Lipstick Effect Work Under A Facemask?
Does The Lipstick Effect Work Under A Facemask?
Table I-3The European Personal Products Sector Is Not More Expensive
Does The Lipstick Effect Work Under A Facemask?
Does The Lipstick Effect Work Under A Facemask?
To sum up, for the pandemic era and beyond, the European cosmetics and personal products sector is well set for diversified growth via product mix, price points, and regional exposures. And it is relatively well valued versus its peers elsewhere in the world. As such, the sector – dominated by L’Oréal, Unilever, and Beiersdorf – should remain a core holding in an investment portfolio. Dhaval Joshi Chief European Investment Strategist dhaval@bcaresearch.com Mohamed El Shennawy Research Associate mohamede@bcaresearch.com Footnotes 1 The most recent quarterly report for Estee Lauder is due on August 20. But at the time of writing the latest quarterly report was to the end of June 2020 for L’Oréal and to the end of March 2020 for Estee Lauder and Shiseido.
Retailers Are On Fire
Retailers Are On Fire
Overweight Our S&P home improvement retail overweight continues posting healthy gains: the position is up 23%, in relative terms, since the mid-April inception. Such handsome returns compel us to move our trailing stop from 10% to the 15% relative return mark in order to protect gains. Nevertheless, we still expect to harvest more gains – a view that HD’s earnings release reiterated yesterday. Remote working has created an opportunity for homeowners to undertake remodeling projects that drove extra traffic to home improvement retail stores. Specifically, HD comparable-store sales grew by 25% year-over-year, which translated into a sizable EPS beat. The bottom panel of the chart corroborates that HIR sales are on fire. Bottom Line: We remain overweight the S&P home improvement retail index, but today we move our trailing stop from 10% to 15%. The ticker symbols for the stocks in this index are: BLBG: S5HOMI – HD, LOW.
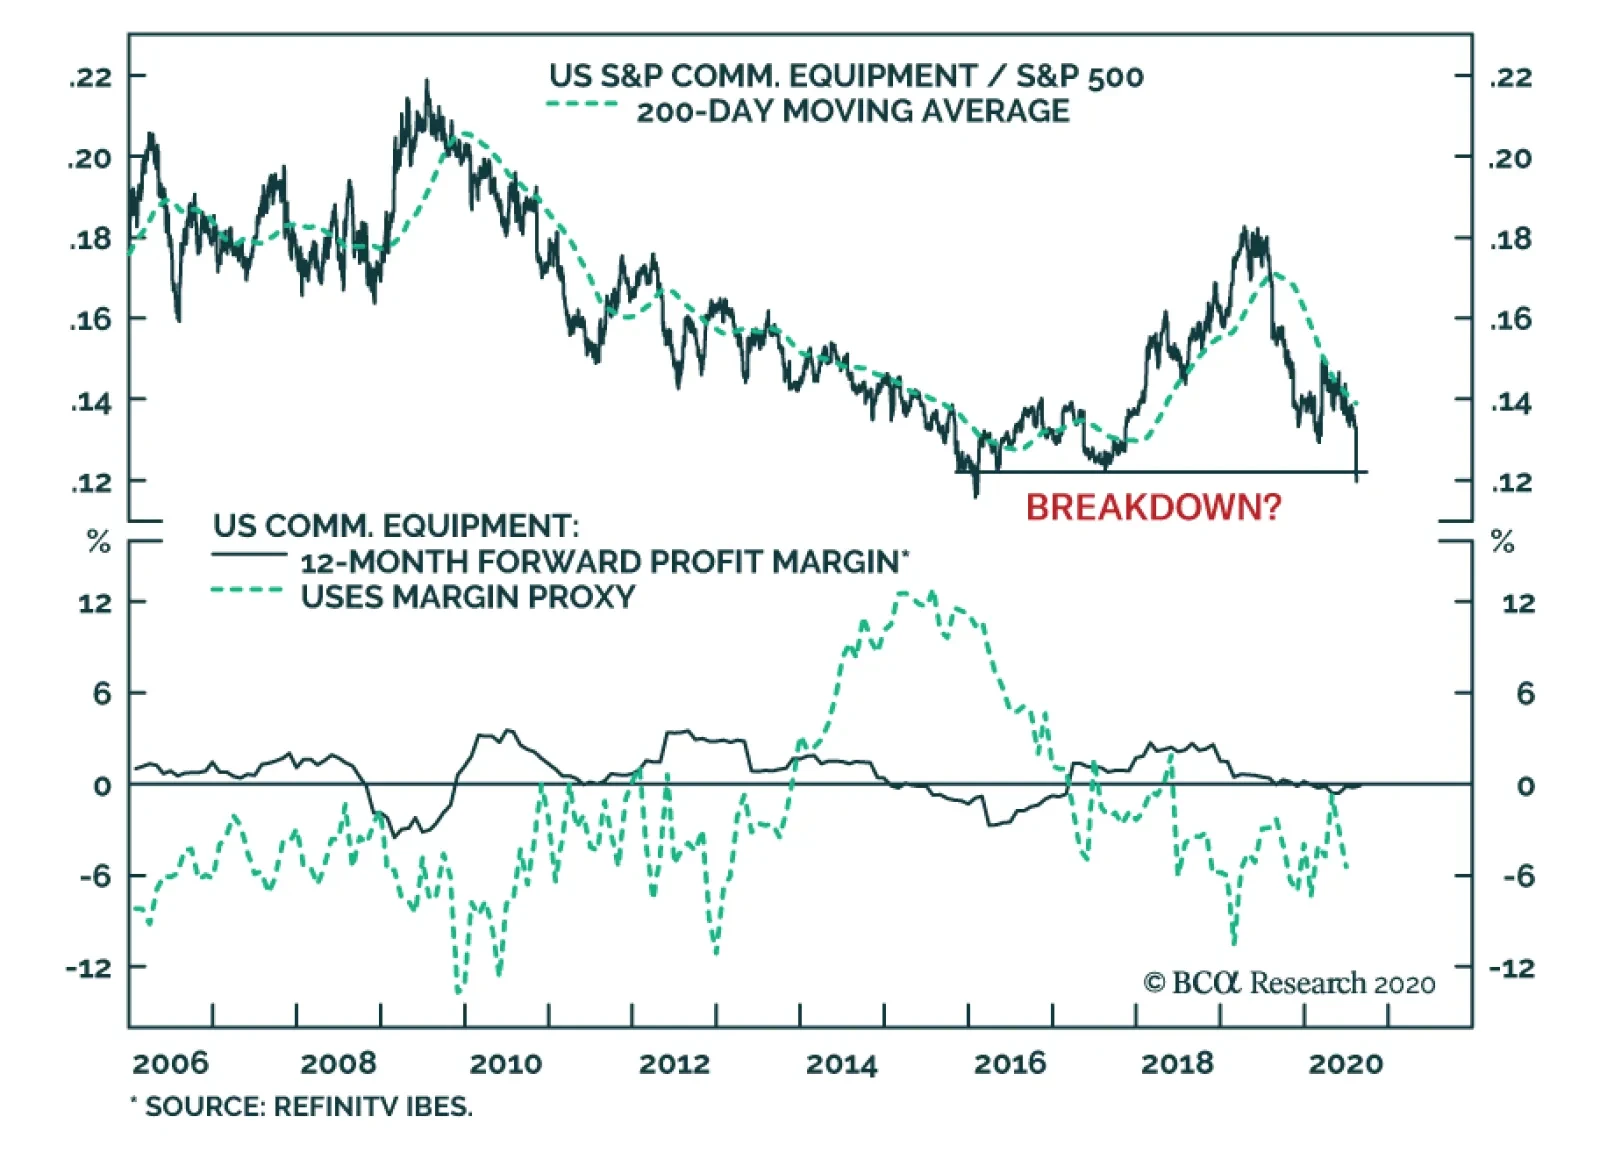
BCA Research's US Equity Strategy service remains underweight the S&P communications equipment index Our S&P communications equipment index underweight stance is paying dividends, and ongoing capex-related woes signal that a breakdown is looming.…
Avoid The Value Trap
Avoid The Value Trap
Underweight Our S&P communications equipment index underweight stance is paying dividends, and ongoing capex-related woes signal that a breakdown is looming (top panel). US CEOs are still reluctant to spend on big ticket items, as highlighted by the most recent CEO Confidence Survey (bottom panel). Lackluster capex spending will remain a headwind for CSCO, which commands a 77% market cap weight in the index. True, the recent drubbing in the greenback should aid telecom equipment exports (second panel). However, the industry’s 40% foreign sales exposure is on par with the SPX, underscoring that a weaker dollar will fail to provide relative profit relief. In fact, our margin proxy has rolled over recently signaling that the sell side’s profit margin optimism is unwarranted (middle panel). All of this suggests that the industry’s 30% forward P/E discount to the broad market represents a value trap rather than an opportunity (fourth panel). As a reminder, our technology sector (currently neutral) strategy is to prefer “defensive” software and services stocks at the expense of hardware and equipment manufacturers. Bottom Line: We remain underweight the S&P communications equipment index. The ticker symbols for the stocks in this index are: BLBG – S5COMM – CSCO, JNPR, MSI, ANET, FFIV.
Highlights COVID-19 shutdowns have intensified the pressure on the original “everything stores,” … : A combination of factors has been weighing on department stores since at least the early 2000s. Pandemic store closures have turned up the heat. … and turned an unwelcome spotlight on the future of shopping malls: Bankruptcy filings by anchor tenants pose an existential threat to already struggling malls. Shelter-at-home orders and universal telecommuting have debilitated the fashion industry, further testing malls’ resilience: Apparel retailers account for an estimated 60% of leased mall space, and their struggles are ramping up the pressure on mall operators. City-to-suburb migration may act to accelerate incumbent malls’ decline: Chester County, Pennsylvania has steadily gained wealth and population since the 1970s, but all the legacy malls within a 15-mile radius of the county seat are dead or dying. Feature Dear Client, US Investment Strategy will take its second summer break next week, so there will be no publication on August 24th. We will return on the 31st with Part 2 of the Mallpocalypse series. Best regards, Doug Peta Come On. How Can It Be That Bad? The July 31st episode of BCA’s Friday Conversations webcast series featured a construction executive who expressed the view that a considerable share of America’s enclosed shopping malls has very little value.1 Many malls, he argued, are no longer viable as originally intended and a daunting mix of financial and zoning obstacles stand in the way of repurposing them for other uses. A client in attendance thought we were laying it on a little thick. “Aren’t you being extreme?” he asked. “Why won’t things go back to normal [for enclosed shopping malls] once there’s a vaccine?” Like casinos, malls created a self-contained environment where customers would spend more the longer they stayed, ... We confess to a weakness for invented mash-up catchphrases that refer to the patently ridiculous (Sharknado) or relentlessly overhyped (the Snowmageddon build up to potential winter storms). It was with tongue in cheek that we titled the webcast “Mallpocalypse,” but this multi-part Special Report is testament to the dire prognosis for much of the stock of US malls. Malls were under pressure well before COVID-19 emerged and they would remain under pressure even if it were already in full retreat. The pandemic has dramatically accelerated weaker malls’ demise, and few of them appear to have a path back to viability. A Brief History Of The Shopping Mall The fully enclosed, temperature controlled Southdale Center in the Twin Cities suburb of Edina, Minnesota was the world’s first shopping mall. Its 1956 opening was front-page news across the national media, which greeted it with rapturous praise. It was designed by Austrian émigré Victor Gruen, who had made his name by reconfiguring New York City’s retail entryways in a way that lured prospective consumers into stores and helped to keep them there. His mall design achieved the same effect on a much greater scale. Southdale positioned 72 stores across two levels joined by escalators and bookended by two branch department store “anchors.” The open floor plan in the body connecting the anchors allowed for unimpeded views of nearly every storefront. “A ‘garden court’ under a skylight, with a fishpond, enormous sculpted trees, a twenty-one-foot cage filled with bright-colored birds, balconies with hanging plants and a café,”2 meant to evoke the feeling of a town square, was set in the center of the mall, inviting visitors to linger. Vast parking lots stood ready to accommodate thousands of their cars (Box 1). Malls revolved around the department store anchors that promised to deliver foot traffic that their rank-and-file tenants wouldn’t find on the high street or in supermarket-anchored shopping centers. Developers couldn’t get bank funding without contractually committed anchors and most mall leases today contain a provision that automatically resets rent lower, or allows tenants to exit their lease without penalty, if multiple anchors close. Per the 2019 10-K for Simon Property Group, the country’s largest mall owner, the rounded average base minimum rent for anchor tenants with leases expiring between 2020 and 2029 ranges from $4 to $8, while the average base minimum rent for inline tenants ranges from $50 to $65. Anchors are the belle of the ball and malls that lose them risk entering a death spiral. Box 1: The ‘70s: If It Ain’t Broke, Don’t Fix It Other developers faithfully followed Gruen’s initial template during the mall building boom from the mid-fifties to 1990. The three malls within a 15-mile radius of my hometown – Concord Mall (Wilmington, DE, opened 1968), Exton Square Mall (Exton, PA, 1973) and Granite Run Mall (Media, PA, 1974) – had every element but swapped out the bright-colored birds for outsized fountains. Concord Mall meant ICEEs in blue and red cups with a cartoon polar bear, Exton Square was Baskin-Robbins’ mandarin chocolate sherbet and Granite Run was large square floor tiles with a beguiling pattern of cross-sectioned stones, but this elementary schooler’s dominant mall impression was the Niagara-like roar of the fountains, which seemed to fill every cubic foot of the area outside the stores. The Long-Running Department Store Crisis The minimum base rent comparison is not quite apples-to-apples, as anchor tenants often own their own spaces, but anchors are malls’ drawing card. As Simon’s 10-K puts it, “our [properties] rely upon anchor tenants to attract customers.” Ideally, an anchor will comfortably fill the two-level bookend spaces and bring a steady stream of consumers who may spend at the stores they pass on the way. Fit is essential: dollar store customers aren’t likely to pony up for luxury brands or the merchandise on offer at high-end boutiques. Gyms and movie theaters can absorb the space, but shopping may not be on their clientele’s agenda. ... and they counted on department stores to lure them inside it. Before the advent of category-killers in the ‘90s, department stores were an ideal anchor. They were trusted well-known brands that shoppers in their area were conditioned to seek out for a broad range of purchases (Box 2). Despite their struggles, department stores remain the go-to anchors at most malls. High-end brands like Neiman Marcus, Nordstrom or Saks might anchor a mall with luxury tenants, while Dillard’s, JCPenney, Lord & Taylor or the ubiquitous Macy’s might anchor a mall seeking a more general clientele. Box 2: The ‘80s: Best. Purchase. Ever. At 19, I ventured to the massive King of Prussia Mall for a post-Christmas department store sale where I wrote my first check with a comma to purchase a floor model Sony rack system (turntable, amplifier, receiver and dual tape deck) and a CD player. The nearly three-foot-high speakers and cabinet were an early concession to marital comity (reciprocated by the gift of higher-end bookshelf speakers) but the amplifier would keep spreading joy until 2012, when it succumbed just three blocks from BCA’s Montreal office to time and the steady thump of Crazy Horse. Unfortunately for mall operators, department stores have been losing ground for at least 25 years and openly reeling for the last ten. The big-box, category-killer stores, like Home Depot, the late Circuit City, Best Buy, Barnes & Noble, Sports Authority and the late Toys ‘R’ Us, reshaped the retail landscape in the ‘90s, ushering in power centers and stealing business from department stores’ more expensive, less specialized and comparatively thinly stocked individual departments. The steady buildup of e-commerce (Chart 1), the shift in popular appeal from suburbia to urban centers and millennials’ celebrated preference for experiences over things contributed to further erosion. Private equity’s foray into the field exacerbated the other pressures. Its modus operandi of levering its portfolio companies up to the gills left the store chains it acquired dangerously unprepared to contend with falling revenues. Chart 1Perpetual Motion Machine
Perpetual Motion Machine
Perpetual Motion Machine
A Rotten Time For A Pandemic Many department stores and other retail chains were staggering before a sick bat straggled into a live animal market in Hubei province. The subsequent pandemic has forced a long list of them, including Neiman Marcus, JCPenney and Lord & Taylor, into Chapter 11 to shrink their debt and their cost bases under the protection of the bankruptcy code (Table 1). Several national chains not in bankruptcy are trimming their footprints as well. Nordstrom has announced plans to close a sixth of its locations, and mall stalwart Macy’s (which also owns Bloomingdale’s) wants to shutter 125 of its 850 locations (Table 2). The pandemic has cut a wide swath through apparel retailers, department stores, gyms and restaurants and the toll continues to mount. Table 1Selected Pandemic Retail Bankruptcies
Mallpocalypse, Part 1: An Overnight Collapse Decades In The Making
Mallpocalypse, Part 1: An Overnight Collapse Decades In The Making
Table 2Selected Store Closures Outside Of Bankruptcy
Mallpocalypse, Part 1: An Overnight Collapse Decades In The Making
Mallpocalypse, Part 1: An Overnight Collapse Decades In The Making
Chapter 11 bankruptcy offers struggling businesses a second chance while protecting the interests of senior lenders and secured creditors, but it is cold comfort for unsecured creditors. From a landlord’s perspective at the back of the priority line, the time out that bankruptcy grants an ailing debtor is an excruciating limbo when it is enjoined from initiating eviction proceedings. The landlord collects little, if any, rent and is unable to market the space or spruce it up while the tenant is shielded by the court. The Fashion Industry Was Already A Mess The outlook for department stores is undoubtedly bleak, but the fashion industry, which has relied on department stores’ retail distribution channel, may have it worse. According to a wide-ranging New York Times Magazine cover story,3 the entire fashion ecosystem has been busily devouring itself ever since the financial crisis. Although turmoil in the fashion industry would not typically register with most non-specialist investors, apparel retailers account for around 60% of leased mall space and have become another flash point for mall distress. According to the apparel component of the consumer price index, clothing prices peaked in 1998, rebounded somewhat in 2011 and 2012, and had resumed drifting lower before plunging to 1998 levels in May. The decline in women’s clothing prices has been even more severe, falling 27% from their 1993 peak to slip all the way to 1981 levels (Chart 2). One culprit has been fast fashion. Enabled by social media’s instantaneous dissemination of runway designs, nimble non-luxury retailers like Zara and H&M are able to rush their own versions into production, front-running high-end collections and compelling department stores to discount their own inventory as soon as they receive it. Chart 2Salmon Have It Easier
Salmon Have It Easier
Salmon Have It Easier
Discounting has been ruinous for the department stores’ apparel margins, as producers’ prices have failed to follow consumer prices lower (Chart 3). Department stores struck back by presenting designers with ridiculously one-sided vendor agreements. Designers reluctantly acquiesced, lest they lose access to the stores’ once-mighty distribution channel and fail to meet their lofty growth targets. Those targets are courtesy of a new breed of investor, eager to discover the next fashion star and ramp his/her operation up to scale immediately. The accelerated timetable pushes fledgling designers to expand well beyond the capacity of their bare-bones organizations and makes an inherently fickle business even more tenuous. Chart 3Rising Production Costs + Falling Prices = A Lot Of Red Ink
Rising Production Costs + Falling Prices = A Lot Of Red Ink
Rising Production Costs + Falling Prices = A Lot Of Red Ink
E-commerce further eroded department stores’ and other brick-and-mortar retailers’ positions, a story with which investors are already familiar. The bottom line is that department stores (Chart 4) and apparel retailers (Chart 5) have been badly lagging the broader market for an extended period. Their relative market performance is consistent with their constituents’ cycling in and out of Chapter 11. Even though they shrink their debt loads and store footprints with every trip to the courthouse, they haven’t been able to do so fast enough to overcome revenue and margin headwinds that show no signs of letting up. Chart 4Gradually, Then Suddenly
Gradually, Then Suddenly
Gradually, Then Suddenly
Chart 5Ex-The Discount Stores, Apparel Retailers Have Gotten Crushed
Ex-The Discount Stores, Apparel Retailers Have Gotten Crushed
Ex-The Discount Stores, Apparel Retailers Have Gotten Crushed
Then the pandemic arrived and nearly the entire white-collar workforce, ex-health care professionals, ceased going to the office or traveling to meet clients in person. For five months and counting, the primary consumers of professional attire have had no reason to wear it, much less buy more. It’s no surprise that Brooks Brothers, Ann Taylor, JoS. A. Bank and Men’s Wearhouse have been among the casualties. Overall sales of clothing fell off a cliff in March, April and May (Chart 6, top panel) but clothing stores fared even worse (Chart 6, bottom panel). Chart 6Apparelocalypse
Apparelocalypse
Apparelocalypse
With department store anchors, who occupy approximately 30% of malls’ leasable area, and apparel retailers under siege, mall operators have few places to turn to fill their space. The new breed of anchor stand-ins – fitness centers, movie theaters and entertainment spaces – are not able to open in every state and haven’t been paying rent. Gold’s Gym, 24 Hour Fitness and Chuck E. Cheese have already filed for bankruptcy and the big movie theater chains’ future is deeply uncertain. There’s Gold In Them Thar Hills, But Someone Else Has Already Staked A Claim Green Street Advisors, the leading commercial real estate research and advisory firm, estimates that half of all mall-based department stores will close by the end of 2021. Estimates of the share of malls that will close in the aftermath range from a quarter to a third. If the US has around 1,200 malls, 300 or 400 may soon disappear. Their owners and the entities that have lent to them will recoup only a fraction of their initial investments. If their losses lead to a reduction in the availability of credit, or trigger a self-reinforcing wave of defaults and bankruptcies, they could have a broader macro impact. We will explore the potential macro effects in the next installment of the series. We close this one by noting the sad fate of the ‘70s-era malls within a 15-mile radius of West Chester, Pennsylvania. Granite Run Mall was razed in 2016 and replaced with an open-air mixed-use facility that retained the original mall’s anchor spaces. Concord Mall was sold to a buyer of distressed malls in January, which has yet to disclose its plans for the site. Exton Square Mall, which underwent an ill-fated 2000 expansion that more than doubled its leasable area, is now owned by the ailing publicly traded Pennsylvania Real Estate Trust (PEI). PEI classifies the property as a non-core asset, along with the other two weakest malls in its portfolio. The Chester County mall experience bears on a client question from the July 31st webcast: “People are fleeing cities for the countryside. Isn’t that the opportunity?” Chester County, which has the highest mean household income in Pennsylvania and the 27th highest in the United States, bucks the state’s broader demographic decline. West Chester, the county seat, added a third public high school in 2006; its university has steadily grown enrollment, increasing its share of students in the 14-school State System of Higher Education consortium from 12.1% in 2010-11 to 18.5% in 2019-20; and new highway arteries and commuter rail stations have made it much more feasible for residents to work in Philadelphia, 25 miles to the east, than it was in the ‘70s and ‘80s. Chester County has been a prime suburban development opportunity for 20 or 30 years and commercial and residential developers have been making the most of it, converting acreage formerly devoted to feed corn into high-end housing, office parks, luxury auto dealerships and other commercial uses. It’s not that the market can’t support retail, it’s that it no longer wants 50-year-old spaces that were built to serve a humbler, less affluent constituency. A range of newer open-air options featuring more upscale retailers and restaurants have supplanted Concord, Exton Square and Granite Run. The area has improved; it’s the old nags that couldn’t keep up. Doug Peta, CFA Chief US Investment Strategist dougp@bcaresearch.com Footnotes 1 Please see BCA Research Webcast "Mallpocalypse", from July 31, 2020, available at bcaresearch.com. 2 Gladwell, Malcolm, "The Terrazzo Jungle," The New Yorker, March 15, 2004. 3 Aleksander, Irina. "Sweatpants Forever," The New York Times Magazine, August 9, 2020, pp. 28-33 and 42-43.