Sectors

Highlights PORTFOLIO STRATEGY While our cyclically sanguine broad equity market view remains intact, we are cautious on the short-term prospects of the S&P 500, until the election uncertainty lifts. A contested election and legitimacy crisis is possible in the US, but the constitutional system is robust and the likely risk-off phase would be temporary. A depreciating US dollar, China’s rebounding economic activity, improving domestic operating metrics and compelling valuations all signal that it no longer pays to be bearish chemicals equities. An improving export backdrop, a depreciating greenback and commodity price inflation, labor cost discipline at home, along with a relative value proposition, all argue for an above benchmark allocation to the S&P materials sector. Recent Changes Lock in gains in the S&P chemicals index of 1% since inception, and upgrade to neutral today. Boost the S&P materials sector to an above benchmark allocation today. Feature Equities made fresh recovery highs last week cheering promising vaccine news, optimism on a fiscal package extension and a resumption in the Fed’s balance sheet expansion. Easy monetary and loose fiscal policies remain the key macro drivers of equity returns. Yet, the deeper we dig in the concentration of SPX returns the more worried we become. The top five stocks in the SPX (AAPL, MSFT, AMZN, GOOGL & FB) have added $4.82tn to the S&P 500 market cap since 2015, whereas the bottom 495 stocks have added $3.82tn. In percent return terms, these five tech titans’ market capitalization has gone up roughly four fold or 288% over the past 5 ½ years from $1.67tn to $6.49tn. In marked contrast, the S&P 495 market cap has barely budged, rising a mere 23% (increasing from 16.57tn to $20.39tn) during the same time frame (top panel, Chart 1). If investors have not been in these tech titans, then they have not really participated in the SPX’s run up. The measly return since 2015 in the Value Line Arithmetic index and negative return in the Value Line Geometric index gauging the mean and median US stock, respectively, corroborate our analysis (not shown). Clearly, such a steep divergence is unsustainable and the longer these handful of stocks defy gravity the steeper their eventual fall will be (bottom panel, Chart 1). While our cyclically sanguine broad equity market view remains intact, we are cautious on the short-term prospects of the S&P 500, until the election uncertainty lifts. Chart 1S&P 5 Versus S&P 495
S&P 5 Versus S&P 495
S&P 5 Versus S&P 495
Following the recent Special Report we penned with our sister Geopolitical Strategy publication on a potential Democratic Party sweep in the US election, this week we address a common question from clients: What is the risk that President Trump refuses to leave the White House despite losing the election? We interpret this question more generally: What if the election is contested? A Contested Election? The odds of a contested election and legitimacy crisis are not small – they are bigger than a mere tail risk – perhaps 15%. However, at present all polling information and economic data suggest that President Trump will be defeated soundly, thus making a contested election unlikely (Chart 2). Our quantitative election model used to rank New Hampshire, Pennsylvania, and Wisconsin as “toss up” states, in which Trump had a 45%-55% chance of winning the state. Our latest update of the model, with June economic data, contains zero toss-up states, implying that Trump has less than a 45% chance of winning any of these states, or even Florida. The model projects that Trump will lose, receiving only 230 Electoral College votes (Chart 3). If the election were held today, there would be little risk of a contested outcome. The risk of a contested election hinges on Trump making a big comeback between now and November 3 that would tighten the election in at least two swing states (e.g. Florida and the Midwestern states). This is not impossible if one accepts our base case that he gets another ~$2 trillion in fiscal stimulus passed through Congress in early August and the V-shaped economic rebound continues. Chart 2Polling And Economic Data Suggest Significant Victory For Biden
What Is The Risk Of A Contested US Election?
What Is The Risk Of A Contested US Election?
Chart 3Quant Model Also Points To Trump Loss And Zero Toss-Up States
What Is The Risk Of A Contested US Election?
What Is The Risk Of A Contested US Election?
A tighter race could then produce vote recounts and judicial interventions in one or more swing states on November 3-4. In an environment of extreme polarization, either President Trump or former Vice President Joe Biden would refuse to concede while recounts are underway and their vast armies of lawyers dispute the results in court. We assess that the risk of a Trump comeback and victory is about 35%-42%, so the 15% risk of a contested outcome is a subset of that 35%-42% probability. Our quantitative model gives 17% odds to a scenario in which Pennsylvania, Florida, Minnesota, and even Colorado become toss-up states again. This scenario serves as a proxy for a contested election because it creates several chances for contested results. The model also gives surprisingly high odds to an Electoral College tie of 269-269 votes due to the fact that several scenarios involve swing states that could produce this result.1 If the margins of victory prove narrow, like in 2000, then it is virtually certain that the losing candidate will not concede the election until votes have been recounted at least once. Extreme levels of political polarization combined with abnormal voting circumstances (COVID-19, mail-in voting, etc) suggest that results are more likely to be contested than usual. How would a contested election be resolved? In general, the constitution is more effective than the consensus holds. The market is likely to overreact, creating a buying opportunity for risk assets. The US possesses the world’s oldest continuously operating constitution. It is very robust. The Supreme Court and Congress will intervene, if necessary, to determine the succession of the presidency. The Supreme Court would intervene to settle disputes over recounting votes as it did in 2000. Already this year the high court has intervened to prevent “faithless electors” in the Electoral College, reducing one major source of uncertainty. The core institutions of the state would uphold the result. Similarly, Congress would intervene in the event of an Electoral College tie. Specifically the House of Representatives would vote to determine the next president. The voting procedure would involve each state delegation receiving a single vote. As such it would favor the Republican candidate despite the fact that the Democrats have a majority of seats in the House. The military is sworn to protect the constitution and would be available to enforce the transfer of power once the constitutional branches have spoken. But it is highly unlikely that the occupancy of the Oval Office would have to be effected by federal armed forces. Grievances on the losing side would persist for a long time and take a toll on the legitimacy of the next administration. This is particularly the case if Democrats lose, given that they are likely to win the popular vote. This could have market implications – e.g. driving a weak president to act abroad because he is constrained at home. But the state would have a legal leader and would continue to function. Financial markets would not be as confident or knowledgeable about the constitution so they could panic during a constitutional crisis. We fully expect volatility to rise (as mentioned in a recent webcast in case of a stalemate), risk assets to sell off, and safe haven flows to increase throughout the process of a contested election (bottom panel, Chart 4). Traditionally, the US dollar and US Treasury bonds rally during politically induced risk-off periods (second panel, Chart 4). Since COVID-19 we have seen counter-trends in which investors veer away from the USD due to the narrowing in interest rate differentials and the booming twin deficits. So the short-term reaction may be at odds with the long-term trend. We would expect the greenback to rally during the rise in uncertainty and then collapse once the final decision is determined. This is what occurred in 2000, with the exception of USDJPY (Chart 5). Chart 4Heed The…
Heed The…
Heed The…
Chart 5…2000 Election Parallels
…2000 Election Parallels
…2000 Election Parallels
Therefore, we would position for the USD to be flat, or up, in case of a deadlock in this year’s election (middle panel, Chart 4), and for the 10-year Treasury bond and other safe haven assets to catch a bid. However, cyclically the path of least resistance is lower for the trade-weighted US dollar. Gold should also perform well (fourth panel, Chart 4). First, gold generally rallies during political and geopolitical crises. Second, gold stands to benefit if a US constitutional crisis prompts global investors to diversify from the US dollar specifically. Third, a contested election does not change the fact that both candidates are fiscally profligate and the ultimate winner of the White House will double down on economic stimulus to help consolidate power and fend off the recession. In other words, a contested election is not deflationary, so gold should benefit. A Closer Look At Markets During The 2000 Election Crisis Taking a closer look at the 2000 election impasse is instructive. The top panel of Chart 4 shows that the SPX drifter lower in the aftermath of the election falling roughly 10%. Granted, stocks were also deflating from the dotcom bubble bust. Thus, it is reasonable to expect turbulence going into the election and in the weeks following the election. The equity volatility curve concurs as VIX futures currently have a hump for the months of September and October (Chart 6). Chart 6Buy December VIX Futures As A Hedge
What Is The Risk Of A Contested US Election?
What Is The Risk Of A Contested US Election?
One way to play a contested election is to buy the December VIX futures and short the January ones at a positive carry. Alternatively, buying the December futures straight up as a hedge to long equity positions makes sense, but that is a more expensive proposition. Geopolitical Strategy is going long December VIX futures versus the January ones. Defensive sectors caught a bid (with the exception of telecom services that were deflating alongside their TMT bubble peers, Chart 7), while technology and financials (the two largest S&P 500 sectors at the time) suffered a sizable setback (Chart 8). Chart 7Sector Performance…
Sector Performance…
Sector Performance…
Chart 8…During Last Contested Election
…During Last Contested Election
…During Last Contested Election
Surprisingly, within deep cyclicals, tech bore the brunt of the fall. Chart 8 shows that industrials, materials and energy stocks were on the ascent in November 2000. As a reminder, we recently downgraded financials to neutral and while we recommend a benchmark allocation in tech stocks we continue to have a barbell portfolio approach preferring software and services to hardware and equipment. Moreover, we remain overweight the unloved and undervalued industrials and energy stocks, and this week we are lifting exposure to a modest overweight in the niche S&P materials sector by locking in gains and upgrading the heavyweight chemicals subgroup to neutral. Lift Chemicals To Neutral… It no longer pays to be bearish on chemicals stocks and today we are booking gains of 1% since inception, and lifting the materials heavyweight S&P chemicals index to neutral. Four key drivers are behind our change of heart: a depreciating US dollar, China’s reflation, improving domestic operating metrics and compelling valuations. Chart 9 shows the close correlation between the EURUSD and relative share prices. In early-May we highlighted that the US dollar was about to give way versus the euro as relative shadow rates started moving in the euro’s favor. We posited that “while the Fed would never admit to it, it is trying to devalue the US dollar and reflate the global economy, which will indirectly boost S&P 500 revenues… as 40% of SPX sales are internationally sourced”. This could not be truer for US chemical manufacturers. Currently exports are sinking like a stone, but the slingshot recovery in the euro suggests that chemical exports will rebound in the back half of the year (bottom panel, Chart 9). China’s ongoing recovery also gives credence to this export rebound thesis. In fact, the Chinese authorities are injecting large amounts of liquidity, which is already bearing economic fruit. Chart 9Preparing For A Positive Chemical Reaction
Preparing For A Positive Chemical Reaction
Preparing For A Positive Chemical Reaction
Chart 10 shows that not only is the Chinese manufacturing PMI expanding anew (soft data), but also electricity generation is coming back to life (hard data). This backdrop is a boon to US chemical exports and is neither reflected in sell-side analysts’ relative forward sales nor profit estimates (bottom panel, Chart 10). Chart 10Export Lift Looms
Export Lift Looms
Export Lift Looms
On the domestic front, chemicals rail car loads are making an effort to bottom and the surge in the ISM manufacturing survey points to a significant pickup in railroad chemical shipments in the coming months (second panel, Chart 11). Importantly, chemicals industrial production is on the verge of expanding, in marked contrast with overall IP that is still falling at a 10%/annum rate (third panel, Chart 11). On the profit margin front, a big tug of war has enveloped chemicals producers. While selling prices are mired in deflation, executives have been very careful with headcount and continue to adjust input costs to lower run rates (Chart 12). Recent news of Dow Inc. shedding its labor force suggest industry CEOs remain very disciplined and focused on a return to profitability. Chart 11Firming Domestic Conditions
Firming Domestic Conditions
Firming Domestic Conditions
Chart 12Big Tug Of War
Big Tug Of War
Big Tug Of War
Importantly, the American Chemistry Council’s Chemical Activity Barometer is corroborating all this marginally firming industry data and signals that relative forward profitability is likely nearing a trough (bottom panel, Chart 11). Tack on a fall below the neutral zone on our relative Valuation Indicator and it no longer pays to be bearish chemicals manufacturers (bottom panel, Chart 12). In sum, a depreciating US dollar, China’s rebounding economic activity, improving domestic operating metrics and compelling valuations entice us to lift the S&P chemicals index to neutral. Bottom Line: Crystalize gains of 1% in the S&P chemicals index since inception and upgrade to neutral. The ticker symbols for the stocks in this index are: BLBG S5CHEM – LIN, APD, ECL, SHW, DD, DOW, PPG, CTVA, LYB, FMC, IFF, CE, ALB, CF, EMN, MOS. …Which Boosts Materials To An Above Benchmark Allocation Our S&P chemicals index upgrade to neutral also lifts the S&P materials sector to overweight. We are positioning our portfolio for an eventual equity market sector rotation away from tech stocks and toward traditional deep cyclicals including materials, energy and industrials. We want to be ahead of the curve as we expect a violent rotation and the likely catalyst will be a definitive vaccine breakthrough announcement. Such a backdrop will unlock excellent value in a plethora of deep cyclical names that have been laggards, materials stocks included. Importantly, global mining behemoths are already sniffing out a robust global economic recovery, with BHP and RIO trouncing the global bourses since the March 23 trough (Chart 13). Emerging markets have also started to outperform the SPX in common currency terms, as the demise of the US dollar is becoming a mainstream theme. Chart 13Global Miners Sniffing Out Global Recovery
Global Miners Sniffing Out Global Recovery
Global Miners Sniffing Out Global Recovery
The JP Morgan EM FX index, Bloomberg’s EM Asian currency index (ADXY) and the China-levered AUDUSD are all in V-shaped recoveries, underscoring that global growth will make a sizable comeback as the year draws to a close (top & second panels, Chart 14). The USD debasing will lift materials exports and thus bodes well for the relative profit recovery in this deep cyclical sector (third & bottom panels, Chart 14). Not only will US materials profits get a boost from garnering a larger slice of the global export pie, but also materials revenues will rise on the back of an increase in commodity prices that are priced in US dollars (top & second panels, Chart 15). Chart 14Depreciating Dollar To The Rescue
Depreciating Dollar To The Rescue
Depreciating Dollar To The Rescue
Chart 15Chinese Recovery A Boon To S&P Materials
Chinese Recovery A Boon To S&P Materials
Chinese Recovery A Boon To S&P Materials
True, China’s insatiable appetite for commodities has taken a small breather, but it would be a mistake to write off this economy and the government’s power to successfully restart its engine. Chinese authorities are working on rekindling growth by injecting significant liquidity in order to jump start the economy. Money supply growth is shooting higher after kissing off the zero growth line earlier in the year. We would not be surprised if M1 growth makes a run for the 2016 highs when it surpassed the 25%/annum mark (third panel, Chart 15). Finally, on the domestic operating front, industry executives have been reining in labor costs of late as the COVID-19 pandemic has wreaked havoc in final demand. The materials sector wage bill is now contracting at 4%/annum a level last seen in the Great Recession. This input cost restraint will underpin industry profitability (bottom panel, Chart 15). All of this positive news will arrest the near uninterrupted de-rating of the niche materials sector that followed the reflex rebound in the aftermath of the GFC. Currently, our relative Valuation Indicator is hovering in the middle of the neutral and undervalued zones an area that has marked previous valuation bottoms five times in the past two decades (third panel, Chart 16). Our materials sector Cyclical Macro Indicator does an excellent job in encapsulating all these moving parts and the current message is positive for relative share prices (second panel, Chart 16). Netting it all out, an improving export backdrop, a depreciating greenback and commodity price inflation, labor cost discipline at home, along with a relative value proposition all argue for an above benchmark allocation to the S&P materials sector. Geopolitical Strategy recommends investors go long materials on a strategic time frame. Bottom Line: Upgrade the S&P materials sector to overweight, today. Chart 16Green Lights Flashing
Green Lights Flashing
Green Lights Flashing
Anastasios Avgeriou US Equity Strategist anastasios@bcaresearch.com Matt Gertken Geopolitical Strategist mattg@bcaresearch.com Footnotes 1 Assuming the 2020 electoral map stays generally the same as in 2016, an Electoral College tie could be produced by Democrats winning AZ, MI, and either WI or MN; MI, MN, and WI plus NE’s Second District; or PA and MI plus NE’s Second District. Other variations are possible.
Our intra-real estate pair trade long S&P homebuilders / short S&P REITs vaulted roughly to the 15% return mark intraday yesterday, compelling us to institute a 5% rolling stop in order to protect handsome profits since the late-May inception. Our thesis for putting on this market-neutral trade remains intact. The Fed’s ZIRP policy as far as the eye can see is perhaps the biggest catalyst for US homebuilders, especially as the one-off pandemic effects begin to wear off and people are able to take advantage of all-time low mortgage rates that recently breached 3%. In fact, the chart below suggests that the pair trade is poised for additional gains in the coming months. Bottom Line: We continue to recommend the long S&P homebuilders / short S&P REITs pair trade as more gains are in store, but from a portfolio management perspective we are instituting a 5% rolling stop in order to protect gains.
Intra-Real Estate Pair Trade Update
Intra-Real Estate Pair Trade Update
Highlights We reiterate our longstanding overweight on healthcare equities for the next 12 months and possibly beyond. The macro environment, as well as underlying demand factors, will continue to drive the sector’s outperformance. Within healthcare equities, we favor biotechnology and healthcare technology over pharmaceuticals. Healthcare corporate bonds, however, are not especially attractive, and therefore warrant no more than a neutral position. Feature Chart 1Healthcare Has Outperformed Over The Past Decade...
Healthcare Has Outperformed Over The Past Decade...
Healthcare Has Outperformed Over The Past Decade...
Over the past decade, global health care stocks have been clear outperformers, alongside information technology and consumer discretionary stocks, rising by almost 50% relative to the broad market (Chart 1). Not only have they benefited from increased demand from an aging population in developed economies and a growing middle class in emerging markets, they have also provided a downside cushion during recessions and bear markets, given their defensive, non- cyclical nature. The COVID-19 pandemic leads us to reiterate our longstanding overweight position on global healthcare equities over the next 12 months and possibly beyond. Favorable tailwinds will continue to drive healthcare outperformance. It is likely that government spending on healthcare will increase over the coming years. Innovative solutions in healthcare technology (healthtech), as well as increased overall research and development (R&D), the shift to value-based healthcare delivery, the focus on preventive medicine, and a low risk of substantial regulatory change and reform (at least in the US, assuming former Vice President Biden is elected president this November) should continue to support the sector’s outperformance. In this Special Report, we analyze whether our long-term overweight position on healthcare equities remains valid. In a later section, we also review healthcare-related investments in bonds and private equity. Why We Like Healthcare BCA Research’s Global Asset Allocation (GAA) service has been positive on global healthcare stocks for over five years. The main reason is that we see demand for healthcare services continuing to rise, as life expectancy increases, populations age – people over 65 will comprise 25% of the developed world’s population by 2040, up from 15% in 2020 – and the middle class in emerging economies becomes richer (Charts 2&3). As people live longer, healthcare spending should rise since, after the age of 65 (retirement), it tends to squeeze out discretionary spending (Chart 4). Chart 2...As The Global Population Grew Older...
...As The Global Population Grew Older...
...As The Global Population Grew Older...
Chart 3...And Richer
...And Richer
...And Richer
Healthcare spending everywhere represents a large proportion of GDP, but the percentage varies considerably between countries. In the US for example, healthcare spending comprises 16.9% of GDP, higher than in other advanced economies, where it averages 9.9%, and substantially higher than in emerging economies (average 6.5% of GDP) (Chart 5). It is likely that these figures will increase over the next few years. Chart 4Healthcare Expenditure Dominates Late-Life Spending
Healthcare Expenditure Dominates Late-Life Spending
Healthcare Expenditure Dominates Late-Life Spending
Chart 5Spending On Healthcare Will Rise
Spending On Healthcare Will Rise
Spending On Healthcare Will Rise
A strong case can be made for serious outbreaks of infectious diseases becoming more common, and therefore governments will have to increase their readiness. The number of countries experiencing a significant outbreak has almost doubled over the past decade, after being on a declining trend during the prior 15 years (Chart 6). The World Health Organization (WHO) warns that, while pandemics are rare, highly disruptive regional and local outbreaks are becoming more frequent and causing more economic damage.1 The non-cyclical nature of healthcare demand makes the industry less vulnerable to economic downturns. In times of below-trend growth, investors rush into defensive-growth stocks. Over the past two recessions, the drawdown of healthcare equities was, respectively, 20% and 27% less than the broad market. Chart 6Number Of Countries Experiencing Serious Outbreak Of Infectious Disease
The Healthcare Revolution: The Case For Staying Overweight
The Healthcare Revolution: The Case For Staying Overweight
Chart 7The Defensive Side Of Healthcare
The Defensive Side Of Healthcare
The Defensive Side Of Healthcare
However, the sector is not totally cyclically insensitive, given its capital intensity and reliance on debt. In the US, healthcare sector debt amounts to almost $500 billion (Chart 7). This also leaves it vulnerable to rising interest rates. Nevertheless, the current macro outlook should keep a lid on interest rates for some time. The healthcare industry has lagged in digitalization (Chart 8). This offers wide-ranging opportunities for the sector, particularly in healthtech, biotechnology, and pharmaceuticals. Innovative solutions in robotics, artificial intelligence (AI), and genomics will drive the industry in the years to come. Digitalization will accelerate productivity and improve profitability. Chart 8The Healthcare Sector Is Way Behind In Digitalization
The Healthcare Revolution: The Case For Staying Overweight
The Healthcare Revolution: The Case For Staying Overweight
Lastly, valuations for healthcare equities in most countries remain attractive, close to their long-run averages. The only exceptions are the UK and Japan, which are two standard deviations above the historical mean relative to their respective markets (Chart 9). The Future Of Healthcare Every crisis provides insights into what went wrong, what needs to be changed, and what areas should be explored. The COVID-19 pandemic is no exception. The pandemic has highlighted supply-chain fragilities, particularly a shortage of some healthcare equipment and drugs, the production of which is outsourced. In the US, for example, according to the Food and Drug Administration (FDA), over 70% of facilities producing essential medicines for the US are located abroad (Chart 10). Chart 9Valuations Remain Reasonable
Valuations Remain Reasonable
Valuations Remain Reasonable
Chart 10Supply Chain Fragilities
The Healthcare Revolution: The Case For Staying Overweight
The Healthcare Revolution: The Case For Staying Overweight
Some argue that reshoring healthcare production is essential. Joe Biden, favored to be the next US president, has highlighted this in his plan to rebuild US supply chains.2 This could, however, lead to higher healthcare costs. This would either require increased government spending to subsidize medical expenses, or lead to fewer people being able to afford adequate healthcare. This effect would be pronounced in economies where a large percentage of the population is uninsured, around 10% in the US, and much more so in some emerging economies where healthcare quality is poor. This might be less of a risk for pharmaceutical and biotechnology companies, where the largest cost of bringing a new drug to market is R&D and marketing, rather than manufacturing. In the first months of the outbreak, resources such as ventilators, hospital and ICU beds, and basic personal protective equipment (PPE) quickly became scarce. Inventories of such items and overall hospital capacity will need to increase. This will entail massive investments to boost the public healthcare infrastructure and increase the number of healthcare workers. Chart 11COVID-19 Unveiled Poor Health Standards...
The Healthcare Revolution: The Case For Staying Overweight
The Healthcare Revolution: The Case For Staying Overweight
The pandemic also underlined weaknesses in social and health standards. The excessive number of deaths from COVID-19 in nursing homes in some developed economies emphasizes the need for investment in this area. For example in Quebec, Canada, a staggering 80% of the province’s deaths occurred in nursing homes and senior residences (both public and private), illustrating the mismanagement and lack of funding (Chart 11). Most notably, care homes run for profit (approximately 70% of the total in the US) have seen almost four times as many COVID-19 infections as those not. The quality ratings of for-profit nursing homes, as measured by the Centers for Medicare and Medicaid Services (CMS), are much lower on average than those of non-profit or government-run facilities (Chart 12). This could imply the mass nationalization of nursing homes. However, this is unlikely. A better option would be to impose higher standards on privately run homes, reducing the sector to a smaller number of high-quality providers. Chart 12...In Most For-Profit Nursing Homes
The Healthcare Revolution: The Case For Staying Overweight
The Healthcare Revolution: The Case For Staying Overweight
Chart 13The Evolution Of Genome Sequencing Is Illustrated In The Price
The Healthcare Revolution: The Case For Staying Overweight
The Healthcare Revolution: The Case For Staying Overweight
More positively, there remains a large gap to be filled by a new era of technology-driven, integrated, and online healthcare. Investments in biotechnology – particularly related to genetic information – are also likely to increase, as DNA sequencing becomes cheaper (Chart 13). The way patients interact with physicians will also change. The American Medical Association (AMA) surveyed more than 1000 physicians on the use of digital tools in their practices. Reliance on digital tools for monitoring and clinical support has increased significantly over the past three years. The largest jump however was in the number of practices using telemedicine and virtual visits (Chart 14). Chart 14The Transition To A Digital-Driven Healthcare Model
The Healthcare Revolution: The Case For Staying Overweight
The Healthcare Revolution: The Case For Staying Overweight
“Contact tracing” is a term that has been widely used during the coronavirus outbreak. The ability to track those infected and monitor their interactions to limit the spread of the virus is seen as a crucial step to mitigate further contagion. This would help not only to eradicate the virus, but might be developed into a long-lasting technology. Similar to how security screening equipment was developed after 9/11, there should be investment opportunities in the medical-screening segment. Breaking Down Healthcare Equities It is important to note that not all healthcare equities are equal: Different regions and industries have performed differently. In this report, we distinguish between the industry groups and subgroups, based on the GICS Level 2 and Level 3 classifications. We also look at the nine largest regions in the MSCI indexes to see if certain regions provide more favorable opportunities. Healthcare equities are broken down into two industry groups, which in turn break down into six industries: Healthcare equipment & services Healthcare equipment & supplies Healthcare providers & services Healthcare technology Pharmaceuticals, biotechnology & life sciences Pharmaceuticals Biotechnology Life sciences tools & services In Table 1, we drill down the constituent weights of the MSCI healthcare indexes. This allows us not only to analyze the size of the sector and its parts, but also to gain multiple insights. For example, a bet on Swiss healthcare stocks is essentially a bet on pharmaceuticals, given the greater-than-80% weighting of that industry. Exposure to the overall Danish equity index is by default a play on healthcare stocks, since they comprise almost 60% of the index. Table 1Global Healthcare Weights
The Healthcare Revolution: The Case For Staying Overweight
The Healthcare Revolution: The Case For Staying Overweight
Chart 15Healthcare Has Outperformed Broad Indices Globally...
Healthcare Has Outperformed Broad Indices Globally...
Healthcare Has Outperformed Broad Indices Globally...
As noted earlier, global healthcare stocks have outperformed the broad index by almost 50% over the past decade. This is true across all regions. However, several distinctions can be made. US, Swiss, and Danish healthcare equities have outperformed the global healthcare benchmark over the past decade, but their counterparts in the euro area, UK, and Japan have lagged (Chart 15). On a risk-adjusted basis, Danish healthcare equities have been the best performer with a Sharpe-ratio of 0.84 and an annualized return of 18% since 2000 (Table 2). Table 2...However Not All Healthcare Stocks Are Alike
The Healthcare Revolution: The Case For Staying Overweight
The Healthcare Revolution: The Case For Staying Overweight
Investment Opportunities Chart 16Within Healthcare Equities, Favor Biotechnology and Healthcare Technology...
Within Healthcare Equities, Favor Biotechnology and Healthcare Technology...
Within Healthcare Equities, Favor Biotechnology and Healthcare Technology...
Viewing healthcare as a set of separate segments, rather than as a single industry, highlights pockets of opportunity. A selective approach might be preferable for asset allocators in the coming years. As discussed in The Future Of Healthcare section, the sector is likely to shift to a model that relies more on technology, is data-driven, and harnesses the power of digitization, robotics, and AI. The patient will be at the center of the new healthcare model. We divide our overview of investment opportunities into three categories: equities, corporate bonds, and private investments. Equities: Based on our view of the future of healthcare and the structure of the GICS equity classifications, we favor biotechnology and healthcare technology, and would have only a benchmark allocation to pharmaceuticals. There are insights to be drawn from the fundamentals, historical performance, and valuation metrics. Historically, pharmaceutical equities stand out as the worst performers within the sector. Over the past decade, they have underperformed the global healthcare benchmark by 20%, whereas biotechnology and healthcare technology stocks have outperformed by 59% and 127%, respectively (Chart 16). The outperformance of biotechnology has predominantly been earnings-driven, whereas pharmaceuticals’ and healthcare technology stock prices appear to be detached from earnings (Chart 17). It is worth nothing that despite the fact that valuations for those industries appear expensive relative to the broad market, we remain positive on their outlook. As we drill deeper into Level 3 industries, the small number of constituents within the index makes relying on valuations challenging (Chart 18). Chart 17..Despite A Detachment From Earnings...
..Despite A Detachment From Earnings...
..Despite A Detachment From Earnings...
Chart 18...And Elevated Valuations
...And Elevated Valuations
...And Elevated Valuations
Chart 19No Attractive Opportunities Within Healthcare Corporate Bonds
No Attractive Opportunities Within Healthcare Corporate Bonds
No Attractive Opportunities Within Healthcare Corporate Bonds
Corporate Bonds: Within the corporate bond universe, we favor those that qualify for central banks’ purchase programs: Investment-grade bonds and the highest tranche of high-yield. BCA Research’s US fixed-income strategists have an overweight recommendation on US healthcare corporate bonds, though their recommendations are based on a six-to-12 month investment horizon rather than the longer perspective that we are taking in this report.3 Both healthcare and pharmaceuticals bonds, similar to their equity counterparts, trade defensively, outperforming the broad corporate index when spreads widen and underperforming as they tighten (Chart 19). This applies to both investment-grade and high-yield bonds. The credit risk measure favored by our US bond strategists is the duration-times-spread (DTS) ratio. This measure confirms the sector’s defensive nature: A value below 1 implies credit risk lower than the market. However, the recent uptick in the DTS ratio of healthcare investment-grade bonds shows the sector has become riskier and as such may trade more cyclically in the short term. Nevertheless, the macro environment should remain favorable. Pricing power is still strong, with medical care services rising by almost 6.0%, and drug prices rising by 1.4% on a year-over-year basis, outpacing overall consumer prices (Chart 20). Neither segment within the investment-grade space offers an attractive spread advantage over the broad index. However, the risk outlook for healthcare remains better than that for pharmaceuticals, particularly related to political risk (as discussed later in the Risks section). Private Investments: Venture-capital investments in healthtech reached a quarterly record high of $8.2 billion in Q1 2020. The recent pandemic is likely only to push this trend higher. Moreover, large private-equity investments in recent years have been targeted at biopharma.4 According to Bain & Company, global biopharma private-equity deals where value was disclosed, reached $40.7 billion in 2019, up from $16.5 billion the prior year.5 The number of biotech firms going public is also trending up, despite slipping to 48 in 2019 from 58 in 2018 (Chart 21). To date (as of early June), 21 out of 43 US IPOs this year are healthcare-related. Chart 20Pricing Power Remains Favorable
Pricing Power Remains Favorable
Pricing Power Remains Favorable
Chart 21More Biotech IPOs Are Coming To Market
The Healthcare Revolution: The Case For Staying Overweight
The Healthcare Revolution: The Case For Staying Overweight
Additionally, M&A activity has been increasing, particularly within the biotechnology segment, although the economic shutdown has slowed the deal flow recently. The number of M&A deals peaked in March 2020, when the average premium is 45% (Chart 22). The long-term rising trend is likely to persist. Over the next year, firms with drugs or vaccines related to COVID-19 would be clear targets for acquisitions and should outperform. Over the long term, we also expect to see some industry consolidation. Risks We see the following as the biggest risks to our overall positive outlook for healthcare investments: Quicker-Than-Expected Economic Growth Rebound: As we highlighted, the healthcare sector is defensive – outperforming the broad market during recessions and economic slowdowns. However, if growth rebounds more quickly, driven by further fiscal and monetary stimulus, the upside for healthcare performance could be challenged. Political Risk: Joe Biden might swing to the left in the run-up to the US presidential election to bring on board supporters of Elizabeth Warren and Bernie Sanders. Nevertheless, we see that particular risk for healthcare as relatively small (Chart 23). Biden’s approach is to restore and expand Obamacare (the Affordable Care Act, or ACA), shifting some of the burden of healthcare spending from individuals to the government. Overall, this should be positive for healthcare spending, particularly for insurers and healthcare providers. However, pharmaceutical companies may face headwinds if the administration imposes price caps on drug prices. Chart 22Secondary Market Activity Is Also Strong
Secondary Market Activity Is Also Strong
Secondary Market Activity Is Also Strong
Chart 23Political Risk Has Waned As Biden's Chances Of Election Have Increased
Political Risk Has Waned As Biden's Chances Of Election Have Increased
Political Risk Has Waned As Biden's Chances Of Election Have Increased
Chart 24Reliance On Inorganic Growth Might Prove Unsustainable
Reliance On Inorganic Growth Might Prove Unsustainable
Reliance On Inorganic Growth Might Prove Unsustainable
Lack Of Innovation: Over the past two decades, the healthcare sector has shifted to relying on inorganic growth, driven by takeovers, rather than on research and development. Capital expenditure as a percentage of sales by both pharmaceutical and biotechnology firms fell sharply in the 2000s and has stagnated around 2% and 4%, respectively since (Chart 24). Only A Few Make It: While more IPOs in the healthcare sector is a sign of improving innovation, it is worth noting that only a few newly listed companies are successful. Over the past decade, only 3% of the 349 biotech IPOs had positive earnings at the time of their IPO. This nevertheless is a consequence of the nature of the industry: Companies tend to list while they await a big breakthrough in product development or regulatory approval. Conclusion We continue to recommend investors hold an above-benchmark allocation to healthcare-related investments on a long-term basis. Aging populations, the need to improve the quality of global healthcare, a likely increase in government spending, the shift to digitalized healthcare, and demand which is non-cyclical all support this stance. Healthcare equities in general, and particularly biotechnology and healthcare technology, should perform well over the coming years. For investors with global mandates, allocations to US, Swiss, and Danish healthcare equities should outperform those in the euro area, Japan, and the UK. Corporate bonds do not offer any advantage over the broad corporate US bond index. Political risks for the US healthcare sector should be limited even if the Democrats win the White House. However, the risk is highest for pharmaceuticals, in the event where the government imposes price caps. Amr Hanafy Senior Analyst amrh@bcaresearch.com Footnotes 1 "World Economic Forum, Outbreak Readiness and Business Impact, Protecting Lives and Livelihoods across the Global Economy," January 2019. 2 For more info please see Joe Biden https://joebiden.com/supplychains/ 3 Please see US Bond Strategy, "Assessing Healthcare & Pharma Bonds In A Pandemic," dated June 9, 2020.available at usbs.bcaresarch.com. 4 Biotech refers to manufactured products that rely on using living systems and organisms. The biopharma industry is backed by biotechnology, the science, which allows products to be manufactured biologically. 5 Bain & Company, Global Healthcare Private Equity and Corporate M&A Report 2020.
S&P 5 Versus S&P 495
S&P 5 Versus S&P 495
The deeper we dig in the concentration of SPX returns the more worried we become. The top five stocks in the SPX (AAPL, MSFT, AMZN, GOOGL & FB) have added $4.82tn to the S&P 500 market cap since 2015, whereas the bottom 495 stocks have added $3.82tn. In percent return terms, these five tech titans’ market capitalization has gone up roughly four fold or 288% over the past 5 ½ years from $1.67tn to $6.49tn. In marked contrast, the S&P 495 market cap has gone nowhere rising a mere 23% (increasing from 16.57tn to $20.39tn) during the same time frame (top panel). If investors have not been in these tech titans, then they have not really participated in the SPX’s run up. The measly return since 2015 in the Value Arithmetic index and negative return in the Value Line Geometric index gauging the mean and median US stock, respectively, corroborate our analysis (not shown). Clearly, such a steep divergence is unsustainable and the longer these handful of stocks defy gravity the steeper their eventual fall will be (second panel). Bottom Line: We remain cautious on the near-term prospects of the S&P 500, until the election uncertainty lifts in November.
Highlights For financials and energy to produce a sustained rally, there must be no relapse in global growth during the autumn and winter of 2020/21. However, with the coronavirus still in play and the usual flu and virus season yet to come, a key hurdle to overcome will be the physical reopening of schools and childcare facilities this September. Hence, for the time being, remain overweight healthcare and technology versus financials and energy. This implies underweight European stocks versus US stocks, and overweight Germany, France, Netherlands and Switzerland within Europe. Play good news in Europe by remaining long EUR, CHF, and SEK versus USD, and long US T-bonds and Spanish Bonos versus German Bunds and French OATs. Fractal trade: Short silver. Feature Chart Of The WeekDenmark's OMX Is At An All-Time High, While The FTSE 100 Is Languishing. Why?
Denmark's OMX Is At An All-Time High, While The FTSE 100 Is Languishing. Why?
Denmark's OMX Is At An All-Time High, While The FTSE 100 Is Languishing. Why?
Once upon a time, the stock market existed as a barometer of the economy. Or at least, a good representation of the size and composition of profits in the host economy. But that time is long gone. Today, a tiny handful of companies are driving the performance of supposedly broad indexes such as the FTSE 100 and the S&P 500. Indeed, we should more accurately call the FTSE 100 the FTSE ‘10’ ignoring the other 90. And we should call the S&P 500 the S&P ‘5’ ignoring the other 495. Meaning that stock markets are no longer stock ‘markets’. Yet many analysts still try and explain the stock market’s performance through traditional top-down macro drivers such as GDP growth, profit margins across the host economy, and so on. The trouble is that when the stock market is dominated by a tiny handful of companies, this 20th century approach is doomed to fail. Today, we must take a more granular approach based on the type of companies that are dominating each stock market. Sector Concentration Is Driving Stock Markets The handful of companies that dominate each stock market tend to be the leaders in their global sector. This means that each stock market is defined by a sector concentration, which has often evolved by chance, based on where companies chose to start up and list. This sector concentration usually has little or no connection with the host economy. For example, Denmark’s OMX index is dominated by Novo Nordisk, a global biotech company. The FTSE 100 is heavily weighted to the oil majors Royal Dutch and BP as well as global bank HSBC, which have only a limited exposure to the UK economy. On the other side of the Atlantic, Apple, Microsoft, Amazon, Google and Facebook are massively over-represented in the S&P 500 compared with their contribution to the US economy. A crucial defining feature of a stock market turns out to be its exposure to healthcare and technology – whose profits are in major structural uptrends – versus the exposure to financials and energy – whose profits are in major structural downtrends (Charts 2 - 5). Chart I-2Healthcare Profits Are In A Structural Uptrend
Healthcare Profits Are In A Structural Uptrend
Healthcare Profits Are In A Structural Uptrend
Chart I-3Technology Profits Are In A Structural Uptrend
Technology Profits Are In A Structural Uptrend
Technology Profits Are In A Structural Uptrend
Chart I-4Financial Profits Are In A Structural Downtrend
Financial Profits Are In A Structural Downtrend
Financial Profits Are In A Structural Downtrend
Chart I-5Energy Profits Are In A Structural Downtrend
CHART 5
CHART 5
The stock market capitalisation in healthcare and technology stands at 52 percent for Denmark and 40 percent for the US, compared with just 20 percent for Europe and 12 percent for the UK. The flip side is that the stock market capitalisation in financials and energy stands at just 8 percent for Denmark and 11 percent for the US, compared with 21 percent for Europe and 30 percent for the UK. This explains, for example, why Denmark’s OMX is hitting all-time highs while the FTSE 100 is languishing (Chart of the Week). That said, the price of the growing stream of healthcare and technology profits can still fall if it is at an unjustifiably high level. And the price of the shrinking stream of financial and energy profits can still rise if it is at an unjustifiably low level. Hence, the key question is: what determines the prices of these two groups of sectors, one whose profits are in a major uptrend, the other whose profits are in a major downtrend? Healthcare And Tech Performance Hinges On The Bond Yield The price of a rapidly growing profit stream is weighted to the values of the large distant cashflows, making it highly sensitive to the discount rate applied to those distant cashflows. Whereas the price of a rapidly shrinking profit stream is weighted to the values of the large immediate cashflows, making it much more sensitive to the near-term evolution of the economy (Box I-1). Box I-1Bond Yield Sensitivity Versus Economic Sensitivity
The End Of The Stock 'Market'
The End Of The Stock 'Market'
The upshot is that for stocks and sectors whose profits are in a major uptrend, the key driver of the price is the direction of the bond yield. Whereas for stocks and sectors whose profits are in a major downtrend, the key driver is the near-term direction of the world economy (Chart I-6 and Chart I-7). Chart I-6Exposure To Healthcare And Technology Determines Bond Yield Sensitivity
Exposure To Healthcare And Technology Determines Bond Yield Sensitivity
Exposure To Healthcare And Technology Determines Bond Yield Sensitivity
Chart I-7Exposure To Financials And Energy Determines Economic Sensitivity
Exposure To Financials And Energy Determines Economic Sensitivity
Exposure To Financials And Energy Determines Economic Sensitivity
Pulling all of this together, the rally in healthcare and technology stocks is extremely vulnerable to a sustained rise in the bond yield. But a sustained rise in the bond yield seems highly unlikely without a breakthrough vaccine or treatment for COVID-19. While the coronavirus is still in play, the long-term hollowing out and scarring in the jobs market will only become apparent in the coming months once furlough schemes and temporary relief programs end. This will force all central banks to remain ultra-dovish and where possible, become more dovish. Meanwhile, for financials and energy to produce a sustained rally, there must be no relapse in global growth during the autumn and winter of 2020/21. However, with the coronavirus still in play and the usual flu and virus season yet to come, a key hurdle to overcome will be the physical reopening of schools and childcare facilities this September. Hence, for the time being, remain overweight healthcare and technology versus financials and energy. This translates to underweight Europe versus the US. And overweight Germany, France, Netherlands and Switzerland within Europe. How To Play Good News In Europe Things have been going right in Europe. First, unlike in the US, the COVID-19 outbreak is subsiding, at least for now. New infections have been steadily declining through the warm summer months (Chart I-8). Chart I-8New Infections Declining In Europe, Rising In The US
New Infections Declining In Europe, Rising In The US
New Infections Declining In Europe, Rising In The US
Second, the ECB has injected ample liquidity into the banking system which, combined with ultra-low interest rates, has permitted a strong expansion in bank lending. Though somewhat disappointingly, the bank lending surveys tell us that the loans are being used for emergency working capital requirements rather than investment. Third, the EU has approved a €750 billion Recovery Fund, over half of which will take the form of grants to the sectors and regions most stricken by the coronavirus crisis. Given that the fund will be financed by jointly issued EU bonds, this amounts to a fiscal transfer to the areas that need the most help. Hence, even if the amount of the stimulus may be smaller than in other parts of the word, it comprises a huge symbolic step towards greater unity in the EU and euro area. Still, despite this trifecta of good news, European stock markets have not outperformed (Chart I-9). This just emphasises that stock market relative performance has little connection with domestic economics and politics. To reiterate, stock market relative performance is almost always the result of the sector concentration of a handful of dominant stocks. Chart I-9Despite Good News In Europe, European Equities Are Not Outperforming
Despite Good News In Europe, European Equities Are Not Outperforming
Despite Good News In Europe, European Equities Are Not Outperforming
Begging the question: how to play the continuation of good news in Europe? The answer is through the currency and fixed income markets, which have a much stronger connection with domestic economics and politics (Chart I-10 and Chart I-11). Chart I-10Play Good News In Europe Via European Currencies...
Play Good News In Europe Via European Currencies...
Play Good News In Europe Via European Currencies...
Chart I-11...And Sovereign Yield Spread Tightening
...And Sovereign Yield Spread Tightening
...And Sovereign Yield Spread Tightening
Remain long a basket of EUR, CHF, and SEK versus the USD. Our favourite cross out of these three is long CHF/USD given the haven character of the CHF in periods of market stress. To play bond yield convergence between the US and Europe and between core and periphery Europe, remain long US 30-year T-bonds and Spanish 30-year Bonos versus German 30-year bunds and French 30-year OATs. Dhaval Joshi Chief European Investment Strategist dhaval@bcaresearch.com Fractal Trading System* The spectacular rally in silver is fractally fragile, and at a point which has signalled several trend reversals through the past five years. Accordingly, this week’s recommended trade is short silver, with the profit target and symmetrical stop-loss set at 12.5 percent. In other trades, long GBP/RUB achieved its profit target. Against this, short Germany versus UK and long bitcoin cash versus ethereum reached their stop-losses. Long nickel versus copper reached the end of its holding period in partial loss. The rolling 12-month win ratio now stands at 59 percent.
Silver
Silver
When the fractal dimension approaches the lower limit after an investment has been in an established trend it is a potential trigger for a liquidity-triggered trend reversal. Therefore, open a countertrend position. The profit target is a one-third reversal of the preceding 13-week move. Apply a symmetrical stop-loss. Close the position at the profit target or stop-loss. Otherwise close the position after 13 weeks. * For more details please see the European Investment Strategy Special Report “Fractals, Liquidity & A Trading Model,” dated December 11, 2014, available at eis.bcaresearch.com. Fractal Trading System Cyclical Recommendations Structural Recommendations Closed Fractal Trades Trades Closed Trades Asset Performance Currency & Bond Equity Sector Country Equity Indicators Bond Yields Chart II-1Indicators To Watch - Bond Yields
Indicators To Watch - Bond Yields
Indicators To Watch - Bond Yields
Chart II-2Indicators To Watch - Bond Yields
Indicators To Watch - Bond Yields
Indicators To Watch - Bond Yields
Chart II-3Indicators To Watch - Bond Yields
Indicators To Watch - Bond Yields
Indicators To Watch - Bond Yields
Chart II-4Indicators To Watch - Bond Yields
Indicators To Watch - Bond Yields
Indicators To Watch - Bond Yields
Interest Rate Chart II-5Indicators To Watch - Interest Rate Expectations
Indicators To Watch - Interest Rate Expectations
Indicators To Watch - Interest Rate Expectations
Chart II-6Indicators To Watch - Interest Rate Expectations
Indicators To Watch - Interest Rate Expectations
Indicators To Watch - Interest Rate Expectations
Chart II-7Indicators To Watch - Interest Rate Expectations
Indicators To Watch - Interest Rate Expectations
Indicators To Watch - Interest Rate Expectations
Chart II-8Indicators To Watch - Interest Rate Expectations
Indicators To Watch - Interest Rate Expectations
Indicators To Watch - Interest Rate Expectations
Earnings season is in full swing, and rock bottom expectations for most sectors will prove once again a low bar to surpass. Earnings ultimately matter for stock returns. As a reminder the SPX drubbing in March predicted a collapse in 2020 EPS below $110, and the subsequent 1000 point S&P 500 rebound since the lows signals a return to EPS trend near $162 in 2021. The top panel of the chart shows that this is more or less what the Street expects. Our updated four-factor macro model corroborates this V-shaped rebound in profit growth and should continue to underpin stocks on a cyclical time horizon (bottom panel). In the near-term however, we would be cautious and not chase stocks higher. The steeper the short-term rise in the SPX, the steeper the eventual snapback will be. The risks we are monitoring are the high concentration of returns in a handful of tech titans, the Fed’s balance sheet leveling off, a potential fiscal cliff, and a “blue wave” risk that is not at all priced into equities as we recently posited. Bottom Line: While our cyclically sanguine broad equity market view remains intact, we are cautious in the short-term prospects of the S&P 500, until the election uncertainty lifts in November.
What Is Our Macro Model Saying About SPX Earnings?
What Is Our Macro Model Saying About SPX Earnings?
Rising Concentration Risk
Rising Concentration Risk
Two Friday’s ago we highlighted that the tech sector’s (plus FANG: FB, AMZN, NFLX & GOOGL) market cap weight in the SPX was high and rising to uncharted territory near 40%, and such narrowing breadth was a clear risk to the market rally. Today we compare the five tech titans’ market cap weight in the SPX with five GICS1 cyclical sectors (industrials, energy, materials, financials and real estate). The results are staggering: five tech stocks are worth as much as 224 deep and early cyclical stocks in the S&P 500 (top panel). Such high concentration is worrisome and represents a near-term risk to the equity market recovery run. While the drubbing in the 10-year US treasury yield is propelling the tech titans’ forward multiple to the stratosphere (bottom panel), we fear that gravity will sooner-rather-than-later push these stocks back down to earth. NFLX recent earnings fired a warning shot that uncharacteristically high expectations are being built into tech stocks, making them vulnerable to sizable pullbacks. Bottom Line: We remain cautious on the short-term prospects of the S&P 500, until the election uncertainty lifts in November.
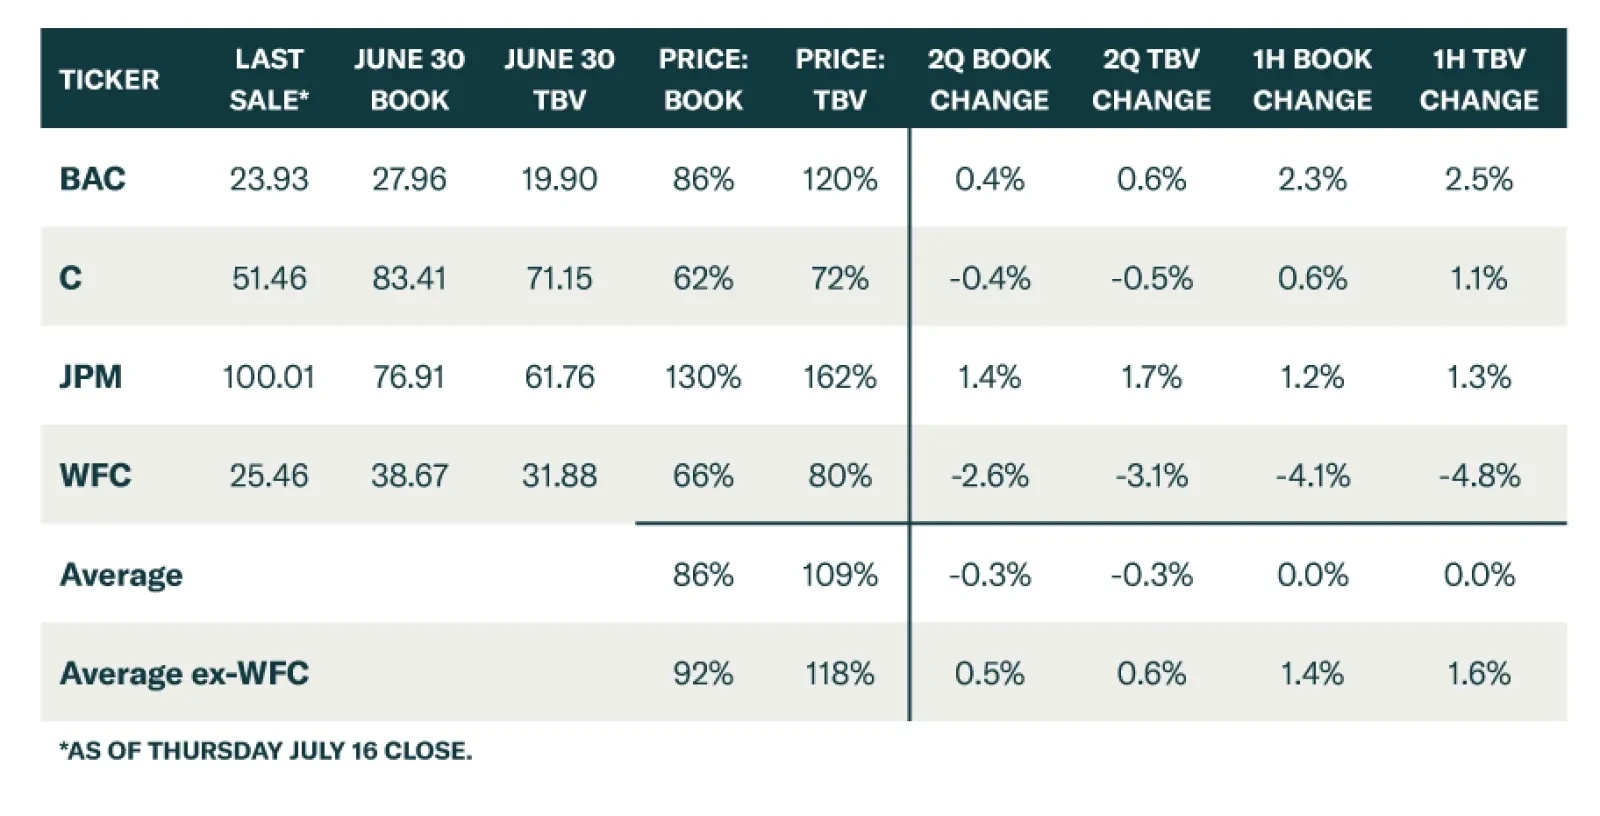
BCA Research's US Investment Strategy service remains bullish on the SIFI banks despite the uncertainty surrounding their outlook. Second quarter earnings provided just that demonstration, at least away from WFC, which has a raft of intrinsic issues to…
Highlights The ultimate extent of credit losses in this cycle is unknown, … : Conventional models are ill-equipped to project the damage that the pandemic will inflict on the economy when monetary and fiscal policymakers are doing all they can to mitigate it. … but household borrowers have held up quite well so far and business borrowers have benefitted from a flood of liquidity: Generous transfer payments have kept household delinquencies in check, the capital markets have allowed bigger companies to pre-fund themselves, and a combination of forbearance and PPP loans has given smaller companies a lifeline. Cash hoards have protected households and businesses, but it is not yet clear when they’ll feel secure enough to spend them: Consumer spending had been on an upward trajectory before rising infection rates forced states to pause or reverse re-opening plans. We remain bullish on the SIFI banks, despite the uncertainty surrounding their outlook: The earnings power of the SIFIs’ franchises has allowed them to build up considerable loan-loss reserves without depleting their capital (ex-Wells Fargo). Stable book values make them too cheap to pass up in an otherwise pricey equity market. Clear As Mud The five largest banks reported their second quarter earnings last week. From the perspective of investing in the banks, the news wasn’t too bad. Excepting beleaguered Wells Fargo (WFC), the SIFI banks and U.S. Bancorp (USB) were able to maintain their per-share book values despite loan-loss reserve increases that exceeded the first quarter’s sizable builds. The results supported our investment thesis: as long as monetary and fiscal policy makers are able to limit the credit fallout from the pandemic, the earnings power of the SIFIs’ franchises can fully offset COVID-19 credit costs, preserving their book values and making their stocks compellingly cheap versus the broad market. Our current investment view aside, we monitor the banks’ calls for insight into the future direction of the economy. The largest banks are always well positioned to observe budding trends in consumption, borrowing and credit performance. They currently also offer a window into the success of policy measures intended to prevent the pandemic from catalyzing a negatively self-reinforcing default spiral. The economic picture the banks painted this quarter was murky, befitting the uncertainty surrounding the virus. They saw activity pick up as social distancing restrictions began to be eased in much of the country in May and June, but the virus’ resurgence (Chart 1) had them stressing that the immediate future is especially uncertain. The tone on this round of calls tended to be cautious, though the CEOs and CFOs acknowledged the potential for positive surprises and allowed that they may well be done building up loan-loss reserves. Chart 1US Daily New Infections
The Big Bank Beige Book, July 2020
The Big Bank Beige Book, July 2020
The banks’ big-picture observations tended to reinforce each other. One view that they unanimously expressed in their first quarter calls was borne out in the second quarter: the March-April drawdown of corporate credit lines was indeed precautionary, as the draws were largely repaid at every bank once the corporate bond market was able to accommodate new issuance. Debit and credit card spending troughed at all the banks around mid-April and then rose steadily across May and June. Bank of America reported that its customers’ spending had increased on a year-over-year basis over the first two weeks of July. All the banks have been encouraged by the performance of consumer borrowers who have requested deferments or other forbearance measures. It is way too early for conclusions, but lenders have been pleasantly surprised by the sizable share of forbearance borrowers who have managed to keep making payments and the modest share who have requested additional deferments. Perhaps the consumer deferments are analogous to businesses’ drawdowns of credit lines in March and April – an emergency precaution unwound once other help, like aid from the CARES Act, arrived. All the banks set aside more money for future loan losses in the second quarter than they did in the first, and their aggregate reserve build rose by 50% quarter-on-quarter (Table 1). Vigorous reserving hurt this quarter’s earnings, but it will help gird the banks for a more protracted downturn than they foresaw on March 31st. Table 1Stacking Up The Loan Loss Reserve Sandbags
The Big Bank Beige Book, July 2020
The Big Bank Beige Book, July 2020
The news was very good from an operational standpoint, though it may herald future softness for airlines, hotels and the owners of office and retail space. No bank reported any hiccups in transitioning to servicing their clients and customers remotely. Capital markets activity surged, even as trading floors were empty and million-mile-club investment bankers hunkered down at home. Pandemic shutdowns may point the way to a reduced-overhead future, as banks shrink their branch footprints, lease less office space, trim headcount and pare travel and entertainment budgets. 2Q20 Big Bank Beige Book Household Borrowing (Chart 2) And Spending (Chart 3) Chart 2Consumers Are Paying Down Their Debt
Consumers Are Paying Down Their Debt
Consumers Are Paying Down Their Debt
Chart 3Whiplash
Whiplash
Whiplash
Debit and credit sales volumes … consistently trended upward since the trough in the second week of April to down just 4% year-on-year in the last two weeks of June. T[ravel]&E[ntertainment] and restaurant spend continue to be down meaningfully. The most significant improvement … was in retail, with a strong recovery in credit card volume in the second half of the quarter and consistently strong growth in card-not-present1 volume throughout the quarter. (Piepszak, JPM CFO) [In April, our consumers’] spending was down 26% compared to April of 2019. However, for … June, that spending was relatively flat to 2019. [T]hrough the first couple weeks of July, we’re seeing … spending … above what it was last year. (Moynihan, BAC CEO) All big banks saw similar performance trends from participants in their consumer loan forbearance programs. It's too early to make conclusions, but the preliminary data are encouraging. April saw the lowest level of [auto] loan and lease originations since the financial crisis, but activity rebounded sharply in May and June, and … June [was] the best month for auto originations in our history. (Piepszak, JPM) [R]etail [mortgage] purchase applications … recover[ed] to well above pre-COVID levels in June due to a strong and broad market recovery. (Piepszak, JPM) [A]uto lending … [is] going to be a bright spot [in] the third quarter, but overall consumer lending is likely to be down simply because consumer spending has been down. (Dolan, USB CFO) Consumer credit card spend improved steadily starting in mid-April, but was still down approximately 10% from a year ago as of the end of June. (Shrewsberry, WFC CFO) Lower interest rates drove strong industry [mortgage] volume, with [the] second quarter estimated to [have] the largest origination … since the third quarter of 2003. (Shrewsberry, WFC) Consumer Forbearance Relative to peak levels … at the beginning of April, we’ve seen a significant decline in new [assistance] requests. … [A majority of borrowers requesting assistance] hav[e] made at least one payment while in the forbearance period. … [L]ess than 20% of [credit card] accounts [have] request[ed] additional assistance [after reaching the end of the initial 90-day deferral period]. (Piepszak, JPM) [F]irst-time enrollment volumes have come down significantly. … [R]e-enrollment … rates are running below expectation, … right around … the mid-teens. … [W]e’re seeing good signs of those rolling off [of forbearance] continuing to remain current. (Mason, C CFO) In the last few weeks, [loan deferral requests] have been … 98% below [the] peak [in the first week of April]. … More than 60% of the … card deferrals have made at least one payment[;] [o]ne-third have made every payment every month. (Donofrio, BAC CFO) 70% of customers [with credit card deferrals] have started to make normal payments after [the deferral periods end], … [and] about 20% [have] re-enroll[ed]. … So, so far, so good on the [card deferral] performance. (Runkel, USB Chief Credit Officer) Business (And Bank) Caution [Last quarter’s debt and equity issuance] is pre-funding. This is not capital. All this [cash] is not being raised to go spend. It’s being raised to sit [on] the balance sheet, so that you’re prepared for whatever comes next. And you’ve heard a lot of companies make statements [like] … we’ve got two years of cash, we’ve got three years of cash. [P]eople want to be prepared [for anything]. (Dimon, JPM CEO) [T]he commercial spend has been pretty cautious. It was down [around] … 30-35% in … April … , and it’s still down around somewhere between 25 and 30%. (Cecere, USB CEO) Commercial card spend remained significantly lower throughout the second quarter and was still down over 30% in the last full week of June compared to the same week a year ago, with declines across industry segments. (Scharf, WFC CEO) We’ve added $284 billion in deposits since year-end, [and] all of that has gone into cash, earning 10 basis points. [A]s we assess the future of this pandemic, as we … assess how much of [those deposits] is going to stick around, and we get a little bit more confident … , a portion of that … could be deployed into securities. (Moynihan, BAC) It’s Uncertain Out There [T]he extraordinary actions of the Fed and the Treasury leave … industry models kind of wanting for more insight, [because] we’ve never seen this type of action whether it’s the checks people receive, whether it’s … $500-plus billion [of the PPP], whether it’s the income tax payment holiday. (Corbat, C CEO) We cannot forecast the future. We don’t know. I think you’re going to have a much murkier economic environment going forward than you had in May in June, … which is why … the base case, an adverse case, an extreme adverse case … are all possible. And we’re just guessing the probabilities of those things. That’s what we’re doing. (Dimon, JPM) All the big banks reported that their business clients were proceeding cautiously; the banks themselves are, too, leaving their deposit windfalls in cash until they have a better sense of what's to come. [W]e go in feeling very well positioned against this. But we don’t want people leaving the call simply thinking that the world is a great place and it is a V-shaped recovery. … I don’t think anybody should leave any bank earnings call this quarter simply feeling like the worst is absolutely behind us and it’s a rosy path ahead. (Corbat, C) Buy The SIFIs As every SIFI management team stressed on last week’s calls, the environment is extremely uncertain. We are in unchartered waters and regression models can do no more than guess at how monetary accommodation, fiscal aid and lender forbearance will interact with COVID-19 transmission patterns, improved treatments and vaccine development efforts to influence credit performance. Investing in the SIFIs is by no means a slam dunk. The equity market is clearly skeptical about their prospects and our BCA colleagues are in no hurry to join us on the SIFI bandwagon. The group’s unpopularity, however, is precisely why it offers outsized prospective returns. As the longtime investment counselor for one of New York’s wealthiest families put it, “you can have cheap stocks or you can have good news, but you can’t have both.” The news is fraught right now, but we think a critical story line will take a turn for the better once Washington comes through with another major phase of fiscal aid. Given the hole left by consumption (Chart 4) and businesses’ suspended animation, government spending is the only way to keep the economy – and the administration’s faltering re-election prospects – afloat. Chart 4Plunging Consumption Has Left A Gaping Hole In The Economy
Plunging Consumption Has Left A Gaping Hole In The Economy
Plunging Consumption Has Left A Gaping Hole In The Economy
We are well aware that investors are leery of the banks when low interest rates and a flat yield curve are depressing net interest income, but it’s far more of an issue for community banks that do nothing more than take deposits and make loans than it is for the SIFIs, which generate gobs of fee income and match the duration of their assets and liabilities to the first decimal place. Even the narrow relationship between bank net interest margins and the yield curve is greatly exaggerated (Chart 5), and relative equity returns have had no relationship with the yield curve since the crisis (Chart 6). Banks do not need a major rise in the 10-year yield to outperform; they just need to demonstrate that the earnings power of their franchises is enough to overcome the drag from projected credit losses. Chart 5Little Fundamental Relationship ...
Little Fundamental Relationship ...
Little Fundamental Relationship ...
Chart 6... And No Market Relationship
... And No Market Relationship
... And No Market Relationship
From our perspective, second quarter earnings provided just that demonstration, at least away from woebegone WFC, which has a raft of intrinsic issues to overcome. Despite two quarters of huge loan-loss reserve builds, the SIFI banks’ book values have emerged unscathed (Table 2). Pre-provision net revenue (PPNR) has been up to the task of absorbing massive write-downs so far this year (Table 3). If the base-case scenarios hold (unemployment doesn’t move materially higher and GDP has begun slowly recovering), the SIFI banks as a group have already accomplished the bulk of their reserve2 building and their per-share book values will grow at a healthy clip for as long as buybacks remain suspended. Table 2SIFI Book Values
The Big Bank Beige Book, July 2020
The Big Bank Beige Book, July 2020
Table 3Taking The Reserve Builds In Stride
The Big Bank Beige Book, July 2020
The Big Bank Beige Book, July 2020
Additional credit costs are a legitimate concern, but the banks can earn enough to keep from having to eat into their equity capital. The banks trade off of their book values, and book value gains should feed higher stock prices given that their multiples are already at bombed-out levels. It is unusual to have the chance to buy sound banks at or around their book value, and we expect that investors who buy them now and hold them for at least a year will be amply rewarded in relative performance terms. The SIFIs’ soundness will not be in doubt if Congress delivers a meaningful fourth phase of aid by early August. We believe Citi’s CEO had it right on its first-quarter call in mid-April, and we think his conclusion applies to all the SIFIs, even WFC: [T]his isn’t a financial crisis, it’s a public health crisis with severe economic ramifications. … [W]e entered [it] in a very strong position from [a] capital, liquidity and balance sheet perspective. We have the resources we need to serve our clients without jeopardizing our safety and soundness. … I feel confident in our ability to manage through whatever scenario comes to pass. Doug Peta, CFA Chief US Investment Strategist dougp@bcaresearch.com Footnotes 1 A transaction in which the purchaser does not present his/her card to the merchant, typically conducted over the phone or the internet. 2 We are confident that policy makers will be able to continue propping up consumer borrowers, but the business borrower outlook is considerably more uncertain. However, the banks’ earnings calls contained a detail that may suggest that their aggregate loans to businesses got stronger last quarter. Bank loans are typically senior to bonds, and to the extent that last quarter’s massive issuance was aimed at proactively addressing future funding needs, rather than plugging a leak, it made obligations senior to the new bonds better credits. Bank loans to large investment-grade borrowers may be worth a little more than they were at the end of the first quarter.
What's The Message From USTs Relative To Bunds?
What's The Message From USTs Relative To Bunds?
The drubbing in the US/EMU sovereign bond spread is cause for concern for the SPX’s slingshot recovery off the March 23 lows, especially given the tight positive correlation of these two series over the past three decades (top panel). Typically, higher relative yields attract capital to US shores and vice versa, and some of that capital inevitably leaks into US stocks. Moreover, theory would suggest that relative yields move with the ebb and flow of relative return on capital. Indeed, the bottom panel of the chart highlights such an empirical relationship. Currently, euro area return on assets is narrowing the gap with the US which usually happens in recessions. The persistent unresponsiveness in the 10-year UST yield near the zero line which stands closer to the ECB’s NIRP, likely spells short-term trouble for the SPX. Bottom Line: We remain cautious on the near-term prospects of the S&P 500 until the election uncertainty lifts in November.