Sectors

Highlights Global shortages of medical equipment – including medicines – are frontloaded until emergency production kicks in. As the crisis abates, political recriminations between the US and China will surge. The US will seek to minimize medical supply exposure to China going forward, a boon for India and Mexico. China has escaped the COVID-19 crisis with minimal impact on food supply. Pork prices are surging due to African Swine Flu, but meat is a luxury. Still, the “Misery Index” is spiking and this will increase social instability. Food insecurity, inflation, and large current account deficits suggest that emerging market currencies will remain under pressure. Turkey and South Africa stand to suffer while we remain overweight Malaysia. Feature Chart 1Collapse In Economic Activity
Collapse In Economic Activity
Collapse In Economic Activity
With a third of the world population under some form of lockdown, general activity in the world’s manufacturing powerhouses has collapsed (Chart 1). The breakdown is a double whammy on market fundamentals. On the supply side, government-mandated containment efforts force workers in non-essential services to stay home while, on the demand side, households confined to their homes are unable to spend. Acute demand for medical supplies is causing shortages, while supply disruptions threaten states that lack food security. While global monetary and fiscal stimulus will soften the blow (Chart 2), the economic shock is estimated to be a 2% contraction in real GDP for every month of strict isolation. If measures are extended beyond April, markets will sell and new stimulus will be applied. Already the US Congress is negotiating the $1-$2 trillion infrastructure package that we discussed in our March 4 report, and cash handouts will be ongoing. When the dust settles the political fallout will be massive. Authoritarian states like China and especially Iran will face greater challenges maintaining domestic stability. Democracies like Italy and the US, which lead the COVID-19 case count, are the most likely to experience a change in leadership (Chart 3). Initially the ruling parties of the democracies are receiving a bump in opinion polling, but this will fade as households will be worse off and will likely vent their grievances at the ballot box.
Chart 2
Chart 3
Until a vaccine or treatment is discovered, medical equipment and social distancing are the only weapons against the pandemic. National production is (rightly) being redirected from clothing and cars to masks and ventilators to meet the spike in demand. Will the supply shock cause shortages in food and medicine – essential goods for humankind? In this report we address the impact of COVID-19 on global supply security and assess the market implications. Medical Equipment Shortages Will Spur Protectionism
Chart
Policymakers are fighting today’s crisis with the tools of the 2008 crisis, but a lasting rebound in financial markets will depend on surmounting the pandemic, which is prerequisite to economic recovery (Table 1). As the US faces the peak of its COVID-19 outbreak, public health officials and doctors are raising the alarm on the shortage of medical supplies. A recent US Conference of Mayors survey reveals that out of the 38% of mayors who say they have received supplies from their state, 84.6% say they are inadequate (Chart 4). Italy serves as a warning: A reported 8% of the COVID-19 cases there are doctors and health professionals, often treating patients without gloves or with compromised protective gear. These workers are irreplaceable and when they succumb the virus cannot be contained. In the US, doctors and nurses are re-using masks and sometimes treating patients behind a mere curtain, highlighting the supply shortage. While the shortages are mainly driven by a surge in demand from both medical institutions and households, they also come from the supply side, particularly China. Factory closures and transportation disruptions in China earlier this year, coupled with Beijing’s government-mandated export curbs, reduced Chinese exports, a major source of US and global supplies (Chart 5).
Chart 4
Chart 5
Other countries have imposed restrictions on exports of products used in combating the spread of COVID-19. Following export restrictions by the French, German, and Czech governments in early March, the European Commission intervened on March 15 to ensure intra-EU trade. It also restricted exports of protective medical gear outside of the EU. At least 54 nations have imposed new export restrictions on medical supplies since the beginning of the year.1 Both European and Chinese measures will reduce supplies in the US, the top destination for most of these halted exports (Chart 6).
Chart 6
Thus it is no wonder that the Trump administration has rushed to cut import duties and boost domestic production. The administration has released strategic stockpiles and cut tariffs on Chinese medical equipment used to treat COVID-19. With the whole nation mobilized, supply kinks should improve greatly in April. After a debacle in rolling out test kits (Chart 7), the US is rapidly increasing its testing capabilities to manage the crisis, with over a million tests completed as of the end of March (Chart 8). Meanwhile a coalition of companies is taking shape to make face masks. The president has invoked the defense production act to force companies to make ventilators.
Chart 7
Chart 8
However, with the pandemic peaking in the US, the hardest-hit regions will continue experiencing shortages in the near term. Shortages are prompting public outcry against the US government for its failure to anticipate and redress supply chain vulnerabilities that were well known and warned against. A report in The New York Times tells how Mike Bowen, owner of Texas-based mask-maker Prestige Ameritech, has advised the past three presidents about the danger in the fact that the US imports 95% of its surgical masks. “Aside from sitting in front of the White House and lighting myself on fire, I feel like I’ve done everything I can,” he said. He is currently inundated with emergency orders from US hospitals. The same report tells of a company called Strong Manufacturers in North Carolina that had to cut production of masks because it depends on raw materials from Wuhan, China, where the virus originated.2 The Trump administration will suffer the initial public uproar, but the US government will also seek to reduce import dependency going forward, and it will likely deflect some of the blame by focusing on the supply risks posed by China. Beijing, for its part, is launching a propaganda campaign against the US to distract from its own failures at home (some officials have even blamed the US for the virus). Meanwhile it is cranking up production and shipping medical supplies to crisis hit areas like Italy to try to repair its global image after having given rise to the virus. In addition, the city of Shenzhen is sending 1.2 million N95 masks to the US on the New England Patriots’ team plane. Even Russia is sending small donations. But these moves work to propagandistic efforts in these countries and will ultimately shame the Americans into taking measures to improve self-sufficiency. Bottom Line: The most important supply shortage amid the global pandemic is that of medical equipment. While these shortages will abate sooner rather than later, the supply chain vulnerabilities they have exposed will trigger new policies of supply redundancy and import substitution. The US in particular will seek to reduce dependency on China. That COVID-19 is aggravating rather than reducing tensions between these states, despite China’s role as a key supplier in a time of need, highlights the secular nature of their rising tensions. The US-China Drug War Shortages of pharmaceuticals are also occurring, despite the fact that the primary pandemic response is necessarily “non-pharmaceutical” (e.g. social distancing). The US Food and Drug Administration (FDA) announced the first COVID-19 related drug shortage in the US on February 27. While the specific drug was not disclosed, the announcement notes that “the shortage is due to an issue with manufacturing of an active pharmaceutical ingredient used in the drug.”3 The FDA is monitoring 20 other (non-critical) drugs potentially at risk of shortages because the sole source is China. The global spread of the pandemic will increase these shortages. On March 3 India announced export restrictions on 26 drugs, including paracetamol and several antibiotics, due to supply disruptions caused by the Chinese shutdown. While Chinese economic activity has since picked up, India is now among the string of countries under a nationwide lockdown. Similar measures enforced across Europe will also hamper the production and transportation of these goods. The implication is that even if Chinese drugs return to market, supplies further down the chain and from alternative suppliers will take a hit. The risk that this will evolve into a drug shortage depends on the intensity of the outbreak. Drug companies generally hold 3-6 months’ worth of inventories. Consequently, while inventories are likely to draw as supplies are disrupted, consumers may not experience an outright shortage immediately. In the US, as with equipment and protective gear, the government’s strategic stockpile will buffer against shortfalls in supplies of critical drugs. COVID-19 is aggravating rather than reducing US-China tensions. Nevertheless the supply chain is getting caught up in the larger US-China strategic conflict. Even before the pandemic, the US-China trade war brought attention to the US’s vulnerabilities to China’s drug exports. This dispute is not limited to illicit drugs, as with China’s production of the opioid fentanyl, but also extends to mainstream medicines, as highlighted in the selection of public statements shown in Table 2.
Chart
Chart 9
How much does the US rely on China for medicine? According to FDA data, just over half of manufacturing facilities producing regulated drugs in finished dosage form for the US market are located abroad, with China’s share at 7% (Chart 9).4 The figures are higher for manufacturing facilities producing active pharmaceutical ingredients, though still not alarming – 72% of the facilities are located abroad, with 13% in China. Of course, high-level data understate China’s influence. The complex nature of global drug supply chains means that the source of finished dosage forms masks dependencies and dominance higher up the supply chain (Figure 1).
Chart
For instance, active pharmaceutical ingredients produced in Chinese facilities are used as intermediate goods by finished dosage facilities in India as well as China. The FDA reports that Indian finished dosage facilities rely on China for three-quarters of the active ingredients in their generic drug formulations, which are then exported to the US and the rest of the world. Any supply disruption in China – or any other major drug producer – will lead to shortages further down the supply chain.
Chart 10
Chinese influence becomes more apparent when the sample is restricted to generic prescription drugs. These are especially relevant because nearly 70% of Americans are on at least one prescription drug, of which more than 90% are dispensed in the generic form. In this case, 87% of ingredient manufacturers and 60% of finished dosage manufacturers are located outside the US, with 17% of ingredient facilities and 8% of dosage facilities in China (Chart 10). Of all the facilities that manufacture active ingredients that are listed on the World Health Organization’s Essential Medicines List – a compilation of drugs that are considered critical to the health system – 71% are located aboard with 15% located in China (Chart 11). Moreover, manufacturers are relatively inflexible when adapting to market conditions and shortages. Drug manufacturing facilities generally operate at above 80% of their capacity and are thus left with little immediate capacity to ramp up production in reaction to shortages elsewhere. In addition, manufacturers face challenges in changing ingredient suppliers – there is no centralized source of information on them, and additional FDA approvals are required. The US will look to reduce its dependency on China for its drug supplies regardless of 2020 election outcome. China also has overwhelming dominance in specific categories. The Council on Foreign Relations reports that China makes up 97% of the US antibiotics market.5 Other common drugs that are highly dependent on China for supplies include ibuprofen, acetaminophen, hydrocortisone, penicillin, and heparin (Chart 12).
Chart 11
Chart 12
Taking it all together, US vulnerability can be overstated. Consider the following: Of the 370 drugs on the Essential Medicines List that are marketed in the US, only three are produced solely in China. None of these three are used to treat top ten causes of death in the United States. Import substitution is uneconomical. Foreign companies, especially Chinese companies, are attractive due to their lower costs and lax regulations. While China’s influence extends higher up the supply chain, this is true for US markets as well as other consumer markets. While China can cut off the US from the finished dosages it supplies, it cannot do the same for the ingredients that are used by facilities in other countries and eventually make their way to the US in finished dosage form. Americans are demanding that drug prices be reduced and an obvious solution is looser controls on imports. The recent activation of the Defense Production Act shows that the US can take action to boost domestic production in emergencies. Nevertheless, China is growing conspicuous to the American public due to general trade tensions and COVID-19. As it moves up the value chain, it also threatens increasing competition for the US and its allies. Hence the US government will have a strategic reason to cap China’s influence that is also supported by corporate interests and popular opinion. This will lead to tense trade negotiations with China and meanwhile the US will seek alternative suppliers. China will not want to lose market share or leverage over the United States, so it may offer trade concessions at some point to keep the US engaged. Ultimately, however, strategic tensions will catalyze US policy moves to reduce the cost differential with China and promote its rivals. Pressure on China over its currency, regulatory standards, and scientific-technological acquisition will continue regardless of which party wins the White House in 2020. The Democrats would increase focus on China’s transparency and adherence to international standards, including labor and environmental standards. Both Republicans and Democrats will try to boost trade with allies. The key beneficiaries will be India, Southeast Asia, and the Americas. Taiwan’s importance will grow as a middle-man, but so will its vulnerability to strategic tensions. Bottom Line: The US and the rest of the world are suffering shortfalls of equipment necessary to combat COVID-19. There is also a risk of drug shortages stemming from supply disruptions and emergency protectionist policies. These shortages look to be manageable, but they have exposed national vulnerabilities that will be reduced in future via interventionist trade policies. While the US and Europe will ultimately manage the outbreak, the political fallout will be immense. The US will look to reduce its dependency on China. This will increase investment in non-China producers of active pharmaceutical ingredients, such as India and Mexico. The US tactics against China will vary according to the election result, but the strategic direction of diversifying away from China is clear and will have popular impetus in the wake of COVID-19. Food Security In addition to the challenges posed by COVID-19 on medical supplies, food – another essential good – also faces risk of shortages. China is a case in point. Food prices there were on the rise well before the COVID-19 outbreak, averaging 17.3% in the final quarter of 2019. However inflation was limited to pork and its substitutes – beef, lamb and poultry – and reflected a reduction in pork supplies on the back of the African Swine Flu outbreak. While year-on-year increases in the prices of pork and beef averaged 102.8% and 21.0%, respectively, grain, fresh vegetable, and fresh fruit prices averaged 0.6%, 1.5%, and -5.0% in Q42019 (Chart 13). Chart 13Chinese Inflation Has (Thus far) Been Contained To Pork
Chinese Inflation Has (Thus far) Been Contained To Pork
Chinese Inflation Has (Thus far) Been Contained To Pork
Chart 14China's Misery Index Is Spiking - A Political Liability
China's Misery Index Is Spiking - A Political Liability
China's Misery Index Is Spiking - A Political Liability
However China’s COVID-19 containment measures had a more broad-based impact on food supplies, threatening to push up China’s Misery Index (Chart 14). Travel restrictions, roadblocks, quarantined farm laborers, and risk-averse truck drivers introduced challenges not only in ensuring supplies were delivered to consumers, but also to daily farm activity and planting. The absence of farm inputs needed for planting such as seeds and fertilizer, and animal feed for livestock, was especially damaging in regions hardest hit by the pandemic. Livestock farmers already struggling with swine flu-related reductions in herd sizes were forced to prematurely cull starving animals, cutting the stock of chicken and hogs. Now as the country transitions out of its COVID-19 containment phase and moves toward normalizing activity (Chart 15), food security is top of the mind. Authorities are emphasizing the need to ensure sufficient food supplies and adopt policies to encourage production.6 This is especially important for crops due to be planted in the spring. Delayed or reduced plantings would weight on the quality and quantity of the crops, pushing prices up.
Chart 15
With food estimated to account for 19.9% of China’s CPI basket – 12.8% of which goes towards pork (Chart 16) – a prolonged food shortage, or a full-blown food crisis, would be extremely damaging to Chinese families and their pocketbooks.
Chart 16
However, apart from soybeans and to a lesser extent livestock, China’s inventories are well stocked (Chart 17) and are significantly higher than levels amid the 2006-2008 and 2010-2012 food crises. Inventories have been built up specifically to provide ammunition precisely in times of crisis. Corn and rice stocks are capable of covering consumption for nearly three quarters of a year, and wheat stocks exceeding a year’s worth of consumption. Thus, while not completely immune, China today is better able to weather a supply shock. Moreover, with the exception of soybeans, China is not overly dependent on imports for agricultural supplies (Chart 18).
Chart 17
Chart 18
As the COVID-19 epicenter shifts to the US and Europe, farmers there are beginning to face the same challenges. Reports of delays in the arrival of shipments of inputs such as fertilizer and seeds have prompted American farmers to prepare for the worst and order these goods ahead of time.
Chart 19
While these proactive measures will help reduce risks to supply, farmers in Europe and parts of the US who typically rely on migrant laborers will need to search for alternative laborers as the planting season nears. Just last week France’s agriculture minister asked hairdressers, waiters, florists, and others that find themselves unemployed to take up work in farms to ensure food security. As countries become increasingly aware of the risks to food supplies, some have already introduced protectionist measures, especially in the former Soviet Union: The Russian agriculture ministry proposed setting up a quota for Russian grain exports and has already announced that it is suspending exports of processed grains from March 20 for 10 days. Kazakhstan suspended exports of several agricultural goods including wheat flour and sugar until at least April 15. On March 27, Ukraine’s economy ministry announced that it was monitoring wheat export and would take measures necessary to ensure domestic supplies are adequate. Vietnam temporarily suspended rice contracts until March 28 as it checked if it had sufficient domestic supplies. The challenge is that, unlike China, inventories in the rest of the world are not any higher than during the previous food crisis and do not provide much of a buffer against supply shortfalls (Chart 19). Higher food prices would be especially painful to lower income countries where food makes up a larger share of household spending (Chart 20). In addition to using their strategic food stockpiles, governments will attempt to mitigate the impact of higher food prices by implementing a slew of policies:
Chart 20
Trade policies: Producing countries will want to protect domestic supplies by restricting exports – either through complete bans or export quotas. Importing countries will attempt to reduce the burden of higher prices on consumers by cutting tariffs on the affected goods. Consumer-oriented policies: Importing countries will provide direct support to consumers in the form of food subsidies, social safety nets, tax reductions, and price controls. Producer-oriented policies: Governments will provide support to farmers to encourage greater production using measures such as input subsidies, producer price support, or tax exemptions on goods used in production. While these policies will help alleviate the pressure on consumers, they also result in greater government expenditures and lower revenues. Thus, subsidizing the import bill of a food price shock can weigh on public finances, debt levels, and FX reserves. Currencies already facing pressure due to the recessionary environment, such as Turkey, South Africa and Chile will come under even greater downward pressure. Food inventories ex-China are insufficient to protect against supply shortages. Bottom Line: COVID-19’s logistical disruptions are challenging farm output. This is especially true when transporting goods and individuals across borders rather than within countries. This will be especially challenging for food importing countries, as some producers have already started erecting protectionist measures and this will result in an added burden on government budgets that are already extended in efforts to contain the economic repercussions of the pandemic. Investment Implications Chart 21Ag Prices Inversely Correlated With USD
Ag Prices Inversely Correlated With USD
Ag Prices Inversely Correlated With USD
China will continue trying to maximize its market share and move up the value chain in drug production. At the same time, the US is likely to diversify away from China and try to cap China’s market share. This will result in tense trade negotiations regardless of the outcome of the US election. The COVID-19 experience with medical shortages and newfound public awareness of potential medical supply chain vulnerabilities means that another round of the trade war is likely. Stay long USD-CNY. Regarding agriculture, demand for agricultural commodities is relatively inelastic. This inelasticity should prevent a complete collapse in prices even amid a weak demand environment. Thus given the risk on supplies, prices face upward pressure. However, not all crops are facing these same market dynamics. While wheat and rice prices have started to move in line with the dynamics described above, soybeans and to a greater extent corn prices have not reacted as such (Chart 21). In the case of soybeans, we expect demand to be relatively muted. China accounts for a third of the world’s soybean consumption. 80% of Chinese soybeans are crushed to produce meal to feed China’s massive pork industry. However, the 21% y/y decline in pork output in 2019 on the back of the African Swine Flu outbreak will weigh on demand and mute upward pressures on supplies. Demand for corn will also likely come in weak. The COVID-19 containment measures and the resulting halt in economic activity reduce demand for gasoline and, as a consequence, reduce demand for corn-based ethanol, which is blended with gasoline. In addition to the above fundamentals, ag prices have been weighed down by a strong USD which makes ex-US exporters relatively better off, incentivizing them to raise exports and increase global supplies. A weaker USD – which we do not see in the near term – would help support ag prices. It is worth noting that if there is broad enforcement of protectionist measures, then producers will not be able to benefit from a stronger dollar. In that case we may witness a breakdown in the relationship between ag prices and the dollar. In light of these supply/demand dynamics, we expect rice and wheat prices to be well supported going forward and to outperform corn and soybeans. Roukaya Ibrahim Editor/Strategist Geopolitical Strategy RoukayaI@bcaresearch.com Matt Gertken Vice President Geopolitical Strategist mattg@bcaresearch.com Footnotes 1 See "Tackling COVID-19 Together: The Trade Policy Dimension," Global Trade Alert, University of St. Gallen, Switzerland, March 23, 2020. 2 See Rachel Abrams et al, "Governments and Companies Race to Make Masks Vital to Virus Fight," The New York Times, March 21, 2020. 3 The announcement also notes that there are other alternatives that can be used by patients. See "Coronavirus (COVID-19) Supply Chain Update," US FDA, February 27, 2020. 4 All regulated drugs include prescription (brand and generic), over the counter, and compounded drugs. 5 Please see Huang, Yanzhong, "The Coronavirus Outbreak Could Disrupt The US Drug Supply," Council on Foreign Relations, March 5, 2020. 6 The central government ordered local authorities to allow animal feed to pass through checkpoints amid the lockdowns. In addition, Beijing has relaxed import restrictions by lifting a ban on US poultry products and announcing that importers could apply for waivers on goods tariffed during the trade war such as pork and soybeans. The lifting of these restrictions also serves to help China meet its phase one trade deal commitments. Please see "Coronavirus hits China’s farms and food supply chain, with further spike in meat prices ahead," South China Morning Post, dated February 21, 2020.
Avoid REITs At All Costs
Avoid REITs At All Costs
We continue to recommend investors avoid the S&P real estate sector. For investors seeking defensive protection we would recommend hiding in the S&P health care sector instead, as we highlighted in our mid-March report.1 The chart on the right shows a disturbing breakdown in the inverse correlation between the relative share price ratio and the 10-year Treasury yield. While it makes intuitive sense that this fixed income proxy sector (i.e. high dividend yielding) should move in the opposite direction of the competing risk-free yielding asset, at times of tumult this correlation reverts to positive (top panel) as the sector looses its attractiveness thanks to the very illiquid assets that dominate REITs’ holdings. Commercial real estate prices also remain extended and vulnerable to a deflationary shock (bottom panel). Currently there is no real price discovery as no landlord would dare put any properties for sale in this market starved for liquidity. With the exception of distressed sales, we deem that the “mark to model” mantra will make a comeback, eerily reminiscent of the GFC. Bottom Line: Shy away from the S&P real estate sector. The ticker symbols for the stocks in this index are: BLBG: S5RLST – CCI, AMT, PLD, EQIX, DLR, PSA, SBAC, AVB, EQR, FRT, SPG, WELL, ARE, CBRE, O, BXP, ESS, EXR, DRE, PEAK, HST, MAA, UDR, VTR, WY, AIV, IRM, PEG, VNO, SLG. For more details please refer to this Monday’s Weekly Report. 1 Please see BCA US Equity Strategy Weekly Report, “Inflection Point” dated March 16, 2020, available at uses.bcaresearch.com
Making predictions about the economic and market outlook seems a futile exercise in the midst of such massive uncertainty. The deluge of articles about COVID-19 merely serves to highlight that nobody really knows how things will play out in the year ahead. Much depends on whether an effective vaccine or treatment becomes available within a reasonable timescale and that remains an open question. Social and economic disruption will continue to intensify until the spread of the virus starts to abate. One thing is certain. Economic activity around the world faces its biggest contraction in modern times. Declines in second quarter GDP will be mind-numbingly bad in a wide range of countries, especially those that have instituted lockdowns and the closure of non-essential businesses. According to the OECD, the median economy faces an initial output decline of around 25% as a result of shutdowns and restrictions.1 Chart 1A Meltdown In Economic Activity
A Meltdown In Economic Activity
A Meltdown In Economic Activity
Estimates for the drop in US real GDP in the second quarter range as high as 50% at an annual rate. To put this into perspective, the peak-to-trough decline in US real GDP in the 2007-09 recession was a mere 4% over six quarters, and that felt catastrophic at the time. The New York Fed’s weekly economic index2 has already fallen to the lows of 2008 and worse is still to come (Chart 1). Could things be as bad as the 1930s Great Depression when US real GDP contracted by 25% over a three-year period? That would require an extreme apocalyptic view about the progression of the virus and does not bear thinking about. I am not that gloomy. Policymakers are acting aggressively to limit the economic damage. Central banks are flooding the system with liquidity and the cost of money is negligible. Meanwhile, fiscal caution has been thrown to the wind with massive government stimulus in many countries. While this will not prevent a deep recession, it will minimize the downside risks and support the eventual rebound. Markets are understandably in a deep funk because it is hard to price unknown risks. If this is no more than a two-quarter economic downturn followed by a sharp recovery, then a good buying opportunity in risk assets is in place given that monetary policy will stay hyper accommodative for a considerable time. If the downturn lingers much longer than that, then equities remain at risk. While loath to make a prediction, I am uncharacteristically tending to the more optimistic side. Let’s make the heroic assumption that we are not in an end of days scenario and that this crisis will pass at some point in the next year- hopefully sooner than later. What are some of the longer-run implications? A few come to mind. The backlash against globalization will gather impetus. Public sector debt will rise to unimaginable peacetime levels. Meanwhile, the crisis puts the final nail in the coffin of the private sector Debt Supercycle. Monetary policy will err on the side of ease for a very long time. The way that companies and other institutions have been forced to adapt to the crisis could trigger lasting changes in how they operate. Globalization In Full Retreat Chart 2A Retreat From Globalization
A Retreat From Globalization
A Retreat From Globalization
The peak of globalization has been a central part of the BCA view for several years.3 Long before the current crisis, it was clear that anti-globalization forces were gathering strength, illustrated by increased trade barriers, a backlash against inward migration in many countries, and reduced flows of foreign direct investment (Chart 2). The Trump Administration’s imposition of tariffs and the Brexit vote were two of the more obvious examples of the change in attitudes. The supply-chain interruptions caused by factory shutdowns in China will reinforce the view that shifting production to cheaper-cost countries overseas went too far. At a minimum, it seems inevitable that many companies will seek to reduce their reliance on a single producer for critical components. On the medical front, one striking fact to emerge was that China supplies around 80% of US antibiotics. There will be massive pressure to develop greater homegrown supplies of medical supplies and other products deemed critical for economic and national security. The crisis also has led to a breakdown of the Schengen Area of open borders within the European Union (EU). Many member countries have reinstituted border controls and it is unclear when these might be removed. The free movement of people is a core principle of the EU. Meanwhile, the Maastricht Treaty rules on fiscal discipline, a key element of economic union, have been thrown out of the window. Even Germany has bowed to the pressure of relaxing fiscal constraints. Finally, a worsening situation for the already troubled Italian banking system will threaten EU financial stability. Overall, the crisis will leave a huge question mark over the long-term viability of the EU. Globalization was a major force behind disinflation as production shifted to low-cost producers. A reversal of this trend will thus be inflationary, at the margin. For many, this will be a price worth paying if it means increased job security and reduced vulnerability of supply chains. But the shift away from globalization will not be the only trend that threatens an eventual resurgence of inflation. The Explosion In Government Debt: Last Gasp Of The Debt Supercycle BCA introduced the concept of the Debt Supercycle more than 40 years ago to describe the actions of policymakers to pump up demand rather than allow financial imbalances to be fully unwound during economic downturns. This inevitably meant that each new cycle began with a higher level of financial imbalances. As indebtedness rose, the economic costs of a financial cleansing increased, requiring ever-more desperate policy measures to shore things up. Unfortunately, such actions merely created the conditions for greater excesses and imbalances down the road. For example, the Federal Reserve’s aggressive response to the bursting of the tech bubble in 2000 helped set the scene for the even bigger housing bubble later in the decade. In that sense, the Debt Supercycle was a self-reinforcing trap that was bound to end badly, and that occurred in 2007. Chart 3The US Household Love Affair With Debt Died A Decade Ago
The US Household Love Affair With Debt Died A Decade Ago
The US Household Love Affair With Debt Died A Decade Ago
Our discussion of the US Debt Supercycle was focused largely on the private sector because that is where rising imbalances posed the greatest threat to economic and financial stability. Rising public sector imbalances were less of a concern because governments do not finance themselves through the banking sector. Moreover, unlike the private sector, taxes can always be raised to boost revenues or, in extremis, the authorities can resort to the printing press. At the end of 2014, we wrote that the Debt Supercycle was dead. By that, we meant that easing policy would no longer be able to encourage a new cycle of leverage-financed private-sector spending. The downturn of 2007-09 was a turning point in attitudes toward debt, much in the way that those who lived through the Great Depression were financially conservative for the rest of their lives. Our view has been vindicated by the fact the ratio of household debt to income has decisively broken its pre-housing bubble uptrend and has failed to revive in the face of record-low interest rates (Chart 3). Corporate borrowing has been strong, but largely to finance stock buybacks and M&A activity. Capital spending has been disappointing this cycle, despite strong profits and margins. The current deep downturn will add a further nail in the coffin of the private sector Debt Supercycle. The shock of the recession and destruction of wealth will leave a legacy of increased financial caution with households wanting to build precautionary savings and companies striving to repair damaged balance sheets. It would not be a surprise to see the US personal saving rate head back to the double-digit levels of the early 1980s. While the private sector embraces greater financial conservatism, we are witnessing the start of an extraordinary surge in public sector deficits and debt from already high levels. Chart 4A Bad Starting Point For A Surge In The Federal Deficit
A Bad Starting Point For A Surge In The Federal Deficit
A Bad Starting Point For A Surge In The Federal Deficit
Budget deficits automatically rise during recessions because tax receipts drop and spending on unemployment and welfare programs goes up (Chart 4). In the past, the starting point for deficits generally was low before a recession took hold. This time, the federal deficit has breached 5% of GDP when the economy was doing fine. With the current recession set to be deeper than in 2007-09 and fiscal stimulus likely to end up much more than the initial $2 trillion package, the deficit will far exceed the previous post-WWII peak of almost 10% of GDP, reached in fiscal 2009. The ratio of federal debt to GDP will soar past 100% within the next few years, exceeding the peak reached in WWII. A speedy decline in WWII debt burdens was helped by a sharp rebound in economic activity, supported by a powerful combination of demographics (the post-WWII baby boom) and pent-up demand. Real GDP grew at an average annualized pace of 4.3% in both the 1950s and 1960s. Unfortunately, slower population growth means that growth in the next one and two decades will be less than half that pace. At the same time, the federal deficit will be under upward pressure because of the impact of an aging population on healthcare and social security. In other words, restoring order to fiscal finances through normal measures (growth and/or austerity) will be an impossible task. High levels of government debt are perfectly manageable when private sector savings are plentiful, interest rates are negligible, and investors seek the safety of low-risk bonds. Thus, $1 trillion US federal deficits have not prevented Treasury yields from falling to all-time lows. However, such conditions will not last indefinitely. The timing of when bloated budget deficits start to impact markets and thus the economy will partly depend on the actions of the Fed. Monetary Policy: Is There A Limit To What It Can Do? Gone are the days when monetary policy was a rather technical exercise: tweaking the level of interest rates to ensure that money and credit trends delivered the economic growth consistent with low and stable inflation. In the past decade, the old rule book has been discarded with policymakers forced to take ever-more extreme measures to prevent total collapse of the economic and financial system. The 2007-9 downturn was easier to deal with than the current crisis. The primary problem a decade ago was a financial rather than economic seizure. While policymakers had to be creative, the main task was to shore up systemically important financial institutions and inject enough liquidity into the system to restore normal market functioning. And it worked. This time, the issue is an economic not financial seizure and associated liquidity strains are a symptom, not the primary problem. The immediate role of central banks is again to ensure that the financial system continues to function by injecting whatever amounts of liquidity are necessary. But monetary policy cannot directly bail out all the businesses that face bankruptcy or help those that have lost their jobs. That is the role of fiscal policy. What central banks can do is print money to finance the rise in budget deficits. During WWII, the Fed had an agreement with the Treasury Department to peg the level of long-term yields below 2.5% and this arrangement persisted until 1951, long after the war ended. This ensured that a post-war rebound in private credit demand would not cause a spike in interest rates that might short-circuit the recovery. We could well see a similar arrangement in the coming years, though it might be an informal rather than publicized agreement. The key point is that the Fed will be massively biased toward easy policy for many years. The current generation of central bankers have experienced periodic threats of deflation rather than inflation during the past 20 years and that will shape how they perceive the balance of risks going forward. After the Great Depression of the 1930s, fears of deflation lingered well into the 1950s and policymakers’ resulting complacency toward inflation led to the inflation spike of the 1970s. We are at a similar point again. The Fed will remain a massive buyer of Treasury bonds, even as the economy recovers because it will not want to risk higher yields undermining growth. Even if inflation starts to rise, the Fed will justify a continued easy stance on the grounds that inflation has fallen far short of its 2% target for many years. Given the combination of a global blowout in central bank balance sheets and the retreat from globalization, the scene will be set for inflation to surprise on the upside. But this may not occur for several years because the recession will create a lot of spare capacity and deflation is a greater near-term threat than inflation. We have long argued that a sustained upturn in inflation would be preceded by a final bout of deflation. The revival of inflation may be gradual but its insidious nature ultimately will make it more dangerous. It seems inevitable that there will have to be monetization of public sector debt, not only in the US but in other major economies. Once investor confidence returns, the demand for government bonds will recede and yields will be under upward pressure. Financial repression may help contain the rise, but that cannot be a long-term solution. In the end, central banks will be the bond buyers of last resort and ultimately it will have to be written off via making the debt effectively non-maturing. If the economic picture continues to deteriorate could central banks use quantitative easing to start buying assets such as equities and real estate? Current legislation prevents such purchases in the case of the Fed and European Central Bank. Of course, legislation can always be changed but the Fed would be reluctant for Congress to change the Federal Reserve Act. That could open a can of worms including amendments such as requiring regular audits of policy decisions and altering how regional presidents are chosen. But it will not be the Fed’s decision and if things get bad enough then nothing should be ruled out. An Accelerated Move To Virtual Activity? The restrictions on travel and public meetings and the closure of many businesses have forced companies to embrace online ways of conducting operations. And the same applies to schools and universities. In many cases, companies may find that virtual meetings between far-flung offices work rather well. This could cause a major rethink about future spending on business travel. Replacing travel with virtual meetings not only saves on airfares but also frees up employee time and reduces stress. And the improvements in communication technology make virtual meetings almost as good as the real thing. Of course, this is not a great story for airlines. The same arguments can be made for education but are slightly less compelling because of the social dimension. Mixing with friends and peers is one of the big attractions for students and most would be loath to give this up. And for working parents, it is not feasible to have children stuck at home. Nonetheless, at the post-secondary level, there could be a move to more online teaching. Another consequence of the current crisis has been a forced shift to more online shopping. This trend was already well established but is now likely to accelerate. Those retailers who fail to adapt will fall by the wayside. Market Implications As noted at the outset, it is hard to make predictions without knowing how the virus will progress. But we know a few things. First, there is not much scope for bond yields to fall from current levels. Second, equity valuations have improved as a result of the collapse in prices. Third, monetary policy will remain supportive of markets for a long time. On this basis, it is easy to conclude that stocks should beat bonds handsomely over the medium and long term. The short-term picture is cloudier. If the recession is short-lived and economic activity rebounds strongly, then we currently have a good buying opportunity for stocks. But there is no way to make a prediction about this with any conviction. The case for a strong recovery is that policy is massively stimulative and there will be a lot of pent-up demand. The case for a slow and drawn-out recovery is that consumers and businesses will be left with greatly weakened balance sheets and the loss of small businesses and associated jobs could be a lasting problem. A final issue is that fears of another virus wave could weigh on consumer and business confidence. Initially, there will be some extremely strong quarters of growth but beyond that, the odds favor a drawn-out recovery rather than a vigorous one. Faced with such uncertainty, one strategy is to rely on technical indicators rather than economic forecasts as a judge of whether it is safe to rebuild positions in risk assets. This gives some reason for encouragement as measures of sentiment are at depressed extremes, typically seen only at major bottoms. And this is supported by momentum indicators at oversold extremes. However, a word of caution: these indicators make the case for a near-term bounce but say nothing about the durability of any rally. For some time, non-US markets have looked more appealing than Wall Street from a valuation perspective. That remains the case, but there is an important caveat. Thus far, the virus has been more of a problem for the developed countries than emerging ones (China and Iran excepted). It remains to be seen whether Africa, and Latin America and other countries in Asia and the Middle East can avoid a catastrophic spread of the virus. It could potentially be disastrous given the poor infrastructure and lack of government resources in those regions. Moreover, a shift away from globalization is not bullish for the emerging world. Some positions in gold are a good hedge given current uncertainties and the fact that inflation fears will rise long before actual inflation picks up. In normal circumstances, the extraordinary rise in the US budget deficit would be bearish for the US dollar. But other countries are following the same path so in relative terms, the US is no worse off. And there is still no serious competition to the dollar as the global reserve currency. Thus, while the dollar might weaken somewhat, it should not be a major source of risk to US assets. In closing, it is impossible to provide the certainty and high-conviction predictions that investors crave. That makes it rash to make aggressive bets on how things will play out in the economy and markets. At BCA, we favor equities over bonds but advise continued near-term caution. The bottoming process in equities could be volatile and drawn-out. Building positions gradually seems the most sensible strategy. Martin H. Barnes, Senior Vice President Chief Economist mbarnes@bcaresearch.com Footnotes 1 For an estimate of the virus impact on a range of economies, please see the recent OECD report “Evaluating the initial impact of COVID-19 containment measures on economic activity”. Available at: www.oecd.org 2 The report and underlying data are available at www.newyorkfed.org. 3 For example, the retreat from globalization was discussed in our 2015 Outlook report published at the end of 2014.
Dear Client, This week’s report is written by BCA’s chief economist, Martin Barnes. Martin explores the myriad ways the pandemic could influence long-term economic and financial trends. I trust you will find his report very insightful. Best regards, Peter Berezin, Chief Global Strategist Making predictions about the economic and market outlook seems a futile exercise in the midst of such massive uncertainty. The deluge of articles about COVID-19 merely serves to highlight that nobody really knows how things will play out in the year ahead. Much depends on whether an effective vaccine or treatment becomes available within a reasonable timescale and that remains an open question. Social and economic disruption will continue to intensify until the spread of the virus starts to abate. One thing is certain. Economic activity around the world faces its biggest contraction in modern times. Declines in second quarter GDP will be mind-numbingly bad in a wide range of countries, especially those that have instituted lockdowns and the closure of non-essential businesses. According to the OECD, the median economy faces an initial output decline of around 25% as a result of shutdowns and restrictions.1 Chart 1A Meltdown In Economic Activity
A Meltdown In Economic Activity
A Meltdown In Economic Activity
Estimates for the drop in US real GDP in the second quarter range as high as 50% at an annual rate. To put this into perspective, the peak-to-trough decline in US real GDP in the 2007-09 recession was a mere 4% over six quarters, and that felt catastrophic at the time. The New York Fed’s weekly economic index2 has already fallen to the lows of 2008 and worse is still to come (Chart 1). Could things be as bad as the 1930s Great Depression when US real GDP contracted by 25% over a three-year period? That would require an extreme apocalyptic view about the progression of the virus and does not bear thinking about. I am not that gloomy. Policymakers are acting aggressively to limit the economic damage. Central banks are flooding the system with liquidity and the cost of money is negligible. Meanwhile, fiscal caution has been thrown to the wind with massive government stimulus in many countries. While this will not prevent a deep recession, it will minimize the downside risks and support the eventual rebound. Markets are understandably in a deep funk because it is hard to price unknown risks. If this is no more than a two-quarter economic downturn followed by a sharp recovery, then a good buying opportunity in risk assets is in place given that monetary policy will stay hyper accommodative for a considerable time. If the downturn lingers much longer than that, then equities remain at risk. While loath to make a prediction, I am uncharacteristically tending to the more optimistic side. Let’s make the heroic assumption that we are not in an end of days scenario and that this crisis will pass at some point in the next year- hopefully sooner than later. What are some of the longer-run implications? A few come to mind. The backlash against globalization will gather impetus. Public sector debt will rise to unimaginable peacetime levels. Meanwhile, the crisis puts the final nail in the coffin of the private sector Debt Supercycle. Monetary policy will err on the side of ease for a very long time. The way that companies and other institutions have been forced to adapt to the crisis could trigger lasting changes in how they operate. Globalization In Full Retreat Chart 2A Retreat From Globalization
A Retreat From Globalization
A Retreat From Globalization
The peak of globalization has been a central part of the BCA view for several years.3 Long before the current crisis, it was clear that anti-globalization forces were gathering strength, illustrated by increased trade barriers, a backlash against inward migration in many countries, and reduced flows of foreign direct investment (Chart 2). The Trump Administration’s imposition of tariffs and the Brexit vote were two of the more obvious examples of the change in attitudes. The supply-chain interruptions caused by factory shutdowns in China will reinforce the view that shifting production to cheaper-cost countries overseas went too far. At a minimum, it seems inevitable that many companies will seek to reduce their reliance on a single producer for critical components. On the medical front, one striking fact to emerge was that China supplies around 80% of US antibiotics. There will be massive pressure to develop greater homegrown supplies of medical supplies and other products deemed critical for economic and national security. The crisis also has led to a breakdown of the Schengen Area of open borders within the European Union (EU). Many member countries have reinstituted border controls and it is unclear when these might be removed. The free movement of people is a core principle of the EU. Meanwhile, the Maastricht Treaty rules on fiscal discipline, a key element of economic union, have been thrown out of the window. Even Germany has bowed to the pressure of relaxing fiscal constraints. Finally, a worsening situation for the already troubled Italian banking system will threaten EU financial stability. Overall, the crisis will leave a huge question mark over the long-term viability of the EU. Globalization was a major force behind disinflation as production shifted to low-cost producers. A reversal of this trend will thus be inflationary, at the margin. For many, this will be a price worth paying if it means increased job security and reduced vulnerability of supply chains. But the shift away from globalization will not be the only trend that threatens an eventual resurgence of inflation. The Explosion In Government Debt: Last Gasp Of The Debt Supercycle BCA introduced the concept of the Debt Supercycle more than 40 years ago to describe the actions of policymakers to pump up demand rather than allow financial imbalances to be fully unwound during economic downturns. This inevitably meant that each new cycle began with a higher level of financial imbalances. As indebtedness rose, the economic costs of a financial cleansing increased, requiring ever-more desperate policy measures to shore things up. Unfortunately, such actions merely created the conditions for greater excesses and imbalances down the road. For example, the Federal Reserve’s aggressive response to the bursting of the tech bubble in 2000 helped set the scene for the even bigger housing bubble later in the decade. In that sense, the Debt Supercycle was a self-reinforcing trap that was bound to end badly, and that occurred in 2007. Chart 3The US Household Love Affair With Debt Died A Decade Ago
The US Household Love Affair With Debt Died A Decade Ago
The US Household Love Affair With Debt Died A Decade Ago
Our discussion of the US Debt Supercycle was focused largely on the private sector because that is where rising imbalances posed the greatest threat to economic and financial stability. Rising public sector imbalances were less of a concern because governments do not finance themselves through the banking sector. Moreover, unlike the private sector, taxes can always be raised to boost revenues or, in extremis, the authorities can resort to the printing press. At the end of 2014, we wrote that the Debt Supercycle was dead. By that, we meant that easing policy would no longer be able to encourage a new cycle of leverage-financed private-sector spending. The downturn of 2007-09 was a turning point in attitudes toward debt, much in the way that those who lived through the Great Depression were financially conservative for the rest of their lives. Our view has been vindicated by the fact the ratio of household debt to income has decisively broken its pre-housing bubble uptrend and has failed to revive in the face of record-low interest rates (Chart 3). Corporate borrowing has been strong, but largely to finance stock buybacks and M&A activity. Capital spending has been disappointing this cycle, despite strong profits and margins. The current deep downturn will add a further nail in the coffin of the private sector Debt Supercycle. The shock of the recession and destruction of wealth will leave a legacy of increased financial caution with households wanting to build precautionary savings and companies striving to repair damaged balance sheets. It would not be a surprise to see the US personal saving rate head back to the double-digit levels of the early 1980s. While the private sector embraces greater financial conservatism, we are witnessing the start of an extraordinary surge in public sector deficits and debt from already high levels. Chart 4A Bad Starting Point For A Surge In The Federal Deficit
A Bad Starting Point For A Surge In The Federal Deficit
A Bad Starting Point For A Surge In The Federal Deficit
Budget deficits automatically rise during recessions because tax receipts drop and spending on unemployment and welfare programs goes up (Chart 4). In the past, the starting point for deficits generally was low before a recession took hold. This time, the federal deficit has breached 5% of GDP when the economy was doing fine. With the current recession set to be deeper than in 2007-09 and fiscal stimulus likely to end up much more than the initial $2 trillion package, the deficit will far exceed the previous post-WWII peak of almost 10% of GDP, reached in fiscal 2009. The ratio of federal debt to GDP will soar past 100% within the next few years, exceeding the peak reached in WWII. A speedy decline in WWII debt burdens was helped by a sharp rebound in economic activity, supported by a powerful combination of demographics (the post-WWII baby boom) and pent-up demand. Real GDP grew at an average annualized pace of 4.3% in both the 1950s and 1960s. Unfortunately, slower population growth means that growth in the next one and two decades will be less than half that pace. At the same time, the federal deficit will be under upward pressure because of the impact of an aging population on healthcare and social security. In other words, restoring order to fiscal finances through normal measures (growth and/or austerity) will be an impossible task. High levels of government debt are perfectly manageable when private sector savings are plentiful, interest rates are negligible, and investors seek the safety of low-risk bonds. Thus, $1 trillion US federal deficits have not prevented Treasury yields from falling to all-time lows. However, such conditions will not last indefinitely. The timing of when bloated budget deficits start to impact markets and thus the economy will partly depend on the actions of the Fed. Monetary Policy: Is There A Limit To What It Can Do? Gone are the days when monetary policy was a rather technical exercise: tweaking the level of interest rates to ensure that money and credit trends delivered the economic growth consistent with low and stable inflation. In the past decade, the old rule book has been discarded with policymakers forced to take ever-more extreme measures to prevent total collapse of the economic and financial system. The 2007-9 downturn was easier to deal with than the current crisis. The primary problem a decade ago was a financial rather than economic seizure. While policymakers had to be creative, the main task was to shore up systemically important financial institutions and inject enough liquidity into the system to restore normal market functioning. And it worked. This time, the issue is an economic not financial seizure and associated liquidity strains are a symptom, not the primary problem. The immediate role of central banks is again to ensure that the financial system continues to function by injecting whatever amounts of liquidity are necessary. But monetary policy cannot directly bail out all the businesses that face bankruptcy or help those that have lost their jobs. That is the role of fiscal policy. What central banks can do is print money to finance the rise in budget deficits. During WWII, the Fed had an agreement with the Treasury Department to peg the level of long-term yields below 2.5% and this arrangement persisted until 1951, long after the war ended. This ensured that a post-war rebound in private credit demand would not cause a spike in interest rates that might short-circuit the recovery. We could well see a similar arrangement in the coming years, though it might be an informal rather than publicized agreement. The key point is that the Fed will be massively biased toward easy policy for many years. The current generation of central bankers have experienced periodic threats of deflation rather than inflation during the past 20 years and that will shape how they perceive the balance of risks going forward. After the Great Depression of the 1930s, fears of deflation lingered well into the 1950s and policymakers’ resulting complacency toward inflation led to the inflation spike of the 1970s. We are at a similar point again. The Fed will remain a massive buyer of Treasury bonds, even as the economy recovers because it will not want to risk higher yields undermining growth. Even if inflation starts to rise, the Fed will justify a continued easy stance on the grounds that inflation has fallen far short of its 2% target for many years. Given the combination of a global blowout in central bank balance sheets and the retreat from globalization, the scene will be set for inflation to surprise on the upside. But this may not occur for several years because the recession will create a lot of spare capacity and deflation is a greater near-term threat than inflation. We have long argued that a sustained upturn in inflation would be preceded by a final bout of deflation. The revival of inflation may be gradual but its insidious nature ultimately will make it more dangerous. It seems inevitable that there will have to be monetization of public sector debt, not only in the US but in other major economies. Once investor confidence returns, the demand for government bonds will recede and yields will be under upward pressure. Financial repression may help contain the rise, but that cannot be a long-term solution. In the end, central banks will be the bond buyers of last resort and ultimately it will have to be written off via making the debt effectively non-maturing. If the economic picture continues to deteriorate could central banks use quantitative easing to start buying assets such as equities and real estate? Current legislation prevents such purchases in the case of the Fed and European Central Bank. Of course, legislation can always be changed but the Fed would be reluctant for Congress to change the Federal Reserve Act. That could open a can of worms including amendments such as requiring regular audits of policy decisions and altering how regional presidents are chosen. But it will not be the Fed’s decision and if things get bad enough then nothing should be ruled out. An Accelerated Move To Virtual Activity? The restrictions on travel and public meetings and the closure of many businesses have forced companies to embrace online ways of conducting operations. And the same applies to schools and universities. In many cases, companies may find that virtual meetings between far-flung offices work rather well. This could cause a major rethink about future spending on business travel. Replacing travel with virtual meetings not only saves on airfares but also frees up employee time and reduces stress. And the improvements in communication technology make virtual meetings almost as good as the real thing. Of course, this is not a great story for airlines. The same arguments can be made for education but are slightly less compelling because of the social dimension. Mixing with friends and peers is one of the big attractions for students and most would be loath to give this up. And for working parents, it is not feasible to have children stuck at home. Nonetheless, at the post-secondary level, there could be a move to more online teaching. Another consequence of the current crisis has been a forced shift to more online shopping. This trend was already well established but is now likely to accelerate. Those retailers who fail to adapt will fall by the wayside. Market Implications As noted at the outset, it is hard to make predictions without knowing how the virus will progress. But we know a few things. First, there is not much scope for bond yields to fall from current levels. Second, equity valuations have improved as a result of the collapse in prices. Third, monetary policy will remain supportive of markets for a long time. On this basis, it is easy to conclude that stocks should beat bonds handsomely over the medium and long term. The short-term picture is cloudier. If the recession is short-lived and economic activity rebounds strongly, then we currently have a good buying opportunity for stocks. But there is no way to make a prediction about this with any conviction. The case for a strong recovery is that policy is massively stimulative and there will be a lot of pent-up demand. The case for a slow and drawn-out recovery is that consumers and businesses will be left with greatly weakened balance sheets and the loss of small businesses and associated jobs could be a lasting problem. A final issue is that fears of another virus wave could weigh on consumer and business confidence. Initially, there will be some extremely strong quarters of growth but beyond that, the odds favor a drawn-out recovery rather than a vigorous one. Faced with such uncertainty, one strategy is to rely on technical indicators rather than economic forecasts as a judge of whether it is safe to rebuild positions in risk assets. This gives some reason for encouragement as measures of sentiment are at depressed extremes, typically seen only at major bottoms. And this is supported by momentum indicators at oversold extremes. However, a word of caution: these indicators make the case for a near-term bounce but say nothing about the durability of any rally. For some time, non-US markets have looked more appealing than Wall Street from a valuation perspective. That remains the case, but there is an important caveat. Thus far, the virus has been more of a problem for the developed countries than emerging ones (China and Iran excepted). It remains to be seen whether Africa, and Latin America and other countries in Asia and the Middle East can avoid a catastrophic spread of the virus. It could potentially be disastrous given the poor infrastructure and lack of government resources in those regions. Moreover, a shift away from globalization is not bullish for the emerging world. Some positions in gold are a good hedge given current uncertainties and the fact that inflation fears will rise long before actual inflation picks up. In normal circumstances, the extraordinary rise in the US budget deficit would be bearish for the US dollar. But other countries are following the same path so in relative terms, the US is no worse off. And there is still no serious competition to the dollar as the global reserve currency. Thus, while the dollar might weaken somewhat, it should not be a major source of risk to US assets. In closing, it is impossible to provide the certainty and high-conviction predictions that investors crave. That makes it rash to make aggressive bets on how things will play out in the economy and markets. At BCA, we favor equities over bonds but advise continued near-term caution. The bottoming process in equities could be volatile and drawn-out. Building positions gradually seems the most sensible strategy. Martin H. Barnes, Senior Vice President Chief Economist mbarnes@bcaresearch.com Footnotes 1 For an estimate of the virus impact on a range of economies, please see the recent OECD report “Evaluating the initial impact of COVID-19 containment measures on economic activity”. Available at: www.oecd.org 2 The report and underlying data are available at www.newyorkfed.org. 3 For example, the retreat from globalization was discussed in our 2015 Outlook report published at the end of 2014.
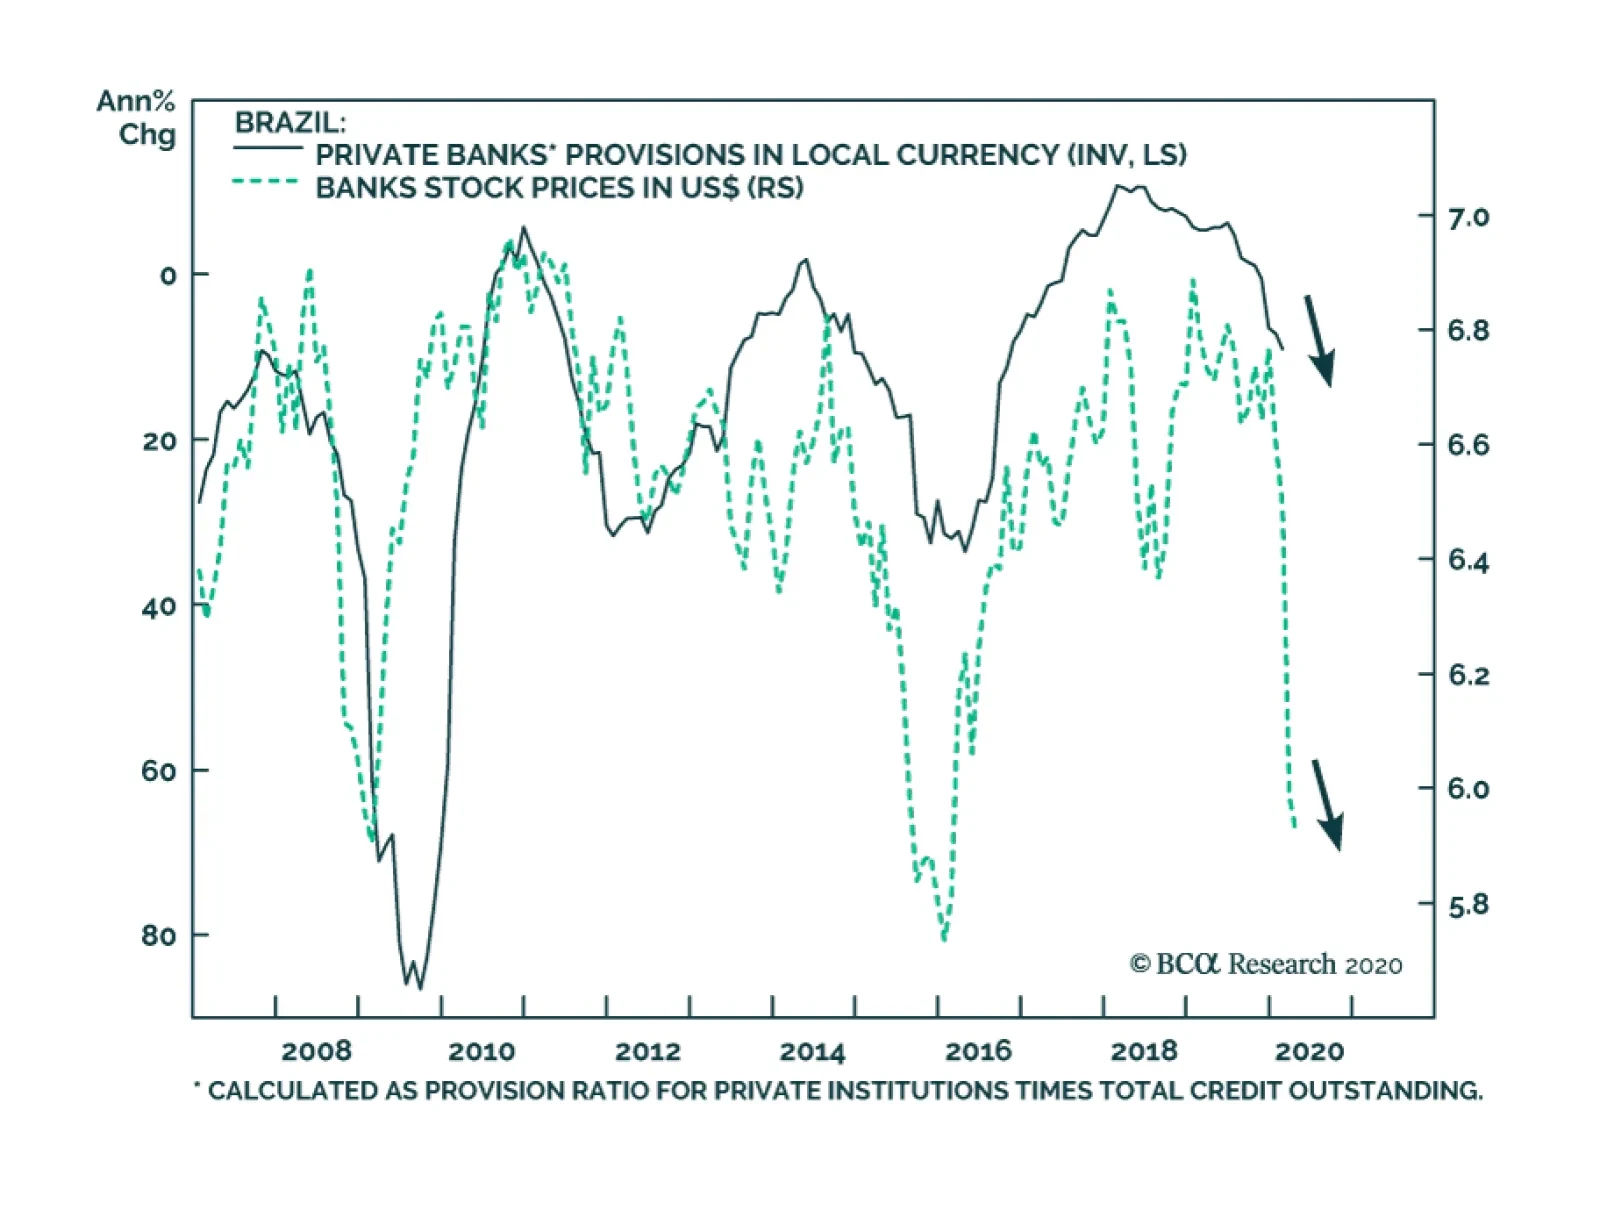
On Tuesday, BCA Research's Emerging Markets Strategy service concluded that the cyclical outlook for Brazilian bank stocks has worsened further due to the COVID-19 pandemic, despite the fact that valuations have improved. Brazilian banks have plunged 55% in…
Favor Defensive Tech
Favor Defensive Tech
In our latest Weekly Report we boosted the S&P data processing index to overweight from previously underweight. Data processing stocks are a services-based defensive tech index that typically thrive in deflationary and recessionary environments, according to empirical evidence (see chart). We are currently in recession, thus a deflationary impulse will grip the economy and investors will flock to defensive tech stocks when growth is scarce. Tack on the spike in the greenback, and the disinflationary backdrop further boosts the allure of these tech services stocks (third panel). Beyond the recessionary related tailwinds, data processing stocks should also enjoy firming relative demand. While the two bellwether stocks, V and MA, will suffer from the decrease in consumption that requires physical visits and from select services outlays that are severely affected by the coronavirus, online spending by households and corporations should at least serve as a partial offset. Bottom Line: We recently lifted the S&P data processing index to overweight from previously underweight. The ticker symbols for the stocks in this index are: BLBG: S5DPOS – ADP, V, MA, PYPL, FIS, FISV, GPN, PAYX, FLT, BR, JKHY, WU, ADS.
Highlights Recommended Allocation
Quarterly Portfolio Outlook: Playing The Optionality
Quarterly Portfolio Outlook: Playing The Optionality
The outlook for markets over the next few months is highly uncertain. On the optimistic side, new COVID-19 cases are probably close to peaking (for now), and so equities could continue to rally. But there are many risks too. Growth numbers will be horrendous for some months. Second-round effects (corporate defaults, problems in EM and with euro zone banks, for example) will emerge. We recommend a balanced portfolio, robust both for risk-on rallies and a further sell-off. We stay overweight equities versus bonds. Government bonds will not provide significantly positive returns even in a severe recession. Thus, over the next 12-months, equities are likely to outperform them. But we leaven the equity overweight with a “minimum volatility” strategy, overweight the low-beta US market, and more stable sectors such as Healthcare and Technology. Within bonds, we stay underweight government bonds, and raise Investment Grade credit to overweight, given the Fed’s backstop. Even in a risk-on rally, government yields will not rise quickly so we recommend a neutral stance on duration. The massive stimulus will eventually be inflationary, so we recommend TIPS, which are very cheaply valued. We are overweight cash and gold as hedges against further market turbulence. Among alternatives, macro hedge funds and farmland look attractively defensive now. We would start to look for opportunities in private debt (especially distressed debt) as the recession advances. Commodity futures are attractive as an inflation hedge. Overview Playing The Optionality From the start of the crisis, we argued that markets would bottom around the time when new cases of COVID-19 peaked. At the end of March, there were clear signs that this would happen in April, with Italy and Spain having probably already peaked and the US, if it follows the same trajectory, being only two or three weeks away (Chart 1). Chart 1Close To A Peak In New Cases?
Quarterly Portfolio Outlook: Playing The Optionality
Quarterly Portfolio Outlook: Playing The Optionality
But what happens next? A relief rally is likely, as often happens in bear markets – and indeed one probably started with the three-day 18% rise in US equities in the last week of March. Note, for example, the strong rallies in spring 2008 and summer 2000 before the second leg down in those bear markets (Chart 2). Chart 2Mid Bear Market Rallies Are Common
Mid Bear Market Rallies Are Common
Mid Bear Market Rallies Are Common
However, there is still a lot of potential bad news for markets to digest. Global growth has collapsed, as a result of people in many countries being forced to stay at home. US GDP growth in Q2 could fall by as much as 10% quarter-on-quarter (unannualized). Horrendously bad data will come as a shock to investors over the coming months. Despite the unprecedented stimulus measures from central banks and governments worldwide (Chart 3), nasty second-round effects are inevitable. Given the high level of corporate debt in the US, defaults will rise, to perhaps above the level of 2008-9 (Chart 4). EM borrowers have almost $4 trillion of foreign-currency debt outstanding, and will struggle to service this after the rise in the dollar and wider credit spreads. Euro area banks are poorly capitalized and have high non-performing debt levels left over from the last recession; they will be hit by a new wave of bankruptcies. Undoubtedly, there are some banks and hedge funds sitting on big trading losses after the drastic sell-off and stomach-churning volatility. Mid-East sovereign wealth funds will unload more assets to fill fiscal holes left by the collapsed oil price. Chart 3Massive Stimulus Everywhere
Quarterly Portfolio Outlook: Playing The Optionality
Quarterly Portfolio Outlook: Playing The Optionality
Chart 4Possible Second-Round Effects
Possible Second-Round Effects
Possible Second-Round Effects
There is also the question of when the pandemic will end. We are not epidemiologists, so find this hard to judge (but please refer to the answers from an authority in our recent Special Report1). The coronavirus will disappear only when either enough people in a community have had the disease to produce “herd immunity,” or there is a vaccine – which is probably 18 months away. Some epidemiologists argue that in the UK and Italy 40%-60% of the population may have already had COVID-19 and are therefore immune.2 But an influential paper from researchers at Imperial College suggested that repeated periods of lockdown will be necessary each time a new wave of cases emerges3 (Chart 5). Chart 5More Waves Of The Pandemic To Come?
Quarterly Portfolio Outlook: Playing The Optionality
Quarterly Portfolio Outlook: Playing The Optionality
At the end of March, global equities were only 23% off their mid-February record high – and were down only 34% even at their low point. That doesn’t seem like enough to fully discount all the potential pitfalls over coming months. This sort of highly uncertain environment is where portfolio construction comes in. We recommend that clients position their portfolios with optionality to remain robust in any likely outcome. There are likely to be rallies in risk assets over coming months, particularly when the coronavirus shows signs of petering out. There is significant asymmetric career risk for portfolio managers here. No portfolio manager will be fired for missing the pandemic and underperforming year-to-date (though some may because their firms go out of business or retrench). But a PM who misses a V-shaped rebound in risk assets over the rest of the year could lose their job. This will provide a strong incentive to try to pick the bottom. Chart 6Bond Yields Can't Go Much Lower
Bond Yields Can't Go Much Lower
Bond Yields Can't Go Much Lower
Government bond yields are close to their theoretical lows. The 10-year US Treasury yield is 0.6% and it unlikely to fall below 0% even in a severe recession (since the Fed has stated that it will not cut short-term rates below 0%). In other countries, the low for yields has turned out to be around -0.3% to -0.9% (Chart 6). The total return from risk-free bonds, therefore, will be close to zero even in a dire economic environment (Table 1). This means that the call between bonds and equities comes down to whether equity prices will be higher or lower in 12-months. Quite likely, they will be higher. Given this, and the optionality of participating in rebounds, we maintain our overweight on equities versus bonds. We would, however, be inclined to lower our equity weighting in the event of a big rally in stocks over the next few months. Table 1Not Much Room For Upside From Bonds
Quarterly Portfolio Outlook: Playing The Optionality
Quarterly Portfolio Outlook: Playing The Optionality
Table 2Bear Markets Are Often Much Worse
Quarterly Portfolio Outlook: Playing The Optionality
Quarterly Portfolio Outlook: Playing The Optionality
But there are also many downside risks. In the past two recessions, global equities fell by 50%-60% (Table 2). Despite the much worse economic environment this time, the peak-to-trough decline is so far much more limited. Moreover, valuations are not particularly compelling yet (Chart 7). To leaven our overall overweight on equities, we recommend a “minimum volatility” strategy, with tilts towards the low-beta US market, and some more defensive sectors such as Healthcare and Technology. China and China-related stocks also look somewhat attractive, since that country got over the coronavirus first, and is responding with a big increase in infrastructure spending (Chart 8). To hedge against downside risk, we also leave in place our overweights in cash and gold. Chart 7Equities Are Not Yet Super Cheap
Equities Are Not Yet Super Cheap
Equities Are Not Yet Super Cheap
Chart 8China Infra Spending To Rise
China Infra Spending To Rise
China Infra Spending To Rise
Garry Evans, Senior Vice President Chief Global Asset Allocation Strategist garry@bcaresearch.com What Our Clients Are Asking – About The Coronavirus Have We Seen The Bottom In Equity Markets? Chart 9Watch Closely COVID-19
Quarterly Portfolio Outlook: Playing The Optionality
Quarterly Portfolio Outlook: Playing The Optionality
After hitting a low on March 23, global equities have recovered more than one-third of their loss during this particularly rapid bear market, in response to the massive monetary and fiscal stimulus around the globe. It’s very hard to pinpoint the exact bottom of any equity bear market. The current one is particularly difficult in two ways: First, it was largely due to the exogenous shock from the COVID-19 pandemic. If history is any guide, we will first need to see a peak in infected cases globally before we can call a true bottom in equities (Chart 9). Second, the massive and coordinated response from central banks and governments around the world is unprecedented, as the global “lockdown” freezes the global economy. It’s encouraging to see the Chinese PMI bouncing back to 52 in March after a sharp drop to deep contraction level in February. However, the bounce back was mostly from production. Both export orders and imports remain weak. US initial jobless claims have skyrocketed to 3.3 million. If the peak of infection in the US follows similar patterns in China and Italy, then it would be another encouraging sign even if the US economic data continued to get worse. BCA Research’s base-case is for this recession to have a U-shaped recovery. This means that equity markets are likely to be range bound until we have a better handle on the future course of the pandemic. As such, we suggest investors actively manage risk by adding to positions when the S&P 500 gets close to 2250 and reducing risk when it gets close to 2750 during the bottoming process. What Will Be The Long-Term Consequences? Maybe it seems too early to think about this, but the coronavirus pandemic will change the world at least as profoundly as did the 1970s inflation, 9/11, and the Global Financial Crisis (GFC). Here are some things that might change: Chart 10Government Debt Will Rise Significantly
Government Debt Will Rise Significantly
Government Debt Will Rise Significantly
Government debt levels will rise dramatically, as a result of the huge fiscal packages being (rightly) implemented by many countries. In the US, after the $2 trillion spending increase and a fall in tax revenues, the annual fiscal deficit will rise from 6% of GDP to 15%-20%. Government debt/GDP could exceed the 122% reached at the end of WW2 (Chart 10). Ultimately, central banks will have to monetize this debt, perhaps by capping long-term rates or by buying a substantial part of issuance. This could prove to be inflationary. Households and companies may want to build in greater cushions and no longer live “on the edge”. US households have repaired their balance-sheets since 2009, raising the savings rate to 8% (Chart 11). But surveys suggest that almost one-third of US households have less than $1,000 in savings. They may, therefore, now save more. This could depress consumption further in coming years. Companies have maximized profitability over the past decades, under pressure from shareholders, by keeping inventories, spare cash, and excess workers to a minimum. Given the sudden stop caused by the pandemic (and who is to say that there will not be more pandemics in future), companies may want to protect themselves from future shocks. The inventory/sales ratio, which had been falling for decades, has picked up a little since the GFC (Chart 12). Inventory levels are likely to be raised further. Companies may also run less leveraged balance-sheets, rather than hold the maximum amount of debt their targeted credit rating can bear. This is all likely to reduce long-term profit growth. Chart 11Households May Become Even More Cautious
Households May Become Even More Cautious
Households May Become Even More Cautious
Chart 12Companies Will Run With Higher Inventories
Companies Will Run With Higher Inventories
Companies Will Run With Higher Inventories
The pandemic has highlighted the vulnerability of healthcare systems. China still spends only 5% of GDP on health, compared to 9% in Brazil and 8% in South Africa (Chart 13). The lack of intensive care beds and woefully inadequate epidemic plans in the US and other developed countries will also need to be tackled. Healthcare stocks should benefit. Chart 13Healthcare Spending Will Need To Rise
Healthcare Spending Will Need To Rise
Healthcare Spending Will Need To Rise
How Risky Are Euro Area Banks? Chart 14Euro Area Banks Are Quite Fragile
Euro Area Banks Are Quite Fragile
Euro Area Banks Are Quite Fragile
Banks in the euro area have underperformed their developed market peers by over 65% since the Global Financial Crisis (GFC) (Chart 14, panel 1). Their structural issues – many of which we highlighted in a previous Special Report – remain unsolved. Euro area banks remain highly leveraged compared to their US counterparts (panel 2). Their exposure to emerging economies is high (panel 3), and they continue to be a major provider of European corporate funding. US corporates, by contrast, are mainly funded through capital markets. The sector is also highly fragmented with both outward and inward M&A activity declining post the GFC. Profitability continues to be a key long-term concern, despite having recently stabilized (panel 4). The ECB’s ultra-dovish monetary stance and negative policy rates do not help banks’ performance either. Banks’ relative return has been correlated to the ECB policy rate since the GFC (panel 5). Following the coronavirus outbreak, the ECB is likely to remain dovish for a prolonged period. The ECB’s recently announced measures should, however, provide banks with ample liquidity to hold and spur economic activity through increased lending to households and corporates. Absent consolidation in the European banking sector, competition is likely to dampen banks’ profits. Additionally, the severity of the economic downturn caused by the coronavirus outbreak will determine if their significant exposure to emerging economies, the energy sector, and domestic corporates will hurt them further. For now, we would recommend investors underweight euro area banks. Where Can I Get Income In This Low-Yield World? Chart 15The Bear Market Has Unveiled Attractive Income Opportunities
The Bear Market Has Unveiled Attractive Income Opportunities
The Bear Market Has Unveiled Attractive Income Opportunities
For long-term investors who can tolerate price volatility, there is currently an opportunity to invest in high-income securities at relatively cheap prices. Below we list three of our favorite assets to obtain income returns: Dividend Aristocrats: The S&P 500 Dividend Aristocrats Index is composed of S&P 500 companies which have increased dividend payouts for 25 consecutive years or more. In order to provide such a steady stream of income through a such long timeframe, and even provide dividend increases in recessions, the companies in this index need to have a track record of running cashflow-rich businesses. Thus, the risk of dividend cuts is relatively low in these companies. Currently, the Dividend Aristocrat Index has a trailing dividend yield of 3.2% (Chart 15 – top panel). Fallen Angels: As we discussed in our November Special Report, fallen angels have attractive characteristics that separate them from the rest of the junk market. They tend to have longer maturities as well as a higher credit quality than the overall index. Crucially, fallen angels often enter the high-yield index at a discount, since certain institutional investors are forced to sell them when they are no longer IG-rated (middle panel). Thus, selected fallen angels which are not at a substantial risk of default could be a tremendous income opportunity. Currently fallen angels have a yield to worst of 10.65%. Sovereign US dollar EM debt: Our Emerging Markets Strategy service has argued that most EM sovereigns are unlikely to default on their debts, and instead will use their currencies as a release valve to ease financial conditions in their economies. Thus, hard-currency sovereign issues could prove to be attractive income investments if held to maturity. The bottom panel of Chart 15 (panel 3) shows the current yield-to-worst of the EM sovereign hard currency debt that has an overweight rating by our Emerging Markets service. Global Economy Chart 16The Collapse Begins
The Collapse Begins
The Collapse Begins
Overview: The global economy in early January looked on the cusp of a strong manufacturing pickup, driven by the natural cycle and by moderate fiscal stimulus out of China. The coronavirus changed all that. We now face a recession of a severity unseen since the 1930s. The fiscal and monetary response has been similarly rapid and radical. This will tackle immediate liquidity and even solvency risks. But, with consumers in many countries confined to their homes, a recovery is entirely dependent on when the number of new cases of COVID-19 peaks. In an optimistic scenario, this might be in late April or May. On a pessimistic one, the pandemic will continue in waves for several quarters. US: It is highly likely that the NBER will eventually declare that the US entered recession in March 2020. With many states in lockdown, consumption (which comprises 70% of GDP) will slump: only half of consumption is non-discretionary (rent, food, utility bills etc.); the other half is likely to shrink significantly while lockdowns continue. Judged by the 3.3 million initial claims in the week of March 16-21, unemployment will jump from its February level of 3.5% very rapidly towards 10%. Fiscal and monetary stimulus measures will cushion the downside (enabling households to pay rent and companies to service debt). But whether the recession is V-shaped or prolonged will be dependent on the length of the pandemic. Euro Area: European manufacturing growth was showing clear signs of picking up before the coronavirus pandemic hit (Chart 16 panel 1). But lockdowns in Italy, Spain and other countries will clearly push growth way into negative territory. The severity is clear from the first datapoints to reflect March activity, such as the ZEW survey. The ECB, after an initially disappointing response, has promised EUR750 billion (and more if needed) in bond purchases. The fiscal response so far has been more lukewarm, although Germany has now scrapped its requirement to run a budget surplus. One key question: will the stronger nothern European economies agree to “euro bonds”, joint and severally guaranteed, to finance fiscal spending in the weaker periphery? Chart 17...With Chinese Data Leading The Way
...With Chinese Data Leading The Way
...With Chinese Data Leading The Way
Japan: Japan’s economy was performing poorly even before the coronavirus pandemic, mainly because of the side-effects of last October’s consumption tax hike, and the slowdown in China (Chart 17, panel 2). So far, Japan has seen fewer cases of COIVD-19 than other large countries, but this may just reflect a lack of testing. Japan also has less room for policy response. Government debt is already 250% of GDP. The Bank of Japan has moderately increased purchases of equity ETFs and remains committed to maintaining government bonds yields around 0%. But Japan seems culturally and institutionally unable to roll out the sort of ultra-radical measures taken in other developed economies. Emerging Markets: China’s economy was severely disrupted in January and February, as reflected in an unprecedented collapse of the Caixin Services PMI to 26.5 (Chart 17, panel 3). However, big data (such as traffic congestion) suggest that in March people were gradually returning to work and companies restarting manufacturing operations. Q1 GDP growth will clearly be negative, and growth for the year may be barely above 0%. The authorities are ramping up infrastructure spending, which BCA expects to grow by 6-8% this year.4 Interest rates have also fallen below their 2015 levels, but not yet to their 2009 lows. Both fiscal and monetary policy are likely to be eased further. Elsewhere in Emerging Markets, the key question is whether central banks will cut rates to support rapidly weakening economies, or keep rates steady to prop up collapsing currencies. This is not an easy choice. Interest Rates: Central banks in developed markets have cut rates to their lowest possible levels with the Fed, for example, slashing from 1.25%-1.5% to 0%-0.25% within just 10 days in March. The Fed has signalled that it will not go below zero. Short-term policy rates globally, therefore, have essentially hit their lower bounds. Long-term rates have been volatile, with the 10-year US Treasury yield swinging down to 0.6% before jumping to 1.2%. While uncertainty continues, long-term risk-free rates are unlikely to rise substantially and, in the event of a prolonged severe recession, we would see the US 10-year yield falling to zero – but no lower. Global Equities Chart 18Is The V-Shaped Recovery Sustainable?
Quarterly Portfolio Outlook: Playing The Optionality
Quarterly Portfolio Outlook: Playing The Optionality
What’s Next? Global equities lost 32.8% year-to-date as of March 23, 2020. All countries and sectors in our coverage were in the red. Even the best performing country (Japan) and the best performing global sector (Consumer Staples) lost 26.7% and 23.2% respectively. From March 24 to March 26, however, equities made the best three-day gains since the Great Depression, recouping about one-third of the loss, even though US initial jobless claims came in at 3.3 million and also the US reported a higher number of cumulative infected people than China, with a much higher number of deaths per million people (Chart 18). So have we reached the bottom of the bear market? Is this “V-shaped” recovery sustainable? How should an investor construct a multi-asset global portfolio that’s sound for the next 9-12 months given the uncertainty associated with COVID-19 and the massive monetary and fiscal stimulus around the world? Based on our long-held philosophy of taking risks where risks will most likely be rewarded, we are most comfortable taking risk at the asset class level, by overweighting equities versus bonds, together with overweights in cash and gold as hedges. Within the equity portfolio, we are reducing risk by making the following adjustments: Upgrade US to overweight from underweight financed by downgrading the euro zone to underweight from overweight. Upgrade Tech to overweight, while closing two overweight bets on Financials and Energy and one underweight on consumer staples to benchmark weighting. Country Allocation: Becoming More Defensive Chart 19US And Euro Area: Trading Places
US And Euro Area: Trading Places
US And Euro Area: Trading Places
In December 2019 we added risk by upgrading the euro area to overweight and Emerging Markets to neutral based on our macro view that the global economy was on its way to recovery. Data releases in January did show signs of recovery in the global economy. However, the COVID-19 outbreak has changed the global landscape, and we are clearly in a recession now. When conditions change, we change our recommendations. We must make a judgment call because the economic data will not give us any timely, useful readings for some time to come. Back in December, the key reason to upgrade the euro area was the recovery of China which flows into the exports of the euro area. We think China will continue to stimulate its economy. However, given the global growth collapse, the “flow through” effect to the euro area will be delayed for some time. We prefer to play the China effect directly rather than indirectly. That’s why we maintain the neutral weighting of EM versus DM, but downgrade the euro area to underweight, and upgrade US to overweight. We also note the two following factors: First, as shown in Chart 19, panel 1, the relative performance between the euro area and the US is highly correlated with the relative performance between global Financials and Technology. This is not surprising given the sector composition of the two region’s equity indices. As such, this country adjustment is in line with our sector adjustment of upgrading Technology and downgrading Financials. Second, with a lower beta, US equities provide a better defense when economic uncertainty and financial market volatility are high. The risk to this adjustment, however, is valuation. As shown in panel 4, euro area valuation is extremely cheap compared to the US. However, PMI releases as well as forward earnings estimates are likely to get worse again before they get better, given the region’s reliance on exports to China and the structural issues in its banking system. Global Sector Allocation: Getting Closer To Benchmark Chart 20Reducing Sector Bets
Reducing Sector Bets
Reducing Sector Bets
We make four changes in the global sector portfolio to reduce sector bets, since we do not have a high conviction given market volatility and our house view that recovery out of this recession will be U-shaped. These are downgrading Financials to neutral, while upgrading Technology to overweight. We also close the overweight in Energy and underweight in Consumer Staples, leaving them both at benchmark weighting. Financials: We upgraded Financials in October last year as an upside hedge. This move did not pan out as bond yields plummeted. BCA Research’s US Bond Strategy service upgraded duration to neutral from underweight on March 10 as they do not see a high likelihood for yields to move significantly higher over the next 9-12 months. This does not bode well for Financials’ performance (Chart 20, panel 1). Even though the Fed and other central banks have come in as the lenders of last resort, loan growth could be weak going forward and non-performing loans could increase, especially in the euro area. Valuation, however, is very attractive. Technology: DRAM prices started to improve even before the COVID-19 outbreak. The global lockdown to fight against the pandemic is further spurring demand for both software and hardware, which should support better earnings growth (panel 2). The risk is that relative valuation is still not cheap, even though absolute valuation has come down after the recent selloff. Energy: The outlook for oil prices is too uncertain. The fight between Saudi Arabia and Russia is weighing on the supply side, while the global lockdown is denting demand prospect. The earnings outlook for energy companies is dire, while valuations are very attractive (panel 3). Consumer Staples: This is a classic defensive sector that does well in recessions. In addition, its relative valuation has improved to neutral from very expensive (panel 4). Government Bonds Chart 21Stay Aside On Duration
Stay Aside On Duration
Stay Aside On Duration
Upgrade Duration To Neutral. Global bond yields had a wild ride in Q1 as equities plummeted into bear market territory. The 10-year US Treasury yield made an historical low of 0.32% overnight on March 9, then quickly reversed back up to 1.27% on March 18, closing the quarter at 0.67%, compared to 1.88% at the beginning of the quarter (Chart 21). We are already in a recession and BCA’s house view is for a U-shaped recovery. This implies that global bond yields will likely follow a bottoming process similar to global equities, as new infections peak and high-frequency economic data start to recover. As such, we upgrade our duration call to neutral, to be in line with the position of BCA Research’s US Bond Strategy (USBS) service. Favor Linkers Vs. Nominal Bonds. The combined effect of the plummet in oil prices and the coronavirus outbreak has crushed inflation expectation to an extremely low level. As shown in Chart 22, the 10-year breakeven inflation rate is currently at 0.95%, 88 bps lower than its fair value. The fair value is estimated based on USBS’s Adaptive Expectations Model. Investors with a 12-month investment horizon should continue to favor TIPS over nominal Treasuries, but those with shorter horizons may be advised to stand aside and wait for the daily number of new COVID-19 cases to reach zero before re-initiating the position. Chart 22TIPS Offer A Ton Of Long-Run Value Extremely Cheap Inflation Protection
TIPS Offer A Ton Of Long-Run Value Extremely Cheap Inflation Protection
TIPS Offer A Ton Of Long-Run Value Extremely Cheap Inflation Protection
Corporate Bonds Chart 23High Quality Junk
High Quality Junk
High Quality Junk
It is undeniable that the dearth of cashflow caused by the lockdowns will spur a ferocious wave of defaults, particularly in the high-yield sector. It also is not clear that this risk is adequately compensated for. Currently, our US bond strategist believes that spreads are pricing an 11% default rate – in line with the default rate of the 2000/2001 recession. While it is not our base case, a default cycle like 2008, where 14% of companies in the index defaulted is a very clear possibility, as revenues have ground to a halt. However, several positive factors in the junk space must also be considered. Roughly 1% of the high-yield index matures in less than one year, which means that refinancing risk for junk credits should remain relatively subdued (Chart 23, top panel). Moreover, the quality of junk bonds is relatively high compared to previous periods of stress: when the market peaked in 2000 and 2007, Ba-rated credit (the highest quality of high yield) stood at 30% and 37% of the overall index respectively (middle panel). Today this credit quality stands at 49% of the high yield market, indicating a relatively healthier credit profile for junk. Additionally, the high-risk energy sector, which is likely to experience a substantial amount of defaults given the collapse in oil prices, now represents less than 8% of the market capitalization of the whole index (bottom panel). Taking these positive factors into consideration, we believe that a downgrade to underweight is not warranted, and instead we are downgrading high-yield credit from overweight to neutral. What about the investment-grade space? the massive stimulus package announced by the Fed, which effectively allows IG issuers to roll over their entire stock of debt, should provide a backstop to this market. One valid concern is that credit agencies can still downgrade a large number of issuers, making them ineligible to receive support. However, it seems that the credit agencies are aware of how much hinges on their ratings, and are communicating that they will factor the measures taken by various government programs into their credit analysis.5 Thus, considering that spreads are already extended, the Fed is providing unprecedent support and credit agencies are unlikely to knock out many companies out of investment-grade ratings, we are upgrading investment-grade credit from neutral to overweight. Commodities Chart 24Oil Prices & Politics Do Not Mix
Oil Prices & Politics Do Not Mix
Oil Prices & Politics Do Not Mix
Energy (Overweight): Oil markets were driven by supply/demand dynamics until a third factor, politics, shifted the market equilibrium. The recent clash between Saudi Arabia and Russia led to the breakdown of the OPEC 2.0 coalition and to Brent prices tanking by over 60% to $26 in March. The length of this breakdown is unknown. However, we believe the parties are likely to return to the negotiation table within the next months as the damage to countries which are dependent on oil begins to appear. The fiscal budget breakeven point remains much higher than the current oil price – it is around $83 for Saudi Arabia and $47 for Russia. Weakness in global crude demand will continue to put further downward pressure on prices, until economic activity recovers from the COVID-19 slowdown. Our Commodity & Energy Strategists expect the Brent crude oil price to average $36/bbl, with WTI trading some $3-$4 below that, in 2020 (Chart 24, panels 1 & 2). Industrial Metals (Neutral): Industrial metals prices were on track to pick up until the coronavirus hit global activity at the beginning of the year. Prices face further short-term headwinds as global manufacturing remains suppressed. Once the global social distancing ends and activity resumes, industrial metal prices should pick up as fiscal stimulus and infrastructure spending, especially in China, is implemented (panel 3). Precious Metals (Neutral): As the coronavirus spread, global risk assets have tumbled. Over the past 12 months, we have recommended investors increase their allocation to gold as both an inflation hedge and a beneficiary of accommodative monetary policy globally. However, we also recently highlighted that gold was reaching overbought territory and that a pullback was possible in the short-term. Nevertheless, investors should continue to maintain gold exposure to hedge against the eventuality that the pandemic is not contained within the coming weeks (panels 4 & 5). Currencies Chart 25Competing Forces Pushing The US Dollar In Different Directions
Competing Forces Pushing The US Dollar In Different Directions
Competing Forces Pushing The US Dollar In Different Directions
The USD has gone through a rollercoaster during the coronavirus crisis. Initially, the DXY fell by 4.8%, as rate differentials moved violently against the dollar when the Fed cut rates to zero. But this fall didn’t last long: as liquidity dried up, the cost for dollar funding surged, causing the dollar to skyrocket by almost 8.3%. Since then, the liquidity measures taken by monetary authorities have made the dollar reverse course once more. At this point there are multiple forces pulling the greenback in opposing directions. On the one hand, the collapse in global growth caused by the shutdowns should push the dollar higher. Moreover, momentum – one of the most reliable directional indicators for the dollar – continues to point to further upside (Chart 25, panels 1 and 2). However, the Fed’s generous USD swap lines with other major central banks as well as the massive pool of liquidity deployed have already stabilized funding costs in European and British currency markets, and look poised to do the same in others (Chart 25, panel 3). Thus, since there is no clarity on which force will prevail in this tug of war, we are remaining neutral on the US dollar. That being said, long-term investors can begin to buy some of the most depressed currencies, such as AUD/USD. This cross is currently trading at a 12% discount to PPP according to the OECD – the steepest discount that this currency has had in 17 years. Additionally, our China Investment Strategy projects that China will accelerate infrastructure investment this year to counteract the negative economic effects of the lockdown. This pick up in investment should increase base-metal demand, proving a boost to the Australian dollar in the process. Alternatives Chart 26Favor Macro Hedge Funds Over Private Equity During Recessions
Favor Macro Hedge Funds Over Private Equity During Recessions
Favor Macro Hedge Funds Over Private Equity During Recessions
Intro: The coronavirus outbreak caused tremendous market volatility and huge declines in liquid assets. Many clients have asked over the past few weeks which illiquid assets make sense in the current environment. To answer that, we stick to our usual recommendation framework, dividing illiquid assets into three buckets: Return Enhancers: Over the past year, we have been recommending clients to pare back private-equity exposure and increase allocation to hedge funds – particularly macro hedge funds, which often outperform other risky alternative assets during economic slowdowns and recessions (Chart 26, panel 1). Private debt – particularly distressed debt – could become a beneficiary of the current environment. The market turmoil will leave some assets heavily discounted, which can provide an opportunity for nimble funds to make investments at attractive valuations. In a previous Special Report, we highlighted Business Development Companies (BDCs) as a liquid alternative to direct private lending.6 They have taken a hit over the past month, even compared to equities and junk bonds. However, their recovery as markets bottom is usually significant (panels 2 & 3). Inflation Hedges: The coordinated “whatever-it-takes” stance implemented by global governments and central banks to mitigate the coronavirus crisis is likely to have inflationary consequences in the long-term. In that environment, investors should favor commodity futures over real estate (panel 4). As global growth reaccelerates in response to stimulus and resumed manufacturing activity over the next 12 months, the USD should weaken, and commodity prices should rise. Volatility Dampeners: Timberland and farmland remain our long-time favorite assets within this bucket. We have previously shown that both assets outperform other traditional and alternative assets during recessions and equity bear markets (panel 5). Farmland particularly should fare well in this environment, being more insulated from the economy, given food’s inelastic demand Risks To Our View Chart 27Dollar Would Fall In A Strong Recovery
Dollar Would Fall In A Strong Recovery
Dollar Would Fall In A Strong Recovery
Since our recommendations are based on a middle course, hedging both upside and downside risks, we need to consider how extreme these two eventualities could be. On the upside, the most optimistic scenario would be one in which the coronavirus largely disappears after April or May. The massive amount of fiscal and monetary stimulus would produce a jet-fuelled rally in risk assets. The dollar has soared over the past few weeks, as a risk-off currency (Chart 27), and would likely fall sharply. This would be very positive for commodities and Emerging Markets assets. The strong cyclical recovery would also help euro zone and Japanese equities relative to the more defensive US. Value stocks and small caps would outperform. Chart 28Could It Get Worse Than 2008 - Or Even 1932?
Could It Get Worse Than 2008 - Or Even 1932?
Could It Get Worse Than 2008 - Or Even 1932?
Downside risks are less easy to forecast. As Warren Buffet wrote in 2002: “you only find out who is swimming naked when the tide goes out.” The shock to the system caused by the coronavirus is certainly larger than the Global Financial Crisis of 2007-9 and could approach that caused by the Great Depression (Chart 28), though hopefully without the egregious policy errors of the latter. It is hard, therefore, to know where problems will emerge: US corporate debt, EM borrowers, and euro zone banks would be our most likely candidates. But there could be others. The oil price is another key uncertainty. Demand could collapse by at least 10% as a result of the severe recession. The breakdown of the production agreement between Saudi Arabia and Russia could produce a supply increase of 4-5%. Given this, Brent crude would fall to $20 a barrel. That would represent a strong tailwind to global recovery (Chart 29). On the other hand, a rapprochement between Saudi and Russia (and even with regulators in Texas) could push oil prices back up again – a positive for markets such as Canada and Mexico. Chart 29Cheap Oil Boosts Growth
Cheap Oil Boosts Growth
Cheap Oil Boosts Growth
Footnotes 1 Please see BCA Special Report, "Questions On The Coronavirus: An Expert Answers," dated 31 March 2020, available at bcaresearch.com 2 https://www.medrxiv.org/content/10.1101/2020.03.24.20042291v1 3 https://www.imperial.ac.uk/media/imperial-college/medicine/sph/ide/gida-fellowships/Imperial-College-COVID19-NPI-modelling-16-03-2020.pdf 4 Please see China Investment Strategy Weekly Report, “Chinese Economic Stimulus: How Much For Infrastructure And The Property Market,” dated 25th March 2020, available at cis.bcaresarch.com 5 A release by Moody’s on March 25 stated that their actions “will be more tempered for higher-rated companies that are likely to benefit from policy intervention or extraordinary government support.” 6 Please see Global Asset Allocation Special Report, “Private Debt: An Investment Primer,” dated June 6, 2018, available at gaa.bcaresearch.com GAA Asset Allocation
Highlights Chinese stocks have outperformed global benchmarks by a wide margin. We are taking profits on our overweight position, and downgrading our tactical call on Chinese stocks to neutral. In absolute terms, Chinese stocks have failed to buck the trend in a global selloff of risk assets. This suggests Chinese stocks are not immune to worldwide panics. Investors should wait for a peak in the global pandemic before going long on Chinese equities. Chinese stocks have become less cheap relative to global benchmarks. The size of Chinese stimulus is also less impressive compared with other major economies such as the US. Therefore, in order to maintain an overweight stance on Chinese risk assets in a global portfolio, Chinese stocks need to either offer a better price entry point, or a more upside potential in earnings outlook relative to their global peers. Feature Chart I-1Chinese Stocks Have Significantly Outperformed Global Benchmarks...
Chinese Stocks Have Significantly Outperformed Global Benchmarks...
Chinese Stocks Have Significantly Outperformed Global Benchmarks...
In the current pandemic environment, economic fundamentals mean little to panicked investors who have mostly ignored the unprecedented degree of monetary and fiscal stimulus pouring into the global economy. Investors are looking for clear signs that the COVID-19 crisis can be brought under control, but medical experts have been unable to predict the timing of a peak in the pandemic. Policymakers around the world are beginning to address investors’ concerns that substantial and timely fiscal policy supports are needed to offset the knock-on effects on businesses and individuals.1 However, until the number of new infections in major economies peaks, the erratic trading behavior among global investors will persist. Given the lack of near-term certainty, we are downgrading our tactical stance on Chinese stocks from overweight to neutral. Chart 1 highlights since we upgraded our tactical call to overweight in end-2019, Chinese stocks have significantly outperformed global stocks. This outperformance has been passive in nature; Chinese stocks are down about 10% year-to-date in US$ terms, versus a 23% decline in global stocks. We are also closing 7 of our 10 high-conviction investment calls from our trade book, for reasons cited here and then detailed in the next sections. Of the 10 active trades in our book, 7 have generated a positive return since their inceptions, including 3 that have recorded double-digit gains.2 Investors should wait for clarity on the peak of the global pandemic before going long on risk assets. Investors should wait for more signs of an upside potential in earnings and/or a better price entry point to go long on Chinese stocks. China Is Not Immune To A Global Pandemic Chart I-2...But Their Prices Have Also Plunged In Absolute Terms
...But Their Prices Have Also Plunged In Absolute Terms
...But Their Prices Have Also Plunged In Absolute Terms
Chinese equities have not been immune from the gyrations in the global financial markets, which have not responded to monetary and fiscal stimulus measures in either a customary or predictive manner. Unlike the 2008 global recession triggered by a financial crisis, public health crises damage the economy by reducing human activity and, therefore, erode both supply and demand. A return to normalcy depends almost entirely on whether the pandemic can be contained. Even though Chinese business activities are gradually resuming, Chinese stocks failed to buck the worldwide trend of a liquidation in risk assets. While Chinese stocks have outperformed global benchmarks by a wide margin, the relative gains have mostly been passive since early March. In absolute terms, Chinese domestic stocks have lost all their gains from February and investable stock prices have fallen back to their November 2018 level (Chart 2). Chart I-3Number Of Imported Cases Now On The Rise
Investing During A Global Pandemic
Investing During A Global Pandemic
China is not immune to a second COVID-19 wave. China has been reporting zero-to-low single-digit numbers of locally transmitted cases since mid-March, but it is now experiencing an increase in imported cases from overseas travelers (Chart 3). The mounting numbers have led the Chinese government to shut its borders to non-Chinese citizens.3 This indicates that it is still too early to claim a victory in China’s virus containment efforts. Given that China’s domestic businesses are open, the trajectory of new cases also remains unknown. These lingering doubts will slow the pace in the resumption of Chinese production (Chart 4). Chart I-4Chinese Companies Operating At 80% Capacity
Investing During A Global Pandemic
Investing During A Global Pandemic
Moreover, China is not immune to qualms about the depth and duration of a global recession. China has the political will and policy room to stimulate its economy, and the country’s dominant domestic demand makes the economy relatively insulated from a global recession. However, when more than 40% of China’s trading partners (including Europe and the US) remain under lockdown, a collapse of external demand will weigh on China’s economic and corporate profit recovery in the next quarter or two. Therefore, short-term risks on Chinese stocks are tilted to the downside. Bottom Line: Chinese stocks have failed to buck the trend in the global pandemic and the tsunami selloff in risk assets. Investors should wait for a peak in the outbreak before going long on Chinese equities. Chinese Stocks Have Become Less Cheap Relative To Global Benchmarks Chart I-5Outperformance In Chinese Stocks Seems Quite Extended
Outperformance In Chinese Stocks Seems Quite Extended
Outperformance In Chinese Stocks Seems Quite Extended
Chinese stocks, particularly in the domestic market, are no longer priced at deep discounts compared with global equities (Chart 5). The recent outperformance of Chinese stocks has brought the relative performance trend in both investable and domestic stocks back close to late-2017/early-2018 levels. That was before the US-China trade war began, and at a point where China’s economy was close to peak strength for the cycle. Although a passive outperformance does not automatically warrant an underweight stance on Chinese stocks, investors will demand a higher upside potential in Chinese corporate earnings to justify an overweight position in Chinese equities. Therefore, we will watch for the following signs before buying Chinese stocks: a strengthening in China’s economy and corporate profits outpacing recoveries in other major economies, and/or a near-term drop in Chinese stock prices outsizing the decline in global stock prices. Given the exceedingly strong policy responses from G20 economies (particularly the US), China’s stimulus will need to be amplified so that investors are confident that the rate of Chinese corporate profit recovery will surpass their global counterparts.4 In a recent Politburo meeting, Chinese policymakers signaled their willingness to expand stimulus, including much larger fiscal deficits and local-government special bond issuance quotas in 2020, along with further interest rate cuts.5 An escalation in policy support will probably bring China’s stimulus in line with that extended in the 2008-2009 global financial crisis. However, the size of the stimulus package will be determined at the National People’s Congress (NPC) meeting, which is delayed to end-April or early May. In the near term, the selloff in Chinese stocks will likely persist as financial markets continue to price in bad news in the global economy. Chinese investable stock prices continue to be priced at a discount relative to global benchmarks, although the discount is much smaller than it was three months ago. In absolute terms, Chinese investable stock prices have not reached their technical support levels. The offshore market historically rebounds when prices approach a major defense line, measured by a 12-year moving average. This technical support for the MSCI China Index is currently 65, still about 13% below the March 30 close (Chart 6). Chart I-6Investable Stock Prices Not Yet At Their Long-Term Support
Investable Stock Prices Not Yet At Their Long-Term Support
Investable Stock Prices Not Yet At Their Long-Term Support
The prices in Chinese domestic stocks have reached their 12-year moving average, although A-share prices are not decisively in a structural “cheap” territory yet (Chart 7). Investors should wait on the sidelines for now, since the full effects of any enhanced stimulus in China will be felt in the real economy with a time lag. China’s production supply side is only operating at about 80% of normal capacity, and demand has yet to catch up (Chart 4 and Chart 8). This suggests the rebound in economic activities in Q2 will likely be gradual, and corporate profits are likely to remain depressed. Chart I-7Domestic Stock Prices Approaching A Structural "Cheap" Territory
Domestic Stock Prices Approaching A Structural "Cheap" Territory
Domestic Stock Prices Approaching A Structural "Cheap" Territory
Chart I-8Demand In Manufacturing Remains Sluggish
Demand In Manufacturing Remains Sluggish
Demand In Manufacturing Remains Sluggish
Bottom Line: Chinese stocks have become less cheap against the backdrop of a massive liquidation of global equities. Chinese existing stimulus also appears moderate compared with other major economies. Therefore, in order for investors to overweight Chinese risk assets in a global portfolio, Chinese stocks either will have to offer a better entry price point or more upside corporate earnings potential. Both are currently missing. Investment Conclusions Investors should stay neutral on Chinese stocks in the next 3 months, and we are closing 7 out of the 10 active positions in our trade book. These trades are especially vulnerable to a protracted global recession and more selloffs in the domestic stock market. We will look for opportunities to incrementally add new trades to our book in the coming months. Here are our reasons for retaining or closing some of our positions: Long China Onshore Corporate Bonds (Maintain): The trade has yielded a handsome return of 16% since its inception in June 2017, (Chart 9). Although the spread in Chinese onshore corporate bond yields has widened sharply in the past few weeks, it has been the result of an indiscriminate global selloff of financial assets rather than the market pricing in any China-centric credit risks (Chart 10). In the next 6 to 12 months, corporate credit spreads should normalize as we expect monetary policies in major economies to remain ultra-loose, the global economy to recover and investors’ risk sentiment to improve. Chinese onshore corporate bonds will likely continue to offer a better risk-reward profile relative to other economies, with a higher risk premium and relatively stable default rate. Chart I-9Chinese Onshore Corporate Bonds Remain Attractive
Chinese Onshore Corporate Bonds Remain Attractive
Chinese Onshore Corporate Bonds Remain Attractive
Chart I-10Corporate Credit Spreads Should Narrow Over A 12-Month Horizon
Corporate Credit Spreads Should Narrow Over A 12-Month Horizon
Corporate Credit Spreads Should Narrow Over A 12-Month Horizon
Long MSCI China Energy Stocks (Close): This trade has had the worst performance among our positions due to consistently falling oil prices since October 2018 (Chart 11). Although BCA’s commodity strategists expect Brent prices to average $36/barrel in 2020, $3 higher than the average oil prices in March, it is still at a 50% discount from the $70 price tag just 3 months ago. Such a minor improvement in the price outlook does not offer enough upside potentials to offset downside risks in earnings in the next 9 months. Therefore, we would rather cut the losses. Long China Domestic Consumer Discretionary Equities Versus Benchmark and Long China Domestic Consumer Discretionary Equities/Short China Domestic Consumer Staples Equities (Close): As explained in the previous sections, we think there will be better entry price points for Chinese stocks as well as cyclical stocks. Besides, discretionary consumption in China has yet to show signs of a meaningful rebound. In the near term, we will also look for opportunities to go long position in domestic consumer staple stocks because we think that food and beverage price inflation will persist well into the second half of this year (Chart 12). Chart I-11Depressed Oil Prices Lead To Significant Underperformance In Energy Stocks
Depressed Oil Prices Lead To Significant Underperformance In Energy Stocks
Depressed Oil Prices Lead To Significant Underperformance In Energy Stocks
Chart I-12Consumer Staple Stocks Should Benefit From Stubbornly High Food Prices
Consumer Staple Stocks Should Benefit From Stubbornly High Food Prices
Consumer Staple Stocks Should Benefit From Stubbornly High Food Prices
Long MSCI China Index, Long MSCI China Onshore Index, Long MSCI China Growth Index/ Short MSCI All Country World (Close): We will need to see more stable sentiment in the global financial markets, a better entry price point for Chinese stocks and a sure sign of outsized Chinese stimulus before reinitiating a long position on Chinese stocks. Jing Sima China Strategist jings@bcaresearch.com Appendix Table 1Massive Stimulus In Response To Pandemic
Investing During A Global Pandemic
Investing During A Global Pandemic
Footnotes 1 Please see Table 1 in the Appendix. 2 Please see the trade table at the end of the report. 3 https://www.bloomberg.com/news/articles/2020-03-26/china-to-suspend-foreigners-entry-starting-saturday?mc_cid=1bdcd29ddd&mc_eid=9da16a4859 4 The stimulus package announced in the US amounts to 9% of the country’s 2019 GDP, whereas China’s stimulus would be about 3% of its 2019 GDP. 5 http://www.xinhuanet.com/politics/leaders/2020-03/27/c_1125778940.htm Cyclical Investment Stance Equity Sector Recommendations
Highlights Investment Grade: Investors should overweight investment grade corporate bonds relative to a duration-matched position in Treasury securities, with a particular focus on bonds that are eligible for the Fed’s purchase programs. High-Yield: Caution is still warranted in the high-yield market. At current levels, spreads do not adequately compensate investors for the coming default cycle. We would recommend buying high-yield if the average index spread rises to a range of 1075 bps – 1290 bps. Fed Purchases: Fed corporate bond purchases will cause investment grade spreads to tighten, particularly out to the 5-year maturity point. However, the program won’t stop the coming onslaught of ratings downgrades. High-Yield Sectors: The Energy, Transportation, Capital Goods, Consumer Cyclical and Consumer Noncyclical sectors are all highly exposed to the looming default cycle. Financials and Utilities look like the best places to hide out. Feature Chart 1Will The Fed's Corporate QE Mark The Top In Spreads?
Will The Fed's Corporate QE Mark The Top In Spreads?
Will The Fed's Corporate QE Mark The Top In Spreads?
The COVID pandemic and associated recession have already caused turmoil in financial markets and prompted a policy response from the Federal Reserve that is unprecedented in its aggressiveness. US investment grade and high-yield corporate spreads widened 280 bps and 764 bps, respectively, to start the year. Then, they tightened by 78 bps and 179 bps, respectively, after the Fed announced it is stepping into the corporate bond market for the first time (Chart 1). Clearly, this is a challenging time for corporate bond investors. But sifting through all the noise, we think there are three key questions to stay focused on: How will the Federal Reserve’s support for the corporate bond market impact spreads? At what level do spreads fully discount the looming default cycle? What sectors within the corporate bond market are most/least at risk of experiencing large-scale defaults? What Can The Fed Hope To Accomplish By Buying Corporate Debt? As part of its package of monetary policy stimulus measures to combat the US COVID-19 recession, the Fed has undertaken a dramatic new step to try and lower borrowing costs for US businesses – the outright buying of US investment grade corporate bonds. The main details of these new programs are as follows: The Fed will purchase investment grade corporate bonds, loans and related exchange-traded funds (ETFs) as part of these programs. Bonds can be purchased in the primary (newly-issued) and secondary markets. The purchases will not be held on the Fed’s balance sheet. Instead, two off-balance sheet Special Purpose Vehicles (SPVs), one for primary market purchases and one for secondary market purchases, will buy the bonds. Both SPVs are initially funded by the US Treasury and will be levered up via loans from the Fed. The primary market SPV will buy newly-issued bonds with credit ratings as low as BBB- and maturities of four years or less. Eligible issuers are US businesses with material operations in the United States; that list of companies may be expanded in the future. Eligible issuers do not include companies that are expected to receive direct financial assistance from the US government (i.e. no buying of bonds from companies getting bailout funds). The secondary market SPV will buy bonds with maturities of up to five years and credit ratings as low as BBB-, with a buying limit of 10% of the entire stock of eligible debt of any single company. This secondary market SPV will also buy investment grade bond ETFs, up to 20% of the outstanding shares of any single ETF. Through the primary market facility, any eligible company can “borrow” from the Fed, through bond purchases or direct loans, an amount greater than its maximum outstanding debt (bonds plus loans) on any day over the past twelve months. Specifically: 140% of all debt for AAA-rated issuers, 130% for AA-rated issuers, 120% for A-rated issuers and 110% for BBB-rated issuers. Since those percentages are all greater than 100, this effectively means that the Fed will allow eligible companies to potentially roll over their entire stocks of debt through this program, plus some net new borrowing. With the primary market facility, issuers can even defer interest payments on the funds borrowed from the Fed for up to six months, with the interest payments added to the final repayment amount (any company choosing this option cannot do share buybacks or make dividend payments). These programs are set to run until September 30 of this year, with an option to extend as needed. The Fed’s new initiatives represent a new step for the central bank, providing direct lending to any company that needs it. The Fed had to do this through off-balance-sheet SPVs, since direct buying of corporates is not permitted under the Federal Reserve Act. With this structure, it is technically the US Treasury department that bears the initial credit risk through its seed funding of each SPV. The BoJ was the first of the major central banks to start buying corporate bonds. This structure is different than the recent corporate bond QE programs of the European Central Bank (ECB), Bank of England (BoE) and Bank of Japan (BoJ), where the credit risk was directly taken onto the central bank balance sheets. But from an investment perspective, the difference in structure between the Fed’s corporate bond buying program and that of other central banks is nothing more than a technicality. It is still worthwhile to see if any lessons can be learned from these other countries. The Corporate Bond Buying Experience Of Other Central Banks The BoJ was the first of the major central banks to start buying corporate bonds, in a program that began in February 2009 and continued until October 2012. The program initially involved only the purchase of very high-quality corporate debt (rated A or higher) and only for maturities up to one year. The pool of eligible bonds was later increased to allow for lower credit quality (rated BBB or higher) and longer maturities (up to three years). The BoJ ended up buying a total of 3.2 trillion yen (US$30 billion) of bonds during that program, representing nearly 50% of total Japanese investment grade nonfinancial debt (Chart 2). Credit spreads tightened modestly over the life of the program, particularly for the shorter maturity debt that the BoJ was directly buying.1 Research from the BoJ concluded that the corporate bond buying did improve liquidity for the bonds that were eligible for the program, although there was no discernable pickup in overall Japanese corporate bond issuance.2 The BoE started its Corporate Bond Purchase Scheme (CBPS) in August 2016, as part of a package of stimulus measures to cushion the economic blow from the UK’s stunning vote to leave the European Union. The CBPS bought £10bn of UK nonfinancial investment grade corporate bonds over a period of 18 months, with ratings as low as BBB-. This was a relatively modest share of all eligible nonfinancial bonds (4.7%), but UK credit spreads did tighten over the life of the program (Chart 3). The BoE’s own research has determined that the spread tightening was due to lower downgrade/default risk premiums, and that the program triggered a surge in investment grade issuance in the weeks and months following its launch.3 Chart 2The BoJ's Corporate Bond Buying Experience
The BoJ's Corporate Bond Buying Experience
The BoJ's Corporate Bond Buying Experience
Chart 3The BoE's Corporate Bond Buying Experience
The BoE's Corporate Bond Buying Experience
The BoE's Corporate Bond Buying Experience
The ECB announced its Corporate Sector Purchase Program (CSPP) in March 2016, with the actual bond purchases beginning three months later. This was an expansion of the ECB’s overall Asset Purchase Program that had previously been focused on government debt. Like the BoJ and BoE programs, only nonfinancial debt of domestic euro area companies rated BBB- or higher was eligible. The ECB did buy bonds across a wide maturity spectrum of 1-30 years. The ECB’s purchases in the first 18 months of the CSPP were sizeable, between €60-80bn per month, reaching a cumulative total of nearly 20% of the stock of eligible bonds (Chart 4). This not only drove credit spreads tighter for bonds in the CSPP, but also pushed spreads lower for bonds that were not directly purchased by the ECB, like bank debt. The ECB described this as evidence of a strong “portfolio balance effect”, where investors who sold their bonds to the central bank ended up redeploying the proceeds into other parts of the euro area corporate bond market.4 One major difference between the ECB CSPP and the BoJ and BoE programs was that the ECB could conduct the necessary purchases in the primary market, if necessary. This represented a major new source of funding for smaller euro area companies that did not previously issue corporate bonds, preferring to get most of their debt financing through bank loans. As evidence of this, the year-over-year growth rate of euro area corporate bond issuance soared from 2.5% to 10% in the first year of the CSPP (Chart 5). Chart 4The ECB's Corporate Bond ##br##Buying Experience
The ECB's Corporate Bond Buying Experience
The ECB's Corporate Bond Buying Experience
Chart 5ECB Primary Market Buying Spurred A Boom In Issuance
ECB Primary Market Buying Spurred A Boom In Issuance
ECB Primary Market Buying Spurred A Boom In Issuance
Investment Conclusions Applying these lessons to the US, the first conclusion we reach is that Fed corporate bond purchases will tighten spreads for eligible securities. In this case, eligible securities include all investment grade rated US corporate bonds with maturities less than five years. In effect, the Fed’s primary market facility could be thought of as adding an agency backing to these eligible bonds since the Fed has effectively guaranteed that this debt can be rolled over and that bond investors will be made whole. It’s noteworthy that last week saw a record amount of new investment grade corporate bond issuance as firms rushed to take advantage of the program. Second, we should see some positive knock-on effects on spreads of ineligible investment grade securities, i.e. investment grade corporate bonds with maturities greater than five years. The impact will not be as large as for eligible securities, but since many of the same issuers operate at both ends of the curve, long-maturity spreads will benefit at the margin from any reduction in interest expense for the issuer. Third, any trickle-down effects to high-yield spreads will be much smaller. No high-yield issuers can benefit from the program, and while the Fed could eventually open up its facilities to include high-yield debt, we wouldn’t count on it. We suspect the moral hazard of “bailing out the junk bond market” would simply be a step too far for the Federal Reserve. We should see some positive knock-on effects on spreads of ineligible securities. In sum, we would advocate an overweight allocation to US investment grade corporate bonds today – especially on securities eligible for the Fed’s programs. We do not recommend a similar overweight stance on US high-yield, where spreads will continue to fluctuate based on the fundamental default outlook (see section titled “Assessing The Value In High-Yield” below). Can The Fed Re-Steepen US Credit Spread Curves And Prevent Ratings Downgrades? Prior to the Fed’s announcement of the new programs, the US investment grade corporate spread curve had become inverted, with shorter maturity spreads exceeding longer maturity ones. This has historically been a harbinger of increased investment grade downgrades and high-yield defaults (Chart 6). With the Fed’s new programs focusing on bonds with maturities of up to five years, the Fed’s buying can potentially lead to a re-steepening of the investment grade spread curve by driving down shorter maturity spreads. Chart 6Inverted US Credit Spread Curves Are Flashing An Ominous Message
Inverted US Credit Spread Curves Are Flashing An Ominous Message
Inverted US Credit Spread Curves Are Flashing An Ominous Message
Already, the investment grade spread curve has begun to disinvert in the first week of the Fed’s programs (Chart 7). At the same time, the bond rating agencies are moving aggressively to adjust credit opinions in light of the US recession. Already, downgrades from Moody’s and S&P are outpacing upgrades by a 3-1 ratio year-to-date – a pace not seen since the depths of the financial crisis, according to Bloomberg.5 Chart 7The Fed's New Programs Are Already Helping Disinvert Investment Grade Spread Curves
The Fed's New Programs Are Already Helping Disinvert Investment Grade Spread Curves
The Fed's New Programs Are Already Helping Disinvert Investment Grade Spread Curves
The Fed’s actions should be successful at re-steepening the investment grade credit curve. However, we doubt that they will have much impact on ratings decisions. While the Fed can reduce borrowing costs and prevent default by rolling over maturing debt for investment grade issuers, this has a relatively minor impact on corporate balance sheet health. In fact, the Fed's programs will only improve balance sheet health for firms that just roll over existing debt loads and don’t take on any new debt. Any firm that takes on new debt during this period will come out of the crisis with more leverage than when it entered. All else equal, that should warrant a downgrade. Bottom Line: Fed corporate bond purchases will cause investment grade spreads to tighten, particularly out to the 5-year maturity point. However, the program won’t stop the coming onslaught of ratings downgrades. Assessing The Value In High-Yield What Kind Of Default Cycle Is Already “In The Price”? High-yield debt may not benefit from the Fed’s corporate bond-buying programs. But, as in every other cycle, there will come a time when spreads discount the full extent of future default losses. At that point it will be appropriate to increase allocations to the sector. Our Default-Adjusted Spread will guide us as we make that determination. Our Default-Adjusted Spread is the excess spread available in the Bloomberg Barclays High-Yield index after subtracting realized default losses. Specifically, we calculate the Default-Adjusted Spread as: Index OAS – [Default Rate x (1 – Recovery Rate)] The default and recovery rates apply to the 12-month period that follows the index spread reading. For example, the Default-Adjusted Spread for January 2019 uses the index OAS from January 2019 and default losses incurred between February 2019 and January 2020. Table 1 shows that there is a strong link between the Default-Adjusted Spread and excess High-Yield returns relative to duration-matched Treasuries. Specifically, we see that losses are a near certainty if the Default-Adjusted Spread is negative and that return prospects are poor for spreads below 150 bps. A Default-Adjusted Spread above its historical average of 250 bps is an obvious buying opportunity, while a spread above 400 bps virtually guarantees strong returns. Table 1The Default-Adjusted Spread & High-Yield Excess Returns
Trading The US Corporate Bond Market In A Time Of Crisis
Trading The US Corporate Bond Market In A Time Of Crisis
This helps clarify the task at hand. We must make an assumption about what the default and recovery rates will be for the next 12 months, then apply those assumptions to the current index spread. The resulting Default-Adjusted Spread will tell us if High-Yield bonds are worth a look. Table 2 shows the Default-Adjusted Spread that results from different combinations of default and recovery rates.6 For example, a 10% default rate and 35% recovery rate together imply a Default-Adjusted Spread of 271 bps, suggesting an attractive buying opportunity. Table 2Default-Adjusted Spread (BPs) Given Different Assumptions For Default And Recovery Rates
Trading The US Corporate Bond Market In A Time Of Crisis
Trading The US Corporate Bond Market In A Time Of Crisis
What Sort Of Default Cycle Should We Expect? To answer this question we turn to Table 3. Table 3 lists periods since the mid-1980s when the default rate rose above 4%, along with several factors that influence the level of default losses: The magnitude of the economic downturn, proxied by the worst year-over-year real GDP growth reading recorded during that timeframe. The duration of the economic downturn, measured as the number of quarters from the peak to trough in real GDP. Nonfinancial corporate leverage – measured as total debt divided by book value of equity – at the cycle peak. Table 3A Brief History Of Default Cycles
Trading The US Corporate Bond Market In A Time Of Crisis
Trading The US Corporate Bond Market In A Time Of Crisis
Alongside these determining factors, the table also shows the peak 12-month default rate seen during the cycle and the recovery rate that occurred alongside it. First, we notice a strong relationship between the magnitude of the economic shock and the peak default rate. Meanwhile, corporate leverage does a better job explaining the recovery rate. Notice that recoveries were greater in 2008 than in 2001, despite 2008’s larger economic shock. Turning to the current situation, our base case assumption is that we will see severe economic contraction in Q1 and Q2 of this year followed by some recovery in the third and fourth quarters. All told, 2020 annual GDP growth could be close to the -3.9% seen in 2008, though the duration of the peak-to-trough economic shock will be only two quarters instead of six.7 Based on the historical comparables listed in Table 3, this sort of economic shock could generate a peak default rate somewhere between 11% and 13%. As for recoveries, nonfinancial corporate leverage is currently higher than during any of the prior episodes in our study. It follows that the recovery rate will be very low, perhaps on the order of 20%-25%. Turning back to Table 2, we see that our default and recovery rate assumptions imply a Default-Adjusted Spread somewhere between -119 bps and +96 bps. This is too low to be considered a buying opportunity. A Default-Adjusted Spread above its historical average of 250 bps is an obvious buying opportunity, while a spread above 400 bps virtually guarantees strong returns. Table 4 flips this analysis around and shows the option-adjusted-spread on the Bloomberg Barclays High-Yield index that would generate a Default-Adjusted Spread of 250 bps based on different assumptions for the default and recovery rates. Recall that we consider a Default-Adjusted Spread of 250 bps or above as a buying opportunity. Using the aforementioned default and recovery rate assumptions, we would see a buying opportunity in high-yield if the average index spread rose to a range of 1075 bps – 1290 bps, or above. As of Friday’s close, the index option-adjusted spread was 921 bps. Table 4High-Yield Index Spread (BPs) That Would Imply A Buying Opportunity* In Different Default Loss Scenarios
Trading The US Corporate Bond Market In A Time Of Crisis
Trading The US Corporate Bond Market In A Time Of Crisis
Bottom Line: High-yield spreads do not discount the full extent of the looming default cycle and will not benefit from the Fed’s asset purchase programs. Investors should stay cautious on high-yield for now and look to increase allocations when the average index spread moves into a range of 1075 bps to 1290 bps. Which High-Yield Sectors Are Most Exposed? Even during a period of large-scale defaults, sector and firm selection are vital in the high-yield bond market. In fact, you could argue that sector selection becomes even more important during a default cycle, as some sectors bear the brunt of default losses while others skate through relatively unscathed. To wit, Chart 8plots the 12-month trailing speculative grade default rate alongside a diffusion index that shows the percentage of 30 high-yield industry groups – as defined by Moody’s Investors Service – that have a trailing 12-month default rate above 4%. Even at the peaks of the default cycles during the last two recessions, only 47% and 63% of industry groups experienced significant default waves. Chart 8Sector Selection Is Vital In A Default Cycle
Sector Selection Is Vital In A Default Cycle
Sector Selection Is Vital In A Default Cycle
To help identify which sectors are most at risk during the current default cycle, we consider how the 10 main high-yield industry groups, as defined by Bloomberg Barclays, stack up on three crucial credit metrics: The share of firms rated Caa Growth in par value of debt outstanding since the last recession Change in the median firm’s net debt-to-EBITDA ratio since the last recession8 Charts A1-A10 in the Appendix show how the three credit metrics for each industry group have evolved over time. In the remainder of this report we compare the sectors against each other across each of the above three dimensions. Note that Box 1 provides a legend for the sector name abbreviations used in Charts 9, 10 and 11. Box 1Sector Abbreviations
Trading The US Corporate Bond Market In A Time Of Crisis
Trading The US Corporate Bond Market In A Time Of Crisis
Chart 9OAS Versus Share Of Caa-Rated Debt
Trading The US Corporate Bond Market In A Time Of Crisis
Trading The US Corporate Bond Market In A Time Of Crisis
Chart 10OAS Versus Debt Growth
Trading The US Corporate Bond Market In A Time Of Crisis
Trading The US Corporate Bond Market In A Time Of Crisis
Chart 11OAS Versus Net Debt-To-EBITDA
Trading The US Corporate Bond Market In A Time Of Crisis
Trading The US Corporate Bond Market In A Time Of Crisis
Share Of Caa-Rated Debt Even during a large default cycle the bulk of default losses will be borne by firms rated Caa and below. In Chart 9, we see that if we ignore the outlying Technology, Transportation and Energy sectors, there is a fairly linear relationship between credit spreads and the share of firms rated Caa in each sector. Transportation and Energy currently trade at very wide spreads because those sectors’ revenues are heavily impacted by the current crisis. Technology spreads remain low because, despite the high percentage of Caa-rated debt, the sector has one of the lower net debt-to-EBITDA ratios (see Chart A6). All in all, Chart 9 suggests that Capital Goods, Communications, Consumer Cyclicals and Consumer Noncyclicals all carry a large proportion of low-rated debt. In contrast, Financials and Utilities appear much safer. Debt Growth Another good way to assess which sectors are most likely to experience defaults is to look at which sectors added the most debt during the economic recovery (Chart 10). On that note, the rapid levering-up of the Energy sector clearly sticks out. Beyond that, Capital Goods, Consumer Noncyclicals and Technology also added significant amounts of debt during the recovery. In contrast, the Utilities sector actually reduced its debt load. Change In Net Debt-to-EBITDA Finally, it’s important to note that simply adding debt does not necessarily put a sector at greater risk of default if earnings are rising even more quickly. For this reason we also look at recent trends in net debt-to-EBITDA (Chart 11). Here, we see that wide spreads in Energy and Transportation are justified by large increases in net debt-to-EBITDA. Conversely, Financials and Communications have seen improvement. Bottom Line: Based on a survey of three important credit metrics: The Energy, Transportation, Capital Goods, Consumer Cyclical and Consumer Noncyclical sectors are all highly exposed to the looming default cycle. In contrast, Financials and Utilities look like the best places to hide out. Appendix Chart A1Basic Industry Credit Metrics
Basic Industry Credit Metrics
Basic Industry Credit Metrics
Chart A2Capital Goods Credit Metrics
Capital Goods Credit Metrics
Capital Goods Credit Metrics
Chart A3Consumer Cyclical Credit Metrics
Consumer Cyclical Credit Metrics
Consumer Cyclical Credit Metrics
Chart A4Consumer Non-Cyclical Credit Metrics
Consumer Non-Cyclical Credit Metrics
Consumer Non-Cyclical Credit Metrics
Chart A5Energy Credit Metrics
Energy Credit Metrics
Energy Credit Metrics
Chart A6Technology Credit Metrics
Technology Credit Metrics
Technology Credit Metrics
Chart A7Transportation Credit Metrics
Transportation Credit Metrics
Transportation Credit Metrics
Chart A8Communications Credit Metrics
Communications Credit Metrics
Communications Credit Metrics
Chart A9Utilities Credit Metrics
Utilities Credit Metrics
Utilities Credit Metrics
Chart A10Financial Institutions Credit Metrics
Financial Institutions Credit Metrics
Financial Institutions Credit Metrics
Ryan Swift US Bond Strategist rswift@bcaresearch.com Robert Robis, CFA Chief Fixed Income Strategist rrobis@bcaresearch.com Jeremie Peloso Senior Analyst jeremiep@bcaresearch.com Footnotes 1 The March 2011 earthquake and tsunami in Japan created a lot of short-term credit spread volatility, but even then, shorter-maturity bonds saw less spread widening than the overall index. 2 https://www.imes.boj.or.jp/research/papers/english/18-E-04.pdf 3 https://www.bankofengland.co.uk/quarterly-bulletin/2017/q3/corporate-bond-purchase-scheme-design-operation-and-impact 4 The ECB described this effect in a 2018 report that can be accessed here: https://www.ecb.europa.eu/pub/pdf/other/ecb/ebart201803_02.en.pdf 5 https://www.bloomberg.com/news/articles/2020-03-26/s-p-moody-s-cut-credit-grades-at-fastest-pace-since-2008-crisis 6 Calculations are based on the index spread as of market close on Friday March 27. 7 For more details on BCA’s assessment of the economic outlook please see Global Investment Strategy Second Quarter 2020 Strategy Outlook, “World War V”, dated March 27, 2020, available at gis.bcaresearch.com 8 Median net debt-to-EBITDA is calculated from our bottom-up sample of high-yield firms that consists of all the firms in the Bloomberg Barclays High-Yield index for which data are available. Data are retrieved on a quarterly basis and the sample is adjusted once per year based on changes in the composition of the Barclays indexes. As of Q2 2019, this sample includes 354 companies.
Dear client, Next Monday instead of sending you a Weekly Report we will be hosting a live webcast at 10am EST, addressing the recent market moves and discussing the US equity market outlook. Kind Regards, Anastasios Highlights Portfolio Strategy The passing of the mega fiscal package, turning equity market internals, the collapse in net earnings revisions all underscore that we may have already seen the recessionary equity market lows. Investors with higher risk tolerance and a cyclical 9-12 month time horizon will be handsomely rewarded. Firming operating metrics, the defensive nature of tech services at a time when macro data are about to nosedive, compel us to boost the S&P data processing index to overweight. Grim macro data, the rising threat of a debt deflation spiral, poor operating metrics and lofty valuations, all warn that the path of least resistance is lower for REITs. Recent Changes Boost the S&P data processing index to overweight today. Last week we obeyed our rolling stops in our cyclically underweight position in the S&P homebuilders index and cyclically overweight positions in the S&P hypermarkets and S&P household products indexes for gains of 41%, 26% and 5%, respectively.1 Feature The SPX had a streak of three green days last week as congress finally passed a $2tn fiscal easing bill. In fact the last time the S&P 500 had two consecutive green days was right before its February 19 peak. Our view remains that the risk/reward tradeoff for owning equities is favorable for investors with higher risk tolerance and a cyclical 9-12 month time horizon, as we highlighted last Monday in our “20 reasons to start buying equities” part of our Weekly Report.2 As a reminder, during the Great Recession, equities troughed 20 days after the American Recovery and Reinvestment Act of 2009 took effect on February 17, 2009. Thus if history rhymes, an equity market bottom is likely near if not already behind us. Does this mean the SPX has definitively troughed? Not necessarily, but our playbook/roadmap calls for a retest and hold of the recent lows as we have been highlighting in recent research.3 Keep in mind that S&P 500 futures (ES) have fallen over 36% from peak to trough. This is similar to the median fall during recession bear markets dating back to the Great Depression. Most importantly, comparing the two most recent iterations is instructive in attempting to figure out what is baked in the cake. Namely, in the 9/11 catalyzed recession and subprime mortgage collapse catalyzed recession, EPS got halved. Similarly, equities fell 50% from their respective peaks. If we use that assumption – i.e. a recessionary equity bear market fall predicts the eventual profit drubbing – then what the ES futures clocking in at 2174 discounted is that trailing EPS will fall from $162 to $104 and forward EPS from $177 to $113 (Chart 1). Chart 1Joined At The Hip
Joined At The Hip
Joined At The Hip
While we have no real visibility on EPS, our sense is that we will not fall further than what was already discounted in the broad market. If we are offside and a GFC or Great Depression ensues, then profits will get halved to $81 and the SPX will fall to 1700. Another simple way of looking at the EPS drawdown is by considering $162 as trend EPS. Then for every month that the economy is shut down roughly $13.5 get shaved off EPS. Thus, triangulating both approaches, a $104 EPS level has discounted a shutdown lasting 4 months and 10 days. This is a tall order and we would lean against such extreme pessimism. Meanwhile, analysts are scrambling to cut estimates the world over. Not only SPX net earnings revisions (NER) are at the lowest point since the GFC, but so is the emerging market NER ratio. The Eurozone and Japan are following close behind (Chart 2). Once again the speed of this downward adjustment suggests that a lot of bad news is already priced in now depressed NER. Chart 2Bad News Is Priced In
Bad News Is Priced In
Bad News Is Priced In
Chart 3Market Internals Ticking Higher
Market Internals Ticking Higher
Market Internals Ticking Higher
Moreover, equity market internals underscore that we may have already seen the recessionary equity market lows. Chart 3 shows that hypersensitive small caps have been outperforming their large cap peers of late, chip stocks are sniffing out a reflationary impulse and even emerging markets are besting the SPX. Finally, the best China proxy out there, the Aussie dollar, corroborates the bullish signal from all these indicators and suggests that this mini “risk-on” phase can last a while longer (third panel, Chart 3). Nevertheless, the spike in the TED spread (Treasury-EuroDollar spread, gauging default risk on interbank loans) was quite unnerving last week. While we have shown in the past that equity volatility and credit risk are joined at the hip, this parabolic move in the, up to very recently calm, TED spread disquieted us. We will keep on monitoring it closely as the coronavirus pandemic continues to unfold (Chart 4). Chart 4Disquieting
Disquieting
Disquieting
Another significant risk that this crisis has exposed is the massive non-financial business debt uptake that has taken root during the ten-year expansion (top panel, Chart 5). We deem investors will be more mindful of debt saddled companies going forward, despite the government’s sizable looming bailout of select severely affected industries from the coronavirus pandemic. Stock market reported data also corroborate the national accounts’ debt deterioration data (bottom panel, Chart 5). Chart 5Watch The Debt Burden…
Watch The Debt Burden…
Watch The Debt Burden…
The yield curve has already forewarned that a significant default cycle is looming (Chart 6) and this time is not different. Chart 6…A Default Cycle Looms
…A Default Cycle Looms
…A Default Cycle Looms
Importantly, both the equity and bond markets have been sending these debt distress signals for quite some time now (Chart 7). Chart 7Distress Signals Sent A long Time Ago
Distress Signals Sent A long Time Ago
Distress Signals Sent A long Time Ago
What interest us most from a US equity sector perspective is identifying weak spots that may come under intense pressure in the coming weeks as the economy remains shut down likely until Easter Sunday. Chart 8 shows the current level of net debt-to-EBITDA for the overall non-financial equity market, and the 10 GICS1 sectors (we use telecom services instead of communications services and exclude financials). In more detail, the bar represents the 25 year range of net debt-to EBITDA and the vertical line the current reading for each sector (Appendix 1 below showcases the net debt-to-EBITDA time series for the GICS1 sectors). Chart 8Mind The…
What Is Priced In?
What Is Priced In?
Chart 9 goes a step further and juxtaposes EV/EBITDA with net debt-to EBITDA on a two dimensional map. Real estate and utilities clearly stand out as the most debt burdened sectors, with a pricey valuation (For completion purposes Appendix 2 below delves deeper into sectors and shows net debt-to-EBITDA for the GICS2 sectors). Chart 9…Outliers
What Is Priced In?
What Is Priced In?
Frequent US Equity Strategy readers know that we believe the excesses this cycle have been in the commercial real estate (CRE) segment of the economy, where prices are one standard deviation above the previous peak and cap rates have collapsed to all-time lows fueled by an unprecedented credit binge (Chart 10). This week we reiterate our underweight stance in the S&P real estate sector and boost a defensive tech services index to an overweight stance. Chart 10CRE: The Epitome This Cycle’s Excesses
CRE: The Epitome This Cycle’s Excesses
CRE: The Epitome This Cycle’s Excesses
Reality Bites We continue to recommend investors avoid the S&P real estate sector. For investors seeking defensive protection we would recommend hiding in the S&P health care sector instead, as we highlighted in our mid-March report.4 Chart 11 shows a disturbing breakdown in the inverse correlation between the relative share price ratio and the 10-year Treasury yield. While it makes intuitive sense that this fixed income proxy sector (i.e. high dividend yielding) should move in the opposite direction of the competing risk free yielding asset, at times of tumult this correlation reverts to positive (top panel, Chart 11). In other words, fear grips investors and they frantically shed REITs despite the fact that interest rates collapse. Why? Because these are highly illiquid assets that these REITs are holding and investors demand the “return of” their capital instead of a “return on” their capital when volatility and credit risk soar in tandem (see TED spread, Chart 4). While CRE prices remain extended and vulnerable to a deflationary shock (bottom panel, Chart 11), there is no real price discovery currently as no landlord would dare put any properties for sale in this market starved for liquidity. With the exception of distressed sales, we deem that the “mark to model” mantra will make a comeback, eerily reminiscent of the GFC. Using an example of how all this may play out in the near-term is instructive. As the economy remains shut down, a tenant may forego a rent payment to a landlord and if the landlord is levered and starved of cash, he/she in turn may miss a debt payment to the outfit that holds his mortgage, typically a bank. Chart 11Breakdown
Breakdown
Breakdown
At first sight this may not seem as a big problem on a micro level as the bank may have enough liquidity to withstand a delinquent borrower’s no/late payment. If, however, the bank is itself scrambling for cash, it will foreclose and then put this asset for sale in order to recover some capital. This will put downward pressure on the underlying asset’s price that all borrowing was based upon and a debt deflation spiral ensues (Chart 12). Chart 12Debt Deflation Warning
Debt Deflation Warning
Debt Deflation Warning
The biggest problem however arises from the bond market. If these deflating assets are all in a CLO or concentrated in a select REIT, then our current financial system setup is not really equipped to handle a failure/delay of payment. This is especially true if some bond holders have hedged their bets and bought CDS on these bonds and demand payment as a “default clause” will in practice get triggered. The longer the economy remains shut down, the higher the credit, counterparty and default risks will rise. Therefore, given that the real estate sector has an extremely high reading on a net debt-to-EBITDA basis (Chart 8), we are concerned about the profit prospects of this niche sector in the coming months. Moreover, the economy is in recession and the recent Markit services PMI is a precursor of grim data to follow. Historically, REITs move in the opposite direction to the PMI services survey and the current message is to expect a catch down phase in the former (Chart 13). Adding insult to injury, the supply response especially on the multi-family construction side is perturbing. In fact, multi-family housing starts have gone parabolic hitting 619K recently, the highest reading since 1986! Such a jump in supply is deflationary and will weigh on the relative share price ratio (multi-family starts shown inverted, bottom panel, Chart 13). Chart 13Tiiimber
Tiiimber
Tiiimber
Finally, lofty valuations warn that if our bearish thesis pans out in the coming months, there is no cushion left to absorb a significant profit shock that likely looms (Chart 14). Chart 14No Valuation Cushion
No Valuation Cushion
No Valuation Cushion
In sum, grim macro data, the rising threat of a debt deflation spiral, poor operating metrics and lofty valuations, all warn that the path of least resistance is lower for REITs. Bottom Line: Shy away from the S&P real estate sector. The ticker symbols for the stocks in this index are: BLBG: S5RLST – CCI, AMT, PLD, EQIX, DLR, PSA, SBAC, AVB, EQR, FRT, SPG, WELL, ARE, CBRE, O, BXP, ESS, EXR, DRE, PEAK, HST, MAA, UDR, VTR, WY, AIV, IRM, PEG, VNO, SLG. Boost Data Processing To Overweight We have been offside on the data processing tech sub-index and today we are booking losses of 39% and boosting exposure to overweight. Data processing stocks are a services-based defensive tech index that typically thrive in deflationary and recessionary environments, according to empirical evidence (Chart 15). We are currently in recession, thus a deflationary impulse will grip the economy and investors will flock to defensive tech stocks when growth is scarce. Tack on the spike in the greenback, and the disinflationary backdrop further boosts the allure of these tech services stocks (third panel, Chart 15). Beyond the recessionary related tailwinds, data processing stocks should also enjoy firming relative demand. While the two bellwether stocks, V and MA, will suffer from the decrease in consumption that requires physical visits and from select services outlays that are severely affected by the coronavirus, online spending by households and corporations should at least serve as a partial offset. Chart 15Time To Buy Defensive Tech
Time To Buy Defensive Tech
Time To Buy Defensive Tech
Chart 16What’s not To Like?
What’s not To Like?
What’s not To Like?
Already, industry pricing power gains have been accelerating at a time when overall inflation has been tame. This will boost revenues – and given high operating leverage and high and rising profit margins – that will flow straight through to profits (Chart 16). While relative profit growth and sales estimates may appear uncharacteristically high and unrealistic to attain, this is what usually transpires in recessions: sell side analysts trim SPX profit and revenue forecasts more aggressively than they do for the defensive data processing index (Chart 17). In fact, given that we are still in the early stages of recession, we expect a further surge in relative EPS and sales estimates in the coming months. Chart 17Seeking Growth When Growth Is Scarce
Seeking Growth When Growth Is Scarce
Seeking Growth When Growth Is Scarce
Chart 18Risk: Lofty Valuations
Risk: Lofty Valuations
Risk: Lofty Valuations
However, there is a key risk to our bullish stance in this tech service index: valuations. Relative valuations are still pricey despite the recent fall from three standard deviations above the historical mean to half that, according to our relative valuation indicator. Technicals have also corrected from an extremely overbought reading, but a cleansing washout has yet to occur (Chart 18). Netting it all out, firming operating metrics and the defensive nature of tech services at a time when macro data are about to nosedive, compel us to boost the S&P data processing index to overweight. Bottom Line: Boost the S&P data processing index to overweight today from previously underweight for a loss of 39% since inception. The ticker symbols for the stocks in this index are: BLBG: S5DPOS – ADP, V, MA, PYPL, FIS, FISV, GPN, PAYX, FLT, BR, JKHY, WU, ADS. Anastasios Avgeriou US Equity Strategist anastasios@bcaresearch.com Appendix 1 Chart A1Appendix A1
Appendix A1
Appendix A1
Chart A2Appendix A2
Appendix A2
Appendix A2
Appendix 2 Chart A3
What Is Priced In?
What Is Priced In?
Chart A4
What Is Priced In?
What Is Priced In?
Footnotes 1 Please see BCA US Equity Strategy Daily Report, “Housekeeping” dated March 26, 2020, available at uses.bcaresearch.com. 2 Please see BCA US Equity Strategy Weekly Report, “The Darkest Hour Is Just Before The Dawn” dated March 23, 2020, available at uses.bcaresearch.com 3 Please see BCA US Equity Strategy Daily Report, “Gravitational Pull” dated March 12, 2020, available at uses.bcaresearch.com. 4 Please see BCA US Equity Strategy Weekly Report, “Inflection Point” dated March 16, 2020, available at uses.bcaresearch.com. Current Recommendations Current Trades Strategic (10-Year) Trade Recommendations
What Is Priced In?
What Is Priced In?
Size And Style Views June 3, 2019 Stay neutral cyclicals over defensives (downgrade alert) January 22, 2018 Favor value over growth May 10, 2018 Favor large over small caps (Stop 10%) June 11, 2018 Long the BCA Millennial basket The ticker symbols are: (AAPL, AMZN, UBER, HD, LEN, MSFT, NFLX, SPOT, TSLA, V).