Sectors

Highlights Wells Fargo’s path, before and after deregulation, has been similar to every other SIFI bank’s: It began by serving a single area in a single state, expanded within the state, and then pieced together its regional and national footprint via combinations. A review of 50 years of Wells Fargo’s financials offers multiple insights into the way that banking has evolved at the regional and SIFI bank level: Several community banks are at risk amidst the economy’s unprecedentedly sudden stop, but the overall banking system’s health turns on the condition of the regional banks and the SIFIs. Larger banks are far less reliant on lending than they used to be, … : Net interest income has contributed just 53% of Wells Fargo’s revenues since 2009. The banks would prefer wider net interest margins, but narrow ones won’t wreck their earnings power. … have considerably more capital, and are holding more cash, Treasury and agency securities to stabilize the asset side of the balance sheet: The big banks have two sources of additional ballast: more equity capital to absorb losses, and more stable asset portfolios to limit them in the first place. Feature We are top-down researchers at BCA, using macro data to make conclusions about how financial markets will fare against the economic backdrop they’ll face in the future. We also occasionally glean macro insights from micro data, which we are happy to incorporate into our process when it helps augment our understanding. Wells Fargo is a good proxy for the SIFIs and regional banks which make up the heart of the banking system, because it traveled the same serial acquisition path as its peers once prohibitions on interstate banking began to be eased in the mid-‘80s, and were wiped away for good in 1994. Wells Fargo makes all of its annual reports since 1969 available on its website, and their balance-sheet and income-statement detail fills in some gaps in the system-wide data available from the FDIC and the Fed. We will dig into the system-wide data in next week’s second installment of our examination of banking system vulnerability. This week, we focus on five decades of Wells Fargo data for insight into how banks have fared during the last seven recessions, and how they’re positioned heading into the current one. Banking, Then And Now A time-traveling visitor who worked in banking between the New Deal and the beginning of bank deregulation in the late seventies would find that banks fulfill the same two primary functions as they did in his/her day. They still promote financial intermediation by turning savers’ deposits into fuel for investment and accelerated consumption via loans to businesses and households, and they still administer the payments system. S/he might be unfamiliar with many of the ways they carry out those duties, however, and especially surprised at the way that lending and maturity transformation have been eclipsed. The biggest banks have become far less reliant on lending over the last 50 years, and they no longer engage in maturity transformation, ... At the largest banks, lending is no longer the be-all and the end-all, as revenue from fees has very nearly caught up to net interest income (Chart 1). After adjusting net interest income for loan-loss provisions, lending accounted for just 44% and 48% of Wells Fargo’s revenues in the 2000s in the 2010s, respectively. On that basis, fee revenue exceeded net interest income every year from 2007-2013, inclusive. The rise of fee income has made bank earnings more stable and bank capital levels less dependent on borrower fitness. Chart 1Lending Is No Longer The Only Game In Town
Lending Is No Longer The Only Game In Town
Lending Is No Longer The Only Game In Town
Banks also no longer engage in maturity transformation, or borrowing short to lend long, which placed them at the mercy of the yield curve. When it inverted, profitability was squeezed as new deposit-taking-and-lending activity became less lucrative. When the curve shifted out, even if it remained upward-sloping, there was a risk that interest expense on new short-term borrowings would exceed interest income on legacy portfolio assets. The latter is what killed the savings and loans, which were chartered expressly to channel household savings into 30-year fixed-rate home mortgages. ... so investors shouldn't obsess over the yield curve's every wiggle. There is no doubt that bank stocks have closely followed moves in the 10-year Treasury yield for the last several years, and the correlation makes some sense. With deposit rates stuck at zero, the spread between the rate banks pay for funds and the rate at which they lend them out (net interest margin), should move with long yields. Over the last two decades, however, Wells Fargo’s profitability (Chart 2, top panel) has largely detached from net interest margins (Chart 2, bottom panel). It and other banks would welcome higher long yields, but equity investors’ fixation on them is misplaced in a banking industry which has rigorously matched the duration of its assets and liabilities for decades. Chart 2NIM's Influence Has Faded
NIM's Influence Has Faded
NIM's Influence Has Faded
Bank Balance Sheets Have Become Considerably More Conservative In the wake of the 2008-9 crisis, Wells Fargo and other banks have been managed much more cautiously. The share of Wells Fargo’s assets held in cash, Treasury and agency securities is at its highest level in the last 50 years (Chart 3). Its loan-to-deposit ratio is around 50-year lows, indicating that sticky core deposits1 are amply capable of funding its loan book (Chart 4). Wells’ overall leverage,2 or the value of assets supported by each dollar of common equity, is also way down (Chart 5). All banks have de-levered from their peaks, as mandated by regulators after the 2008-9 crisis, making the banking system safer, if less profitable. Mitigating some of the drag on profits brought about by lessened leverage, banks have become considerably more efficient since the early ‘70s. The ATM has reduced the need for physical branches and staff, check processing has been streamlined, and online banking is continuing to help push costs even lower. Chart 3Playing It Safe
Playing It Safe
Playing It Safe
Chart 4Not Anywhere Close To Extended
Not Anywhere Close To Extended
Not Anywhere Close To Extended
Chart 5Safety First
Safety First
Safety First
Credit Costs: The Elephant In The Room The main concern for bank stability, profitability and capital adequacy is the effect of the economic sudden stop on credit performance. Credit performance is acutely sensitive to the business cycle, and banks have headed into this recession, as always, with very low loan-loss reserve balances (Chart 6, top panel). Loan-loss provisions, which reduce net income and chip away at capital positions, are bound to rise, suddenly and significantly (Chart 6, middle panel). (Please see the Box, below, for a brief description of the mechanics of accounting for credit impairments.) Chart 6Banks Have A Lot Of Catching Up To Do
Banks Have A Lot Of Catching Up To Do
Banks Have A Lot Of Catching Up To Do
Box: Accounting For Lending Losses Every business that makes sales on credit maintains an allowance for doubtful accounts to reflect the fact that not every bill will be paid in full. That allowance reduces the carrying value of its accounts receivable to something below their aggregate face value. Using a loan-loss reserve account, banks apply the same principle to loan repayments. The loan-loss reserve is increased by provisions for loan losses, projections of future loan losses that are immediately recognized as an expense. At the time that a bank provisions for future losses, it does not map the as-yet unrealized losses to individual loans. The value of the loans that are not going to be fully repaid are marked down once they reveal themselves, and the sum of all of the individual write-downs is aggregated as a net charge-off. Identifying individual loan impairments reduces the pool of unspecified loan-loss reserves represented by the reserve account. Net charge-offs do not have any direct impact on bank earnings or bank capital, but by consuming existing reserves, they herald a rebuild of the reserve buffer. Table 1 shows the accounting entries involved in recognizing credit losses, demonstrating the underlying rules. Provisions increase reserves and charge-offs reduce them, triggering a need for more provisions, and ensuring a continuing drain on income and equity capital. Table 1Loan-Loss Accounting
How Vulnerable Are US Banks? Part 1: A 50-Year Bottom-Up Case Study
How Vulnerable Are US Banks? Part 1: A 50-Year Bottom-Up Case Study
The current recession, emerging from the widespread shutdown of economic activity to counter COVID-19, will mark the sharpest downturn since the Great Depression. The sudden stop in activity, and borrowers’ revenue streams, should induce a high level of defaults. Perhaps Wells Fargo’s loan-loss reserves as a share of outstanding loans will ultimately exceed their 1993 peak of nearly 6.5%, following the 1990-91 recession, which wreaked particular havoc on real estate, and in California, where the bank conducted substantially all of its business. Banks would be in a tricky spot if the economy were left to face the coronavirus crisis by itself, but policymakers are doing their utmost to support it. Chart 7There's Nothing Unusual About Credit Line Exposures
There's Nothing Unusual About Credit Line Exposures
There's Nothing Unusual About Credit Line Exposures
Wells Fargo barely broke even in 1991, and its book value declined by 6%. Investors seem to fear that it, and other banks, are at risk of net losses and book value declines in 2020. With nearly $1 trillion of outstanding loans, and an annual earnings run rate of around $20 billion, Wells Fargo would appear to be at risk of a nasty capital hit if the economic effects were left alone to play themselves out. The CARES Act coronavirus relief measure, however, clearly signals that the federal government is not going to leave the economy on its own to face the recession’s ravages. As a part of the act, banks were granted the option of delaying the implementation of CECL, the new credit loss recognition standard, which would have had the effect of speeding up the recognition of losses, until the virus emergency passes. The act also provided relief from a loan modification rule, thereby encouraging banks to work out new, easier terms to prevent defaults, and allowed community banks to operate with a reduced minimum equity capital cushion. The $850 billion dedicated to supporting small business borrowers ($350 billon) and other borrowers, including airlines and companies deemed critical to national security ($500 billion) will also benefit their creditors. It is clear to us that forbearance, which will help debtors and creditors weather the social-distancing storm, has been established as a guiding principle for managing through the crisis. Policymakers are out to help banks, not to clip their wings. Investors should also recognize that a lot of lending to small businesses and industrial borrowers has migrated away from banks. They do not stand as squarely in the path of the default storm as they would have in the ‘70s, ‘80s and ‘90s. Direct-lending funds sprung up in the wake of the 2008-9 crisis like mushrooms after the rain, and publicly-traded business development companies (BDCs) have steadily grown their SMID lending share. The biggest industrial borrowers are much more likely to turn to the bond market than they are to call on a syndicate of banks. Finally, the existence of unused loan commitments has occasioned concern among commentators and investors over the last several weeks. If corporate borrowers were to tap their credit lines en masse, would banks find themselves significantly more leveraged? Not at Wells Fargo, where total unfunded lending commitments are about at the middle of their range over the past 25 years (Chart 7, top panel), and its commitments to corporate borrowers are at the low end of their range (Chart 7, second panel). Credit card borrowers may be more inclined to max out their capacity (Chart 7, bottom panel), but that may not be a bad thing for bank profits. Interest on unpaid card balances produces juicy returns, and the 2005 bankruptcy overhaul makes it more difficult to discharge credit card debt. Bullish Or Bearish? Based on what we know now, we do not expect that the SIFI banks will pose a systemic threat to the financial system. Entire industries are at risk, and a multitude of small businesses are reeling, but banks have less exposure than they have in the past, and the Fed and Congress are on a war footing to try to protect the most vulnerable parts of the economy. The looming hit to the banks may be less severe than markets expect. Banks are especially exposed to the business cycle, and the market rule is to avoid them ahead of recessions. From a fundamental perspective, though, the last seven recessions have not been so bad for Wells Fargo. Its per-share book value managed to rise in all of them except the ’90-’91 recession3 (Chart 8). The stock slid in recessions because its book value multiple was slashed (Chart 9). Chart 8Book Value Doesn't Suffer Too Much In Recessions, ...
Book Value Doesn't Suffer Too Much In Recessions, ...
Book Value Doesn't Suffer Too Much In Recessions, ...
Chart 9... But Multiples Are Regularly Crushed
... But Multiples Are Regularly Crushed
... But Multiples Are Regularly Crushed
Wells Fargo’s multiple has been slashed again; as of Friday’s close, using its December 31st book value, it had fallen by 44%, from 1.33 to 0.75, and it had been more than halved as of last Monday. It trades at just 90% of its year-end tangible book value. On our first day on an equity trading desk, an old-timer told us that you “buy ‘em at one [times book], and sell ‘em at two.” He was talking about the investment banks, but Wells Fargo’s history suggests the maxim applies to commercial banks, too. In our view, SIFI banks offer an appealing margin of safety to investors who buy them at or below their tangible book value. The degree to which individual banks’ book values fall in this quarter and beyond depends on the size of their loan-loss provisions, but the selloff appears extreme. We noted the appeal of writing out-of-the-money puts on the SIFI banks last week, when the VIX was in the high 70s. Selling those options has lost some appeal after the S&P 500’s 10% surge last week, but writing them could again be alluring if the SIFIs revisit their lows in the coming days and weeks. Doug Peta, CFA Chief US Investment Strategist dougp@bcaresearch.com Footnotes 1 Loans that exceed deposits, or very nearly match them, are a sign of potential instability because banks often rely on “hot-money” flows to fund them by offering above-market interest rates on instruments like CDs. A bank must continue to pay above-market rates to retain these flows, which are prone to leave the bank for higher interest rates elsewhere. Loan-to-deposit ratios well below 100% can be funded entirely with core deposits, like checking and savings accounts, or market-rate CDs placed with core banking customers who are unlikely to move their business. 2 A bank’s leverage is calculated by dividing its total assets by its common shareholders’ equity. 3 Book value would have shrunk in 2008 if not for the purchase of Wachovia Bank at a significant discount.
Housekeeping
Housekeeping
Frenetic trading continued unabated in the US equity markets with some bizarre moves now a daily phenomenon. One such occurrence is the positive correlation of the VIX with the SPX, which we had flagged as a negative omen in mid-February.1 Thus, risk management portfolio metrics are of the utmost importance when trading goes haywire. Following up from closing all our high-conviction trades last Friday, we are obeying all recently instituted rolling stops in our cyclical portfolio positions in order to protect profits. Our underweight position in homebuilders, and overweight positions in hypermarkets and household products have been all stopped out this week for a profit of 41%, 26% and 5%, respectively. As such, all three positions have reverted back to neutral. Bottom Line: Erratic trading patterns and heightened volatility compel us to obey our rolling stops. Book gains and move to neutral in the cyclically underweight S&P homebuilders, overweight in S&P hypermarkets and overweight in S&P household products positions for a profit of 41%, 26% and 5%, respectively. Stay tuned. Footnotes 1 Please see BCA Research US Equity Strategy Weekly Report, “Will The Fed Save The Day, Again?”, dated February 18, 2020, available at uses.bcareseach.com.
Preparing To Cash Out Of Hypermarkets
Preparing To Cash Out Of Hypermarkets
Overweight Last summer, following our recession thought experiment report1 we upgraded the S&P hypermarkets index to overweight preparing our portfolio for the inevitable recession.2 Since then, hypermarket stocks have bested the SPX by nearly 30%. The 10-year Treasury yield recently melted to 0.31%, fully discounting ZIRP, QE5 and recession. This week’s US PMI release also made for grim reading, and it will likely be a harbinger of acute economic pain in the weeks to come. Tack on the 40% jump in weekly unemployment insurance claims, and things are falling into place for additional gains in relative share prices (see chart). Following explosive gains thanks to COVID-19 driven panic, we have also instituted a rolling 10% profit taking stop from the peak gains of 36% in the most recent Weekly Report. Bottom Line: We reiterate our overweight stance in the S&P hypermarkets index, but remain disciplined as we will obey our 10% rolling stop. The ticker symbols for the stocks in this index are: BLBG: S5HYPC – WMT, COST. Footnotes 1 Please see BCA US Equity Strategy Weekly Report, “A Recession Thought Experiment” dated June 10, 2019, available at uses.bcaresearch.com. 2 Please see BCA US Equity Strategy Weekly Report, “Divorced From Reality” dated July 15, 2019, available at uses.bcaresearch.com.
Highlights China’s capital spending is likely to gradually recover in the second half of 2020. We project 6-8% growth in Chinese traditional infrastructure investment and a 30-50% increase in tech-related infrastructure investment by the end of 2020. There will not be much stimulus to boost housing demand. Commodities and related global equity sectors as well as global industrial stocks are approaching buy territory in absolute terms. Semiconductor stocks are attractive on a 12-month time horizon but still face near-term risks. Chinese property developer stocks remain at risk. Feature Chart I-1Chinese Growth Is Worse Now Than In 2008
Chinese Growth Is Worse Now Than In 2008
Chinese Growth Is Worse Now Than In 2008
Lockdowns during the Covid-19 outbreak have already caused much larger and more widespread damage to the Chinese economy than what occurred both in 2008 and in 2015 (Chart 1). Even though the spread of Covid-19 looks to be largely under control, China’s domestic economy is only in gradual recovery mode, and Chinese authorities are preparing to inject more stimulus to reinvigorate growth. The important questions are where and how large the stimulus will likely be. Infrastructure development will be the major focus this year, including both traditional and tech-related infrastructure. The former includes three categories: (1) Transport, Storage and Postal Services, (2) Water Conservancy, Environment & Utility Management, and (3) Electricity, Gas and Water Production and Supply. The latter encompasses Information Transmission, Software and Information Technology Services, such as 5G networks, industrial internet, and data centers. The current emphasis of stimulus differs from the 2009 one which was more broad-based and spanned across not only infrastructure but also the property and auto sectors. It also differs from the 2016 stimulus measures, which had a heavy emphasis on the property market. Overall, the scale of combined traditional infrastructure and property market stimulus in 2020 will be smaller than what was put forward in 2009, 2012 and 2015-‘16. We estimate Chinese traditional infrastructure investment will increase by about RMB1 trillion to RMB1.5 trillion (6-8% year-on-year), while tech-related new infrastructure investment will be boosted by RMB 240 billion to RMB400 billion (30-50% year-on-year) (Chart 2). Together, the infrastructure stimulus will be about RMB1.3 trillion to 1.9 trillion, amounting to 3.2-4.5% of nominal gross fixed capital formation (GFCF) and 1.3-1.9% of nominal GDP (Table 1). The Chinese property market is unlikely to receive much stimulus on the demand side this time as, “houses are for living in, not for speculation,” will remain the main policy mantra. That said, there will be some support for developers, helping somewhat ease extremely tight financing conditions. Chart 2Chinese Infrastructure Investment: A Boost Ahead
Chinese Infrastructure Investment: A Boost Ahead
Chinese Infrastructure Investment: A Boost Ahead
Table 1Projections Of Traditional And Tech Infrastructure Investment In 2020
Chinese Economic Stimulus: How Much For Infrastructure And The Property Market?
Chinese Economic Stimulus: How Much For Infrastructure And The Property Market?
Restarting The Infrastructure Engine Tech Infrastructure: The authorities recently repeatedly emphasized the importance of “new infrastructure”1 development. This includes 5G networks, the industrial internet, inter-city transit systems, vehicle charging stations, and data centers. Strategic investment in indigenously produced leading technologies, the ongoing geopolitical confrontation with the US and the need to boost growth are behind the government’s aim for an acceleration in “new infrastructure” investment this year. China will significantly boost the pace of its strategic 5G network deployment as well as other tech-related investment. The growth of total tech infrastructure investment was 30-40% during the 4G-network development ramp-up in 2014. As the 5G network is much more costly to build than 4G, we expect growth within tech infrastructure investment to be 30-50% this year. This translates to an increase of RMB 240 billion to RMB400 billion in tech infrastructure investment in 2020, equaling around 0.2% to 0.4% of the country’s 2019 GDP (Table 1 on page 3). Chart 3Components Of Traditional Infrastructure Investment
Components Of Traditional Infrastructure Investment
Components Of Traditional Infrastructure Investment
Traditional Infrastructure: Growth in traditional infrastructure has been weak at around 3% year-on-year in 2019, in line with our analysis last August. However, we are now expecting growth to accelerate to 6-8% by the end of this year, across all three categories of traditional infrastructure (Chart 3). In the past two months, the central government has clearly sped up the pace in reviewing and approving infrastructure projects related to power generation and distribution, transportation (railways, highways, waterways, airports, subways, etc.), and new energy. As the central government enforces increasingly stringent rules on environmental protection, investment in environmental management is likely to accelerate. Public utility management investment, which accounts for a massive 45% of overall infrastructure investment, includes sewer systems, sewer treatment facilities, waste treatment and disposal, streetlights, city roads construction, parks, bridges and tunnels. As the country’s urbanization process continues and more townships and city suburbs are developed, public utility management investment will register solid growth. The 6-8% year-on-year growth in traditional infrastructure investments by the end of this year equals to an increase of RMB1 trillion to RMB1.5 trillion in 2020. Adding up the increase of RMB 240 billion to RMB400 billion for tech-related infrastructure investment, total infrastructure spending will be RMB1.3 trillion to RMB1.9 trillion, or 1.3-1.9% of GDP (Table 1 on page 3). Bottom Line: We project 6-8% year-on-year growth in Chinese traditional infrastructure investment and a 30-50% year-on-year increase in tech-related infrastructure investment. Sources Of Infrastructure Financing Significant increases in special bond issuance, loosening public-private-partnerships (PPP) restrictions and possible Pledged Supplementary Lending (PSL) injections should enable local governments to provide sufficient funding for planned infrastructure investment projects. Net Special Bond Issuance Local government net special bond issuance, which is mainly used to fund infrastructure projects, has been one main source of financing. Last year, the amount of net special bond issuance was about RMB 2 trillion,2 accounting for about 11% of total infrastructure investment (both tech-related and traditional). This year, the annual quota on local government special bonds is still unknown, as the NPC meeting has been postponed due to the Covid-19 outbreak. Given that last year’s quota was RMB2.15 trillion, RMB 800 billion higher than in the previous year (25% growth over 2018), it is reasonable to expect the quota for 2020 will be set at RMB 3.15-3.65 trillion, a 30-35% increase from 2019. This increase alone will be able to finance 70-80% of the RMB1.3 trillion to RMB1.9 trillion additional funding required for the infrastructure investments planned for this year. Consequently, the share of special bonds in total infrastructure spending in 2020, if these projections materialize, will rise to 15-17% from 11% in 2019. Chart 4Public-Private-Partnerships Financing Will Recover This Year
Public-Private-Partnerships Financing Will Recover This Year
Public-Private-Partnerships Financing Will Recover This Year
Public-Private-Partnerships (PPP) PPPs involve a collaboration between local governments and private companies. The PPP establishment can allow the local governments to reduce local governments’ burden of financing infrastructure. Due to tightened regulations on PPP projects since late 2017, PPP financing plunged 75% from about RMB 5 trillion in 2017 to RMB 1.2 trillion in 2019. Its share of total infrastructure investment had also tumbled from nearly 30% in early 2017 to 6% in 2019 (Chart 4). However, in recent months, the Chinese government has started to loosen up the restrictions on PPP projects, by releasing three announcements within a month (Box 1). We believe recent government actions will lead to a pickup in PPP financing. Box 1 The Authorities: Loosening Up of PPP-Related Policies On February 12, the Finance Ministry released a notice demanding local governments “accelerate and strengthen PPP projects’ reserve management.” On February 28, the Finance Ministry released a contract sample of sewage water and garbage disposal projects, aiming to help local governments to more effectively proceed with such projects. On March 10, the website of the National Development and Reform Commission demanded local governments utilize the national PPP project information management and monitoring platform, actively attracting private capital and starting the projects as soon as possible. In addition, the government will likely make efforts to reduce financial and operating costs of some infrastructure projects in order to increase the risk-to-return attractiveness of such projects for private investors. The authorities may order both policy banks and commercial banks to give preferential loans to certain infrastructure projects (i.e., low-interest and long-term loans from policy banks). Moreover, the government can also provide tax breaks, offer land at a reduced cost, and other supportive policies to certain infrastructure projects. Putting it all together, we expect PPP financing to grow 10-20% and provide additional funding of RMB120 billion to RMB240 billion to China’s infrastructure development in 2020. Pledged Supplementary Lending Chart 5Possible Pledged Supplementary Lending Injections In Infrastructure Projects
Possible Pledged Supplementary Lending Injections In Infrastructure Projects
Possible Pledged Supplementary Lending Injections In Infrastructure Projects
Some Chinese government officials have hinted that policy banks may start using PSL injections to boost domestic infrastructure investment.3 Speculation among China watchers is that the scale of PSL injections will be RMB600 billion this year (Chart 5). In comparison, PSL net lending for the property market ranged from RMB 630 to 980 billion in the years 2015-2018. Bottom Line: Odds are that a significant increase in special bond issuance, loosening PPP restrictions and possible PSL injections will be sufficient to offset the decline in other funding sources. Consequently, a moderate acceleration in traditional infrastructure investment and very strong growth in tech-related infrastructure expenditures is likely. What About Stimulus In The Property Sector? Stimulus for the property sector this time will be less forceful than the ones in both 2009 and 2016. In addition, structural property demand in China has already entered a saturation phase, drastically different from previous episodes when demand still had strong underlying growth. Altogether, the outlook for property sales in China is not promising. “Houses are for living in, not for speculation” will remain the main policy focus in the Chinese property market. That said, authorities will help ease developers’ extremely tight financing conditions. No stimulus on demand: Three cities (Zhumadian, Baoji, Guangzhou) that had released policies to loosen up restrictions on the demand side (e.g., cutting down payment from 30% to 20%, allowing larger amounts of borrowing for homebuyers) were ordered to retract their announcements within a week. There will be very little PSL lending into the property market in 2020, in line with the government’s goal of curbing speculation in the property market. Some supportive polices for developers: Over 60 cities have released policies on the supply side (e.g., delaying developers’ land transaction payments, waiving fines for breaches of start and completion dates, etc.), mainly helping property developers overcome their extreme funding shortages. Given housing unaffordability and lack of demand, we expect floor space sold to contract slightly in 2020 (Chart 6, top panel). In the meantime, we expect a slight pickup in property starts (Chart 6, middle panel). In order to stay afloat, property developers have to maintain rising floor space starts for presales to gain some funding – a fund-raising scheme for Chinese real estate developers that we discussed in detail in prior reports. In addition, we also expect moderate growth in property completions in the commodity buildings market (Chart 6, bottom panel). The pace of property completion has to be accelerated as property developers are currently under increased pressure to deliver units that were pre-sold about two years ago. This will lift construction activity in the commodity buildings market (Chart 7). Chart 6Commodity Buildings: Divergences Among Sales, Starts And Completions
Commodity Buildings: Divergences Among Sales, Starts And Completions
Commodity Buildings: Divergences Among Sales, Starts And Completions
Chart 7Commodity Buildings: Construction Activities
Commodity Buildings: Construction Activities
Commodity Buildings: Construction Activities
Please note that commodity buildings are a small subset of total constructed buildings in China, and as a subset do not provide a full picture of construction activity. The official data show that commodity buildings account for only 24% of total constructed buildings in terms of floor space area completed. In terms of a broader measure of the Chinese property market, we still expect a continuing contraction – albeit less than last year – in “building construction” floor area started and completed (Chart 8). Bottom Line: There will not be much stimulus to boost housing demand. Yet authorities will ease financial constraints on property developers that will allow them to complete housing currently under construction. Chart 8Building Construction Versus Commodity Housing
Building Construction Versus Commodity Housing
Building Construction Versus Commodity Housing
Chart 9Commodities And Related Equity Sectors Are Approaching A Bottom
Commodities And Related Equity Sectors Are Approaching A Bottom
Commodities And Related Equity Sectors Are Approaching A Bottom
Investment Implications Traditional infrastructure spending in China will post a moderate recovery in 2020, with most gains occurring in the second half of the year. Consistently, we believe the segments of Chinese and global markets leveraged to the infrastructure cycle – commodities and related equity sectors as well as industrial stocks – are approaching buying territory in absolute terms. Prices of segments have collapsed, creating a good entry point in the coming weeks (Chart 9, 10 and 11). Chart 10A Buying Time May Be Not Far For Industrial Stocks…
A Buying Time May Be Not Far For Industrial Stocks...
A Buying Time May Be Not Far For Industrial Stocks...
Chart 11…And Machinery Stocks
...And Machinery Stocks
...And Machinery Stocks
China’s spending on itech-related infrastructure will post very strong growth in 2020. Even though global semiconductor stocks have sold off considerably, they have not underperformed the global equity benchmark. In the near term, we believe risks are still to the downside for technology and semi stocks (Chart 12). However, this down-leg will create a good buying opportunity. We are watching for signs of capitulation in this sector to buy. Finally, concerning Chinese property developers, their share prices will likely underperform their respective Chinese equity benchmarks in the next nine months (Chart 13). Meanwhile, the absolute performance of property stocks listed on the domestic A-share market remains at risk (Chart 13, bottom panel). Chart 12Semi Stocks: Final Down-leg Is Possible
Semi Stocks: Final Down-leg Is Possible
Semi Stocks: Final Down-leg Is Possible
Chart 13Chinese Property Developers Are Still At Risk
Chinese Property Developers Are Still At Risk
Chinese Property Developers Are Still At Risk
Ellen JingYuan He Associate Vice President ellenj@bcaresearch.com Footnotes 1 To gauge the scale of the “new infrastructure”, we are using the National Bureau of Statistics data of “investment in information transmission, software and information technology service”. This tech-related infrastructure investment measure includes 5G networks, industrial internet, and data centers, while inter-city transit systems and vehicle charging stations may be included in the transportation investment. 2 Please note that the amount of net special bond issuance was the actual amount of funding used in infrastructure projects. It was smaller than the RMB 2.15 trillion quota because a small proportion of issuance were used to repay some existing special bonds due in the year. 3 http://www.xinhuanet.com/money/2020-02/19/c_1125593807.htm
Highlights Portfolio Strategy We have identified 20 reasons to start buying equities. We highlight positive catalysts that should underpin the equity market as the pandemic progresses. Investors with higher risk tolerance should continue to layer in slowly and put cash to work with a cyclical 9-12 month time horizon. Consumer staples in general and hypermarkets and household products in particular are defensive areas where we are comfortable to deploy fresh longer-term oriented capital. Recent Changes Erratic trading compelled us to close out all our high-conviction calls for the year last Friday, booking handsome gains for our portfolio.1 Table 1
"The Darkest Hour Is Just Before The Dawn"
"The Darkest Hour Is Just Before The Dawn"
Feature Equities oscillated violently last week and remain mostly rudderless (Chart 1). While the relentless COVID-19 news bombardment kept on feeding the bears, on the flip side monumental monetary easing and fiscal packages the world over emboldened the bulls. This tug of war is far from over, but it is becoming crystal clear that both monetary and fiscal authorities will throw the proverbial kitchen sink at it until the hemorrhaging stops. Last week we showed that it takes a median two full years for the SPX to make fresh all-time highs following a bear market.2 This week we highlight the median and mean profile of the bear market recoveries since WWII (Chart 2). Crudely put, if history at least rhymes the SPX will not make any fresh all-time highs until early 2022. Chart 1Rudderless
Rudderless
Rudderless
Chart 2Profile Of A Bear
Profile Of A Bear
Profile Of A Bear
As a reminder, our equity market roadmap for the next few months is a drawn out consolidation phase leaving investors ample time to shift portfolios and put cash to work. This bottoming roadmap is something akin to the 1987, 2011, 2015/16 or early-2018 episodes.3 We cannot rule out further downside to equities. Moreover, we can neither time the tops nor the bottoms. However, the same way we were cautioning investors not to chase this market higher – as we were not willing to risk 100-200 points of SPX upside for a potential 1000 point drawdown – we are now compelled to nibble on the way down. Turning over to volatility, the VIX hit 85.47 intraday last week and clocked its highest close since the history of the data. Its sibling the VXO (volatility on the OEX or S&P 100) that predated the VIX hit an intraday high of 172.79 on Tuesday, following Black Monday, October 20, 1987, and clearly warns that if another crash takes root the VIX will explode higher.4 Importantly, vol at 85 translates into a 25% move in the SPX, in either direction, in the next 30 days. Chart 3 shows that actual SPX realized volatility jumped to 103 last week, trumping the VIX’s spike. Historically, when realized volatility trumps the VIX, it is time to sell the VIX; the opposite is also true. Given that we still do not expect a repeat of the GFC, or a depression, we recommend investors with higher risk tolerance start to deploy long-term oriented capital in the equity market. Chart 3Realized Versus Implied Vol
Realized Versus Implied Vol
Realized Versus Implied Vol
Below are 20 reasons to start buying equities. We highlight positive catalysts that should underpin the equity market as the pandemic progresses. We are already in recession. Markets trough in recessions and historically offer enticing risk/reward return profiles. China’s manufacturing PMI and other hard data fell below the GFC lows. As a general rule of thumb investors should buy stocks when the global PMI is well below 50 (Chart 4). Cupboards are bare. A drawdown in inventories is usually followed by a jump in production. That is one of the reasons to be bullish staples. As for durables, pent-up demand due to delayed purchases will eventually be violently unleashed, especially given zero rates. Consumers will benefit from the oil market carnage and the super low mortgage refinancing rates. The Fed cut rates to zero, did QE5, and brought back the alphabet soup of programs like CPFF, PDCF and MMLF from the GFC, more will likely follow (Chart 5). Chart 4Time To Buy
Time To Buy
Time To Buy
Chart 5The Fed Put
The Fed Put
The Fed Put
The DXY has gone from 95 on March 9 to 103 on Friday. King dollar will soon have to reverse course and provide some much-needed relief globally as the Fed’s US dollar swap lines aim to alleviate the shortage of US dollars (Chart 6). Keep in mind what Dr. Bernanke told Scott Pelley in a 60 Minutes interview with regard to money creation: “PELLEY: Is that tax money that the Fed is spending? BERNANKE: It's not tax money. The banks have accounts with the Fed, much the same way that you have an account in a commercial bank. So, to lend to a bank, we simply use the computer to mark up the size of the account that they have with the Fed (emphasis ours). So it's much more akin to printing money than it is to borrowing.”5 Other global Central Banks are cutting rates and doing QE. Beyond Christine Lagarde’s recent €750bn bazooka, the ECB has the OMT ready from previous crises. Already last week the ECB intervened in Italian BTPs via Banca d’Italia. Germany has hinted that it would not be opposed to a “Covid-bond” A mega US fiscal package looms near the $1tn mark.6 The recession-related automatic stabilizers and government spending will soar. China’s fiscal response will likely be as large as in late 2008 (as a reminder in Q4/2008 the Chinese fiscal spending announcement equated “to 12.5% of China’s GDP in 2008, to be spent over 27 months”7). Germany and a slew of other countries have already pledged fiscal spending. Spain has announced a 20% of GDP package. Countries will bid-up the size of the bailout. IMF announced a $1tn bailout package. Nibbling at stocks when the VIX is at 85 makes sense versus when the VIX is at 12 (Chart 7). Chart 6Greenback Falls And Rates Rise When The Fed Does QE
Greenback Falls And Rates Rise When The Fed Does QE
Greenback Falls And Rates Rise When The Fed Does QE
Chart 7Compelling Entry Point
Compelling Entry Point
Compelling Entry Point
The yield curve slope is steepening (Chart 8). Chart 8The Yield Curve Always Leads Stocks
The Yield Curve Always Leads Stocks
The Yield Curve Always Leads Stocks
The 10-year real Treasury yield hit a low of -50bps that indicator has also priced in recession (Chart 7). Chart 9Recession Nearly Fully Priced In
Recession Nearly Fully Priced In
Recession Nearly Fully Priced In
Equity market internals have fully priced recession, small caps and weak balance sheet stocks in particular (Chart 9). Sentiment is washed out as per our Capitulation, Sentiment and Complacency-Anxiety Indicators (Chart 9). Bernie Sanders has lost his bid to become the nominee of the Democratic Party. Buffett will either bailout a company or two or buyout a company he likes. Jamie Dimon and/or other prominent CEOs (insiders) will start buying their own company stock. Social-distancing measures in the West will ultimately break the Epidemic Curve first derivative and arrest the panic. Even if COVID-19 comes back in force, the fact is that most of the patients who succumb to it are elderly. In Italy, the average age of death is 80 years old. As such, the final circuit-breaker ahead of a GFC would be desensitization by the population, as selective quarantines – targeting the elderly cohorts – get implemented in order to allow other people to return to work. Furthermore, two “silver bullet” solutions remain as tail risks to the bearish narrative. First, a biotech or pharmaceutical company may make a breakthrough in the fight against COVID-19. Not necessarily a vaccine, but a treatment. Finally, upcoming warm weather in the northern hemisphere may also help the fight against the virus. Nevertheless, there are some risks we are closely monitoring. First, if we are offside and this turns into a GFC, another big down-leg will ensue. One reason for this would be a Spanish Flu parallel where the second wave of deaths trounced the first wave. In that case, the GDP contraction will be longer-lived and SPX EPS will suffer a long-lasting setback. Second, a credit crunch can cause a credit event, which is a big risk as we have been highlighting recently. Counter party as well as bank insolvency risks will also come into play. Third, non-financial non tech corporate net debt-to-EBITDA is at all-time highs according to company reported data and non-financial corporate debt as a percent of GDP is at all-time highs according to national accounts (Chart 10). Finally, while lower rates are helpful in the long run, a long era of low rates in Japan and more recently the euro area have not helped equities in the longer-term. The NIKKEI 225 is still down 58% from the December 1989 all-time highs and the MSCI Eurozone index is down 46% from the March 2000 all-time highs (Chart 11). Chart 10Risk: Too Much Indebtedness
Risk: Too Much Indebtedness
Risk: Too Much Indebtedness
Chart 11Japan And The Euro Area Are Scary ZIRP Parallels
Japan And The Euro Area Are Scary ZIRP Parallels
Japan And The Euro Area Are Scary ZIRP Parallels
Netting it all out, following a nine-month cyclical period of being in the bearish camp, we are now selectively nibbling on stocks with a 9-12 month time horizon, as we deem the potential positive catalysts will overwhelm the few risks that we are closely monitoring. This week we reiterate our overweight stance in the second largest defensive sector – the S&P consumer staples index – and two of its key sub-components. Continue To Favor Defensive Staples… Consumer staples stocks have caught on fire lately as investors have been seeking refuge in defensive equities during the current “risk off” phase. Behind health care (15.6% of the SPX weight), their safe haven siblings, staples are the second largest defensive sector comprising 8.5% of the S&P 500, and we reiterate our overweight stance in this sector. Historically, staples equities thrive in recessions and in deflationary/disinflationary environments. The reason is the allure of their stable cash flows especially in times of duress when growth is really hard to come by, a staples company growing revenues 5%/annum is sought after aggressively. Currently, relative share prices have troughed near the GFC bottom, and are probing to break out of the one standard deviation below the historical time trend mean (Chart 12), offering a compelling entry point to deploy new capital. Chart 12Bouncing
Bouncing
Bouncing
Last week’s jump in unemployment insurance claims to 281,000 is a small precursor of things to come as more parts of the US get locked down (middle panel, Chart 13). This recessionary backdrop, coupled with the surging VIX, which will take months to die down to 20 near the historical average, and investors hiding in Treasurys all argue that it pays to stay with defensive staples stocks (top & bottom panels, Chart 13). Two of our preferred vehicles to continue to explore an overweight in the consumer staples sector are via above benchmark allocation in both hypermarkets and household products stocks. Chart 13Sticks With Staples
Sticks With Staples
Sticks With Staples
…Stick With Hypermarkets… Last summer, following our recession thought experiment report8 we upgraded the S&P hypermarkets index to overweight preparing our portfolio for the inevitable recession.9 Since then, hypermarket stocks have bested the SPX by over 36%. While a consolidation phase looms that will allow hypermarkets to build a base before vaulting higher, today we are instituting a rolling 10% stop from the highs in order to protect handsome gains for our portfolio. The savings rate more than trebled from the GFC lows as the once in a generation Great Recession scared consumers. The savings rate has remained elevated ever since and is primed to rise further in the current recession as consumers tighten their purse strings. Historically, relative share prices and the savings rate have been positively correlated as even wealthier consumers opt for rock bottom selling price points. The current message is to expect a durable bidding up phase of hypermarket equities (Chart 14). Chart 14When The Going Gets Tough, Buy Hypermarkets
When The Going Gets Tough, Buy Hypermarkets
When The Going Gets Tough, Buy Hypermarkets
The soaring greenback is underpinning these pricing strategies from Big Box retailers as it keeps import prices in deflation, allowing retailers to pass these on to the consumer (fourth & bottom panels, Chart 15). The recent drubbing in oil prices is an added catalyst to boost hypermarket equities as lower prices at the pump will translate into more cash in consumers’ wallets (top panel, Chart 15). Keep in mind that WMT is the number one grocery store in the US with near 25% market share – COST is also a large mover of US groceries – thus the coronavirus pandemic will not deal a blow to their demand profile. Chart 15Defense Is…
Defense Is…
Defense Is…
The 10-year Treasury yield recently melted to 0.31%, fully discounting ZIRP, QE5 and recession. Last week’s Philly Fed survey made for grim reading, a harbinger of acute economic pain in the weeks to come. Tack on the 40% jump in weekly unemployment insurance claims, and things are falling into place for additional gains in relative share prices (Chart 16). Finally, overall tighter financial conditions and the more than doubling in the junk spread also corroborate that the path of least resistance remains higher for hypermarket equities (second & middle panels, Chart 15). Bottom Line: We reiterate our overweight stance in the S&P hypermarkets index. Today, we are also instituting a risk management metric in order to protect profits: we are implementing a rolling 10% stop from the highs in order to protect gains. The ticker symbols for the stocks in this index are: BLBG: S5HYPC – WMT, COST. Chart 16…The Best Offense
…The Best Offense
…The Best Offense
…And Overweight Household Products Household products stocks have recently bounced off of long-term support and have sling shot higher (Chart 17). While we continue to recommend an above benchmark allocation of this safe haven index, we are also obliged to initiate a 5% rolling stop in order to protect our recent explosive gains. We reckon that the COVID-19 experience will scar consumers and alter behaviors with long lasting effects. We doubt this sanitization craze will completely subside following the passing of the pandemic. Our sense is that use of disinfectants and cleaning products in general will experience a parallel shift higher in the demand curve. Chart 17Held The Line
Held The Line
Held The Line
Therefore, consumer outlays on household products will continue to gain share from the overall spending pie and underpin relative share prices (top panel, Chart 18). US household products exports are another important source of demand for the industry. Exports recently ticked higher and the coronavirus pandemic underscores that US manufacturers that are held in high regard abroad especially sanitation household products will struggle to meet export demand (bottom panel, Chart 18). Domestically, overall grocery store level wholesale selling prices are expanding smartly paving the way for a similar trajectory for household products pricing power (second panel, Chart 18). Importantly, given the recent consumer behavior, shortages all but assure that non-durable goods factories will be humming at a time when almost all other industries will grind to a halt (third panel, Chart 18). Moreover, household products are part of consumer goods that have a fairly inelastic demand profile and really shine during recessions. The recent collapse of the Philly Fed survey heralds a durable outperformance phase for household products equities (Chart 18). While relative valuations appear expensive, relative forward EPS and revenues are slated to trail the market in the coming 12 months. If our thesis pans out then household products stocks will grow into their pricey valuations as profits will overwhelm (Chart 19). Chart 18Demand Driven Advance
Demand Driven Advance
Demand Driven Advance
In fact, our macro based S&P household products sale per share growth model does an excellent job in capturing all these drivers and signals that top line growth will continue to accelerate for the rest of the year (Chart 20). Chart 19Low Bar To Surpass
Low Bar To Surpass
Low Bar To Surpass
Chart 20Macro Model Says Buy
Macro Model Says Buy
Macro Model Says Buy
Bottom Line: Stick with the S&P household products index, but institute a 5% rolling stop from the highs in order to protect profits. The ticker symbols for the stocks in this index are: BLBG: S5HOPRX – PG, CL, KMB, CLX, CHD. Anastasios Avgeriou US Equity Strategist anastasios@bcaresearch.com Footnotes 1 Please see BCA US Equity Strategy Daily Report, “Closing Out All High-Conviction Calls” dated March 20, 2020, available at uses.bcaresearch.com. 2 Please see BCA US Equity Strategy Weekly Report, “Inflection Point” dated March 16, 2020, available at uses.bcaresearch.com. 3 Please see BCA US Equity Strategy Daily Report, “Gravitational Pull” dated March 12, 2020, available at uses.bcaresearch.com. 4 http://www.cboe.com/products/vix-index-volatility/vix-options-and-futures/vix-index/vix-historical-data 5 https://www.cbsnews.com/news/ben-bernankes-greatest-challenge/2/ 6 Please see BCA US Equity Strategy Daily Report, “Don’t Be A Hero” dated March 11, 2020, available at uses.bcaresearch.com. 7 https://www.oecd.org/gov/budgeting/Public%20Governance%20Issues%20in%20China.pdf 8 Please see BCA US Equity Strategy Weekly Report, “A Recession Thought Experiment” dated June 10, 2019, available at uses.bcaresearch.com. 9 Please see BCA US Equity Strategy Weekly Report, “Divorced From Reality” dated July 15, 2019, available at uses.bcaresearch.com. Current Recommendations Current Trades Strategic (10-Year) Trade Recommendations
"The Darkest Hour Is Just Before The Dawn"
"The Darkest Hour Is Just Before The Dawn"
Size And Style Views June 3, 2019 Stay neutral cyclicals over defensives (downgrade alert) January 22, 2018 Favor value over growth May 10, 2018 Favor large over small caps (Stop 10%) June 11, 2018 Long the BCA Millennial basket The ticker symbols are: (AAPL, AMZN, UBER, HD, LEN, MSFT, NFLX, SPOT, TSLA, V).
In our 20+ years in the equity markets we have rarely seen such erratic moves on a daily basis across sectors and subindustries. While our portfolio has withstood the recent tremor, our confidence has taken the back seat with regard to our high-conviction calls for the year initiated in the December 2, 2019 report.1 Therefore we are closing out all high-conviction trades, both overweights and underweights, for a combined relative net gain of 27% (and average gain of 3.4%) since inception. In more detail, our underweight in homebuilders, preference of large caps to small caps and underweight in semi cap names have netted us 43%, 26%, and 6% in gains, respectively (see Charts 1& 2below). On the flip side, the overweight in banks and machinery and underweight in utilities have shaved off 25%, 13% and 12%, respectively (see Charts 1&2 below). Table 1 summarizes all our profits and losses. Further, from a portfolio management perspective we are instituting a rolling 10% stop from the highs on two extremely volatile cyclical positions in order to protect gains: our overweight in the S&P homebuilders index is up 51% since the October 2019 inception, and our large cap over small cap preference is up 45% since the May 2018 inception. Bottom Line: We are moving to the sidelines on the high-conviction calls for the year and are closing out all eight positions for a net gain of 27% (and average gain of 3.4%), since inception. Stay tuned.
Closing Out All High-Conviction Calls
Closing Out All High-Conviction Calls
Chart 1
High-Conviction: Overweights
High-Conviction: Overweights
Chart 2
High-Conviction: Underweights
High-Conviction: Underweights
1 Please see BCA US Equity Strategy Weekly Report, “2020 Key Views: High-Conviction Calls” dated December 2, 2019, available at uses.bcaresearch.com.
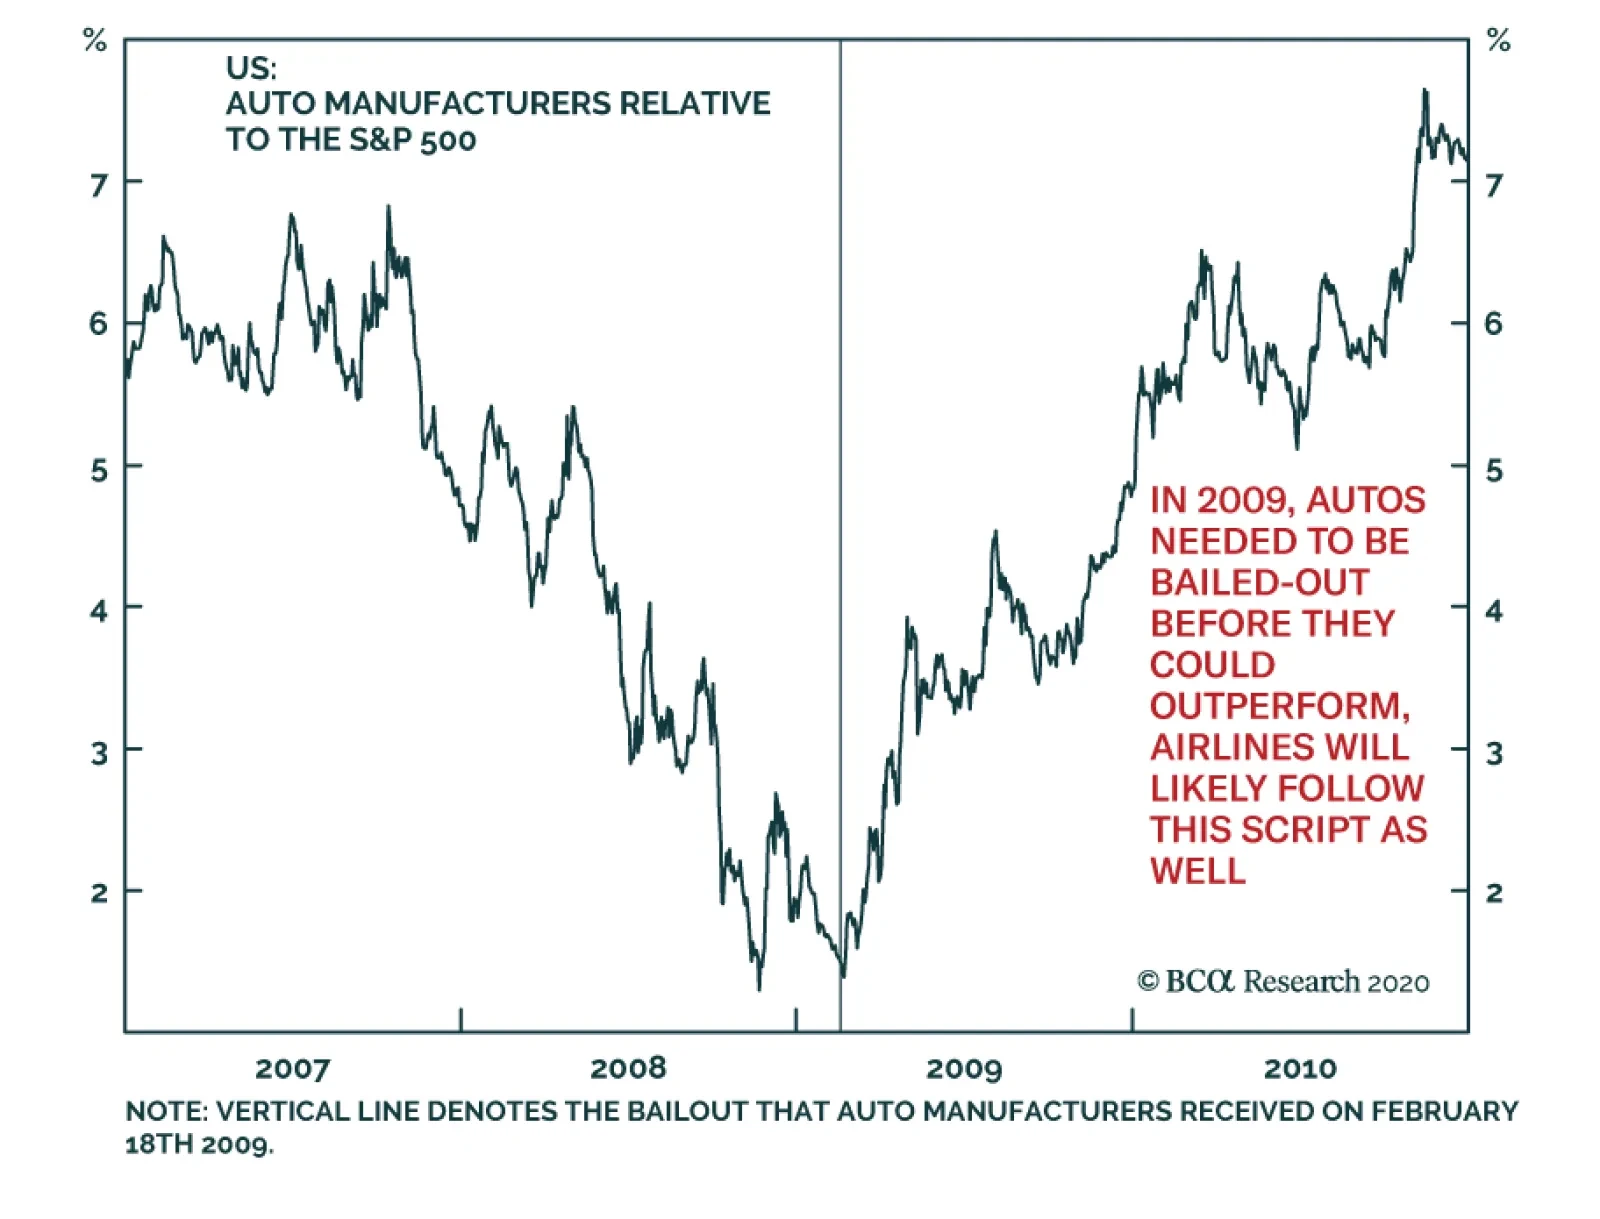
US airlines have encountered great turbulence due to COVID-19. They trade at a large discount to the S&P 500. Moreover, they have become massively oversold. While a short-term bounce is possible, it is unlikely to be more than a dead-cat bounce. The…
Hiding In Health Care
Hiding In Health Care
Overweight We recommend investors continue to take refuge in health care stocks within the defensive universe as the coronavirus pandemic unfolds. If severe government measures are a prerequisite to stop the spread of the virus then growth will suffer a massive setback. Were President Trump to eventually take draconian measures similar to what the Italian Prime Minister imposed recently, and to effectively shut down the country, then PCE will collapse. In fact, PCE excluding health care will take a beating. Health care outlays will rise both in absolute terms and relative to overall spending (see chart, second & third panels). Given the safe haven status of the S&P health care index and the stable cash flows these businesses command, when growth is scarce, investors flock to any source of growth they can come by and health care stocks definitely fit that bill. The implication is an earnings-led durable health care sector outperformance phase, a message that our relative macro EPS growth model is forecasting for the rest of the year (see chart, bottom panel). Bottom Line: We reiterate our overweight recommendation in the largest market capitalization weighted defensive sector in the SPX, the S&P health care sector. For more details, please refer to this Monday’s Weekly Report.
Dear Client, Next week we will be publishing a joint Special Report on the Chinese infrastructure investment outlook with our Emerging Markets Strategy service, authored by my colleague Ellen JingYuan He. Best regards, Jing Sima, China Strategist Feature Chart I-1Chinese Non-Financial Corporations Are Heavily Indebted
Chinese Non-Financial Corporations Are Heavily Indebted
Chinese Non-Financial Corporations Are Heavily Indebted
There are fears that the two-month hiatus in China’s business activities due to the COVID-19 epidemic has sparked acute cash shortages among Chinese companies. In turn, this has increased the danger that the highly leveraged Chinese corporate sector may be pushed into widespread insolvency (Chart I-1). The number of bankruptcies will undoubtedly climb, but small and micro firms are most at risk versus larger companies that have deeper cash reserves and easier access to financing. Our analysis shows that, before the outbreak hit China in January, companies listed in China’s onshore and offshore equity markets exhibited relatively healthy financial statements with adequate operating cash flows to cover debt obligations. This increases the probability that Chinese listed companies will survive the economic and financial shocks from the epidemic, and that their stock prices will rebound along with the expectations of a recovery in the Chinese economy. Chart I-2Both Chinese Economy And Corporate Profits Are Largely Driven By Domestic Demand
Both Chinese Economy And Corporate Profits Are Largely Driven By Domestic Demand
Both Chinese Economy And Corporate Profits Are Largely Driven By Domestic Demand
It also appears that China’s domestic economy is relatively insulated from the global financial market turmoil and impending global recession. China’s corporate profit outlook is dominated by domestic economic conditions rather than external demands. This view is also reflected in the relative performance of Chinese onshore and offshore stocks (Chart I-2). Moreover, the charts in the Appendix illustrate that corporate financial ratios in almost all sectors of China’s onshore and offshore equity markets have somewhat improved from the previous economic down cycle that began in 2014. This underscores our view that if reflationary measures overcompensate for the economic slowdown, as in the 2015/2016 easing cycle, then Chinese stocks will likely rally in absolute terms, as well as outperform global benchmarks. We selected three categories of financial ratios to monitor profitability, leverage and operating cash flow conditions of Chinese domestic and investable listed non-financial companies (Table I-1).1 The financial data in our exercise are from Refinitiv Datastream Worldscope. Its corresponding stock price indexes for China’s overall market and sectors most closely resemble the MSCI China Index and the MSCI China Onshore index. Table I-1
Monitoring Cash Flow Conditions In Chinese Listed Companies
Monitoring Cash Flow Conditions In Chinese Listed Companies
It is also noted that the Chinese investable index, excluding financial companies, is dominated by large technology companies such as Alibaba, Tencent, and Baidu.2 These tech companies generally have more adequate cash flows and lower debt ratios than the more capital intensive sectors such as industrial and energy. The analysis we present in this report on non-financial companies in the offshore market, therefore, is not indicative of China’s overall corporate financial health. Rather, our findings are indicative of how investors should view the listed companies and their sector performance within China’s investable market. Several observations from our analysis of the listed companies’ financial ratios are noteworthy: Chinese non-financial corporations are highly leveraged, and have not de-levered much despite the financial deleverage campaign that began in late 2017. Contrary to the belief that Chinese corporates’ financial health is significantly weaker than that in developed economies, the leverage ratio, profit margins, and debt-servicing ability among Chinese domestic and investable non-financial companies are actually in the range of their global peers (Chart I-3). Yet, Chinese companies trade at substantial discounts to global benchmarks. This is particularly evident in the offshore market, whereas domestic Chinese stocks were priced at a discount until the recent global market selloffs (Chart I-4). This underpins our view that, when China’s economy and corporate profits recover, Chinese stocks should outperform their global benchmarks on a cyclical time horizon. Importantly, with a stronger aggregate corporate financial health and a large price discount. Chinese investable non-financial stocks have more upside potential than their domestic counterparts. Chart I-3Financial Health Among Listed Chinese Companies Comparable With DMs
Financial Health Among Listed Chinese Companies Comparable With DMs
Financial Health Among Listed Chinese Companies Comparable With DMs
Chart I-4Chinese Investable Stock Prices Remain Deeply Discounted Relative To Global Benchmarks
Chinese Investable Stock Prices Remain Deeply Discounted Relative To Global Benchmarks
Chinese Investable Stock Prices Remain Deeply Discounted Relative To Global Benchmarks
Utilities, machinery, industrials and construction materials are among the sectors with the lowest cash flow-to-interest expense ratios, in both China’s domestic and investable markets. In particular, machinery, industrials and construction materials are pro-cyclical sectors and their profit growth is positively correlated with economic growth. Their low profitability and high leverage contribute to their poor cash flows. Those sectors have been severely impacted by the stoppages in manufacturing and construction activities due to the COVID-19 epidemic in China, making them vulnerable to cash shortages. However, there is a low risk of a broad-based default among these firms, because state-owned enterprises (SOEs) dominate these sectors in the Chinese equity market. The stock performance in these sectors is also extremely sensitive to shifts in China’s monetary and policy stance, and thus should benefit from the recent loosening in monetary conditions and the push for a substantial increase in infrastructure investment this year. Chart I-5Small Property Developers In China Are Much More Vulnerable To Cash Shortages Than Large Ones
Small Property Developers In China Are Much More Vulnerable To Cash Shortages Than Large Ones
Small Property Developers In China Are Much More Vulnerable To Cash Shortages Than Large Ones
The leverage ratio in the real estate sector has doubled in the past 10 years. The sector’s cash flow-to-total liabilities ratio has also declined sharply since 2017, when the authorities tightened lending standards to property developers. However, the sector’s aggregate cash flow situation is still an improvement from its lowest point in 2014, in both China’s domestic and investable markets. The countrywide lockdowns in January and February will undoubtedly have severe impacts on Chinese property developers’ cash flows. But the real estate sector is perhaps the best example in exhibiting a pronounced divergence in cash flow conditions between larger and smaller firms. Chart I-5 shows that, while the median ratio of cash-to-total liabilities tuned negative among 76 domestic listed real estate developers, the average ratio from total companies in the same sector suggests that the cash situation has actually improved since mid-2018. This divergence indicates that larger developers have more solid financial fundamentals and easier access to liquidity compared with their smaller counterparts, even before the lockdowns. We expect the divergence in cash flow conditions to widen in the coming months, and smaller property developers will face intensifying pressure to consolidate. China’s domestic healthcare companies have a much better cash balance than the investable healthcare sector, which has the lowest ratio of cash-to-interest expenses among all sectors. The poor cash flow conditions in investable healthcare companies are due to high leverage and low profitability, as well as high operating costs and R&D expenses. Chinese domestic healthcare sector has outperformed the broad market since the epidemic broke out in January. While we think the overall Chinese investable stocks have more upside than their domestic peers, domestic healthcare companies’ lower leverage ratio, stronger cash flows, and much higher profit margin make the sector a better bet than investable healthcare stocks on a cyclical time horizon (Chart I-6). Chart I-6Domestic Healthcare Sector Likely To Continue Outperforming The Broad Market
Domestic Healthcare Sector Likely To Continue Outperforming The Broad Market
Domestic Healthcare Sector Likely To Continue Outperforming The Broad Market
Chart I-7Energy Stocks Will Remain Depressed Until Oil Prices Rebound
Energy Stocks Will Remain Depressed Until Oil Prices Rebound
Energy Stocks Will Remain Depressed Until Oil Prices Rebound
Historically, there has been a strong positive correlation between the energy sector’s profitability, cash flow conditions, stock performance and crude oil prices (Chart I-7). In the past two years, the sector’s leverage ratio has risen, profit margins have thinned and the cash flow situation has sharply deteriorated to the same level as in 2014 when oil prices collapsed. The ongoing oil price rout will generate powerful deflationary forces in the energy sector and will likely further deteriorate energy firms’ profitability and cash flow. While we stay long cyclical stocks versus defensives on both a 0-3 month and a 6-12 month view, we recommend a cautious stance towards energy stocks until the evolving oil price war situation is clarified. Qingyun Xu, CFA Senior Analyst qingyunx@bcaresearch.com Jing Sima China Strategist jings@bcaresearch.com Appendix Overall Markets Excluding Financials
Overall Markets Excluding Financials Sector
Overall Markets Excluding Financials Sector
Consumer Discretionary Sector
Consumer Discretionary Sector
Consumer Discretionary Sector
Consumer Staples Sector
Consumer Staples Sector
Consumer Staples Sector
Real Estate Sector
Real Estate Sector
Real Estate Sector
Automobile Sector
Small Property Developers In China Are Much More Vulnerable To Cash Shortages Than Large Ones
Small Property Developers In China Are Much More Vulnerable To Cash Shortages Than Large Ones
Machinery Sector
Machinery Sector
Machinery Sector
Industrials Sector
Industrials Sector
Industrials Sector
Construction Materials Sector
Construction Materials Sector
Construction Materials Sector
Telecommunications Sector
Telecommunications Sector
Telecommunications Sector
Technology Sector
Technology Sector
Technology Sector
Healthcare Sector
Healthcare Sector
Healthcare Sector
Energy Sector
Energy Sector
Energy Sector
Utilities Sector
Utilities Sector
Utilities Sector
Footnotes 1 We exclude banks and financial institutions from this analysis, due to discrepancy in Chinese banks’ accounting measures from those of non-financial corporations’. 2 Alibaba, Tencent, Baidu, and JD together account for nearly 40% of the non-financial market cap in Chinese investable index. Cyclical Investment Stance Equity Sector Recommendations
Capitulation
Capitulation
Equities were unhinged last week, as the trifecta of the corona virus becoming a pandemic, Saudi ripping the cord out of crude oil and the convulsing bond markets made for an explosive equity market cocktail. The result was two circuit breaker triggers last week and one yesterday near the -7% mark that (thankfully) worked as planned and brought some liquidity back into the markets. Our Complacency-Anxiety index plunged to a panic level that has marked previous equity market troughs (see chart). In yesterday’s Weekly Report, we also highlighted our capitulation index that is close to levels that have marked previous equity market troughs. We deem that a prolonged troughing phase will ensue leaving ample time for long-term investors to deploy capital. A retest near last Thursday’s and yesterday’s lows is a high probability event, at which point we think the market will likely hold those lows. Our bottoming out equity market roadmap is the 1987, 2011, 2015/16 and early 2018 drawdowns. Consolidation around recently depressed levels will serve as a signal to definitively put cyclical-oriented capital to work. Bottom Line: Investors with higher risk tolerance should be dipping their toes into market weakness and start to deploy long-term oriented capital.