Sectors

HighlightsPortfolio Strategy“There is blood in the streets”. Investors with higher risk tolerance should be buying into this weakness and start to deploy long-term oriented capital. S&P 500 futures fell to 2394 which is a whopping 1000 points below the February 19, 2020 high of 3393. We cannot time the bottom, but future returns will be handsome from current SPX levels.Stick with health care stocks as the coronavirus pandemic will boost demand for health care goods and services, at a time when investors will also seek the refuge of defensive equities as the economy is in recession.Surging demand for pharmaceuticals, firming operating metrics, cheap relative valuations, an appreciating greenback along with the drubbing in the global manufacturing PMI, all signal that an underweight stance is no longer warranted in pharma equities. Recent ChangesLift the S&P pharmaceuticals index to neutral today. Table 1
Inflection Point
Inflection Point
Feature"Be fearful when others are greedy, and greedy when others are fearful"- Warren Buffett"The time to buy is when there's blood in the streets"- Baron RothschildEquities were unhinged last week, as the trifecta of the corona virus becoming a pandemic, Saudi ripping the cord out of crude oil and the convulsing bond markets made for an explosive equity market cocktail. The result was two circuit breaker triggers at the -7% mark that (thankfully) worked as planned and brought some liquidity back into the markets.Our Complacency-Anxiety index plunged to a panic level that has marked previous equity market troughs (Chart 1A). CNN’s Fear & Greed Index fell from near 100 to 1. While it could fall further at least a reflex rebound is in order. The Monday and Thursday mini-crashes felt like a capitulation (Chart 1B). Whoever wanted to get out likely got out. Chart 1ATime To Buy
Time To Buy
Time To Buy
Chart 1BThere’s Is Blood In the Streets
There’s Is Blood In the Streets
There’s Is Blood In the Streets
Volumes in the SPX soared to the highest level since 2011 and the bullish percentage index1 fell to 1.4%2 below the low hit in 2008! Early last week six out of ten stocks in the broad-based Russell 3000 were down 30% or more from their 52-week highs. As a reminder, the SPX took the elevator down and erased 13 months of gains in a mere 13 trading days (Chart 2)! Chart 2Selling Is Overdone
Selling Is Overdone
Selling Is Overdone
Chart 3Our Roadmap
Our Roadmap
Our Roadmap
A big crack has now formed.Given the tremor we just experienced, we doubt a V-shaped recovery to fresh all-time highs is in store for stocks similar to the one following the 2018 Christmas Eve lows V-shaped advance. Instead, parallels with the early-2018, 2015/16, 2011 or 19873 market action are more apt (Chart 3).Historically, Table 2 shows that the median time it takes for the stock market to make fresh all-time highs following a minimum 20% bear market from the most recent highs is two years. Table 2Bear Markets Duration
Inflection Point
Inflection Point
In other words, this will likely be a prolonged troughing phase and a retest near last Thursday’s lows is a high probability event, at which point we think the market will hold those lows, and this will serve as a catalyst to definitively put cyclical-oriented capital to work.Our purpose here is not to scare investors when a number of markets are in duress and already in a bear market. We have been sending these warning shots4 since last summer5 all the way until the recent SPX February peak. Now that we have reached the proverbial “riot point” we would recommend taking a cold shower and keeping calm and collected in order to put things into perspective as one of our mentors would always do in tumultuous times.Importantly, investors with higher risk tolerance should be buying into this weakness and start to deploy long-term oriented capital. We cannot time the bottom, but future returns will be handsome from current SPX levels. As a reminder, S&P 500 futures fell to 2394 which is a whopping 1000 points below the February 19, 2020 high of 3393.This drubbing blew past our most bearish SPX estimate of 2544,6 pushing the SPX from overvalued to undervalued overnight. In fact, the forward P/E has fallen to one standard deviation below the historical time trend (Chart 4). Chart 4From Overvalued To Undervalued
From Overvalued To Undervalued
From Overvalued To Undervalued
Our sense is that we will avoid a GFC type collapse, and thus investors with higher risk tolerance should start putting long-term cash to work as “there is blood in the streets”.Recapping the sequence of recent events is instructive. Two Fed officials (Clarida and Evans) made a huge error in our view by relaying that the Fed should stand pat and refrain from cutting rates. This culminated in a Powell press release that the Fed is ready to act, basically canceling these misplaced statements from the two Fed officials.Following these communication whipsaws, G7 finance ministers and central bankers held a conference call and then, the Fed panicked and cut rates inter-meeting further fueling the blazing fire. Now the Fed is cornered and has to act anew and further cut the fed funds rate (FFR) on March 18 all the way down to the zero lower bound. As a reminder, the last time the markets fell roughly 20% in late-2018 it took the Fed seven months to cut rates, this time it happened a mere two trading days after the market had a near 16% decline from the February peak.All of this bred uncertainty and a bond market spasm. There is little doubt we are in recession. The 10-year US Treasury yield plunging below 0.4% has fully discounted a recession, 100bps of Fed cuts and QE5 in our view.Keep in mind that the bond market now knows the Fed will cut the FFR to zero and eventually resort to QE, so it really front runs the Fed. This is something the bond market never anticipated or discounted on the eve of the Great Financial Crisis.While it is definitely true that interest rate cuts and further QE will neither cure COVID-19 nor reverse work-related disruptions, the Fed has to act and cut interest rates and restart QE for three reasons:a) to instill confidence that it is doing something and it is not a bystander,b) to loosen financial conditions as the VIX at a recent high near 76 and a more than doubling in junk spreads are screaming “help” (Chart 5), andc) to jawbone the US dollar lower.Our sense is that the fixed income market hit an inflection point for stocks when the 10-year US Treasury yield breeched the 1.5% mark: the correlation between stocks and bond yields quickly snapped from negative to positive. Based on recent empirical evidence, stocks cannot stomach a 10-year US Treasury yield above 3%, and suffer indigestion below 1.5% (Chart 2). Crudely put, while lower yields act as a shock absorber for equities (via lifting the forward P/E multiple), below a breaking point they warn of a deflationary shock. Thus, we would view an eventual return of the 10-year US Treasury yield near the 1.5% as a positive sign for stocks. Chart 5Watching Spreads
Watching Spreads
Watching Spreads
The other shock two weekends ago was the deflationary oil market spiral out of the OPEC meeting in Vienna where a fight apparently erupted between the Saudis and the Russians with regard to rebalancing the oil markets and resulted in $30/bbl oil. The timing could not have been worse. Oil related capex will fall off a cliff given the looming bankruptcies in the US shale oil patch (bottom panel, Chart 5) and that makes a fiscal package from the US even more pressing.We deem that only a mega fiscal package comparable to the $750bn TARP will definitively stop the hemorrhaging. A comprehensive fiscal package close to $1tn in order to deal with the aftermath of the corona virus would mark a bottom in the equity market.Health care stocks will benefit both from a fiscal package and from the corona virus pandemic automatic rise in demand for health care services and goods. Thus, this week we reiterate our overweight stance in the health care sector and make a small shift to our sub-sector positioning.Continue To Hide In Health Care…We recommend investors continue to take refuge in health care stocks within the defensive universe as the coronavirus pandemic unfolds. The S&P health care sector relative share price ratio recently bounced off the one standard deviation below the historical time trend line and is primed to vault higher in coming quarter (Chart 6). Chart 6Health Care Shines In Recessions
Health Care Shines In Recessions
Health Care Shines In Recessions
If severe government measures are a prerequisite to stop the spread of the virus then growth will suffer a massive setback. Were President Trump to take draconian measures similar to what the Italian Prime Minister imposed recently and effectively shut down the country, then PCE will collapse.In fact, PCE excluding health care will take a beating. Health care outlays will rise both in absolute terms and relative to overall spending (Chart 7). Given the safe haven status of the S&P health care index and the stable cash flows these businesses command, when growth is scarce, investors flock to any source of growth they can come by and health care stocks definitely fit that bill.Not only is firming demand reawakening health care stocks that have been trading at a discount to the broad market owing to political uncertainty, but also their defensive stature is a heavily sought after attribute during recessions (Chart 6). Chart 7Upbeat Demand Profile…
Upbeat Demand Profile…
Upbeat Demand Profile…
Chart 8…Will Boost Selling Prices And Sales
…Will Boost Selling Prices And Sales
…Will Boost Selling Prices And Sales
Inevitably, demand for health care goods and services will rise in the coming weeks straining the US health care system, as the number of infections increases. This will sustain industry selling price inflation and underpin revenue growth at a time when the world will be deflating (Chart 8).The implication is an earnings-led durable health care sector outperformance phase, a message that our relative macro EPS growth model is forecasting for the rest of the year (Chart 9).Importantly, such a rosy outlook is neither discounted in relative forward sales nor profit growth expectations for the coming year and we would lean against such pessimism (third panel, Chart 10). Chart 9Macro Profit Growth Model Says Buy
Macro Profit Growth Model Says Buy
Macro Profit Growth Model Says Buy
Chart 10Unloved And Under-owned
Unloved And Under-owned
Unloved And Under-owned
Finally, valuations and technicals are both flashing green. On a forward P/E basis health care stocks still trade at a 15% discount to the broad market and momentum is washed out offering a compelling entry point for fresh capital.In sum, in times of malaise investors flock to defensive health care stocks, that are currently direct prime beneficiaries of the ongoing coronavirus pandemic.Bottom Line: We reiterate our overweight recommendation in the largest market capitalization weighted defensive sector in the SPX, the S&P health care sector.Upgrade Pharma To NeutralLift the S&P pharmaceuticals index to neutral from underweight for a modest loss of -1% since inception.A structurally downbeat pricing power backdrop was the primary driver of our bearish call on the S&P pharma index as both sides of the political aisle were out to get Big Pharma (bottom panel, Chart 11). This portfolio position was up double digits since inception, but it has given back almost all the gains recently since the coronavirus pandemic took stage a few weeks ago.While our thesis has not changed, we do not want to be bearish any health care related equities in times of a health epidemic. In addition, there is a chance that one of these behemoths discovers a compound to beat the virus and could serve as a catalyst for a sharp reversal of the downtrend.Importantly, from an operating perspective, margins appear to have troughed following 15 years of declines (middle panel,Chart 11). Now that inadvertently demand for medicines will surge, sales and profits will expand smartly (third & bottom panels, Chart 12). Chart 11It No Longer Pays To Be Bearish
It No Longer Pays To Be Bearish
It No Longer Pays To Be Bearish
Chart 12Firming Demand
Firming Demand
Firming Demand
As a result of the coronavirus pandemic, we deem pharma factories will start to hum reversing the recent contraction in pharmaceutical industrial production (second panel, Chart 12).From a macro perspective, layoffs are inevitable from the coronavirus catalyzed recession and a softening labor market bodes well for defensive pharma profits (bottom panel, Chart 12).The collapse in the February global manufacturing PMI, primarily driven by China, is a window into what the future holds for developed market (DM) PMIs. DMs will feel the coronavirus aftermath in the current month and likely sustain downward pressure on the global manufacturing PMI print. Historically, relative forward profits and the global manufacturing PMI have been inversely correlated and the current message is to expect catch up phase in the former (global PMI shown inverted, middle panel, Chart 13).Moreover, the same rings true for the ultimate macro indicator, the US dollar. A rising greenback reflects global growth ills and a safe haven bid in times of duress as investors park their money in the reserve currency of the world. Therefore, defensive pharma relative forward EPS enjoy a positive correlation with the US dollar, and the path of least resistance remains higher (bottom panel, Chart 13).Finally, relative valuations are hovering near one standard deviation below the historical mean and technicals have returned back to the neutral zone underscoring that it no longer pays to be bearish pharma stocks (Chart 14). Chart 13Macro Backdrop Is Favorable
Macro Backdrop Is Favorable
Macro Backdrop Is Favorable
Chart 14Value Has Been Restored
Value Has Been Restored
Value Has Been Restored
Adding it all up, surging demand for pharmaceuticals, firming operating metrics, cheap relative valuations, an appreciating greenback along with the drubbing in the global manufacturing PMI, all signal that an underweight stance is no longer warranted in pharma equities.Bottom Line: Lift the heavyweight S&P pharma index to neutral today, for a modest loss of -1% since inception. The ticker symbols for the stocks in this index are: BLBG: BLBG: S5PHAR – JNJ, MRK, PFE, BMY, LLY, ZTS, AGN, MYL, PRGO. Anastasios Avgeriou US Equity Strategistanastasios@bcaresearch.com Footnotes1 https://school.stockcharts.com/doku.php?id=index_symbols:bpi_symbols2 https://schrts.co/IfrNQmIu3 Please see BCA US Equity Strategy Daily Report, “Gravitational Pull” dated March 12, 2020, available at uses.bcaresearch.com.4 Please see BCA US Equity Strategy Weekly Report, “A Recession Thought Experiment” dated June 10, 2019, available at uses.bcaresearch.com.5 Please see BCA US Equity Strategy Special Report, “What Goes On Between Those Walls? BCA’s Diverging Views In The Open” dated July 19, 2019, available at uses.bcaresearch.com.6 Please see BCA US Equity Strategy Weekly Report, “From "Stairway To Heaven" To "Highway To Hell"?” dated May 2, 2020, available at uses.bcaresearch.com.Current RecommendationsCurrent TradesStrategic (10-Year) Trade Recommendations
Inflection Point
Inflection Point
Size And Style ViewsJune 3, 2019Stay neutral cyclicals over defensives (downgrade alert) January 22, 2018Favor value over growthMay 10, 2018Favor large over small caps (Stop 10%)June 11, 2018Long the BCA Millennial basket The ticker symbols are: (AAPL, AMZN, UBER, HD, LEN, MSFT, NFLX, SPOT, TSLA, V).
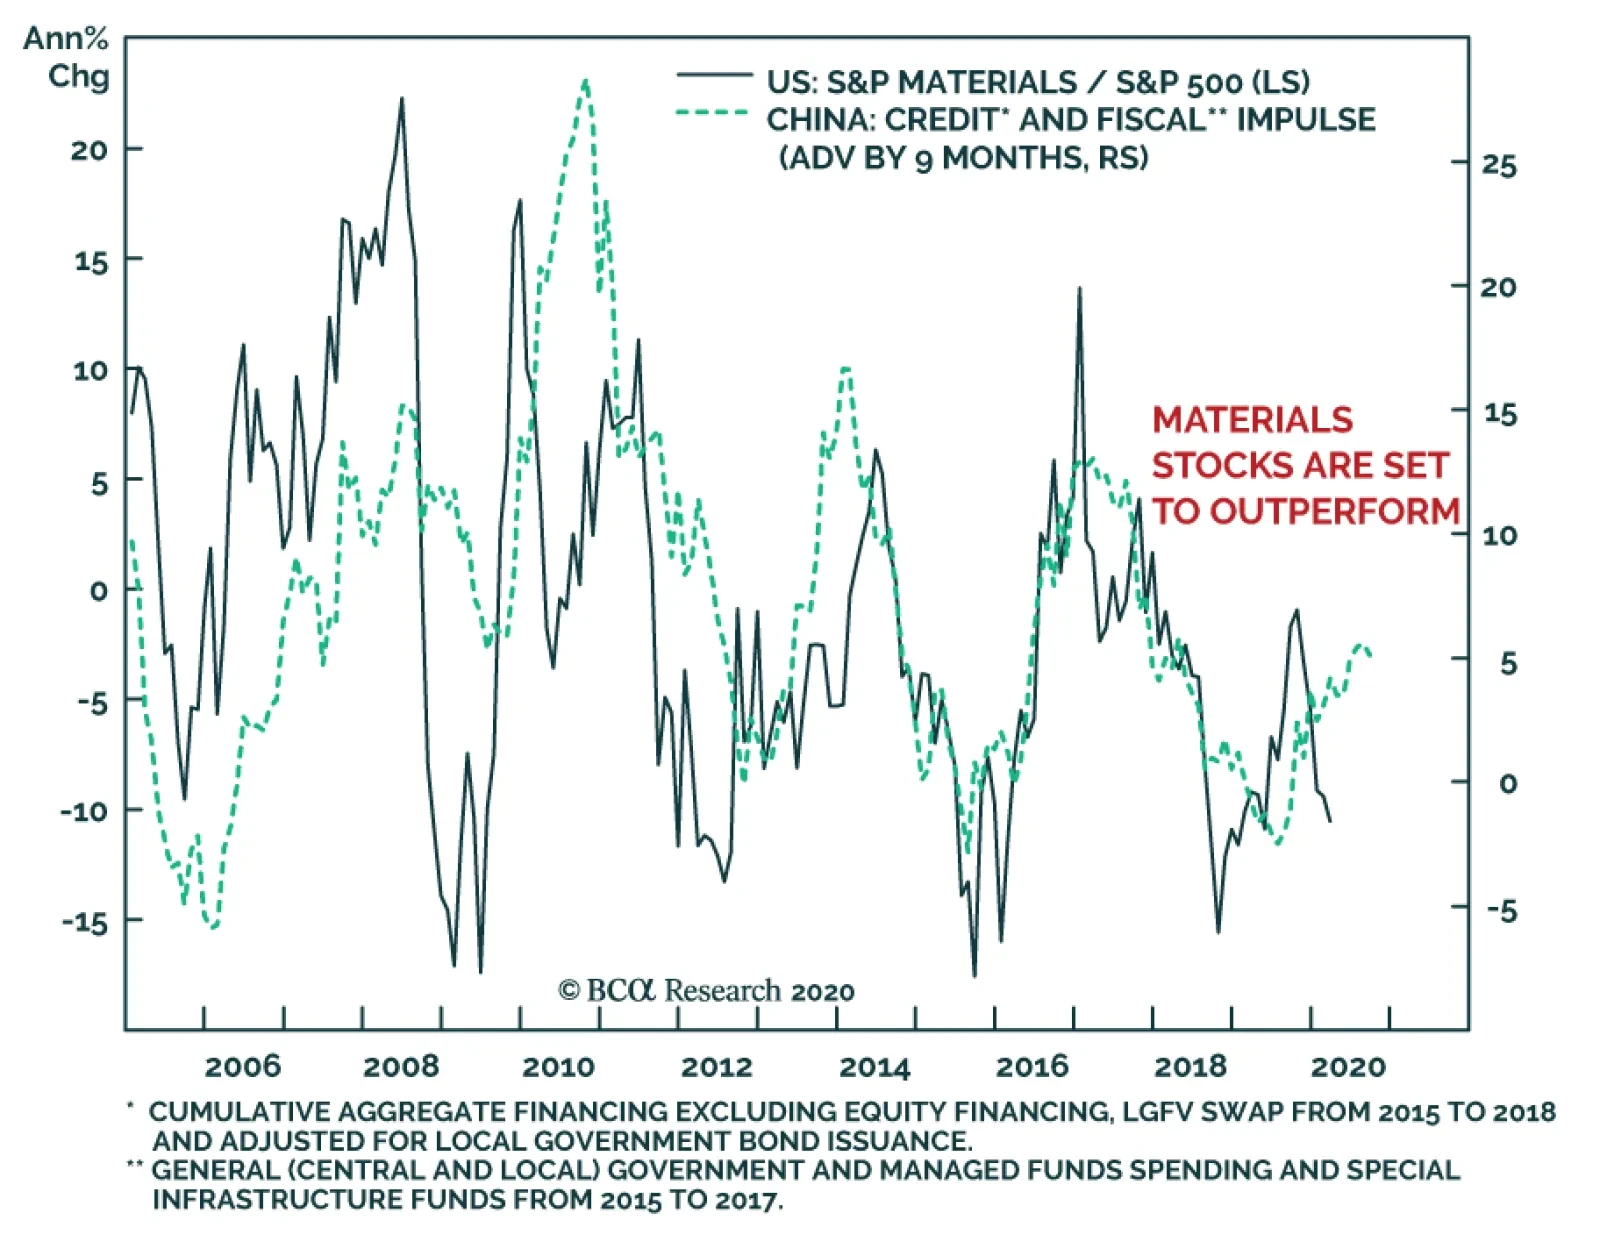
The S&P materials sector is massively oversold relative to the S&P 500, while our valuation index is at a large discount to its normal relationship to the broad market. Moreover, its forward EPS breadth and relative EPS revision ratio are deeply…
Gravitational Pull
Gravitational Pull
The SPX collapsed on Monday in a mini-crash, reminiscent of the 20% October 1987 Black Monday crash. True, in 1987 the stock market fell 20% in a single day, but it is equally painful when the S&P 500 drops roughly 20% in 13 trading days, erasing 52 weeks of gains. While the equity market is extremely oversold and a short-term bounce is likely, we doubt a V-shaped SPX recovery looms similar to what prevailed following the 20% peak-to-trough December 2018 drawdown. Instead, 1987 (see chart), 2011, 2015/16 and early-2018 are the closest parallels we could think of, when the market had to digest those tremors over a three-to-six month troughing period. We deem the current equity market bottoming process will play out over the next two quarters leaving investors plenty of time to commence deploying long-term capital. Bottom Line: Stay patient before putting cash to work on a 9-12 month horizon, and for additional analysis please look forward to reading our upcoming Monday weekly report.
Dear Client, In addition to this week’s report, BCA Research will hold webcasts over the coming days to discuss the economic and financial outlook amid the myriad of uncertainties gripping global markets. I will take part in a roundtable discussion alongside my fellow BCA Strategists Arthur Budaghyan, Mathieu Savary, and Caroline Miller for a live webcast on Friday, March 13 at 8:00 AM EDT (12:00 PM GMT, 1:00 PM CET, 8:00 PM HKT). In addition, I will hold a webcast on Monday, March 16 at 12:00 PM EDT (4:00 PM GMT). Best regards, Peter Berezin, Chief Global Strategist Highlights A global recession is now a fait accompli. The only question is whether there will be a technical recession lasting a couple of quarters, or a more prolonged downturn that produces a sizeable increase in unemployment rates. We lean towards the former outcome. Unlike during most recessions, the decrease in labor demand will be mitigated by a decline in labor supply, as potentially millions of workers are confined to their homes. This will limit the rise in unemployment, at least initially. The pandemic is likely to prompt firms to increase inventory levels for fear of further disruptions to their supply chains. This should provide a short-term boost to output. While it is possible that spending will remain broadly depressed even after the panic subsides, this seems unlikely. Private-sector finances were reasonably strong going into the crisis, while ultra-low government bond yields will incentivize increased fiscal outlays. Spending on leisure travel and public entertainment will remain subdued well into 2021, but much of this demand will be redirected to other categories of discretionary consumer purchases, particularly in the online realm. Health care expenditures will also increase. The collapse in oil prices following the breakdown of OPEC 2.0 represents a positive supply shock for the global economy, albeit one that will have negative consequences for oil-extraction sectors. We tactically upgraded stocks on the morning of Friday, February 28. That was obviously a major mistake: While global equities did rally 7% higher after our upgrade, they have since given up all their gains (and then some). For now, we are maintaining a modest overweight recommendation to equities. However, this is a low-conviction view, and we would not dissuade more conservative investors from reducing risk exposure. We would only consider upgrading stocks to a high-conviction overweight if the S&P 500 dropped to 2250, or the number of new infections outside of China peaked. In the meantime, we are downgrading high-yield credit tactically, as the odds of earnings weakness prompting a near-term rise in default expectations warrant caution. What A Way To Start The Decade So far, the 2020s may not be roaring, but they are certainly not boring. At the outset of the crisis, there were three scenarios for the COVID-19 outbreak: 1) A regional epidemic largely confined to China; 2) a series of global outbreaks, successfully short-circuited by a combination of government intervention and voluntary “personal distancing” measures; 3) A full-blown pandemic that exposes a significant proportion of the planet to the virus. Unfortunately, the first scenario has been ruled out. Policymakers are now trying to achieve the second scenario. Successful containment would “flatten the curve” of new infections, while allowing the sick to receive better treatment than they would otherwise. It would also buy precious time to develop a vaccine and increase the output of face masks, hand sanitizers, and other products that could slow the spread of the disease. Health Versus Growth Ironically, while the second scenario is clearly preferable to a full-blown pandemic from a health perspective, it may be more damaging from the very narrow, technical perspective of GDP accounting. It all depends on how severe the measures to quash each outbreak need to be. If simple hygiene measures and social distancing turn out to be enough, the economic fallout will be minimal. If ongoing mass quarantines and business closures are necessary, the damage will be severe. History suggests that containment efforts can work. During the Spanish flu, US cities such as St. Louis, which took early action to slow the spread of the disease, ended up with far fewer deaths than cities such as Philadelphia which did not (Chart 1). Western Samoa did not impose any travel restrictions and lost a quarter of its population. American Samoa closed its border and suffered no deaths. Chart 1Containment Efforts Can Be Effective: The Case Of The Spanish Flu
Contagion
Contagion
Recent experience suggests that COVID-19 can be stopped, even after community contagion has set in. The number of new Chinese cases has fallen from 3,892 on February 5 to 31 on March 11. South Korea seems to be getting the virus under control. The number of new cases there has declined from 813 on February 29 to 242 (Chart 2). Japan and Singapore also appear to be succeeding in preventing the virus from spreading rapidly. Chart 2Coronavirus: The Authorities In East Asia Seem To Be In Control Of The Situation
Contagion
Contagion
What remains unclear is whether other countries can replicate East Asia’s experience. A recent Chinese study estimated that R-naught – the average number of people someone with the virus ends up infecting – fell from 3.86 at the outset of the outbreak to 0.32 following interventions (Chart 3).1 In other words, China was able to lower R-naught to one-third of what was necessary to stabilize the number of new infections. If one wanted to be optimistic, one could argue that other countries could get away with less heavy-handed measures, even if it is at the expense of a somewhat slower decline in the infection rate. Chart 3Severe Containment Measures Have Changed The Course Of The Wuhan Outbreak
Contagion
Contagion
Unfortunately, given how contagious the virus appears to be, it is unlikely that simple measures such as regularly washing one’s hands, avoiding large gatherings, and wearing a face mask in public when sick will suffice. Trade-offs will have to be made between growth and health. Moreover, if the virus becomes endemic in a few countries that do not have the institutional capacity to contain it, this could create a viral reservoir that produces repeated outbreaks in the wider world. The result could feel like a ghastly game of whack-a-mole. The Fatality Rate The degree to which countries pursue costly containment measures depends on how deadly the virus turns out to be. On the one hand, there is some evidence that the fatality rate from COVID-19 is lower than the 2%-to-3% that has been widely reported once mild or asymptomatic cases, which often go undetected, are taken into account. This may explain why South Korea, which has arguably done a better job of testing suspected patients than any other country, has reported a fatality rate of only 0.7%. Like the seasonal flu, the death rate from COVID-19 appears to be heavily tilted towards the elderly. In Italy, 89% of COVID-19 deaths have occurred among those who are 70 and older. On the ill-fated Diamond Princess cruise liner, not a single person under the age of 70 has died. The fatality rate for passengers on the ship older than 70 is 2.4%. The seasonal flu kills about 1% of those it infects over the age of 70. Based on this simple calculation, COVID-19 is more lethal, but not light-years more lethal, than the typical flu (and possibly less lethal than the flu is for young children). Unfortunately, these optimistic estimates assume that patients with COVID-19 can continue to receive appropriate care. As we saw in Wuhan, where the official death rate stands at 4.5% compared to 0.9% in the rest of China, and as we are now seeing in Italy, once the health care system becomes overwhelmed, death rates can rise sharply. Bottom Line: Containing the virus will be economically costly, but given the potentially large death toll from a full-blown pandemic, most countries will be willing to pay the price. A Global Recession Even before the virus became endemic outside China, we estimated that global growth would fall to zero on a quarter-over-quarter basis in Q1. As we cautioned back then, the risk to our forecast was tilted to the downside, and that has proven to be the case. We now expect the global economy to shrink not just in the first quarter but in the second quarter as well, as country after country experiences a surge in new infections. Two consecutive quarters of negative growth constitute a technical recession. Despite the drop in new cases in China over the past two weeks, most high-frequency measures of economic activity such as property sales, railway-loaded coal volumes, and traffic congestion have yet to return anywhere close to normal levels (Chart 4). In the US, hotel occupancy rates, movie ticket sales, and attendance at sporting events were all close to normal levels as of last week. However, that is changing quickly. Already, automobile traffic in Seattle, one of the cities most hard-hit by the virus, has fallen sharply (Chart 5). Chart 4China: It Will Take Time For Life To Return To Normal
Contagion
Contagion
Chart 5US: Staying Home More In Seattle Due To The Virus?
Contagion
Contagion
Qualitatively Different While a recession in the first half of 2020 is now unavoidable, the nature of this recession is likely to be quite different than in the past. To understand why, it is useful to review what causes most recessions. A typical recession involves a prolonged loss of aggregate demand. Such a loss of demand can result from either financial market overheating or economic overheating. Financial market overheating can occur if a credit-fueled asset bubble bursts, leaving people with less wealth struggling to pay off debt. For example, US residential investment fell from 6.6% of GDP in 2005 to 2.5% of 2010. Thus, even after the credit markets thawed, there was still a large hole in aggregate demand that needed to be filled. A similar, though less severe, loss of demand occurred when the bursting of the dotcom bubble led to severe cutbacks in IT spending. Economic overheating occurs when a lack of spare capacity puts upward pressure on inflation. Wary of accelerating prices, central banks slam on the brakes, raising interest rates into restrictive territory. This often results in a recession. In both types of recessions, there are usually second-round effects that can swamp the initial shock to aggregate demand. As spending falls, firms start to lay off workers. The resulting loss in household income leads to less spending. Even those who retain their jobs are apt to feel less confident, leading to an increase in precautionary savings. For their part, businesses tend to cut production as inventory levels swell. Things only return to normal once enough pent-up demand has accumulated and/or policy has become sufficiently stimulative to revive spending. Framed in this way, one can see that the current downturn differs from past downturns in at least three important respects. First, unlike during most recessions, the decrease in labor demand this time around will be partly mitigated by a decline in labor supply, as potentially millions of workers are confined to their homes. While this will not prevent many workers from temporarily losing income, it will limit the increase in unemployment, at least initially. We have already seen this in China, where GDP growth collapsed but companies are complaining about a shortage of migrant labor. Second, rather than falling, inventory levels may actually rise. Since companies will have to deal with pervasive supply shocks of unknown frequency, duration, and magnitude, their natural inclination will be to increase inventory levels for fear that they will not be able to access their supply chains when they need them. If recent reports of hoarding of toilet paper and bottled water are any guide, the same sort of behavior will show up among consumers. Again, in the short term, this additional demand will help to keep unemployment from rising as much as it would otherwise. Third, and perhaps most importantly, the ongoing crisis is the result of an exogenous shock rather than an endogenous slowdown. In fact, a variety of economic indicators such as US payrolls, the Chinese PMI, and German factory orders were all pointing to an acceleration in global growth before the crisis began. This suggests that growth could recover quickly once the panic subsides. While it is impossible to say with any degree of certainty how long it will take for the panic to end, it may not last as long as many fear. Investors should particularly pay attention to the situation in Italy. If the number of new cases peaks there, it could create a sense that other western countries will be able to get the virus under control. Second-Round Effects? Although it is possible that economies will remain depressed even after the panic subsides, this seems unlikely. Private-sector finances were reasonably strong going into the crisis. The private-sector financial balance – the difference between what companies and households earn and spend – is in surplus in most countries, including China (Chart 6). Chart 6The Private Sector Spends Less Than It Earns In Most Economies
Contagion
Contagion
Chart 7Lower Oil Prices Eventually Lead To Higher Growth
Lower Oil Prices Eventually Lead To Higher Growth
Lower Oil Prices Eventually Lead To Higher Growth
Granted, not all sectors are likely to prove equally resilient. Spending on leisure travel and public entertainment will remain subdued well into 2021. The collapse in oil prices following the breakdown of OPEC 2.0 will also wreak havoc on oil producers. In both cases, however, there will be offsetting benefits. Much of the demand for travel and entertainment will be redirected to other categories of discretionary consumer purchases, particularly in the online realm. And while lower oil prices will hurt producers, they represent a boon for consumers and companies that use petroleum as an input. In general, as Chart 7 illustrates, global growth usually accelerates following declines in oil prices. Fiscal Policy Will Turn More Stimulative Even before the crisis began, we argued that most governments should permanently increase fiscal deficits in order to raise the neutral rate of interest. At the current juncture, with a recession upon us and government bond yields at ultra-low levels, the failure to enact meaningful fiscal stimulus would be economic malpractice of the highest order. In addition to easing measures being rolled out by central bankers, our sense is that we will get a lot of fiscal stimulus, sooner rather than later. During most recessions, there is always a chorus of voices from people whose own jobs are secure about how a downturn is necessary to cleanse the system. This time around, it is obvious that the victims are not to blame. Politicians will not endear themselves to voters by denying the need for fiscal support to households struggling with medical bills and lost time from work and businesses facing bankruptcy. President Trump’s pledge this week to cut payroll taxes and increase transfers to those affected by the virus is just a taste of what’s to come. Investment Conclusions Chart 8Stock-To-Bond Ratio: A Lot Of The Bad News Has Already Been Priced In
Stock-To-Bond Ratio: A Lot Of The Bad News Has Already Been Priced In
Stock-To-Bond Ratio: A Lot Of The Bad News Has Already Been Priced In
We tactically upgraded stocks on the morning of Friday, February 28. That was obviously a major mistake: While global equities did rally 7% higher after our upgrade, they have since given up all their gains (and then some). In retrospect, we should have paid more attention to our own analysis in our report “Markets Too Complacent About The Coronavirus.” For now, we are maintaining a modest overweight recommendation to equities. The total return ratio between stocks and bonds has fallen by a similar magnitude as in the run-up to prior recessions, suggesting that much of the bad news has already been priced in (Chart 8). Nevertheless, significant downside risks remain, which is why we would characterize our equity overweight as a fairly low-conviction view. We would not dissuade more conservative investors from reducing risk exposure. As discussed above, containing the virus could lead to significant economic disruptions. We would only consider upgrading stocks to a high-conviction overweight if the S&P 500 dropped to 2250, or the number of new infections outside of China peaked. In the meantime, we are downgrading high-yield credit tactically, as the odds of earnings weakness prompting a near-term rise in default expectations warrant caution. Safe-haven government bond yields will probably not rise much from current levels, at least in the near term. The Fed cut rates by 50 basis points last week and will cut rates by another 50 basis points next week. Looking further out, however, bonds are massively overvalued and will suffer mightily as life returns to normal. Peter Berezin Chief Global Strategist peterb@bcaresearch.com Footnotes 1Chaolong Wang, Li Liu, Xingjie Hao, Huan Guo, Qi Wang, Jiao Huang, Na He, Hongjie Yu, Xihong Lin, Sheng Wei, and Tangchun Wu, “Evolving Epidemiology and Impact of Non-pharmaceutical Interventions on the Outbreak of Coronavirus Disease 2019 in Wuhan, China,”medrxiv.org, March 6, 2020. Global Investment Strategy View Matrix
Contagion
Contagion
MacroQuant Model And Current Subjective Scores
Contagion
Contagion
Strategic Recommendations Closed Trades
Unhinged
Unhinged
There is a lot of uncertainty that reverberates through the equity markets and the dust has yet to settle down from Monday’s big crack. Small caps (similar to weak balance sheet stocks, middle panel) have cratered for three reasons: First, they are massively indebted as the bottom panel of the chart shows not only in absolute terms, but also compared with their large cap brethren. Second, small caps have been mired in earnings deflation for a while and the looming recession now aggravates the fall in these high beta stocks. Finally, small caps have a large weighting in financials in general and small regional banks in particular. As such, the recent double whammy of the oil price collapse and bond yield plunge has wreaked havoc in small cap indexes. We have been cyclically avoiding small caps and instead preferring large caps since mid-2018 and late-last year we also added this size preference to our high-conviction call list as a modest hedge to most other high-conviction calls that were levered to higher interest rates. Today, from a portfolio risk management perspective, we are instituting a trailing stop at the 10% return mark in order to protect gains. Bottom Line: Stick with the large cap bias for a while longer.
Don't Be A Hero
Don't Be A Hero
We have been cyclically bearish the broad equity market and vindicated, especially given yesterday's circuit breaker drawdown in the SPX, heeding the messages of our EPS profit model, that had no pulse, and of the bond markets, with the 10/2 yield curve inversion last summer forewarning of recession. As a reminder, we have been a proponent that "it will not be different this time" and a recession would ensue, and there is little doubt we are in recession now. We believe the only sustainable way out of this mess is a big fiscal package as the Fed's easing via ZIRP and QE5 are given. With regard to a fiscal package we are looking for something similar to TARP in magnitude in order to stem the equity market hemorrhaging and instill some confidence that there is plenty of money available to deal with the fallout of the coronavirus. Q1 earnings season will be a kitchen sink quarter similar to Q4/2018 as CEOs have an opportunity to flush all the bad news in one shot. What worries us most is a doubling in the junk spread near the 2016 peak that will further tighten financial conditions and the looming bankruptcies that would push the default rate higher as the VIX has been forecasting (see chart). Counter-party risk is also on our radar screens as these violent moves in FX, fixed income, vol and equity markets will leave a visible mark. Bottom Line: With regard to equity market investment strategy, we would stay patient at the current juncture before deploying cyclically oriented capital and really hide in staples and health care stocks. Please look forward to the upcoming Monday's report for an update on our overweight recommendation in the health care sector and its key subcomponents.
Highlights Financial markets have experienced two weeks of wild swings: Following the negative 5-standard-deviation weekly move in the S&P 500 two weeks ago, the index moved at least 2.8% in each of last week’s first four sessions. 10- and 30-year Treasury yields made one all-time low after another. The coronavirus has arrived in the United States: It would appear inevitable that the coronavirus is going to spread across the US; the unknowns are how long it will spread, how deadly it will be, and how much it will impact the economy. Confronted with these unknowns, markets shot first and left asking questions for later. The selling may have gone a little far. The Fed and the Democratic candidates for president were in the news last week, … : The Fed made its first intra-meeting rate cut since the financial crisis was raging, cutting the fed funds rate by 50 basis points instead of waiting for its regularly scheduled March 17-18 gathering. Super Tuesday upended the chase for the Democratic presidential nomination, as our geopolitical strategists foresaw. … and we offer our quick read on their market impact: We expect that the Fed’s rate cut will be modestly positive for markets and the economy, while Joe Biden’s move to the head of the Democratic pack greatly diminished a risk that would otherwise have troubled investors all the way to November 3rd. Feature US equities have endured a rollercoaster ride over the last two-and-a-half weeks. From its all-time intraday high of 3,393.52 on February 19th, to the February 28th intraday low of 2,855.84, the S&P 500 corrected by 15.8% in just seven sessions. The brunt of the decline occurred two weeks ago, when the index lost 11.5% in its fourth worst week in the last six decades. The decline amounted to more than a negative 5-standard-deviation event, and took its place among what we now consider to be landmark episodes in US stock market history (Table 1). Table 1Socialism + Pandemic = History (But Not The Good Kind)
Hot Takes
Hot Takes
The epic rout followed a weekend of distressing news. First, the coronavirus (COVID-19) slipped its Asian bonds, popping up fully formed in Italy and Iran in a sobering demonstration of its global reach. Second, Bernie Sanders had seemingly solidified his grip on the Democratic presidential nomination by trouncing the rest of the crowded field in the Nevada caucuses with nearly twice the share of the vote that he captured in his Iowa and New Hampshire wins. We therefore characterize the February 28th intraday low as the coronavirus/Sanders bottom. The former is still running around freely, but the latter has been largely contained. COVID-19 will surely be with us for a while longer, and may yet push the S&P 500 below its February 28th low, but it will have to do so without help from Bernie Sanders. Joe Biden reclaimed front-runner status following his tremendous Super Tuesday performance, and support for him coalesced with remarkable speed, relieving investors’ acute concern about a Sanders presidency. The primary campaign is still in its early stages, and the gaffe-prone Biden is capable of multiple stumbles between now and the nominating convention, but a general election without a self-declared socialist bent on ending health insurance as we know it will provoke considerably less market anxiety. The Rate Cut Equities had been pining for a rate cut, beginning last week’s surge upon the news that central bankers would be joining the G-7 Finance Ministers on their hastily arranged Tuesday morning conference call. After an immediate 2.5% pop upon the announcement of the intra-meeting cut, however, the S&P 500 sagged and wound up ending Tuesday’s session nearly 2% lower than its pre-cut level. The dismal market reception, and Powell’s own halting, tepid responses to questions at the press conference to discuss the rationale for the move left investors wondering if the Fed had made a mistake. We neither know nor care if it will turn out to be good policy, but we expect that the rate cut will lend support to risk assets over our 12-month investment horizon. Why would the Fed use monetary policy to try to combat a public health crisis, or any supply shock? Monetary policy tools were not made to fight public health crises. They will not speed the development of an antidote, make medical care more widely available, or make up for a lack of preparedness at the public health agencies leading the effort to blunt COVID-19’s spread. They also are not particularly well-suited to combat supply shocks. They cannot resolve global supply bottlenecks, put more people back to work in China, South Korea and Italy, or create and distribute all the test kits and protective clothing that medical professionals sorely need. It is within the Fed’s power, however, to try to keep COVID-19’s second-order economic consequences from taking root. Negative headlines, deserted shopping districts and runs on products like hand sanitizer and face masks can drag down business and consumer confidence. Falling confidence can weigh on consumption and investment, hobbling output, stifling employment growth, and raising the specter of a negatively self-reinforcing dynamic in which layoffs lead to less consumption, which feeds more layoffs, and less investment, etcetera. If the Fed can bolster the spirits of consumers and businesses, it can help to contain COVID-19’s adverse economic impact. Won’t this move leave the Fed with less ammunition down the road? Yes, it surely will, especially if the Fed would prefer to stick to conventional policy tools to combat the next recession. Last week’s cut may postpone the start date of that recession, however, affording the Fed a chance to execute a series of rate hikes before it arrives. For an investor with a timeframe that doesn’t exceed twelve months, it may not matter, provided the increased accommodation successfully reduces near-term recession risk. Do you think this move will be effective? At the margin, yes, we think it will. First of all, it will contribute to the mortgage-refinancing wave that has been building since the beginning of the year (Chart 1). With an average 3.45% 30-year fixed-rate mortgage rate, data provider Black Knight estimates 11 million borrowers could save at least 75 basis points by refinancing their existing loans.1 If the average rate were to fall to 3%, as it would if the spread between mortgage rates and Treasury yields simply eases back to the 2% neighborhood (Chart 2), the pool of potential refinancers would expand to 19 million. Reduced mortgage payments put more money in homeowners’ pockets and will help support consumption at the margin. Chart 1Mortgage Refis Were Already Ramping Up, ...
Mortgage Refis Were Already Ramping Up, ...
Mortgage Refis Were Already Ramping Up, ...
Chart 2... And There Will Be Even More Activity Once Mortgage Spreads Normalize
... And There Will Be Even More Activity Once Mortgage Spreads Normalize
... And There Will Be Even More Activity Once Mortgage Spreads Normalize
Lower rates will also increase demand for new-home purchases, which have positive multiplier effects, and other big-ticket consumer goods. They will also support investment at the margin, as hurdle rates fall, and more opportunities are projected to generate a positive net present value. Potential homebuyers may be less prone to attend open houses or conduct home searches if COVID-19 spreads, and skittish managers may be less prone to invest, but easier monetary conditions do promote economic activity. Finally, a Fed that is demonstrably committed to easing monetary conditions to mitigate COVID-19’s potential negative impacts may help shore up business and consumer confidence. It will take confidence to keep gloomy virus headlines from becoming a self-fulfilling recession prophecy. As Figure 1 illustrates, the Fed does have the means to boost demand in financial markets and the real economy. Figure 1Monetary Policy And The Economy
Hot Takes
Hot Takes
What will it mean for markets? It may encourage investors to pay more for each dollar of a corporation’s earnings, helping to cushion equities from falling earnings projections (the Confidence/Risk Taking channel in Figure 1), though we think a surer outcome is that it will keep the search for yield at a fever pitch. Life insurers, pension funds and endowments can no longer rely on highly-rated sovereign bonds to deliver the income to meet their fixed obligations, but have very little leeway to allocate away from fixed income. They have therefore been forced to venture further and further out the risk curve (Figure 1’s Portfolio Balance Effect), which has had the effect of providing an ample supply of funds for less-than-pristine borrowers. Under zero- and negative-interest-rate policy (ZIRP and NIRP, respectively) just about any borrower aside from brick-and-mortar retailers and thinly capitalized oil drillers can attract a line of would-be lenders out the door and around the corner simply by offering an incremental 50-75 bps of yield. Since no borrower defaults, or goes bankrupt, as long as there is a lender willing to roll over its maturing obligations, extraordinarily accommodative monetary policy has had the effect of limiting default rates. We expect that the Fed’s move back in the direction of ZIRP will continue to squeeze spreads and ease financial conditions. That’s far from an ideal fundamental basis for owning spread product, and it won’t keep credit outperforming forever, but we expect it will allow spread product to continue to generate positive excess returns over Treasuries and cash over the next twelve months. Recession Prospects There is no doubt that the probability of a recession is rising. COVID-19 is already exerting intense pressure on the airline and hotel industries, and strapped small businesses will find themselves in its crosshairs soon. It is certainly possible that a recession could sneak up on us while we focus on our assessment of the monetary policy backdrop. But just as COVID-19 survival rates are heavily influenced by a patient’s intrinsic condition, the economy’s prognosis may be a function of its pre-outbreak status. To assess the economy’s vital signs, we begin with housing, the major economic segment with the greatest interest-rate sensitivity. If monetary policy is less accommodative than we’ve estimated, the housing market might be gasping for air, but it appears to be as fit as a fiddle. Permits and starts turned sharply higher in the middle of last year (Chart 3, top panel), following the sales component of the NAHB survey (Chart 3, bottom panel) and purchase mortgage applications (Chart 3, middle panel). Homes are already quite affordable, relative to history (Chart 4, top panel), and they’re bound to get even more affordable as mortgage rates fall. Chart 3Housing Charts Are Up And To The Right Across The Board
Housing Charts Are Up And To The Right Across The Board
Housing Charts Are Up And To The Right Across The Board
Chart 4Homes Are Amply Affordable
Homes Are Amply Affordable
Homes Are Amply Affordable
Nothing in the available data indicates that housing is running too hot. Residential investment’s contribution to GDP has flipped from barely negative to modestly positive (Chart 5), and there are no signs that its current course is unsustainable. Unsold inventories and the share of vacant homes are at 25-year lows (Chart 6), and starts and permits are only just catching up with the multi-year average of household formations, suggesting that the market has been undersupplied since the crisis excesses were worked off. The overall takeaway is that the housing market is in the early days of an overdue recovery that has plenty of room to run. Chart 5Residential Investment's Current Pace Is Easily Sustainable, ...
Residential Investment's Current Pace Is Easily Sustainable, ...
Residential Investment's Current Pace Is Easily Sustainable, ...
Chart 6... And The Housing Market Still Looks Undersupplied
... And The Housing Market Still Looks Undersupplied
... And The Housing Market Still Looks Undersupplied
Chart 7The Labor Market Is Strong
The Labor Market Is Strong
The Labor Market Is Strong
Table 2No Sign Of Recession Here
Hot Takes
Hot Takes
February’s employment situation report, ignored by markets in the throes of Friday's selloff, suggests that the labor market, and by extension the economy, was in fighting trim before COVID-19 took root in American soil (Chart 7). February’s net job additions far surpassed consensus estimates, and the figures for January and December were revised appreciably higher (Table 2). With the three-month moving average of net additions coming in one-third higher than expected, the report was nothing short of tremendous. The March release is sure to be worse, and the all-time record streak of expanding monthly payrolls may well come to an end, but the patient was in an awfully robust state before it encountered the virus, and that bodes well for its immediate future. The Democratic Primaries Super Tuesday turned out to be super for US financial markets. With all of the Democratic party’s machinery now at the service of Joe Biden, the probability that frightening left-tail outcomes might emerge from the general election has been dramatically reduced. Markets can live with a Biden-Trump contest no matter how it turns out. Although we thought that markets were exaggerating the potentially negative conditions that would ensue under President Sanders, they would have been subject to rolling bouts of angst every time his general election prospects rose. Though our geopolitical strategists unwaveringly saw the former vice president as the Democratic frontrunner, theirs was a decidedly minority view. Following the Nevada caucus, Sanders was viewed far and wide as the presumptive nominee. Although a Biden administration would presumably be less market-friendly than the current administration, he himself is a card-carrying member of the establishment and wouldn’t do anything that would upset the apple cart. From an investment perspective, Biden is the candidate that would Make America Predictable Again, and even if re-election is markets’ preferred outcome, the prospect of a Biden presidency is hardly frightening. Investment Implications Although our conviction level has fallen in the face of COVID-19 uncertainties, we hold to our view that a soft patch is more likely than a recession, and a correction is more likely than a bear market. We remain constructive on risk assets because we think the selling has gotten overdone. There may well be more of it, and the S&P 500 could reach its 2,708.92 bear-market level before we can publish again next Monday, but we will be buying it in our own account all the way there. We think the most plausible worst-case scenario is a sharp but short recession, produced by a nasty supply shock that frightens households and businesses enough that they cease to consume or invest. The demand strike would imperil indebted businesses that suffered the biggest revenue declines: airlines, hotels, restaurants, retailers, thinly capitalized oil producers and a range of small businesses. They would shrink their workforces and many would default on their loans. That would be bad, as all recessions are bad, but it wouldn’t be a replay of the crisis. Credit extended to the sorts of borrowers listed above, ex-small businesses, is well-dispersed throughout the economy via corporate bonds and securitizations. The exposures the SIFI banks and their large- and mid-cap regional bank cousins have retained will be easily absorbed by the layers of additional capital mandated by Dodd-Frank and Basel 3. It seems to us that markets are pricing in a significant probability of something much worse than a run-of-the-mill recession, and we think that sets up an attractive risk-reward profile for investors in risk assets. We reiterate our risk-friendly recommendations, though we now recommend that fixed-income investors maintain benchmark duration positioning. We failed to appreciate the potential scope for a decline in long yields and are correcting course now. Doug Peta, CFA Chief US Investment Strategist dougp@bcaresearch.com Footnotes 1 Boston, Claire and Raimonde, Olivia, “A 30-Year Mortgage Below 3%? Treasury Rally Offers Bargain Loans,” Bloomberg, March 5, 2020.
Big Changes
Big Changes
Underweight Our intra-sector positioning shifts with the recent S&P tech hardware storage & peripherals downgrade to underweight1 and this Monday’s trimming of the S&P software index to neutral, reduce the S&P tech sector to a below benchmark allocation. Business investment in tech has been losing market share for the better part of the last year and according to the national accounts tech capex is contracting. Excluding the software industry, capital outlays are in dire straits (top & second panels). Meanwhile, lofty valuations, with the tech forward P/E trading at a 20% premium to the overall market, signal that there is no cushion for this deep cyclical sector that has 60% of sales originating abroad, the largest among its GICS1 peers (third panel). Tach on the coronavirus outbreak, and if supply chain breakdowns increase over the course of the next few weeks, then more tech profit warnings are looming and the resulting hit to still ultra-wide relative profit margins and EPS will likely be severe (bottom panel). Bottom Line: We trimmed the S&P tech sector to underweight. For more details, please refer to this Monday’s Weekly Report. Footnotes 1 Please see BCA US Equity Strategy Weekly Report, "Crosscurrents" dated February 3, 2020, available at uses.bcaresearch.com.
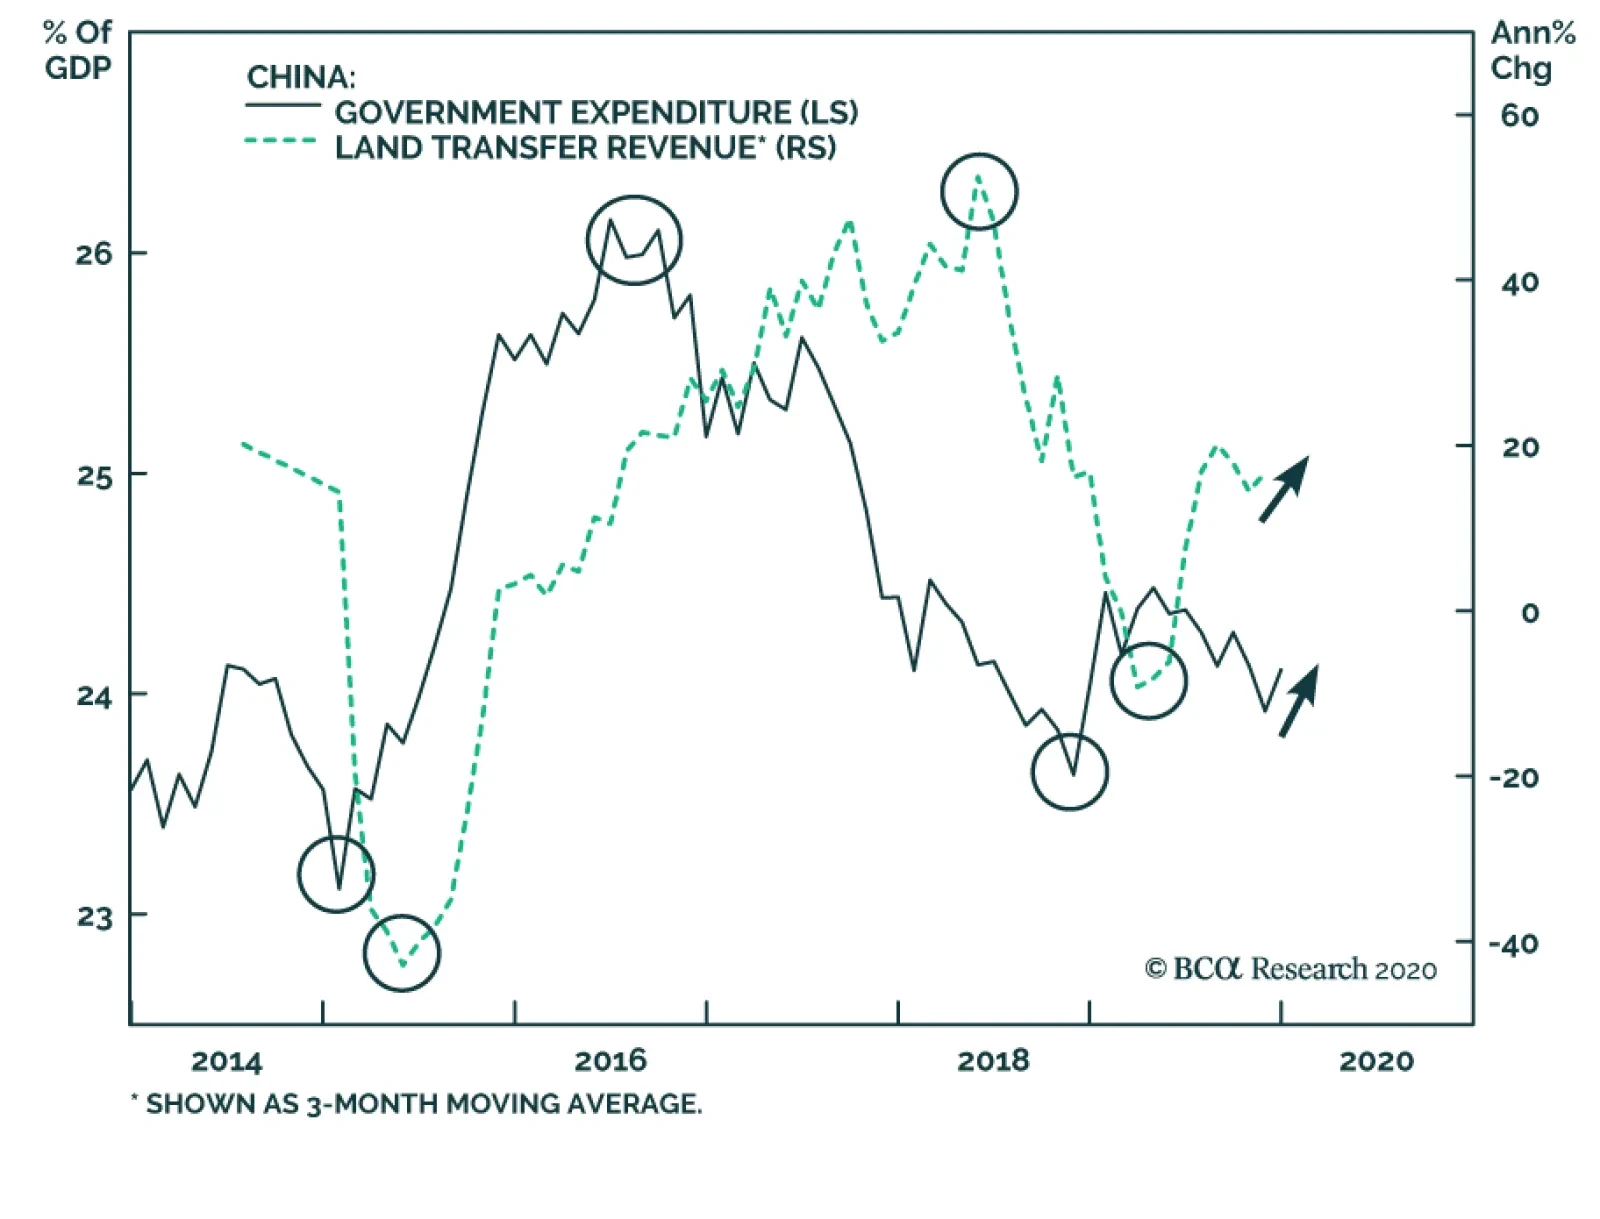
Yesterday, BCA Research's China Investment Strategy service concluded that land and home sales are likely to pick up in 2020 thanks to government expenditure. Investors should not expect large fluctuations in housing prices, but growth in home sales…
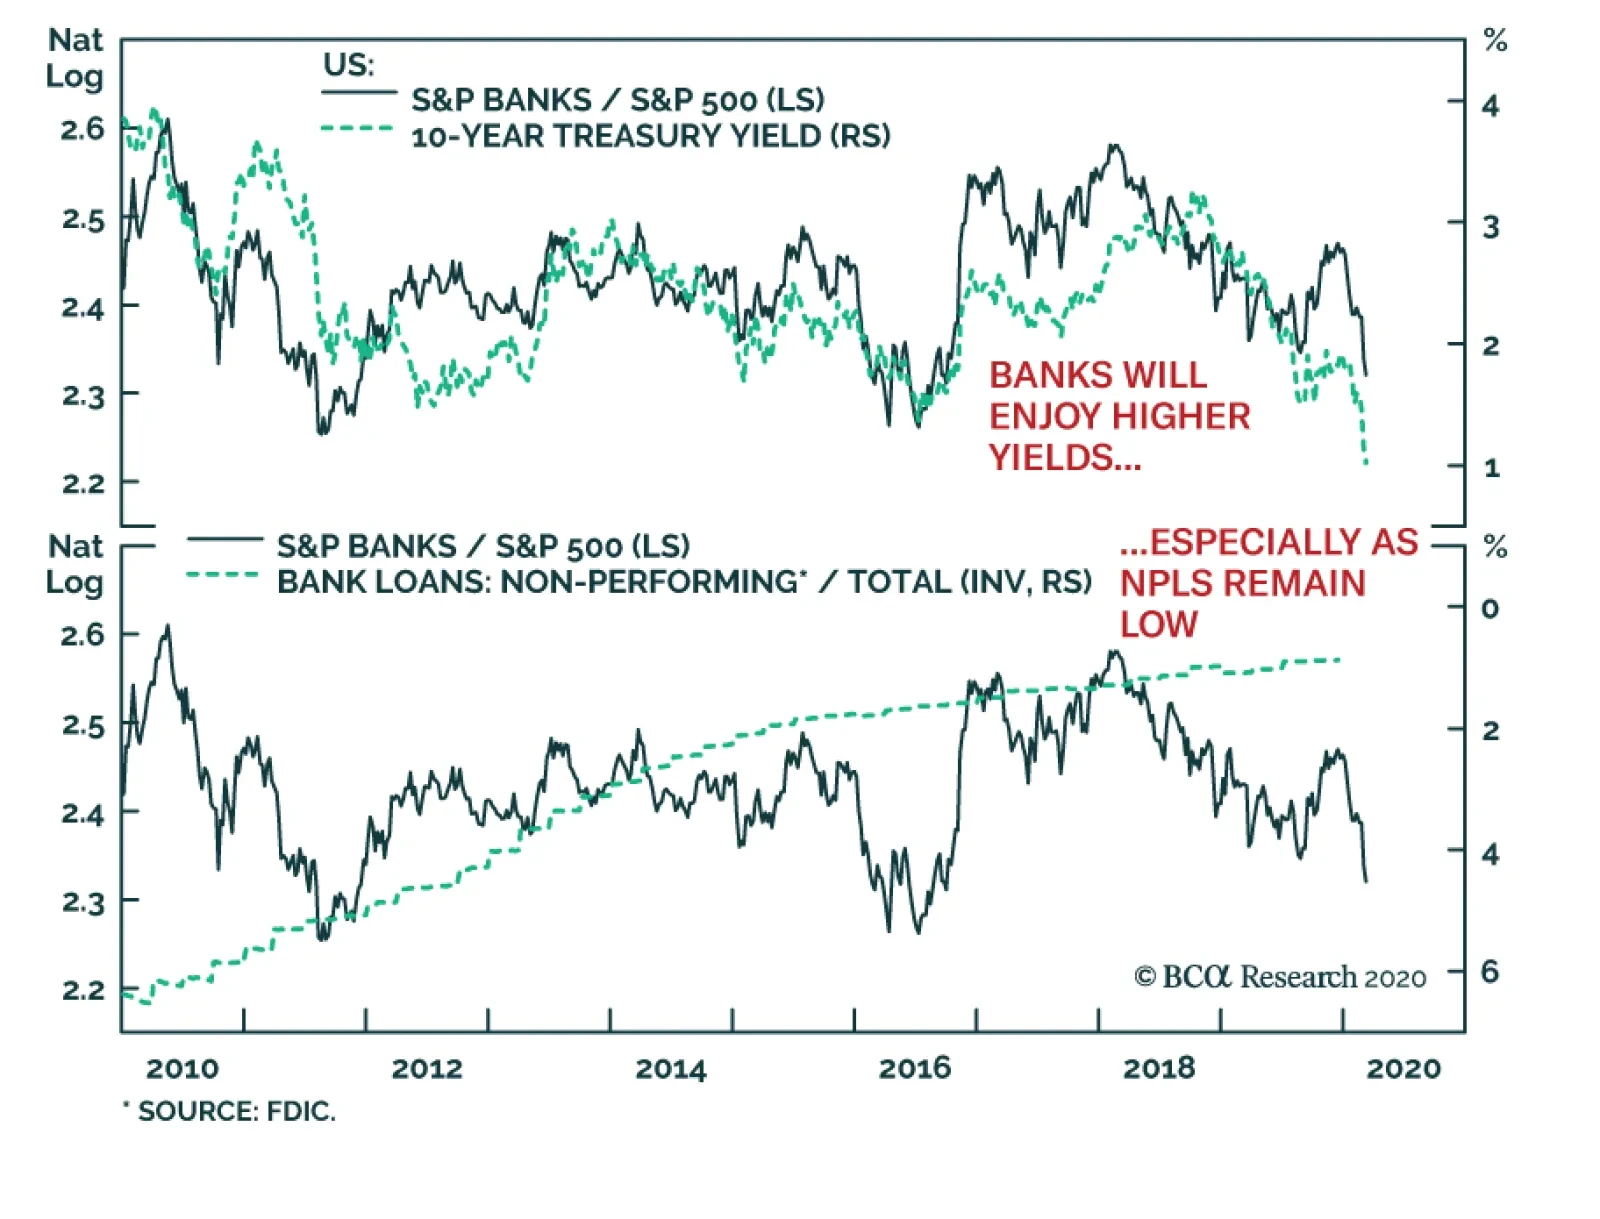
Year to date, financials have been the second worst-performing sector in the S&P 500, after energy. Within that group, banks fell nearly 20%, thanks to the collapse in yields caused by the COVID-19 outbreak. If our assessment that yields now have…