Sectors

Highlights At the current rate of work resumption, March’s PMI should rebound to its “normal range” from February’s historic lows. If so, our simple calculation, using China’s PMI figures and GDP growth in Q4 2008 as a template, suggests that China's economic growth in Q1 2020 should come in at around 3.2%. Chinese stocks passively outperformed global benchmarks in the last two weeks. The likelihood of a stimulus overshoot in the next 6-12 months continues to rise, supporting our view that Chinese stocks will actively outperform global benchmark in the coming months. Cyclical stocks have significantly outperformed defensives lately. While this is consistent with our constructive view towards Chinese equities in general, the magnitude of a tech stock rally in the domestic market of late appears to be somewhat excessive. As such, investors should focus their sector exposure in favor of resources, industrials, and consumer discretionary. The depreciation in the RMB against the dollar will come primarily from a stronger dollar rather than a weaker RMB, and the downside in the value of the RMB should be limited. Feature Despite the past week’s plunge in global equities due to the threat of a worldwide COVID-19 pandemic, Chinese stocks have outperformed relative to global benchmarks. This underscores our view that epidemic risks within China are slowly abating, and China’s reflationary response to the crisis will likely overcompensate for the short-term economic shock. Tables 1 and 2 highlight key developments in China’s economy and its financial markets in the past month. On the growth front, both the February official and Caixin PMIs dropped to historic lows as a result of the virus outbreak and nationwide lockdown. On the other hand, economic data from January confirmed that pre-outbreak activity in China was on track to recovery. Daily data also suggests that production in China continues to resume. Moreover, monetary conditions have significantly loosened and fiscal supports have materially stepped up. Chinese equities in both onshore and offshore markets dropped by 2% and 7% respectively (in absolute terms) from their January 13 peaks. Nevertheless, they have both significantly outperformed global equities, particularly in the past week. Equally-weighted cyclical stocks versus defensives in the onshore market have also moved up sharply, driven by a rally in the technology sector stocks. While the outperformance of cyclical stocks is consistent with our constructive view towards Chinese stocks, the magnitude appears to be excessive. Thus, we would advise investors positioning for a cyclical recovery in China to favor exposure in resources, industrials and consumer discretionary stocks. Table 1China Macro Data Summary
China Macro And Market Review
China Macro And Market Review
Table 2China Financial Market Performance Summary
China Macro And Market Review
China Macro And Market Review
In reference to Tables 1 and 2, we have a number of observations concerning developments in China’s macro and financial market data: Chart 1Inventory And Production Shortages Are A Bigger Near-Term Concern Than Weaknesses In Demand
Inventory And Production Shortages Are A Bigger Near-Term Concern Than Weaknesses In Demand
Inventory And Production Shortages Are A Bigger Near-Term Concern Than Weaknesses In Demand
February’s drop in the official PMI below 40% is reminiscent of November 2008, which was the height of the global financial crisis. The raw material inventory sub-index of the PMI in February fell to a record low, a clear indication of strain in China’s manufacturing sector. While the finished goods inventory sub-index ticked up slightly compared with January, factories will likely run out of existing raw materials to produce goods if transportation logistics do not return to normal soon (Chart 1). A higher number in the new orders sub-index relative to production output also suggests the pressure on the supply side will intensify if the virus outbreak in China worsens and continues to disrupt manufacturing activities. This will in turn undermine the effectiveness of Chinese policy response. Daily data from various sources suggests Chinese industrial activities continue to pick up. Between February 10 (the first official return-to-work day after an extended Chinese New Year holiday) and February 25 (the cutoff date for responding to PMI surveys), daily coal consumption in China’s six largest power plants was only about 60% of consumption compared from the same period last year (adjusted for the Lunar Year calendar). This is in line with the 35.7 reading in February’s manufacturing PMI, versus 49.2 a year ago. In the last four days of February, however, coal consumption reached nearly 70% of last year’s consumption. This figure is in keeping with a 10 percentage point increase in the rate of work resumption of enterprises above-designated size in China’s coastal regions.1 If energy consumption and work resumption rates reach about 90% by the end of March compared with Q1 2019, then PMI in March should pick up to 45% or higher. A 45% or higher reading in March’s PMI will imply economic impact from the virus outbreak is mostly limited to February. A simple calculation using China’s GDP growth in Q4 2008 as a template suggests that China's economic growth in Q1 2020 should come in at around 3.2% in real terms. This is in line with the estimate from BCA's Global Investment Strategy service.2 As we pointed out in November last year,3 China is frontloading additional fiscal stimulus in Q1 2020 to secure the economic recovery, which started to bud prior to the virus outbreak. The increase in January’s credit numbers confirms our projection. The monthly flow in total social financing in January (with only three work weeks effectively) reached above RMB 5 trillion. This figure exceeded that in January 2019, the highest monthly credit number last year. Local government bond issuance in January was almost double that a year ago, and a total of 1.2 trillion local government bonds were issued in the first two months of this year - a 53% jump from the same period last year. This suggests that fiscal stimulus has indeed stepped up in 2020. Money supply in January was slightly distorted by the earlier Chinese New Year (it fell in January this year instead of February as in most years) and the COVID-19 outbreak. M1 registered zero growth from a year ago, whereas it grew by 0.4% in January 2019.4 Normally, during the month of the Chinese New Year, households have more cash in deposits whereas corporations have less as they pay pre-holiday bonuses to employees. This seasonality factor causes the growth rate in M0 to rise and M1 growth to fall. The seasonality was exacerbated by the nationwide lockdown on January 20 this year, as many real estate developers reportedly suffered from a significant reduction in home sales and delays in deposits for down payments. Household consumption in the service sector during the Chinese New Year was also severely suppressed. This explains near-zero growth in M1 and a larger-than-expected increase in household deposits in January (Chart 2). We expect the growth in both M0 and M1 to start normalizing in March, as production and household consumption continue to resume. While we do not expect large fluctuations in housing prices, we think growth in home sales may accelerate from Q2 2020. There are early signs that the government is starting to relax restrictions on the real estate sector, on a region by region basis. Land sales remain a major source of local governments’ income, accounting for more than half of total revenues as of last year. Chart 3 shows that as government expenditures lead land sales, a major increase in fiscal stimulus and local government spending means that a significant bump in land sales will be needed in 2020. A strengthening supply of land, coupled with the unlikelihood of large fluctuations in property prices, suggests that there will be more policy supports to the real estate sector and more incentives to boost housing demand. Chart 2Corporates Are Short On Cash
Corporates Are Short On Cash
Corporates Are Short On Cash
Chart 3Land And Home Sales Likely To Pick Up In 2020
Land And Home Sales Likely To Pick Up In 2020
Land And Home Sales Likely To Pick Up In 2020
In the past two weeks, China’s equity market has registered a near-vertical outperformance in both investable and domestic stocks relative to global benchmarks (Chart 4). While this recent outperformance was passive in nature, our policy assessment supports future active outperformance. The recently announced pro-growth policy initiatives increasingly resemble those rolled out at the start of the last easing cycle in 2015/2016. These policy initiatives increase the odds that the upcoming “insurance stimulus” will overcompensate for the short-term economic shock, and will likely lead to a significant rebound in corporate profits in the next 6-12 months. This supports our bullish view on Chinese stocks. Chart 5 also shows that, unlike during the 2015’s “bubble and bust” cycle, both the valuation and margin trading as a percentage of total market cap in China’s onshore market remain materially lower than 2015. Equally-weighted cyclical sectors continue to outperform defensives in both China’s investable and domestic markets, particularly the latter where stock prices in the technology sector were up 12% within the past month. While the outperformance of cyclical stocks relative to defensives is consistent with our constructive view towards Chinese equities in general, the magnitude appears to be somewhat excessive. Given this, we would advise investors positioning for a cyclical recovery in China’s economy to focus their sector exposure in favor of resources, industrials, and consumer discretionary stocks. Chart 4Chinese Stocks Strongly Outperformed Global Benchmarks Over The Past Two Weeks
Chinese Stocks Strongly Outperformed Global Benchmarks Over The Past Two Weeks
Chinese Stocks Strongly Outperformed Global Benchmarks Over The Past Two Weeks
Chart 5Onshore Market Trading Does Not Seem Overly Leveraged
Onshore Market Trading Does Not Seem Overly Leveraged
Onshore Market Trading Does Not Seem Overly Leveraged
China’s three-month repo rate (the de facto policy rate) has fallen significantly in the past month, roughly 30bps below its lowest level in 2016 (Chart 6). China’s government bond yields have also reached their lowest level since 2016. While corporate bond yield spreads in other major economies have picked up sharply in the past month, the reverse is happening in China. This suggests that the market is pricing in further easing and the notion that policy supports will be effective in preventing a surge in corporate bond default rate. From a global perspective, yield spreads on China’s onshore corporate bonds have been elevated since 2016. This indicates that investors have long either priced in a much higher default rate among Chinese corporate bond issuers, or demand an unjustifiably large risk premium (Chart 7). Since we expect Chinese policymakers to continue easing, risks of a surge in China’s corporate bond default rate remain low this year. As such, until we see signs that the Chinese authorities are reverting to a financial de-risking mode, we will continue to favor onshore corporate versus duration-matched government bonds. Chart 6Monetary Policy Now More Accommodative Than 2015-2016
Monetary Policy Now More Accommodative Than 2015-2016
Monetary Policy Now More Accommodative Than 2015-2016
Chart 7Chinese Corporates Pay High Risk Premium For Their Bonds, Even At A Relatively Low Default Rate
Chinese Corporates Pay High Risk Premium For Their Bonds, Even At A Relatively Low Default Rate
Chinese Corporates Pay High Risk Premium For Their Bonds, Even At A Relatively Low Default Rate
Chart 8The RMB Likely To Continue Outperforming Other EM Currencies
The RMB Likely To Continue Outperforming Other EM Currencies
The RMB Likely To Continue Outperforming Other EM Currencies
As we go to press, the Federal Reserve Bank has just made a 50bps cut to the Fed rate, the first emergency cut since the global financial crisis. The USD weakened against the Euro, the Japanese Yen, as well as the RMB immediately following the rate cut. While this reflects the market’s concerns of a worsening virus outbreak and the rising possibility of an economic slowdown in the US, the USD as a countercyclical currency will likely appreciate against most cyclical currencies as the virus continues spreading globally. Hence, the depreciation in the RMB against the dollar will come primarily from a stronger dollar rather than a weaker RMB, and the downside in the value of the RMB should be limited. The continuation of resuming production in China and the expectations of a Chinese economic recovery in Q2 will support an appreciation in the RMB against other EM currencies (Chart 8). Qingyun Xu, CFA Senior Analyst qingyunx@bcaresearch.com Jing Sima China Strategist jings@bcaresearch.com Footnotes 1 http://app.21jingji.com/html/2020yiqing_fgfc/ 2 Please see Global Investment Strategy Weekly Report "Markets Too Complacent About The Coronavirus," dated February 21, 2020, available at gis.bcaresearch.com 3 Please see China Investment Strategy Weekly Report "Questions From The Road: Timing The Turn," dated November 20, 2020, available at gis.bcaresearch.com 4 M1 is mainly made up by cash demand deposits from corporations, whereas M0 is mainly deposits from households Cyclical Investment Stance Equity Sector Recommendations
Crystallizing Gains
Crystallizing Gains
Neutral Market events last week compelled us to take profits of 51% in the S&P software index above and beyond the S&P 500’s return since the late-2017 inception and downgrade exposure to neutral. Last Monday we wrote that AAPL’s profit warning was the tip of the iceberg and an avalanche of warnings would ensue.1 MSFT followed suit and issued their own profit warning and this negative backdrop is not yet reflected in the sell side’s S&P software profit and revenue forecasts. Tack on the message from the contracting software sector deflator and odds are high that sales will underwhelm in the coming quarters (third panel). The latest GDP report also revealed that, up to recently bulletproof, software capex growth sunk to nil in Q4 (bottom panel). Not only in absolute, but also in relative terms software outlays have petered out and have been decreasing in intensity as measured by the decelerating contribution to GDP growth (second panel). Bottom Line: We took profits of 51% since inception in the S&P software index and downgraded to neutral. The ticker symbols for the stocks in this index are: BLBG: S5SOFT – MSFT, ADBE, CRM, ORCL, INTU, NOW, ADSK, ANSS, SNPS, CDNS, FTNT, PAYC, CTXS, NLOK. For more details, please refer to this Monday’s Weekly Report. 1 Please see BCA US Equity Strategy Weekly Report, "Vertigo" dated February 24, 2020, available at uses.bcaresearch.com.
Recently, we have been inundated with client requests to update our analysis and incorporate the coronavirus epidemic to our adverse EPS scenario. The chart below shows that in our worst case scenario, EPS will contract by 2.41% in calendar 2020. Assuming final 2019 EPS comes in at 162.95, using I/B/E/S’ latest estimate, then the 2020 EPS level falls to 159.02. Assigning a trough multiple of 16x results in a 2,544 SPX ending value as a worst case outcome. Importantly, our newly weighted expected 2020 EPS falls to 164.48 versus 169.40 previously as we penciled in a 60% and 50% probability that our worst case scenario materializes in EPS and multiple assumptions, respectively. As a result our expected end-2020 SPX value falls to 2,755 which makes the S&P 500 still 8% overvalued. Bottom Line: We remain cautious on the prospects of the broad equity market on a cyclical 9-12 month time horizon. For more details on our EPS model, please refer to this Monday’s Weekly Report.
Updating Our EPS Model
Updating Our EPS Model
Highlights Chart 1Making New Lows
Making New Lows
Making New Lows
While the number of daily new COVID-19 cases is falling in China, the virus is spreading rapidly to the rest of the world. It is now clear that the outbreak will not be contained, though much uncertainty remains about the magnitude and duration of the global economic fallout. US bond yields have dropped dramatically, with the 10-year yield threatening to break below 1% for the first time ever (Chart 1). Interest rate markets are also pricing-in a rapid Fed response, with more than 100 bps of rate cuts priced for the next year and a 50 bps rate cut discounted for March. On Friday, BCA released a Special Alert making the case that stock prices have fallen enough to buy the market, even on a tactical (3-month) horizon. It is too early to make a similar call looking for higher bond yields. While risk assets will get near-term support from a dovish monetary policy shift, bond yields will stay low (and could even fall further) until global economic recovery appears likely. On a 12-month horizon, our base case scenario is that the Fed will not have to deliver the 110 bps of cuts that are currently priced. We therefore expect bond yields to be higher one year from now. But investors with shorter time horizons should wait before calling the bottom in yields. Feature Investment Grade: Neutral Chart 2Investment Grade Market Overview
Investment Grade Market Overview
Investment Grade Market Overview
Investment grade corporate bonds underperformed the duration-equivalent Treasury index by 176 basis points in February, dragging year-to-date excess returns down to -255 bps. Coronavirus fears pushed spreads wider in February, and the average spread for the overall investment grade index moved back above our cyclical target (Chart 2).1 As for specific credit tiers, Baa spreads are 9 bps above target and Aa spreads are 3 bps cheap. A-rated spreads are sitting right on our target, and Aaa debt remains 5 bps expensive. Looking beyond the economic fallout from the coronavirus, accommodative monetary conditions remain the key support for corporate bonds. Notably, both the 2-year/10-year and 3-year/10-year Treasury slopes steepened in February, and both remain firmly above zero. This suggests that the market believes that the Fed will keep policy easy. As we discussed two weeks ago, restrictive Fed policy – as evidenced by an inverted 3-year/10-year Treasury curve and elevated TIPS breakeven inflation rates – is required before banks choke off the supply of credit, causing defaults and a bear market in corporate spreads.2 Bottom Line: Corporate spreads will keep widening until coronavirus fears abate, but COVID-19 will not cause the end of the credit cycle. Once the dust settles, a buying opportunity will emerge in investment grade corporates, with spreads back above our cyclical targets. Table 3ACorporate Sector Relative Valuation And Recommended Allocation*
Too Soon To Call The Bottom In Yields
Too Soon To Call The Bottom In Yields
Table 3BCorporate Sector Risk Vs. Reward*
Too Soon To Call The Bottom In Yields
Too Soon To Call The Bottom In Yields
High-Yield: Overweight Chart 3High-Yield Market Overview
High-Yield Market Overview
High-Yield Market Overview
High-Yield underperformed the duration-equivalent Treasury index by 271 basis points in February, dragging year-to-date excess returns down to -379 bps. The junk index spread widened 110 bps on the month and is currently 37 bps below its early-2019 peak. Ex-energy, the average index spread widened 93 bps in February. It is 71 bps below its 2019 peak. High-yield spreads were well above our cyclical targets prior to the COVID-19 outbreak and have only cheapened further during the past month. More spread widening is likely in the near-term, but an exceptional buying opportunity will emerge once virus-related fears fade. This is especially true relative to investment grade corporate bonds. To illustrate the valuation disparity between investment grade and high-yield, we calculated the average monthly spread widening for each credit tier during this cycle’s three major “risk off” phases (2011, 2015 and 2018). We then used each credit tier’s average option-adjusted spread and duration to estimate monthly excess returns for that amount of spread widening (Chart 3, bottom panel). The results show that, in past years, Baa-rated corporates behaved much more defensively than Ba or B-rated bonds. But now, because of the greater spread cushion and lower duration in the junk space, estimated downside risk is similar. In other words, the valuation disparity between investment grade and junk means that investment grade corporates offer much less downside protection than usual compared to high-yield. MBS: Neutral Chart 4MBS Market Overview
MBS Market Overview
MBS Market Overview
Mortgage-Backed Securities underperformed the duration-equivalent Treasury index by 7 basis points in February, dragging year-to-date excess returns down to -60 bps. The conventional 30-year zero-volatility spread widened 1 bp on the month, driven by a 7 bps widening of the option-adjusted spread that was partially offset by a 6 bps reduction in expected prepayment losses (aka option cost). The 10-year Treasury yield has made a new all-time low, and the 30-year mortgage rate – at 3.45% – is only 14 bps above its own (Chart 4). At these levels, an increase in mortgage refinancing activity is inevitable, and indeed, the MBA Refi index has bounced sharply in recent weeks. MBS spreads, however, have not yet reacted to the higher refi index (panel 3). The nominal spread on 30-year conventional MBS is only 9 bps above where it started the year, and expected prepayment losses are 5 bps lower.3 Some widening is likely during the next few months, and we recommend that investors reduce exposure to Agency MBS. Even on a 12-month horizon, MBS spreads offer good value relative to investment grade corporate bonds for now (bottom panel), but investment grade corporates will cheapen on a relative basis if the current risk-off environment continues. This is probably a good time to start paring exposure to MBS, with the intention of re-deploying into corporate credit when spreads peak. Government-Related: Underweight Chart 5Government-Related Market Overview
Government-Related Market Overview
Government-Related Market Overview
The Government-Related index underperformed the duration-equivalent Treasury index by 86 basis points in February, dragging year-to-date excess returns down to -99 bps. Sovereign debt underperformed duration-equivalent Treasuries by 270 bps in February, dragging year-to-date excess returns down to -367 bps. Foreign Agencies underperformed the Treasury benchmark by 162 bps on the month, dragging year-to-date excess returns down to -189 bps. Local Authority debt underperformed Treasuries by 14 bps in February, dragging year-to-date excess returns down to +47 bps. Domestic Agency bonds underperformed by 5 bps in February, dragging year-to-date excess returns down to -7 bps. Supranationals outperformed by 5 bps on the month, bringing year-to-date excess returns up to +7 bps. We continue to see little value in USD-denominated Sovereign debt, outside of Mexico and Saudi Arabia where spreads look attractive compared to similarly-rated US corporate bonds (Chart 5). The Local Authority and Foreign Agency sectors, however, offer attractive combinations of risk and reward according to our Excess Return Bond Map (see Appendix C). Our Global Asset Allocation service just released a Special Report on emerging market debt that argues for favoring USD-denominated EM sovereign debt over both USD-denominated EM corporate debt and local-currency EM sovereign bonds.4 Municipal Bonds: Overweight Chart 6Municipal Market Overview
Municipal Market Overview
Municipal Market Overview
Municipal bonds underperformed the duration-equivalent Treasury index by 80 basis points in February, dragging year-to-date excess returns down to -114 bps (before adjusting for the tax advantage). The average Aaa-rated Municipal / Treasury (M/T) yield ratio rose 11% on the month to 88%, remaining below its post-crisis mean (Chart 6). For some time we have been advising clients to focus municipal bond exposure at the long-end of the Aaa curve, where yield ratios were above average pre-crisis levels. But last month’s sell-off brought some value back to the front end (panel 2). Specifically, the 2-year, 5-year and 10-year M/T yield ratios are all back above their average pre-crisis levels at 85%, 83% and 86%, respectively. 20-year and 30-year maturities are still cheapest, at yield ratios of 93% and 94%, respectively. Investors should adopt a laddered allocation across the municipal bond curve, as opposed to focusing exposure at the long-end. Fundamentally, state and local government balance sheets remain solid. Our Municipal Health Monitor is in “improving health” territory and state & local government interest coverage has improved considerably in recent quarters (bottom panel). Both trends are consistent with muni ratings upgrades continuing to outpace downgrades going forward. Treasury Curve: Maintain A Barbell Curve Positioning Chart 7Treasury Yield Curve Overview
Treasury Yield Curve Overview
Treasury Yield Curve Overview
The Treasury curve bull-steepened dramatically in February, with yields down at least 30 bps across the board. The 2/10 Treasury slope steepened 9 bps on the month, reaching 27 bps. The 5/30 slope also steepened 9 bps to reach 76 bps. February’s plunge in yields was massive, but the fact that it occurred without 2/10 or 5/30 flattening signals that the market expects the Fed to respond quickly and that any economic pain will be relatively short lived. In fact, the front-end of the curve is now priced for 110 bps of rate cuts during the next 12 months (Chart 7). That amount of easing would bring the fed funds rate back to 0.48%, less than two 25 basis point increments off the zero lower bound. Though the drop in 12-month rate expectations didn’t move the duration-matched 2/5/10 or 2/5/30 butterfly spreads very much, the 5-year note remains very expensive relative to both the 2/10 and 2/30 barbells (bottom 2 panels). The richness in the 5-year note will reverse if the Fed delivers less than the 110 bps of rate cuts that are currently priced for the next year. At present, we view less than 110 bps of easing as the most likely scenario, and therefore maintain our position long the 2/30 barbell and short the 5-year bullet. TIPS: Overweight Chart 8Inflation Compensation
Inflation Compensation
Inflation Compensation
TIPS underperformed the duration-equivalent nominal Treasury index by 159 basis points in February, dragging year-to-date excess returns down to -232 bps. The 10-year TIPS breakeven inflation rate fell 24 bps to 1.42%. The 5-year/5-year forward TIPS breakeven inflation rate fell 21 bps to 1.50%. Both rates remain well below the 2.3%-2.5% range consistent with the Fed’s inflation target. We have been recommending that investors own TIPS breakeven curve flatteners on the view that inflationary pressures will first show up in the realized inflation data and the short-end of the breakeven curve, before infecting the long-end.5 However, recent risk-off market behavior has caused long-end inflation expectations to fall dramatically, while sticky near-term inflation prints have supported short-dated expectations. Case in point, the 2-year TIPS breakeven inflation rate declined 16 bps in February, compared to a 24 bps drop for the 10-year (Chart 8). Inflation curve flattening could continue in the near-term but will reverse when risk assets recover. As a result, we recommend taking profits on TIPS breakeven curve flatteners and waiting for a period of re-steepening before putting the trade back on. Fundamentally, we note that the 10-year TIPS breakeven inflation rate is 38 bps cheap according to our re-vamped Adaptive Expectations Model (bottom panel).6 Investors should remain overweight TIPS versus nominal Treasuries on a 12-month horizon. ABS: Underweight Chart 9ABS Market Overview
ABS Market Overview
ABS Market Overview
Asset-Backed Securities underperformed the duration-equivalent Treasury index by 6 basis points in February, dragging year-to-date excess returns down to +26 bps. The index option-adjusted spread for Aaa-rated ABS widened 7 bps on the month. It currently sits at 33 bps, right on top of its minimum pre-crisis level (Chart 9). Our Excess Return Bond Map (see Appendix C) shows that Aaa-rated consumer ABS ranks among the most defensive US spread products. This explains why the sector has weathered the recent storm so well, and why it is actually up versus Treasuries so far this year. ABS also offer higher expected returns than other low-risk spread sectors such as Domestic Agency bonds and Supranationals. For as long as the current risk-off phase continues, consumer ABS are a more attractive place to hide than Domestic Agencies or Supranationals. However, once risk-on market behavior re-asserts itself, consumer ABS will once again lag other riskier spread products. In the long-run, we also remain concerned about deteriorating consumer credit fundamentals, as evidenced by tightening lending standards for both credit cards and auto loans, and a rising household interest expense ratio (bottom 2 panels). Non-Agency CMBS: Neutral Chart 10CMBS Market Overview
CMBS Market Overview
CMBS Market Overview
Non-Agency Commercial Mortgage-Backed Securities underperformed the duration-equivalent Treasury index by 42 basis points in February, dragging year-to-date excess returns down to +1 bp. The index option-adjusted spread for non-agency Aaa-rated CMBS widened 9 bps on the month. It currently sits at 76 bps, below its average pre-crisis level (Chart 10). In a recent Special Report, we explored how low interest rates have boosted commercial real estate (CRE) prices this cycle and concluded that a sharp drawdown in CRE prices is likely only when inflation starts to pick up steam.7 In that report we also mentioned that non-agency Aaa-rated CMBS spreads look attractive relative to US corporate bonds in risk-adjusted terms (Appendix C), and that the macro environment is close to neutral for CMBS spreads. Both CRE lending standards and loan demand were close to unchanged during the past quarter, as per the Fed’s Senior Loan Officer Survey (bottom 2 panels). Agency CMBS: Overweight Agency CMBS performed in line with the duration-equivalent Treasury index in February, leaving year-to-date excess returns unchanged at +35 bps. The index option-adjusted spread widened 2 bps on the month to reach 56 bps. Agency CMBS offer greater expected return than Aaa-rated consumer ABS, while also carrying agency backing (Appendix C). An overweight allocation to this sector remains appropriate. Appendix A: The Golden Rule Of Bond Investing We follow a two-step process to formulate recommendations for bond portfolio duration. First, we determine the change in the federal funds rate that is priced into the yield curve for the next 12 months. Second, we decide – based on our assessments of the economy and Fed policy – whether the change in the fed funds rate will exceed or fall short of what is priced into the curve. Most of the time, a correct answer to this question leads to the appropriate duration call. We call this framework the Golden Rule Of Bond Investing, and we demonstrated its effectiveness in the US Bond Strategy Special Report, “The Golden Rule Of Bond Investing”, dated July 24, 2018, available at usbs.bcaresearch.com. Chart 11 illustrates the Golden Rule’s track record by showing that the Bloomberg Barclays Treasury Master Index tends to outperform cash when rate hikes fall short of 12-month expectations, and vice-versa. Chart 11The Golden Rule's Track Record
The Golden Rule's Track Record
The Golden Rule's Track Record
At present, the market is priced for 110 basis points of cuts during the next 12 months. We anticipate a flat fed funds rate over that time horizon, and therefore anticipate that below-benchmark portfolio duration positions will profit. We can also use our Golden Rule framework to make 12-month total return and excess return forecasts for the Bloomberg Barclays Treasury index under different scenarios for the fed funds rate. Excess returns are relative to the Bloomberg Barclays Cash index. To forecast total returns we first calculate the 12-month fed funds rate surprise in each scenario by comparing the assumed change in the fed funds rate to the current value of our 12-month discounter. This rate hike surprise is then mapped to an expected change in the Treasury index yield using a regression based on the historical relationship between those two variables. Finally, we apply the expected change in index yield to the current characteristics (yield, duration and convexity) of the Treasury index to estimate total returns on a 12-month horizon. The below tables present those results, along with 95% confidence intervals. Excess returns are calculated by subtracting assumed cash returns in each scenario from our total return projections.
Too Soon To Call The Bottom In Yields
Too Soon To Call The Bottom In Yields
Too Soon To Call The Bottom In Yields
Too Soon To Call The Bottom In Yields
Appendix B: Butterfly Strategy Valuations The following tables present the current read-outs from our butterfly spread models. We use these models to identify opportunities to take duration-neutral positions across the Treasury curve. The following two Special Reports explain the models in more detail: US Bond Strategy Special Report, “Bullets, Barbells And Butterflies”, dated July 25, 2017, available at usbs.bcaresearch.com US Bond Strategy Special Report, “More Bullets, Barbells And Butterflies”, dated May 15, 2018, available at usbs.bcaresearch.com Table 4 shows the raw residuals from each model. A positive value indicates that the bullet is cheap relative to the duration-matched barbell. A negative value indicates that the barbell is cheap relative to the bullet. Table 4Butterfly Strategy Valuation: Raw Residuals In Basis Points (As Of February 28, 2020)
Too Soon To Call The Bottom In Yields
Too Soon To Call The Bottom In Yields
Table 5 scales the raw residuals in Table 4 by their historical means and standard deviations. This facilitates comparison between the different butterfly spreads. Table 5Butterfly Strategy Valuation: Standardized Residuals (As Of February 28, 2020)
Too Soon To Call The Bottom In Yields
Too Soon To Call The Bottom In Yields
Table 6 flips the models on their heads. It shows the change in the slope between the two barbell maturities that must be realized during the next six months to make returns between the bullet and barbell equal. For example, a reading of 50 bps in the 5 over 2/10 cell means that we would only expect the 5-year to outperform the 2/10 if the 2/10 slope steepens by more than 50 bps during the next six months. Otherwise, we would expect the 2/10 barbell to outperform the 5-year bullet. Table 6Discounted Slope Change During Next 6 Months (BPs)
Too Soon To Call The Bottom In Yields
Too Soon To Call The Bottom In Yields
Appendix C: Excess Return Bond Map The Excess Return Bond Map is used to assess the relative risk/reward trade-off between different sectors of the US bond market. It is a purely computational exercise and does not impose any macroeconomic view. The Map’s vertical axis shows 12-month expected excess returns. These are proxied by each sector’s option-adjusted spread. Sectors plotting further toward the top of the Map have higher expected returns and vice-versa. Our novel risk measure called the “Risk Of Losing 100 bps” is shown on the Map’s horizontal axis. To calculate it, we first compute the spread widening required on a 12-month horizon for each sector to lose 100 bps or more relative to a duration-matched position in Treasury securities. Then, we divide that amount of spread widening by each sector’s historical spread volatility. The end result is the number of standard deviations of 12-month spread widening required for each sector to lose 100 bps or more versus a position in Treasuries. Lower risk sectors plot further to the right of the Map, and higher risk sectors plot further to the left. Chart 12Excess Return Bond Map (As Of February 28, 2020)
Too Soon To Call The Bottom In Yields
Too Soon To Call The Bottom In Yields
Ryan Swift US Bond Strategist rswift@bcaresearch.com Footnotes 1 For more information on how we calculate our spread targets please see US Bond Strategy Weekly Report, “The Value In Corporate Bonds”, dated February 19, 2019, available at usbs.bcaresearch.com 2 Please see US Bond Strategy Weekly Report, “The Credit Cycle Is Far From Over”, dated February 18, 2020, available at usbs.bcaresearch.com 3 Expected prepayment losses (or option cost) are calculated as the difference between the index’s zero-volatility spread and its option-adjusted spread. 4 Please see Global Asset Allocation Special Report, “Understanding Emerging Markets Debt”, dated February 27, 2020, available at gaa.bcaresearch.com 5 Please see US Bond Strategy Special Report, “2020 Key Views: US Fixed Income”, dated December 10, 2019, available at usbs.bcaresearch.com 6 Please see US Bond Strategy Weekly Report, “How Are Inflation Expectations Adapting?”, dated February 11, 2020, available at usbs.bcaresearch.com 7 Please see US Investment Strategy / US Bond Strategy Special Report, “Commercial Real Estate And US Financial Stability”, dated January 27, 2020, available at usbs.bcaresearch.com Fixed Income Sector Performance Recommended Portfolio Specification Corporate Sector Relative Valuation And Recommended Allocation
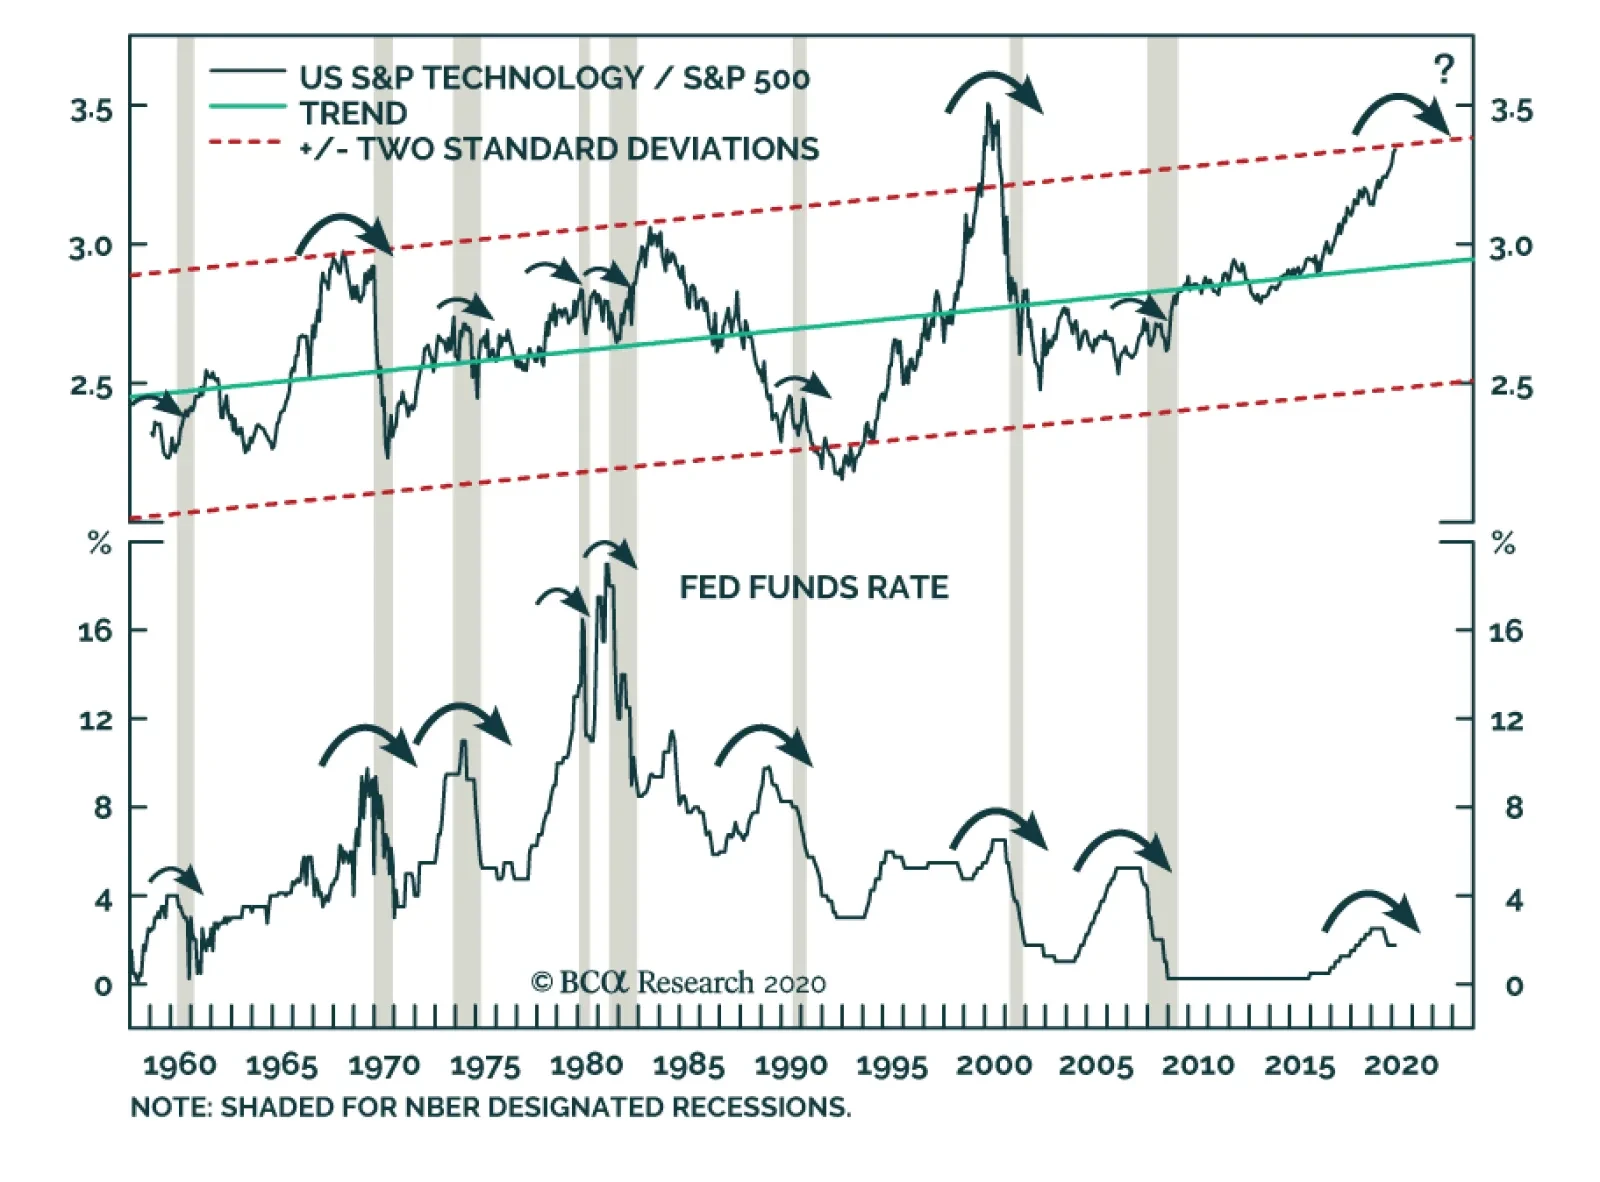
Yesterday, BCA Research's US Equity Strategy service downgraded the S&P tech sector to underweight. Tech stocks are stretched, trading near two standard deviations above the historical time trend, a level that has marked three previous peaks since…
Highlights Portfolio Strategy It is still early to bottom fish, and trying to catch the proverbial falling knife does not interest us for cyclically oriented capital. Uncertainty surrounding the coronavirus epidemic and its effects on economic and profit growth, and uncertainty with regard to US elections both signal that it still pays to be cautious on the prospects of the broad equity market on a cyclical 9-12 month time horizon. Lofty valuations, stretched technicals, souring macro and cresting capex, underscore that the time is ripe to take profits in software stocks and move to the sidelines. Faltering operating metrics, stretched relative valuations, a firming greenback, looming fed funds rate cuts and a contracting capex backdrop, all suggest that an underweight stance is now warranted in tech stocks. Recent Changes Book gains of 51% in the S&P software index and downgrade to neutral, today. Downgrade the S&P tech sector to underweight, today. We got stopped out and booked gains of 10% in the Global Gold Mining index. It is now neutral, from previously overweight. Table 1
From "Stairway To Heaven" To "Highway To Hell"?
From "Stairway To Heaven" To "Highway To Hell"?
Feature The SPX convulsed last week, as investors grappled with the risk of the coronavirus epidemic becoming a true pandemic (Chart 1A), and with Bernie Sanders likely clinching the Democratic nomination (Chart 1B). While a technical reflex rebound is in order as indiscriminate selling took center stage and we are looking to deploy short term oriented capital from current SPX levels all the way down to 2714 (or 20% SPX correction from recent peak), the cyclical outlook for the broad equity market remains grim. Chart 1ABlame The Virus….
Blame The Virus….
Blame The Virus….
Chart 1B…And Bernie
…And Bernie
…And Bernie
We have been cautioning investors all year long in our reports, warning that the stock market’s advance has been precarious on a number of fronts and have been recommending investors sell the market’s strength. First, the extreme concentration of returns in a handful of teflon-tech stocks has been disconcerting, heralding an equity market wobble.1 Likely, a mania has taken root in certain tech stocks and the inevitable bursting of the “ATLAS” mania (Apple, Tesla, Lam Research, AMD and Salesforce) would end in tears.2 As an update, as we went to press these five stocks were down 21% from their all-time highs. Second, on January 13 we highlighted that gold has been trumping the SPX and sniffing out two-to-three fed funds rate cuts, leading the fed fund futures market, similar to last spring (top & middle panels, Chart 2).3 Third, we highlighted that the recent positive correlation between the VIX and the SPX was disquieting and signaling that a pullback was nearing.4 Now the jump in the VIX along with the vol curve inversion and the collapse in the stock-to-bond ratio all warn that the path of least resistance for the market and the forward multiple remains lower (Chart 3). Chart 2Gold Sniffed Out Fed Cuts First
Gold Sniffed Out Fed Cuts First
Gold Sniffed Out Fed Cuts First
Chart 3Financial Conditions Are …
Financial Conditions Are …
Financial Conditions Are …
This has already tightened financial conditions according to the soaring junk spread (top panel, Chart 4), and we deem that unless the Fed relents and eases monetary policy, the stock market will remain in melt down mode. Fourth, market internals have been screaming “get out” of the broad equity market for some time now (bottom panel, Chart 4) and the epitome was when semi stocks stalled versus the NASDAQ 100 (middle panel, Chart 4).5 Fifth, the “tenuous trio” as we have coined it (stock prices, bond prices and the US dollar) cannot all rise simultaneously. Typically we cautioned, this gets resolved with an equity market pullback as a rising greenback is deflationary for US profits (bottom panel, Chart 2). Finally, in our “Sell The Rip” report, we worried about extreme investor complacency and showed that the economic backdrop was soft owing to the collapse in imports in Q4 2019, predating the coronavirus epidemic.6 Tying everything together, ultimately what matters most to equity investors is profit growth. On that front we have heavily relied on the message of our four-factor EPS growth model, which has consistently delivered. Chart 4…Tightening Rapidly
…Tightening Rapidly
…Tightening Rapidly
In mid-January, our SPX profit growth model continued to have no pulse, warning that the Street’s 10% profit growth estimate for calendar 2020 was unattainable. Our analysis of three EPS scenarios showed that at the time the SPX was overvalued by 8% according to the SPX 3,049 expected value for end-2020 that was actually hit last week.7 Recently, we have been inundated with client requests to update our analysis and incorporate the coronavirus epidemic to our adverse EPS scenario. Chart 5 shows that in our worst case scenario, EPS will contract by 2.41% in calendar 2020. Assuming final 2019 EPS comes in at 162.95, using I/B/E/S’ latest estimate, then the 2020 EPS level falls to 159.02. Assigning a trough multiple of 16x results in a 2,544 SPX ending value as a worst case outcome. Chart 5Our EPS Model Has Delivered
Our EPS Model Has Delivered
Our EPS Model Has Delivered
Importantly, our newly weighted expected 2020 EPS falls to 164.48 versus 169.40 previously as we penciled in a 60% and 50% probability that our worst case scenario materializes in EPS and multiple assumptions, respectively (Chart 6). As a result our expected end-2020 SPX value falls to 2,755 which makes the S&P 500 still 4% overvalued (please find the assumptions on the four factor model along with the updated table of expected outcomes in the Appendix below). While no one really knows how this virus outbreak will evolve, there are two predominant market narratives that can serve as positive catalysts: a.) China will massively ease both on the monetary and fiscal policy fronts (Chart 7) and b.) the Fed (and likely other CBs) will be forced to cut interest rates despite the fact that lower fed funds rates will likely not fix the supply side global problems owing to the corona virus. In other words, liquidity injections will remain upbeat. However, if these measures – especially on the Fed’s side – prove ineffective to generate GDP growth, then the risk of a recession will skyrocket for 2020, a presidential election year. Chart 6Updated Three EPS Scenarios
Updated Three EPS Scenarios
Updated Three EPS Scenarios
Chart 7How Much Will China Stimulate?
How Much Will China Stimulate?
How Much Will China Stimulate?
As a reminder, parts of the US yield curve (YC) first inverted in December 2018 and currently the 2-year/fed funds rate slope is inverted, implying that the bond market deems the Fed will ease monetary policy. In fact, the latest CME probability of a 50bps cut on March 18 last stood at 100%. Importantly, the YC inversions did not predict the oil embargoes of the 70s, or the 9/11 attacks or the sub-prime crisis or the coronavirus outbreak. Typically, the YC inverts at the point of maximum economic strength and signals that the cycle is long in the tooth, i.e. in the current episode, 2018 registered roughly 3% real GDP growth and 25% SPX EPS growth. Put differently, the YC inversion suggests that the economy is, at the margin, vulnerable to an external shock as economic growth settles down to a lower rate trajectory. While the YC inversion does not predict recession, it forewarns recession and we continue to heed this message (Chart 8). It will not be different this time. In sum, it is still early to bottom fish, and trying to catch the proverbial falling knife does not interest us for cyclically oriented capital. Uncertainty surrounding the coronavirus epidemic and its effects on economic and profit growth, and uncertainty with regard to US elections both signal that it still pays to be cautious on the prospects of the broad equity market on a cyclical 9-12 month time horizon. This week we are making some tech sector adjustments. Chart 8The Yield Curve is ALWAYS Right!
The Yield Curve is ALWAYS Right!
The Yield Curve is ALWAYS Right!
Crystalize Software Gains And Downgrade To Neutral… Market events last week compel us to take profits of 51% in the S&P software index above and beyond the S&P 500’s return since the late-2017 inception and downgrade exposure to neutral. The multiyear juggernaut in software stocks is primed for a much needed pause. Its appeal is well known as within the tech space software is considered a defensive holding owing to the productivity enhancing properties it enjoys in both good and bad times. Anecdotally, it was disquieting that the Standard & Poor’s decided to add two additional cloud stocks to the S&P 500 recently, further boosting the software group’s weight in the tech sector and in the SPX. Likely, the reason was the flurry of M&A deals that has been ongoing for years. Most recently however, this M&A frenzy hit a wall (top panel, Chart 9). Meanwhile, last Monday we wrote that AAPL’s profit warning was the tip of the iceberg and an avalanche of warnings would ensue.8 MSFT followed suit and issued their own profit warning and this negative backdrop is not yet reflected in the sell side’s S&P software profit and revenue forecasts. Tack on the message from the contracting software sector deflator and odds are high that sales will underwhelm in the coming quarters (middle panel, Chart 9). The latest GDP report also revealed that, up to recently bulletproof, software capex growth sunk to nil in Q4 (bottom panel, Chart 9). Not only in absolute, but also in relative terms software outlays have petered out and have been decreasing in intensity as measured by the decelerating contribution to GDP growth (Chart 10). Chart 9Softening…
Softening…
Softening…
Chart 10…Software Capex
…Software Capex
…Software Capex
Beyond investment, the recent plunge in the Markit services PMI that really ignited the recent selling in equities, warns that the time is ripe to cement software gains and move to the sidelines (Chart 11). Moreover, there is a high chance that IPOs peaked last year and will dry up in 2020, which is slightly negative for overall market sentiment in general and for market darlings software stocks in particular (Chart 11). From a technical perspective, software equities went ballistic. Relative momentum surged north of 25%/annum, a nineteen-year high (middle panel, Chart 12). Similarly, relative valuations went parabolic. The S&P software index trades at a 60% premium to the broad market on a forward P/E basis (bottom panel, Chart 12). Such overvaluation was last seen in 2003. Chart 11Do Not Overstay…
Do Not Overstay…
Do Not Overstay…
Chart 12…Your Welcome
…Your Welcome
…Your Welcome
Finally, we refrain from getting bearish this heavyweight tech subindex. Our long-held belief is that SaaS, the broader push to the cloud, augmented reality, AI and autonomous driving, which are all software dependent, are not fads, but are here to stay. Netting it all out, we do not want to overstay our welcome in the S&P software index and are cementing gains and moving to the sidelines, for now. Bottom Line: Take profits of 51% since inception in the S&P software index and downgrade to neutral. The ticker symbols for the stocks in this index are: BLBG: S5SOFT – MSFT, ADBE, CRM, ORCL, INTU, NOW, ADSK, ANSS, SNPS, CDNS, FTNT, PAYC, CTXS, NLOK. …Which Pushes Tech To Underweight Our intra-sector positioning shifts with the recent S&P tech hardware storage & peripherals downgrade to underweight9 and today’s trimming of the S&P software index to neutral, reduce the S&P tech sector to a below benchmark allocation. Tech stocks are stretched, trading near two standard deviations above the historical time trend, a level that has marked three previous peaks since 1960 (top panel, Chart 13). From a macro perspective, when the Fed cuts rates as the end of the cycle is nearing it has been a treacherous time to own tech stocks. If we are entering a recession owing to the coronavirus epidemic, underweighting tech stocks is the right portfolio strategy to generate alpha (Chart 13). Chart 13End Of Cycle Dynamics
End Of Cycle Dynamics
End Of Cycle Dynamics
Business investment in tech has been losing market share for the better part of the last year and according to the national accounts tech capex is contracting. Excluding the software industry, capital outlays are in dire straits (top & second panels, Chart 14). Meanwhile, lofty valuations, with the tech forward P/E trading at a 20% premium to the overall market, signal that there is no cushion for this deep cyclical sector that has 60% of sales originating abroad, the largest among its GICS1 peers (third panel, Chart 14). While the Fed will likely cut interest rates soon, the stampede in the US dollar, the reserve currency of the world, is unwelcome news for the heavily export-dependent US technology sector (trade-weighted US dollar shown inverted, middle panel, Chart 15). Chart 14Red Flag: Crumbling Tech Capex
Red Flag: Crumbling Tech Capex
Red Flag: Crumbling Tech Capex
Chart 15Large Foreign Sales Exposure Is Problematic
Large Foreign Sales Exposure Is Problematic
Large Foreign Sales Exposure Is Problematic
Turning over to tech-heavy Korean and Taiwanese exports, they peaked in 2017, and the coronavirus epidemic guarantees that they will suffer a steep decline in the coming months, dealing a blow to the tech sector’s top line growth prospects (bottom panel, Chart 15). If supply chain breakdowns increase over the course of the next few weeks as the coronavirus related shut downs accelerate, then more tech profit warnings are looming and the resulting hit to still ultra-wide relative profit margins and EPS will likely be severe (bottom panel, Chart 14). In more detail on the operating front, the coincident San Francisco Fed Tech Pulse Index is sinking like a stone and this weakness predates the coronavirus epidemic. The implication is that highly inflated relative share prices are vulnerable to a sizable pullback (second panel, Chart 16). Worrisomely, the industry’s new orders-to-inventories ratio is contracting at the fastest pace in eight years and bodes ill for still accelerating relative forward profit growth estimates (bottom panel, Chart 16). Finally, given the severity of recent market moves, when investors typically get margin calls they tend to sell their high flying stocks that currently are mostly concentrated in the tech space. Tack on the proliferation of passive investment, and as everyone is headed for the exit doors simultaneously, tech stocks that dominate hundreds of popular and large capitalization exchange traded funds are at risk of liquidation. Adding it all up, faltering operating metrics, stretched relative valuations, a firming greenback, looming fed funds rate cuts and a contracting capex backdrop, all signal that an underweight stance is now warranted in tech stocks. Bottom Line: Trim the S&P tech sector to underweight, today. Chart 16Weakening Operating Metrics
Weakening Operating Metrics
Weakening Operating Metrics
Housekeeping Our long GDX:US / short ACWI:US portfolio position got stopped out at a 10% gain. The global gold mining index is now back to neutral, from previously overweight. Anastasios Avgeriou US Equity Strategist anastasios@bcaresearch.com Appendix Table A1
From "Stairway To Heaven" To "Highway To Hell"?
From "Stairway To Heaven" To "Highway To Hell"?
Table A2
From "Stairway To Heaven" To "Highway To Hell"?
From "Stairway To Heaven" To "Highway To Hell"?
Table A3
From "Stairway To Heaven" To "Highway To Hell"?
From "Stairway To Heaven" To "Highway To Hell"?
Footnotes 1 Please see BCA US Equity Strategy Weekly Report, “Three EPS Scenarios”, dated January 13, 2020, available at uses.bcaresearch.com. 2 Please see BCA US Equity Strategy Weekly Report, “When The Music Stops…” dated January 27, 2020, available at uses.bcaresearch.com 3 Please see BCA US Equity Strategy Weekly Report, “Three EPS Scenarios” dated January 13, 2020, available at uses.bcaresearch.com. 4 Please see BCA US Equity Strategy Weekly Report, “Will The Fed Save The Day, Again?” dated February 18, 2020, available at uses.bcaresearch.com. 5 Please see BCA US Equity Strategy Weekly Report, “Crosscurrents” dated February 3, 2020, available at uses.bcaresearch.com. 6 Please see BCA US Equity Strategy Weekly Report, “Sell The Rip” dated February 10, 2020, available at uses.bcaresearch.com. 7 Please see BCA US Equity Strategy Weekly Report, “Three EPS Scenarios”, dated January 13, 2020, available at uses.bcaresearch.com. 8 Please see BCA US Equity Strategy Weekly Report, “Vertigo” dated February 24, 2020, available at uses.bcaresearch.com. 9 Please see BCA US Equity Strategy Weekly Report, “Crosscurrents” dated February 3, 2020, available at uses.bcaresearch.com. Current Recommendations Current Trades Strategic (10-Year) Trade Recommendations
From "Stairway To Heaven" To "Highway To Hell"?
From "Stairway To Heaven" To "Highway To Hell"?
Size And Style Views June 3, 2019 Stay neutral cyclicals over defensives (downgrade alert) January 22, 2018 Favor value over growth May 10, 2018 Favor large over small caps (Stop 10%) June 11, 2018 Long the BCA Millennial basket The ticker symbols are: (AAPL, AMZN, UBER, HD, LEN, MSFT, NFLX, SPOT, TSLA, V).
Highlights Supply constraints and unstoppable demand growth – the result of stricter regulations requiring higher loadings in autocatalysts to treat toxic pollution in automobile-engine emissions – will continue to push palladium’s price higher, despite a near-vertical move higher that began in 2H19. South Africa’s power grid is in a state of near-collapse, which will add volatility to mining operations focused on platinum-group metals – chiefly palladium, platinum and rhodium. South Africa accounts for 36% of global palladium production and 73% of platinum production, which makes it difficult to make the case that platinum could be substituted for palladium as its price rises. Palladium stocks are at risk of being further depleted globally as demand from automobile manufacturers in China, the US and Europe remains robust. This will keep palladium forward curves backwardated for the foreseeable future. While pressure to find alternatives for palladium will grow as prices rise, in absolute terms the additional cost resulting from higher prices for the metal – ~ $400 per vehicle – is not yet enough to draw significant investment to this effort. Feature Palladium markets are fundamentally tight and unresponsive to macroeconomic uncertainty. Table 1Top 5 Best Performing Commodities
Epic Palladium Rally Likely Continues
Epic Palladium Rally Likely Continues
In 2019, for the third year in a row, palladium prices outperformed other major commodities, returning an impressive 54% over the year (Table 1). This is the result of a massive 13% increase in demand for the metal – powered by strong autocatalyst demand for gasoline-powered cars in China and Europe, even as collapsing auto production globally and elevated trade uncertainty continue to dog automobile sales (Chart 1). This apparent contradiction is explained by stricter vehicle emissions regulations in major consuming markets – chiefly the Euro 6d, China 6 and US Tier 3 regimes – and power shortages in South Africa, which are introducing considerable volatility on the supply side in the second-largest producing country for the metal. Chart of the WeekSurging Autocatalyst Palladium Demand
Epic Palladium Rally Likely Continues
Epic Palladium Rally Likely Continues
Again this year, palladium markets are fundamentally tight and unresponsive to macroeconomic uncertainty. Palladium prices soared 39% YTD, its fastest 40-day increase since 2010. Unlike other commodity markets, palladium is completely disregarding the COVID-19 outbreak that originated in China late last year. Favorable supply-side fundamentals continue to drive the palladium rally: The metal’s decade-long physical supply deficit intensified in 2019 and we expect it to widen this year (Chart 2, panel 1). On the demand side, Chinese consumption is at risk. China is the world’s largest auto manufacturing market. Hubei Province – COVID-19’s epicenter – is a large car manufacturing hub, accounting for ~ 10% of the country’s annual automobile output. In the wake of COVID-19, the country’s car production is expected to fall 10% in 1Q20. In addition, the virus had infected more than 80,000 people globally, and has spread rapidly outside Hubei into Asia, Europe, the Middle East, Africa, and North America, raising the odds of a pandemic. Interestingly, speculative positioning and ETF investment demand is subdued, and is not inflating prices (Chart 2, panel 2). Chart 2Palladium Deficit To Widen This Year
Epic Palladium Rally Likely Continues
Epic Palladium Rally Likely Continues
Palladium Demand Soars As Auto Production Collapses Strong global automobile catalyst demand drove the rally in palladium prices last year. This occurred as car production fell by 9%, 8%, and 15% in US, China, and India – an unusual divergence in fundamentals. The culprit: Technical changes to autocatalysts from stricter emissions regulations. In China, the latest phase of car emissions regulations – China 6 – was gradually introduced in high-population centers, which also suffer from high levels of pollution. These centers accounted for ~ 60% of annual Chinese car sales in 2019. China 6 represents a major shift in emissions regulations and will make the Chinese auto fleet compliant with Europe’s best practices. As a result, palladium loadings in conforming light-duty gasoline vehicles reportedly increased by ~20% in 2019. This pushed China’s autocatalyst consumption up by 570k oz despite the drop in annual car sales, which created the rare dislocation between the country’s car production and palladium prices (Chart 3). We expect this trend to continue this year: China 6 is on track to be enforced countrywide – i.e., the remaining 40% of car sales – by mid-year, providing an additional ~ 10% boost in loadings of the metal. Chart 3Stricter Regulations Support Prices Amid Falling Car Production
Epic Palladium Rally Likely Continues
Epic Palladium Rally Likely Continues
In Europe, the introduction of Euro 6c legislation in September 2018 and the extension to all new vehicles of Euro 6d-TEMP regulations in September 2019 – mainly the real driving emissions (RDE) testing procedure adopted in the wake of the Volkswagen “dieselgate” scandal in 2015 – pushed palladium loading in autocatalysts up by ~ 25% from 2017 to 2019.1 The regulations became stricter in January 2020, putting additional stress on manufacturers to comply with the new standards, which will continue to support higher palladium loadings. We expect the COVID-19 outbreak to delay the recovery in global gasoline-powered vehicle production and consumption to 2H20. Lastly, in the US – which remains an important market for autocatalyst palladium demand (Chart 4) – the ongoing implementation of the Tier 3 legislation will continue to gradually increase palladium content in autocatalysts until 2025. For 2020, we do not expect this to significantly boost loadings per vehicle and are factoring in 2% growth. These legislative changes in major automotive markets produced a structural break in our palladium demand model (Chart 5). After adjusting our estimates for greater palladium content in gasoline aftertreatment systems, our model suggests that demand provides strong support to palladium prices, but also suggests other factors – i.e. supply and inventory – are at play. Chart 4North America's Auto Sector Remains A Large Share Of Palladium Demand
Epic Palladium Rally Likely Continues
Epic Palladium Rally Likely Continues
Chart 5Higher Palladium Loadings Largely Explains Last Year's Price Surge
Epic Palladium Rally Likely Continues
Epic Palladium Rally Likely Continues
In the US and Europe, consumers can absorb higher vehicle sales despite being close to saturated in terms of vehicle ownership. We expect the COVID-19 outbreak to delay the recovery in global gasoline-powered vehicle production and consumption to 2H20. In China, we expect the government will overstimulate its economy to meet its long-term goal of doubling its GDP and per capita income by 2020.2 Automobile ownership and vehicle sales there are low vs. DM economies, suggesting more upside for sales in China (Chart 6). In the US and Europe, consumers can absorb higher vehicle sales despite being close to saturated in terms of vehicle ownership. Car sales move in cycles around long-term demographic trends: The longer the current economic expansion, the further above-trend car sales can rise (Chart 7). Chart 6China: Structural Outlook For Autos Is Bright China Car Consumption Will Rebound In 2H20...
Epic Palladium Rally Likely Continues
Epic Palladium Rally Likely Continues
Chart 7... Likewise For Europe And US
Epic Palladium Rally Likely Continues
Epic Palladium Rally Likely Continues
Bottom Line: The combination of stricter environmental regulations in key gasoline-powered automobile markets and the post-coronavirus rebound in global auto consumption will push the palladium market further in deficit this year as it faces an inelastic supply, critically low inventories and low substitutability over the short-term (more on this below). Palladium Supply In 2020: Weak growth And Low Price-Elasticity Palladium supply is highly constrained. The largest supplies are concentrated in Russia (42%), South Africa (36%) and North America (14%). From 2015 to 2019, supply and capex grew by a very subdued 7% and 15.2% respectively, completely disregarding the 200% rise in prices (Chart 8, panel 1). This illustrates palladium supply’s extremely low price-elasticity.3 Palladium supply growth will remain muted for the foreseeable future, as Eskom begins long-delayed maintenance to refurbish its derelict generation fleet. Primary supplies declined by close to 2% last year on falling shipments from Russia and record electricity load-shedding – i.e. blackouts – in South Africa (Chart 8, panel 2).4 As tight as palladium markets are fundamentally, South Africa’s crippled power grid – long in need of upgrading and repair – has been, and remains, a key driver of short-term platinum-group metals (PGM) prices.5 Following the breakdown of close to 25% of the country’s generating capacity, Eskom – the nation’s utility monopoly responsible for ~ 90% of its electricity generation – has been forced to implement rolling blackouts to balance power supply and demand and prevent permanent damage to the country’s power grid. Palladium supply growth will remain muted for the foreseeable future, as Eskom begins long-delayed maintenance to refurbish its derelict generation fleet. Consequently, Stage 6 load-shedding events likely will become more frequent. These efforts are complicated by massive debt – ~ $30 billion – which has required government bailouts and forced the company to take loans from a Chinese industrial bank. Chart 8Top Palladium Producers' Capex Price-Elasticity Is Low
Epic Palladium Rally Likely Continues
Epic Palladium Rally Likely Continues
This is playing havoc with PGM supplies. During the unmatched Stage 6 load-shedding in December 2019 – cutting power to 37% of grid users – PGM supplies were reduced by 50%. Stockpiles covered the loss, but persistent blackouts lasting years could push markets into an actual shortage of palladium as inventories would rapidly be depleted. This is a significant risk: Eskom itself warned rolling blackouts will persist for the next 18 months.6 Elevated local currency PGM prices are postponing announced shafts closures, as miners seek to profit from the favorable pricing environment (Chart 9). But insufficient electricity capacity will weigh on mine supply growth over the next few years as companies hold-back on much-needed long-term investments. The final units of Eskom’s Medupi and Kusile projects are expected to be completed over the next two years – adding 4800MW to its installed capacity. This can partially alleviate South Africa’s electricity difficulties, but these units are not enough to support a rebound in economic and mine production growth. South Africa is in profound need of large-scale investments in its power sector. Close to 5000MW of power capacity is scheduled to shut down over the next five years (Chart 10). Chart 9Favorable Domestic Metal Prices For South African Miners
Epic Palladium Rally Likely Continues
Epic Palladium Rally Likely Continues
Chart 10South Africa Needs Additional Power Generation Capacity
Epic Palladium Rally Likely Continues
Epic Palladium Rally Likely Continues
After years of pressure from mining companies, South Africa’s minister of Mineral Resources and Energy announced it would allow companies to generate unlimited electricity for their own activities. The current political and economic climate is not constructive for meeting this challenge. The World Bank recently slashed South Africa’s 2020 GDP growth forecast to 0.9% from 1.5% previously on the back of electricity and infrastructure constraints impeding domestic growth and weak external demand. Likewise, rating agency Moody's signaled – ahead of its review of South Africa’s Baa3 credit rating in March – it could downgrade the country to speculative grade, citing the detrimental impact of recurring power outages on manufacturing and mining output. After years of pressure from mining companies, South Africa’s minister of Mineral Resources and Energy announced it would allow companies to generate unlimited electricity for their own activities. This will provide much-needed help to the country’s power sector. According to the Minerals Council South Africa, mining companies could bring an additional ~ 1500MW capacity online in the next 9 to 36 months. But doubts remain with regard to the timeline for companies to obtain the necessary licenses and if these can easily be acquired. Johnson Matthey expects supply growth in Russia – the largest producer – will be capped this year as Nornickel’s processing of old mines' copper concentrate – which boosted the company’s palladium supply over the past few years – is finalized. Still, a paltry 1% gain is possible from expected efficiency gains at existing mines, according to Nornickel. The company also announced it will increase production at its Talnakh and South Cluster mines, but this additional supply will only reach markets gradually as processing capacity constraints won’t be resolved until 2023, according to Johnson Matthey. Bottom Line: Growth prospects in the top two palladium-producing countries are weak in 2020. This will not suffice to meet the soaring autocatalyst demand. Higher recycling and inventory releases – both incentivized by higher prices – will be needed to balance the market. Palladium Stockpiles Are Dangerously Low We expect palladium prices will move higher on the expanding deficit, and backwardation in the forward curve will persist to incentivize the release of inventories to market (Chart 11). Yet, global palladium stockpiles have been declining since 2014 and are now at critically low levels, raising the risk of a disrupting shortage of the metal:7 ETF and exchange inventories now stand at a paltry 600k oz (Chart 12). These are the most price-elastic stocks and will get close to zero as prices increase. Chart 10Expect Backwardation To Persist
Epic Palladium Rally Likely Continues
Epic Palladium Rally Likely Continues
Chart 12Price-Sensitive Stockpiles Are Dangerously Low
Epic Palladium Rally Likely Continues
Epic Palladium Rally Likely Continues
Exhaustion of inventory would spike prices until demand destruction or additional supply – both inelastic in the short-run – are able to balance the market. The Russian Ministry of Finance’s reserves – a state secret – are now almost exhausted, according to Russia’s Norilsk Nickel, the largest supplier of physical palladium in the world. Last year, Norilsk Nickel held an estimated 1mm oz of the metal in its Global Palladium Fund, and signaled it is increasingly using its reserves to balance markets and provide needed liquidity. Earlier this year, the company released 3 MT of palladium to the market from stocks. Complete exhaustion of inventory would spike prices until demand destruction or additional supply – both inelastic in the short-run – are able to balance the market. Don’t Count On Substitution, Yet Switching to platinum requires significant capital- and resource-intensive R&D and appears to be beyond the current capabilities of automakers. We expect platinum prices to rise in 2020 supported by improving fundamentals, growing safe-haven demand, and markets pricing in increasing anticipation of substitution from palladium to platinum. Unlike palladium, platinum is also affected by safe-haven demand and gets bid up with gold and silver prices in periods of high uncertainty (Chart 13). With gold prices now above $1,600/oz, platinum will benefit from safe-haven flows due to its relative price advantage (Chart 14). Chart 13Safe-Haven Flows Support Platinum Prices
Epic Palladium Rally Likely Continues
Epic Palladium Rally Likely Continues
Chart 14Platinum Is Cheap Relative To Gold
Epic Palladium Rally Likely Continues
Epic Palladium Rally Likely Continues
We believe substitution will commence over the coming years, but this is a gradual process. Substitution from expensive palladium to low-priced platinum in industrial applications is the largest risk to our positive view on the palladium-to-platinum (Pd-to-Pt) ratio (Chart 15). This started in smaller and more price-elastic segments (e.g. dental, jewelry and diesel autocatalyst). However, to have a real impact on overall demand and thus the price ratio, substitution needs to take place in gasoline autocatalyst technology. The discount has been at a level consistent with substitution for more than a year, but the urgency to upgrade current designs to meet new environmental legislation and RDE regulations in China, Europe, and the US is the main focus of automakers this year. Switching to platinum requires significant capital- and resource-intensive R&D and appears to be beyond the current capabilities of automakers scrambling to meet the latest anti-pollution regulations globally. Moreover, large-scale substitution will take place only if automakers’ cost-benefit analysis points to significant long-term profits from switching. That said, platinum’s supply security remains a risk in the long-term: South Africa accounts for 73% of global production and our analysis suggests output growth there likely will remain weak over the next few years, especially as Eskom rebuilds its failing power grid. This lack of diversity increases sourcing risks for automakers, who, not without reason, would not want to switch over to platinum only to find that supply is also in doubt down the road. The overall platinum market is 26% smaller than that of palladium. Assuming a one-for-one substitution of Pd to Pt in gasoline catalyzers, a 1.2mm oz reduction in Pd demand – the amount required to reduce palladium’s deficit to zero – would send platinum markets to a 1.4mm oz deficit.8 Without substantial production growth, platinum prices would spike, reducing the profitability of investing in these new catalysts. Thus, substitution will eventually impact the price ratio, but will not be large enough to overturn absolute price level trends. In addition, the amount of PGMs in the typical autocatalyst – ~ 5 grams – adds $400 to the cost of the average automobile (Chart 15, lower panel). We do not believe this cost drives automakers' decisions, which is another reason the substitution of Pt for Pd likely will remain a topic of discussion more than action. Chart 15Palladium's Price Surge Adds ~0 Per Gasoline Car
Epic Palladium Rally Likely Continues
Epic Palladium Rally Likely Continues
Bottom Line: We believe substitution will commence over the coming years, but this is a gradual process and it will not happen on a meaningful scale this year. Thus, we expect the continuation of relative demand and inventory trends will provide a favorable setting for the Pd-to-Pt ratio this year (Chart 16). Chart 16Pd-to-Pt Price Ratio Will Increase Again in 2020
Epic Palladium Rally Likely Continues
Epic Palladium Rally Likely Continues
Hugo Bélanger Associate Editor Commodity & Energy Strategy HugoB@bcaresearch.com Robert P. Ryan Chief Commodity & Energy Strategist rryan@bcaresearch.com Commodities Round-Up Energy: Overweight Brent and WTI crude oil lost 5% and 4% this week, as fears of a global pandemic in the wake of the COVID-19 outbreak gripped markets. Reports of outbreaks in Asia ex-China, the Middle East and Europe fueled these concerns. Against this backdrop, OPEC 2.0 will be meeting in Vienna March 5 and 6 to consider cuts of 600k b/d recommended by its technical committee earlier this month. We continue to expect the full coalition to approve these cuts at the upcoming meetings. Saudi Arabia, Kuwait and the United Arab Emirates reportedly are considering an additional 300k b/d of cuts to offset the global demand hit delivered by COVID-19. The IEA estimates the COVID-19 outbreak will reduce Chinese refining throughput by 1.1mm b/d, and will reduce the call on OPEC crude by 1.7mm b/d in 1Q20. Base Metals: Neutral Iron ore prices weakened, following global equities lower, as the COVID-19 outbreak spread around the world. However, traders continue to report lower stocks of iron ore, which should keep prices supported, according to MB Fastmarkets (Chart 17). We remain long December 2020 high-grade iron ore (65% Fe) vs. short the benchmark 62% Fe contract on the Singapore Commodity Exchange, which we initiated November 7, 2019. This recommendation was up 5.3% as of Tuesday’s close, when we mark to market. Precious Metals: Neutral After retreating slightly from its run toward $1,700/oz earlier this week, gold remains well supported by safe-haven demand (Chart 18). In addition, actual and expected policy stimulus – e.g., Hong Kong's “helicopter money” drop of USD 1,200 to all permanent residents over the age of 18 – and expectations of additional central bank easing globally to offset the global spread of COVID0-19 will keep gold and precious metals generally supported. Markets should start pricing in higher inflation expectations as additional stimulus starts to roll in. Ags/Softs: Underweight Global grain markets could be set to rally sharply, as unusually wet weather in the Middle East and East Africa spawned by higher-than-usual cyclone activity produces perfect breeding conditions for desert locusts in the region over the next two months. According to National Geographic, by June the locusts could increase their populations “400-fold compared with today, triggering widespread devastation to crops and pastures in a region that’s already extremely vulnerable to famine.” This could put more than 13mm people in East Africa at risk of “severe acute food insecurity,” and imperil millions more. Chart 17China's Iron Ore Stocks Tight
Epic Palladium Rally Likely Continues
Epic Palladium Rally Likely Continues
Chart 18Safe Havens Gold, USD Well Bid
Epic Palladium Rally Likely Continues
Epic Palladium Rally Likely Continues
Footnotes 1 Please see New legislation planned in response to dieselgate, published by Autocar June 9, 2016. See also Johnson Matthey’s February 2020 Pgm Market Report. 2 Our view of strong Chinese fiscal and monetary stimulus was discussed in detail in our February 13, 2020 weekly report titled Iron Ore, Steel Poised For Rally. 3 Historically produced as an inferior byproduct from nickel, gold, and platinum mines, the price incentive from palladium alone isn’t enough to generate the needed investments in new mine production. According to Nornickel, this is slowly changing, palladium is an increasingly large part of mining companies’ revenues, making the metal a valuable co-product. This could improve mines investments’ responsiveness to movement in palladium prices over the medium term. 4 According to Eskom, “Load shedding is aimed at removing load from the power system when there is an imbalance between the electricity available and the demand for electricity. If we did not shed load, then the whole national power system would switch off and no one would have electricity.” The company’s load-shedding program includes 8 stages, where each stage represents the removal of 1000MW of demand – e.g., stage 5 removes 5000MW. This is done by shutting down specific sections of the grid. 5 The PGMs are ruthenium, rhodium, palladium, osmium, iridium, and platinum. 6 Things got worse after the December load-shedding event. Less than a month later, Reuters noted more than two times the power shed in December went “offline because of plant breakdowns. 7 This can be seen in the close to 12mm oz. decline in UK and Switzerland – home of the largest secured vaults of Palladium and Platinum – net imports. 8 Technological improvement in palladium catalysts has made the metal more efficient in for gasoline-powered engines vs. platinum. It has superior properties in terms of thermal durability and NOx reduction. Thus, the conversion could be greater than 1-to-1 and would imply a smaller share of palladium autocatalyst substitution could be absorbed by existing platinum supplies. Investment Views and Themes Recommendations Strategic Recommendations Tactical Trades TRADE RECOMMENDATION PERFORMANCE IN 2019 Q4
Epic Palladium Rally Likely Continues
Epic Palladium Rally Likely Continues
Commodity Prices and Plays Reference Table Trades Closed in 2020 Summary of Closed Trades
Epic Palladium Rally Likely Continues
Epic Palladium Rally Likely Continues
Batten Down The Hatches
Batten Down The Hatches
The malaise in global bourses intensified as the coronavirus epidemic is spreading like wildfire. The chart shows that the SPX and Google Trends searches worldwide for the word “coronavirus” are 100% inversely correlated. The longer the uncertainty around the coronavirus and its definitive effects on economic growth primarily and SPX EPS growth secondarily, the longer equity investors will remain nervous. Granted, at some point short-term selling will get exhausted and equities will have a reflex rebound. The big questions will be, do investors fade the knee jerk reaction rally or do they buy the dip? We would side with the former and please look forward to our upcoming Monday Weekly Report for additional details and further analysis as to why we remain cautious on a 9-12 month time horizon. Bottom Line: Stay cautious on the prospects of the broad equity market.
Highlights Demand for construction machinery in China will contract by 10-15% over the next 12-18 months. Diminishing replacement demand, deteriorating property construction activity and only a moderate acceleration in infrastructure investment will weigh on construction machinery sales in China. We recommend avoiding or underweighting global construction machinery stocks. Feature China is the largest manufacturer and consumer of construction machinery in the world. The country accounts for about 30% of global construction machinery demand in unit terms. Construction machinery includes heavy-duty vehicles performing earthwork operations or other hefty construction tasks. In this report, our coverage of construction machinery refers to the seven most-used construction machines in the world – excavators, loaders, cranes, road rollers, bulldozers, ball-graders and spreaders. Between 2016 and 2019, machinery sales surged by close to 170%. However, unlike during the 2009-2011 boom, sales were not widespread across all types of machinery. Sales of these machines are often used by investors and strategists as a microcosm to detect the potency of an economy’s business cycle. An increase in machine sales is usually interpreted as a sign of an acceleration in real estate construction and/or infrastructure spending. Chart I-1Excavators In China: Robust Sales Vs. Diminishing Working Hours
Excavators In China: Robust Sales Vs. Diminishing Working Hours
Excavators In China: Robust Sales Vs. Diminishing Working Hours
Are machinery sales a good measure of construction activity in both the real estate and infrastructure development? Not really. In this report we make the point that sales of construction machinery do not always reflect construction activity in the mainland. Specifically, Chart I-1 demonstrates that sales of excavators in China have differed from Komatsu’s Komtrax index for China. The latter is the average hours of operation per excavator. What explains this gap between resilient excavator sales and diminishing hours of excavator usage? This divergence has been due to the fact that robust excavator sales numbers have been supported by replacement demand as well as a changing product mix (a rising share of smaller and cheaper excavators bought by small entrepreneurs). China’s machinery imports have also been crowded out by a growing roster of domestically made models (import substitution). Boom-Bust Machinery Cycles Chart I-2Chinese Construction Machinery Demand Is Likely To Shrink
Chinese Construction Machinery Demand Is Likely To Shrink
Chinese Construction Machinery Demand Is Likely To Shrink
Chinese sales1 of construction machinery (thereafter, machinery) skyrocketed between 2009 and 2011, when China drastically boosted its infrastructure spending and property construction surged. The 2009-2011 boom was followed by a bust: Between 2012 and 2015, total machinery sales dropped by nearly 70%, (Chart I-2). That bust was succeeded by another boom: between 2016 and 2019, machinery sales surged by close to 170%. However, unlike during the 2009-2011 boom, sales were not widespread across all types of machinery: only excavator and crane sales boomed (Chart I-3). The other five categories – loaders, road rollers, bulldozers, ball-graders and spreaders – experienced a relatively muted sales recovery; their 2019 unit sales were well below their respective 2011 highs (Chart I-4). Chart I-3The 2016-2019 Boom: Only Sales Excavators And Cranes Hit A New High...
The 2016-2019 Boom: Only Sales Excavators And Cranes Hit A New High...
The 2016-2019 Boom: Only Sales Excavators And Cranes Hit A New High...
Going forward, we expect sales of construction machinery in China to experience a 10-15% downturn over the next 12-18 months (Chart I-2 on page 2). The basis for such a contraction is diminishing replacement demand, deteriorating property construction and only a moderate acceleration in infrastructure investment growth. Chart I-4...While Many Others Had A Relatively Muted Sales Recovery
...While Many Others Had A Relatively Muted Sales Recovery
...While Many Others Had A Relatively Muted Sales Recovery
Understanding Construction Machinery Demand China’s property construction and infrastructure development have been the main drivers behind construction machinery demand. Chart I-5 shows construction machinery sales in China are highly correlated with building floor space started. Meanwhile, Chart I-6 reveals that infrastructure investment distinctively led construction machinery sales between 2007 and 2013, but that relationship has broken down since 2014. Chart I-5Main Drivers For Construction Machinery Demand In China: Property Construction...
Main Drivers For Construction Machinery Demand In China: Property Construction...
Main Drivers For Construction Machinery Demand In China: Property Construction...
Chart I-6...And Infrastructure Spending
...And Infrastructure Spending
...And Infrastructure Spending
Crucially, in the past three years, property and infrastructure development alone have not been enough to explain the surge in construction machinery sales. In particular, between 2018 and 2019, growth of both building floor areas started and infrastructure investment were weak, yet construction machinery sales still surged by an astonishing 50%. Crucially, in the past three years, property and infrastructure development alone have not been enough to explain the surge in construction machinery sales. Specific developments in the excavator market were behind this surge. Excavators are the largest component of China’s construction machinery market, with a 52% market share (Chart I-7). The decoupling of excavator sales from property construction and infrastructure investment has been due to non-macro forces such as: Replacement demand: Given the average lifespan of an excavator is about eight years, the excavators bought in 2009-2011 were likely replaced during 2017-2019. Meanwhile, strengthening environmental regulations on emissions of heavy construction machinery also accelerated the pace of replacement. According to the China Construction Machinery Association, replacement demand accounted for about 60% of all excavator sales last year. Price drop: The significant reduction in excavator prices, ranging from 15%-30% since the middle of 2018, spurred more purchases. Prices of excavators imported into China have also dropped about 30% in the past 18 months (Chart I-8). The fundamental reason behind excavator producers cutting prices was weak demand amid lingering excess capacity. Chart I-7The Breakdown Of China’s Construction Machinery Sales
Chinese Construction Machinery Demand: Going Downhill
Chinese Construction Machinery Demand: Going Downhill
Chart I-8A Sizeable Drop In Prices Of Imported Excavators
A Sizeable Drop In Prices Of Imported Excavators
A Sizeable Drop In Prices Of Imported Excavators
Cranes are the only other construction machinery whose sales reached an all-time high last year. Similar to excavators, replacement demand has been the main factor behind sales. Excluding excavators and cranes, machinery sales have been lackluster, as illustrated in Chart I-4 on page 3. Bottom Line: Property construction and infrastructure development alone do not explain the strong growth in construction machinery sales between 2017 and 2019. Considerable replacement demand prompted by a sizable reduction in excavator prices also facilitated sales in China. A Downbeat Cyclical Demand Outlook Chart I-9Chinese Property Construction Is Very Weak
Chinese Property Construction Is Very Weak
Chinese Property Construction Is Very Weak
We remain downbeat on Chinese construction machinery demand going forward. Chinese sales of construction machinery will likely contract 10-15% over the next 12-18 months (Chart I-2 on page 2). First, the Chinese property market remains vulnerable to the downside in 2020. A comprehensive measure of Chinese property construction activity – the “building construction” dataset2 – shows that “building construction” floor area started, under construction and completed are all either stagnant or in contraction (Chart I-9). Real estate is still facing considerable headwinds. The COVID-19 outbreak will reduce household income growth and hence weigh on home purchases in the months to come. In the meantime, structural impediments such as poor housing affordability, slowing rural-to-urban migration, demographic changes and the promotion of the housing rental market will also curtail housing demand. Further, the drop in sales will shrink developers’ cash flow, curbing their already feeble financial position to undertake new construction or complete already started projects. Second, the growth rate of China’s infrastructure investment will likely rebound only moderately from its current nominal 3% pace (Chart I-6 on page 4). Even though the central government is likely to implement more fiscal stimulus due to the current coronavirus outbreak, the infrastructure investment growth rate will still be well below the double digits it registered for most of the past decade. Local government special bond quotas are currently a moving target. No doubt, if economic conditions continue to deteriorate, the central government will continue to increase quotas. However, there are several critical points about the importance of special bond issuance that are worth emphasizing: Special bonds accounted for 14% of total infrastructure investment in 2019. Special bond issuance amounted to 7% of combined local government and government-managed funds expenditures last year. Aggregate infrastructure spending was equal to 30% of fixed asset investment excluding the value of land, and 18% of nominal GDP in 2019. It is roughly equal to property construction. Therefore, modest acceleration in infrastructure spending will likely be offset by shrinking property construction. On the whole, barring irrigation-style fiscal and credit stimulus – which has been repeatedly rejected by Beijing – infrastructure spending is unlikely to surge to the extent it did in 2009-‘10, 2013 and 2016-‘17. It is critical to realize that infrastructure spending during those episodes was funded not by Beijing-approved debt but via bank and shadow-banking credit that was beyond Beijing's control. Chart I-10Excavator Sales Are Likely To Fall
Excavator Sales Are Likely To Fall
Excavator Sales Are Likely To Fall
Third, two specific factors below may result in a considerable reduction in excavator sales. Replacement demand will crater starting in 2020. Excavator sales in 2012 were 35% below their 2011 peak. Given the average eight-year replacement cycle, demand for excavators in 2020 and 2021 will be significantly below 2019 levels (Chart I-10). The price war in the excavator sector will continue, but it will fail to lift overall excavator demand. There are signposts that there is an oversupply of excavators in operation. Last year, excavator drivers (individual entrepreneurs) accounted for a large share of purchases, with the bulk of them opting for small-sized machines – the latter contributed about 70% of the total excavator sales growth. The surge in small service providers amid stagnant construction activity has intensified competition and hence depressed income among these individual owners. This will discourage new demand in the coming one to two years. A risk to this view is that replacement demand could be supported to some extent by increasingly stringent environmental rules. This year, the government will accelerate the scrapping process of off-road heavy vehicles below National III emission standards. Bottom Line: Chinese sales of construction machinery will likely experience a 10-15% downturn over the next 12-18 months, with the largest category – excavator sales – falling by 20% or more. Rising Competitiveness Of Chinese Machinery Producers China’s machinery producers have significantly enhanced their competitiveness. This has led to import substitution. For instance, sales of domestic-brand excavators accounted for 65% of total Chinese excavator sales, a considerable rise from 43% in 2014 and only 26% in 2009. Chinese sales of construction machinery will likely experience a 10-15% downturn over the next 12-18 months, with the largest category – excavator sales – falling by 20% or more. The increasing competitiveness of domestic producers has resulted in not only shrinking imports but also rising exports of construction machinery. As a result, Chinese construction machinery net exports have been on the rise (Chart I-11). In fact, excavators, loaders, cranes, and spreaders have all shown increasing net exports in both volume and value terms (Chart I-12). Chart I-11Chinese Construction Machinery: Flat Exports, Less Imports
Chinese Construction Machinery: Flat Exports, Less Imports
Chinese Construction Machinery: Flat Exports, Less Imports
Chart I-12Increasing Net Exports Of Chinese Construction Machinery
Increasing Net Exports Of Chinese Construction Machinery
Increasing Net Exports Of Chinese Construction Machinery
We expect this trend to continue in the coming years. The ongoing Belt and Road Initiative (BRI) will facilitate construction machinery exports to BRI recipient countries. For example, on January 12, Chinese construction machinery manufacturer Zoomlion delivered its first batch of an order of 100 excavators to Ghana as part of a BRI agreement. Total BRI investment with Chinese financing will fall moderately in 2020, as the Chinese government will be applying greater scrutiny and tighter oversight over lending for BRI projects. However, we believe this moderate decline in BRI investment will not affect the country’s construction machinery exports by much. Chinese construction machinery companies are highly focused on technology improvements and 5G applications for their products. This will continue to increase the competitiveness of Chinese construction machinery producers. For example, last May, the 5G-based unmanned mining truck made its debut in China’s Bayan Obo mining region. Autonomous vehicles are more efficient and cheaper to maintain. The Bayan Obo mining area plans to purchase more unmanned mining trucks and transform existing traditional vehicles, with plans to make over 65% of its future fleet of mining cars autonomous. Technology improvements and 5G application will further enhance Chinese construction machinery producers’ productivity, making their products more competitive in the global marketplace. Bottom Line: China’s construction machinery net exports will continue to rise, implying a rising market share for mainland producers. This is a bad sign for foreign producers. Investment Implications Global construction machinery stock prices correlate closely with China’s domestic machinery sales (Chart I-13). This confirms the importance of the mainland, which accounts for 30% of global construction machinery demand. There are 30 stocks in the MSCI global construction machinery stock index, including Caterpillar, Komatsu, Paccar, Cummins and Volvo B. China’s construction machinery net exports will continue to rise, implying a rising market share for mainland producers. This is a bad sign for foreign producers. Global machinery producers will likely suffer from both shrinking demand in China and a loss of market share to mainland producers. In fact, both Caterpillar and Komatsu excavator sales are already in contraction, even though mainland excavator sales did not contract in 2019 (Chart I-14). Chart I-13Global Construction Machinery Stocks: Closely Correlate With Chinese Demand
Global Construction Machinery Stocks: Closely Correlate With Chinese Demand
Global Construction Machinery Stocks: Closely Correlate With Chinese Demand
Chart I-14Caterpillar And Komatsu Sales: Shrinking
Caterpillar And Komatsu Sales: Shrinking
Caterpillar And Komatsu Sales: Shrinking
However, a caveat is in order: both Caterpillar and Komatsu have manufacturing factories in China, ranking the third and seventh place in terms of domestic excavator sales, respectively. Hence, domestic producers also include some multinationals that have established operations on the mainland. A point on equity valuations is also in order: Chart I-15 demonstrates the cyclically adjusted P/E ratio for Caterpillar. This stock is not yet cheap. As its sales contract, the stock price will fall further. Chart I-15Cyclically-Adjusted P/E Ratio For Caterpillar: Not Cheap
Cyclically-Adjusted P/E Ratio For Caterpillar: Not Cheap
Cyclically-Adjusted P/E Ratio For Caterpillar: Not Cheap
Chart I-16Global Machinery Stocks Are At Risk
Global Machinery Stocks Are At Risk
Global Machinery Stocks Are At Risk
Overall, trailing EPS of both global construction machinery companies and mainland producers listed on the A-share market are beginning to contract (Chart I-16). This entails that their share prices are at risk. On the whole, we recommend avoiding or underweighting global machinery stocks. Ellen JingYuan He Associate Vice President ellenj@bcaresearch.com Footnotes 1 Please note that all the Chinese construction machinery sales data used in this report are compiled by China Construction Machinery Association. Based on the Association’s definition, its sales data Include exports and domestic sales of domestically produced machineries, but exclude imports. However, exports are small so this sales data can be used as a proxy of domestic demand. 2 This measure includes not only “commodity buildings” but also buildings built by non-real estate developers.
What Goes Up Must Come Down
What Goes Up Must Come Down
In this week’s report, we highlighted that from a technical perspective the SPX remained vulnerable. Specifically, its deviation from the 200-day moving average reached levels similar to the early-2018 blow-off top level (second panel). Similarly, drilling beneath the surface we noted that the percentage of S&P 500 groups trading above their 50-day and 200-day moving averages in absolute terms was also running high (third panel). At the same time, investor complacency reigned supreme. The coronavirus scare lasted a few days and despite AAPL’s recent warning, which is likely the tip of the iceberg as other companies are slated to issue Q1 profit warnings, investors were ignoring all the bad news and piling into equities in general and teflon-tech stocks in particular. As a reminder, the late-2019 peak in profit growth expectations came prior to the coronavirus outbreak (bottom panel). Bottom Line: We remain cautious on the prospects of the broad equity market.