Sectors

Highlights Portfolio Strategy Boeing’s 737 MAX grounding, China’s looming slowdown on the back of the coronavirus epidemic and weak industry operating metrics, all warrant a downgrade alert in the US aerospace index. Red hot demand for defense capital goods, defense industrial production that is firing on all cylinders, enticing industry operating metrics and pristine balance sheets, all suggest that it still pays to be long the pureplay defense index. Recent Changes There are no changes to our portfolio this week. Table 1
Vertigo
Vertigo
Feature Equities remained untethered last week, and floated skyward to fresh all-time highs. The second panel of Chart 1 shows that from a technical perspective the SPX has returned close to the early-2018 blow-off top level, when the deviation from its 200-day moving average reached a zenith. Similarly, drilling beneath the surface the percentage of S&P 500 groups trading above their 50-day and 200-day moving averages in absolute terms is also running high (third panel, Chart 1). Investor complacency reigns supreme. The coronavirus scare lasted a few days and despite AAPL’s recent warning, which is likely the tip of the iceberg and other companies are slated to issue Q1 profit warnings, investors are ignoring all the bad news and piling into equities in general and teflon-tech stocks in particular. Keep in mind that 12-month forward profit growth remains positively correlated with the 10-year US treasury yield. The former crested in early 2020, predating the coronavirus epidemic (bottom panel, Chart 1). The end result is a new multiple expansion phase with the S&P 500 forward P/E clearing the 19 handle. Chart 1Dizzying Heights
Dizzying Heights
Dizzying Heights
Such complacency transcends the equity market and spills over to the junk bond market. The hunt for yield remains intact and the Barclays US total return high yield index is following up the path of the SPX. Momentum is also tracking closely the broad equity market (top & middle panels, Chart 2). Nevertheless, we remain cautious. Last week we highlighted that the “tenuous trio” cannot go up indefinitely and a simultaneous rise in all three asset classes (stock prices, bond prices and the US dollar) typically portends an equity market crack.1 The big risk is that a surging greenback will short-circuit EPS growth and our worst case EPS scenario of -1% profit growth in calendar 2020 as we highlighted in mid-January will materialize.2 Worrisomely, while the S&P 500 made fresh all-time highs last week, the DXY came close to breaking above par, the VIX stayed stubbornly glued near 15 and gold bullion eclipsed $1,600/oz (third & bottom panels, Chart 2). Something has got to give. Meanwhile, Chart 3 updates our Corporate Pricing Power Indicator (CPPI) that recently came out of the deflation zone. This tick up in the CPPI coupled with still softening wage inflation have pushed our S&P 500 profit margin proxy slightly higher but still below the zero line, signaling that the margin contraction phase will likely run its course this year (bottom panel, Chart 3). Chart 2Spiking Greenback And Bullion Signal Trouble
Spiking Greenback And Bullion Signal Trouble
Spiking Greenback And Bullion Signal Trouble
Chart 3Modest Profit Margin Improvement
Modest Profit Margin Improvement
Modest Profit Margin Improvement
Drilling beneath the surface, our CPPI remains soft and vulnerable to a deflationary shock if the coronavirus epidemic severely wounds the global economy. As a reminder, we calculate industry group pricing power from the relevant CPI, PPI, PCE and commodity growth rates for each of the 60 industry groups we track. Table 2 also highlights shorter term pricing power trends and each industry's spread to overall inflation. Table 2Industry Group Pricing Power
Vertigo
Vertigo
A bit less than half of the industries we cover are lifting selling prices by more than 1%, and 35% are outright deflating. Worrisomely, 60% of the sectors we cover fail to raise prices at a faster clip than overall inflation. With regard to pricing power trends, roughly half of the industries we cover are either flat or in a downtrend (Table 2). Gold bullion remains on top of our table climbing at a 22%/annum rate despite the greenbacks recent rise, and only five additional commodity-related industries made it to the top thirty (Table 2). Most of the commodity complex is deflating courtesy of the appreciating US dollar, and the recent coronavirus epidemic will definitely sustain the downward pressure on commodity inflation as demand will likely suffer a major setback. Importantly, defensive sectors still occupy half of the top ten spots, similar to our last update in October 2019. On the flip side, four of the bottom eight industries are commodity related, a trend we expect to pick up steam in the coming quarters. This week we update our views on the two industrials sub-groups that are moving in opposite directions. Put The Aerospace Index On Downgrade Watch We are compelled to put the pureplay aerospace subgroup (currently rated neutral) on downgrade alert. A little over four years ago, we split the aerospace & defense coverage into pureplay aerospace and pureplay defense, as the profit drivers of these two industries started to steeply diverge. True, the yet to be completed UTX acquisition of RTN will re-complicate matters, but we will continue to cover these two groups independently. From a technical perspective, a head and shoulders pattern has likely formed, warning that the next leg down will be a rather painful one, especially if support at current levels gives way (top panel, Chart 4). Boeing (BA) dominates the pureplay aerospace subgroup and sustained delays to recertify the 737 MAX have weighed heavily on share prices. While the FAA and other country air safety regulators may give the green light for flights to resume for Boeing’s workhorse commercial jetliner, consumers may be reluctant to board this plane given all the negative publicity. This remains a big risk to BA and thus to the aerospace index. Chart 4Prior To Coronavirus Epidemic…
Prior To Coronavirus Epidemic…
Prior To Coronavirus Epidemic…
On the macro front, prior to the coronavirus epidemic, the global PMI was on the path to recovery with a plethora of countries climbing above the boom/bust line (middle & bottom panels, Chart 4). In China specifically, Bloomberg’s story count of China slowdown has returned to the historical lower band of this time series, at a time when BCA’s Chinese credit & fiscal easing impulses were ticking higher (second & third panels, Chart 5). Tack on the ongoing Chinese monetary easing, and factors were falling into place for a robust recovery in demand for US aerospace products (bottom panel, Chart 5). Chart 6 shows why China is so important to this industry. Not only is future commercial aircraft demand growth centered round China, but also China at the recent peak accounted for 15% of total US aerospace exports. In fact, aerospace exports to China tripled since the GFC. Chart 5…Macro Data Were Firming
…Macro Data Were Firming
…Macro Data Were Firming
Chart 6China Matters Most To Aerospace
China Matters Most To Aerospace
China Matters Most To Aerospace
Unfortunately, the coronavirus epidemic changes all the China-related calculus and will further dampen demand for aerospace products, at least in the near-term. Granted, US aerospace sales are already nosediving and so are operating profits. Industry new orders are in a freefall of late courtesy of the 737 MAX grounding and halt in production (second & third panels, Chart 7). As a result, profit margins have collapsed probing the Great Recession lows (bottom panel, Chart 7). Similarly, aerospace shipments have taken it to the chin and inventories are sky high, whereas backlogs are contracting, albeit mildly (top, middle and fourth panels, Chart 8). Worrisomely, aerospace industrial production ground to a halt last month, with the resource utilization rate gaping down a whopping 560bps on a month-over-month basis (second & bottom panels, Chart 8). Boeing’s production ails will likely remain in place for the next three months, and sustain the downward pressure on output growth and capacity utilization. All of this suggests that profits are in for a rough ride. Chart 7737 MAX Ills…
737 MAX Ills…
737 MAX Ills…
Chart 8…Weighing Heavily
…Weighing Heavily
…Weighing Heavily
Executives’ knee-jerk reaction has been to tap credit lines in order to fend off this profit contraction phase, which has pushed the industry’s leverage to the stratosphere. In fact, the aerospace industry’s 3.5x net debt-to-EBITDA reading is the highest since the history of the data set, even higher than the aftermath of the 9/11 induced recession Chart 9). Finally, valuations have skyrocketed, rising to over three standard deviations above the past four decade mean. In marked contrast, relative technicals are washed out, probing two decade lows (Chart 10). Chart 9Rapid B/S Degradation
Rapid B/S Degradation
Rapid B/S Degradation
Chart 10Overvalued, But Oversold
Overvalued, But Oversold
Overvalued, But Oversold
In sum, Boeing’s 737 MAX grounding, China’s looming slowdown on the back of the coronavirus epidemic and weak industry operating metrics, all warrant a downgrade alert in the US aerospace index. Bottom Line: We are awaiting a bounce before downgrading the US aerospace index to a below benchmark allocation. It is now on our downgrade watch list. The ticker symbols for the stocks in the pureplay US aerospace index are: BA, UTX, TDG, TDY, TXT, HEI, SPR, HEI.A. Defense Rules Unlike their aerospace brethren, pureplay defense stocks are on fire on multiple fronts, and we reiterate our cyclical and secular (ten-year time horizon) overweight recommendations.3 Defense industrial production (IP) surpassed the end of the Cold War highs and is now in uncharted territory. On a year-over-year rate of change basis IP is running over 7% or fifteen percentage points higher than aerospace IP (Chart 11). This is a remarkable feat as overall IP is contracting and the US is still fighting off a manufacturing recession. Meanwhile, relative defense performance is in a V-shaped recovery, whereas relative aerospace performance is moving down along the right side of a lambda formation (top panel, Chart 11). As we mentioned above, M&A activity is also boosting takeover premia and the reduction of defense stock supply is bullish for stock prices (Chart 12). Chart 11Defense Is The Mirror Image Of Aerospace
Defense Is The Mirror Image Of Aerospace
Defense Is The Mirror Image Of Aerospace
Chart 12Supportive M&A
Supportive M&A
Supportive M&A
Upbeat defense outlays underpin relative share prices. Given that a global arms race is ongoing, demand for weapons will remain robust for the duration of this decade according to SIPRI’s estimates (Chart 13). Importantly, defense capital goods new orders are flirting with all-time highs, industry backlogs are not far behind and defense related exports are running red hot (Chart 14). Chart 13Insatiable…
Insatiable…
Insatiable…
Chart 14…Demand…
…Demand…
…Demand…
Besides the global rearmament, a global space race along with the real threat of cyberattacks – especially on governments – underscores that defense companies are well positioned to benefit from these two additional sources of revenues for years to come. This firm demand backdrop is reflected in near double digit sales growth outshining the broad market by a factor of 2:1. The last time defense sales were growing so briskly was during the Iraqi war in the early 2000s (Chart 15). However, one key difference between now and 2002 is margins. Back then profit margins were falling in the aftermath of the 9/11 induced recession. Fast forward to today and profit margins have doubled even eclipsing non-financial corporate sector margins (Chart 15). Given the industry’s high operating leverage, robust top line growth will flow straight to the bottom line and sustain the earnings-led relative share price outperformance phase. Keep in mind that not only are non-financial corporate sector profits contracting, but the sell-side community also expects defense EPS to continue to deflate in the coming twelve months (fourth & bottom panels, Chart 15). This represents a low bar for the defense industry to surpass. Defense stocks also have a fortress of a balance sheet: the net debt-to-EBITDA ratio runs below the broad market and the interest coverage ratio trounces the overall market. Tack on a soaring return-on-equity, and there is a long runway ahead for pureplay defense stocks (Chart 16). Chart 15…Underpins Operating Metrics
…Underpins Operating Metrics
…Underpins Operating Metrics
Finally on the relative valuation front, while defense stocks trade at a massive premium to the broad market on a P/B basis, they are changing hands at a discount on both an EV/EBITDA and P/E basis. Defense stocks also command a higher dividend yield compared with the non-financial corporate sector (Chart 17). If our thesis continues to pan out, we deem that defense stocks will grow into their pricey P/B valuations, similar to what happened during the MAD doctrine era of the 1960s.4 Chart 16Fortress Of A B/S
Fortress Of A B/S
Fortress Of A B/S
Chart 17Far From Overvalued On Most Ratios
Far From Overvalued On Most Ratios
Far From Overvalued On Most Ratios
Netting it all out, red hot demand for defense capital goods, defense industrial production that is firing on all cylinders, enticing industry operating metrics and pristine balance sheets, all suggest that it still pays to be long the pureplay defense index. Bottom Line: Stay overweight the pureplay defense index both on a cyclical and secular time horizon. The ticker symbols for the stocks in this index are: LMT, RTN, NOC, GD, HII, AJRD, BWXT, CW, MRCY. Anastasios Avgeriou US Equity Strategist anastasios@bcaresearch.com Footnotes 1 Please see BCA US Equity Strategy Weekly Report, “Will The Fed Save The Day, Again?” dated February 18, 2020, available at uses.bcaresearch.com. 2 Please see BCA US Equity Strategy Weekly Report, “Three EPS Scenarios”, dated January 13, 2020, available atuses.bcaresearch.com. 3 Please see BCA US Equity Strategy Special Report, “Top US Sector Investment Ideas For The Next Decade” dated December 16, 2019, available at uses.bcaresearch.com. 4 Please see BCA US Equity Strategy Special Report, “Brothers In Arms” dated October 31, 2016, available at uses.bcaresearch.com. Current Recommendations Current Trades Strategic (10-Year) Trade Recommendations
Vertigo
Vertigo
Size And Style Views June 3, 2019 Stay neutral cyclicals over defensives (downgrade alert) January 22, 2018 Favor value over growth May 10, 2018 Favor large over small caps (Stop 10%) June 11, 2018 Long the BCA Millennial basket The ticker symbols are: (AAPL, AMZN, UBER, HD, LEN, MSFT, NFLX, SPOT, TSLA, V).
Checklist Complete
Checklist Complete
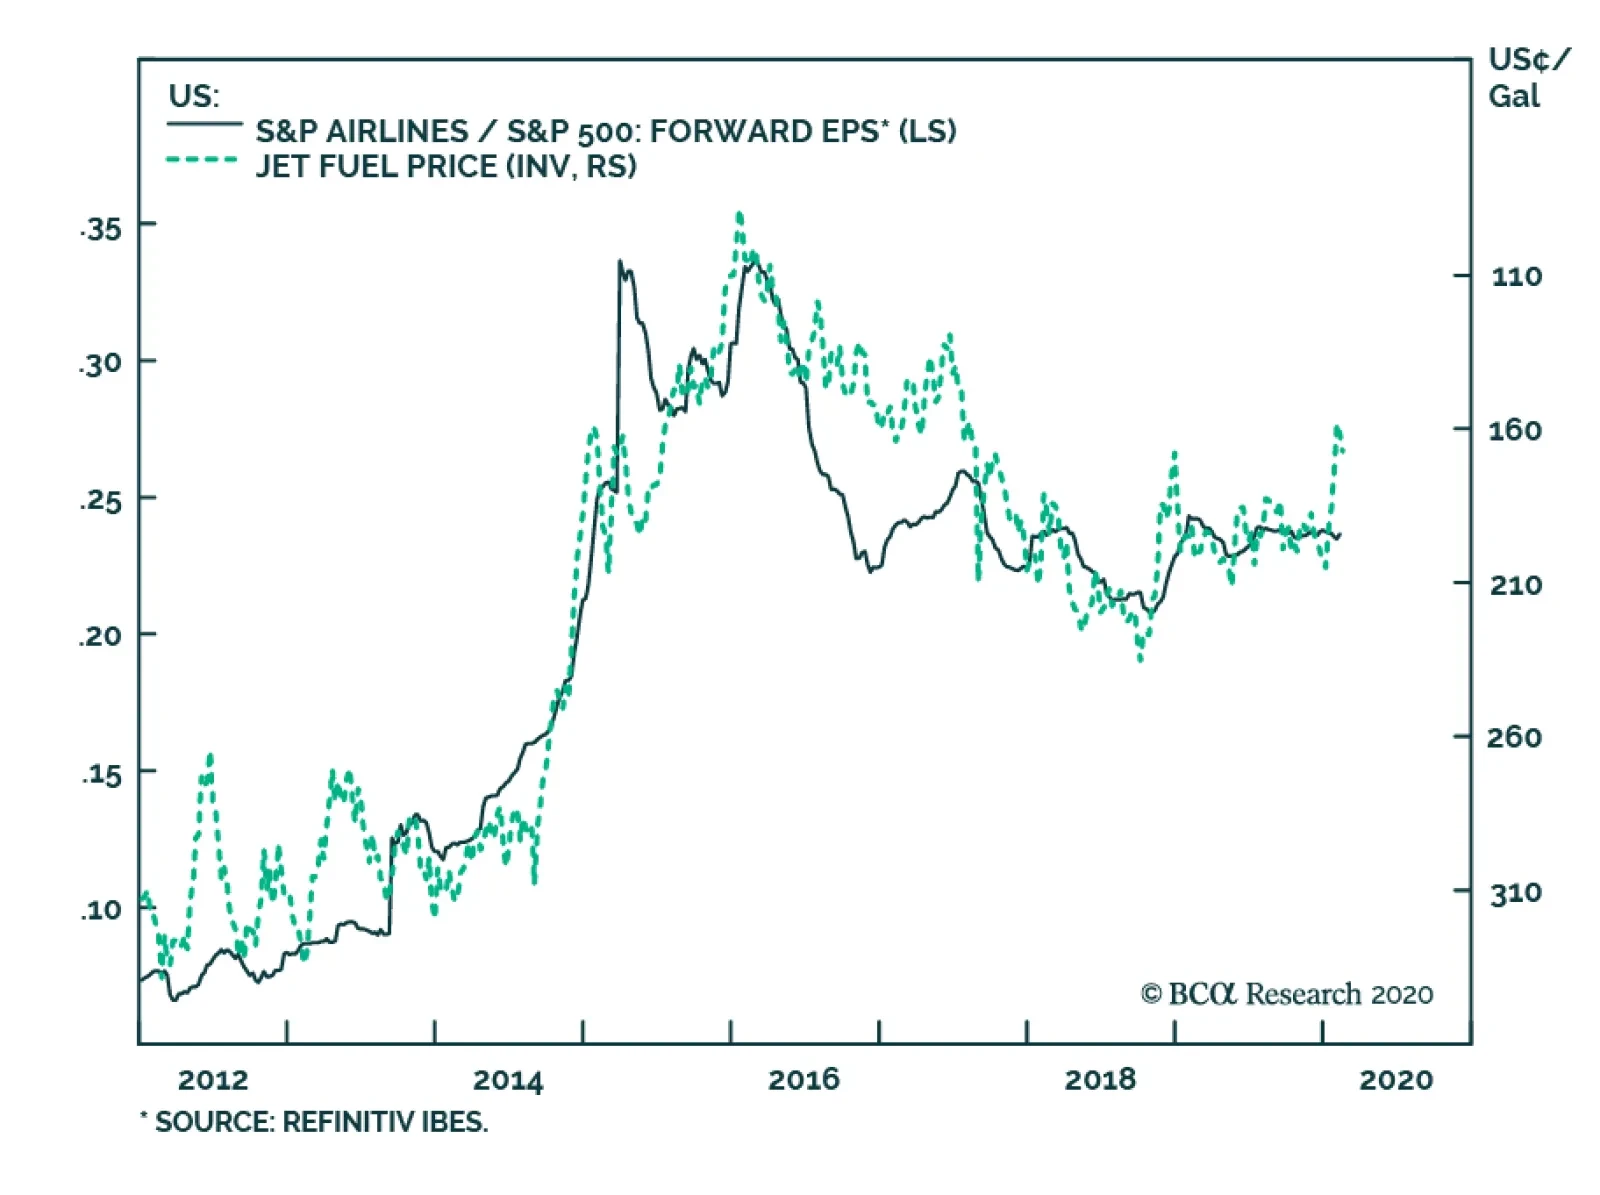
Overweight Investors tend to overreact to events such as virus epidemics, but we deem that such fears typically create trading opportunities, especially in the hardest-hit sectors. Similar to hotels (that we upgraded to neutral last week), airlines are part of the tourism-related industries that have suffered disproportionately. Were we not overweight the S&P airlines index, we would not hesitate to initiate such a position. True, consumer and business demand for air transportation services will come under pressure in the near-term, however, looking further out such demand destruction will likely prove transitory. The chart on the right highlights that the cyclical demand backdrop is robust for the US airline industry. Overall consumer outlays jumped recently, PCE services momentum is perking up, airfare PCE is outpacing overall consumer spending – an impressive feat – and consumer confidence is perched near cycle highs sustaining a wide gap with relative share prices. Bottom Line: Stay overweight the S&P airlines index. The ticker symbols for the stocks in this index are: BLBG S5AIRLX – LUV, DAL, UAL, AAL, ALK. For additional details please refer to this Monday’s Weekly Report.
Mixed Data
Mixed Data
Neutral It has been particularly difficult to distinguish a clear signal from noise lately with regard to the cyclicals versus defensives ratio. Relevant macro drivers, operating metrics and profit fundamentals, valuations and technicals all have been emitting conflicting messages. The recent coronavirus epidemic will likely make the waters murkier still. US Equity Strategy’s Global Trade Activity Indicator has turned south recently following in the footsteps of the Chinese manufacturing PMI data that ticked down and are slated to drop below the boom/bust line in the current month (top & bottom panels). The bond market also reflects a gloomy global economic backdrop with the global 10-year Treasury yield sinking like a stone. Such a lackluster bond market will likely weigh on relative share prices (middle panel). Bottom Line: Remain on the sidelines on cyclicals versus defensives. For more details on the positive data on the cyclicals/defensives ratio please refer to this Monday’s Weekly Report.
Highlights Analyses on Asian semis, Argentina and Russia are available on pages 7, 12 and 14, respectively. The most likely trajectory for Chinese growth will be as follows: the initial plunge in business activity will be succeeded by a rather sharp snap-back due to pent-up demand. However, that quick rebound will probably be followed by weaker growth. Financial markets will soon focus on growth beyond the temporary rebound. In our opinion, it will be weaker than markets are currently pricing. Thus, risks for EM risk assets and currencies are skewed to the downside. A major and lasting selloff in EM stocks will only occur if EM corporate bond yields rise. In this week’s report we discuss what it will take for EM corporate credit spreads to widen. Feature The downside risks to EM risk assets and currencies are growing. We continue to recommend underweighting EM equities, credit and currencies versus their DM counterparts. Today we are initiating a short position in EM stocks in absolute terms. Chart I-1 illustrates that the total return index (including carry) of EM ex-China currencies versus the US dollar has failed to break above its 2019 highs, and has rolled over decisively. In contrast, the trade-weighted US dollar has exhibited a bullish technical configuration by rebounding from its 200-day moving average (Chart I-2). Odds are the dollar will make new highs. An upleg in the greenback will foreshadow a relapse in EM financial markets. Chart I-1EM Ex-China Currencies Have Been Struggling Despite Low US Rates
EM Ex-China Currencies Have Been Struggling Despite Low US Rates
EM Ex-China Currencies Have Been Struggling Despite Low US Rates
Chart I-2The US Dollar Remains In A Bull Market
The US Dollar Remains In A Bull Market
The US Dollar Remains In A Bull Market
Growth Trajectory After The Dust Settles The evolution of the coronavirus remains highly uncertain and unpredictable. As with any pandemic or virus outbreak, its evolution will be complex with non-trivial odds of a second wave. Even under the assumption that the epidemic will be fully contained by the end of March, its economic impact on the Chinese and Asian economies will likely be greater than global financial markets are currently pricing. As investors come to the realization that this initial pick-up in economic activity after the virus outbreak will be followed by weaker growth, the odds of a selloff in equities and credit markets will rise. In our January 30 report titled Coronavirus Versus SARS: Mind The Economic Differences, we argued that using the framework from the SARS outbreak to analyze the current epidemic is inappropriate. First, only a small portion of the Chinese economy was shut down in 2003, and for a brief period of time. The current closures and limited operations are much more widespread and likely more prolonged. Table I-1China’s Importance Now And In 2003
EM: Growing Risk Of A Breakdown
EM: Growing Risk Of A Breakdown
Second, China accounts for a substantially larger share of the global economy today than it did in 2003 (Table I-1). Hence, the global business cycle is presently much more sensitive to demand and production in the mainland than it was during the SARS outbreak. Global financial markets have rebounded following the initial selloff in late January on expectations that the Chinese and global economies will experience a V-shaped recovery. In last week’s report, we discussed why the odds favor a tepid recovery for the Chinese business cycle and global trade. The main point of last week’s report was as follows: with the median company and household in China being overleveraged, any reduction in cash flow or income will undermine their ability to service their debt and will dent their confidence for some time. Hence, consumption, investment and hiring over the next several months will be negatively affected, even after the outbreak is contained. This in turn will diminish the multiplier effect of policy stimulus in China. Chart I-3Our Expectations Of China’s Business Cycle
EM: Growing Risk Of A Breakdown
EM: Growing Risk Of A Breakdown
The most likely pattern for Chinese growth will likely resemble the trajectory demonstrated in Chart I-3. It assumes the plunge in business activity will be succeeded by a rather sharp snap-back due to pent-up demand. However, that snap-back will likely be followed by weaker growth, for reasons discussed in last week’s report. Equity and credit markets in Asia and worldwide have been sanguine because they have so far focused exclusively on expectations of a sharp rebound. As investors come to the realization that this initial pick-up in economic activity will be followed by weaker growth, the odds of a selloff in equities and credit markets will rise. Bottom Line: The most likely trajectory for Chinese and Asian growth will be as follows: the initial plunge in business activity will be succeeded by a rather sharp snap-back due to pent-up demand. However, that quick rebound will probably be followed by weaker growth. Financial markets are not pricing in this scenario. Thus, risks are skewed to the downside for EM risk assets and currencies. The Missing Ingredient For An Equity Selloff The missing ingredient for a selloff in EM equities is rising EM corporate bond yields. Chart I-4 illustrates that bear markets in EM stocks typically occur when EM US dollar corporate bond yields are rising. Hence, what matters for the direction of EM share prices is not risk-free rates/yields but EM corporate borrowing costs. Chart I-4The Destiny Of EM Equities Is DependEnt On EM Corporate Bond Yields
The Destiny Of EM Equities is DependEnt On EM Corporate Bond Yields
The Destiny Of EM Equities is DependEnt On EM Corporate Bond Yields
EM (and US) corporate bond yields can rise under the following circumstances: (1) when US Treasury yields are ascending more than corporate credit spreads are tightening; (2) when credit spreads are widening more than Treasury yields are falling; or (3) when both government bond yields and corporate credit spreads are increasing simultaneously. Provided the backdrop of weaker growth is bullish for government bonds, presently corporate bond yields can only rise if credit spreads widen by more than the drop in Treasury yields. In short, the destiny of EM equities currently relies on corporate spreads. A major and lasting selloff in EM stocks will only occur if their respective corporate bond yields rise. From a historical perspective, EM and US corporate credit spreads are currently extremely tight (Chart I-5). A China-related growth scare could trigger a widening in EM corporate credit spreads. As this occurs, corporate bond yields will climb, causing share prices to plummet. EM corporate spreads have historically been correlated with EM exchange rates, the global/Chinese business cycle, and commodities prices (Chart I-6). The Chinese property market plays an especially pivotal role for the outlook of EM corporate spreads. Chart I-5EM And US Corporate Spread Remain Tame
EM And US Corporate Spread Remain Tame
EM And US Corporate Spread Remain Tame
Chart I-6EM Corporate Spreads Inversely Correlate With EM Currencies And Commodities Prices
EM Corporate Spreads Inversely Correlate With EM Currencies And Commodities Prices
EM Corporate Spreads Inversely Correlate With EM Currencies And Commodities Prices
First, offshore bonds issued by mainland property developers account for a large share of the EM corporate bond index. Chart I-7China Property Market Will Continue Disappointing
China Property Market Will Continue Disappointing
China Property Market Will Continue Disappointing
Second, swings in China’s property markets often drive the mainland’s business cycle and its demand for resources, chemicals and industrial machinery. In turn, Chinese imports of commodities affect both economic growth and exchange rates of EM ex-China. Finally, the latter two determine the direction of EM ex-China corporate spreads. China’s construction activity and property developers were struggling before the coronavirus outbreak (Chart I-7). Given their high debt burden, the ongoing plunge in new property sales and their cash flow will not only weigh on their debt sustainability but also force them to curtail construction activity. The latter will continue suppressing commodities prices. The sensitivity of EM corporate spreads to these variables have in recent years diminished because of the unrelenting search for yield by global investors. As QE policies by DM central banks have removed some $9 trillion of high-quality securities from circulation, the volume of securities available in the markets has shrunk. This has distorted historical correlations of EM corporate spreads with their fundamental drivers – namely, China’s construction activity, commodities prices, EM exchange rates and the global trade cycle. Nonetheless, EM corporate credit spreads’ sensitivity to these variables has diminished, but has not vanished outright. If EM currencies depreciate meaningfully, commodities prices plunge and China’s growth and the global trade cycle disappoint, odds are that EM corporate spreads will widen. Given that credit markets are already in overbought territory, any selloff could trigger a cascading effect, resulting in meaningful credit-spread widening. Bottom Line: A major and lasting selloff in EM stocks will only occur if their respective corporate bond yields rise. The timing is uncertain, but the odds of EM corporate credit spreads widening are mounting as Chinese growth underwhelms, commodities prices drop and EM currencies depreciate. If these trends persist, they will push EM shares prices over the cliff. As to today’s recommendation to short the EM stock index, we anticipate at least a 10% selloff in EM stocks in US-dollar terms. For currency investors, we are maintaining our shorts in a basket of EM currencies versus the dollar. This basket includes the BRL, CLP, COP, ZAR, KRW, IDR and PHP. Arthur Budaghyan Chief Emerging Markets Strategist arthurb@bcaresearch.com Are Semiconductor Stocks Facing An Air Pocket? Global semiconductor share prices have continued to hit new highs, even though there has not been any recovery (positive growth) in global semiconductor sales or in their corporate earnings (EPS). The coronavirus outbreak and the resulting delay in 5G phone sales in China in the first half of 2020 will trigger a pullback in semiconductor equities. Global semiconductor sales bottomed on a rate-of-change basis in June, but their annual growth rate was still negative in December. In the meantime, global semi share prices have been rallying since January 2019. This divergence between stock prices and revenue of global semiconductor stocks is unprecedented (Chart II-1). Chart II-1Over-Hyped Global Semi Share Prices
Global Semiconductor Market: Sales & Share Prices Over-Hyped Global Semi Share Prices
Global Semiconductor Market: Sales & Share Prices Over-Hyped Global Semi Share Prices
Odds are that global semi stocks in general, and Asian ones in particular, will experience a pullback in the coming weeks. The coronavirus outbreak will likely dampen expectations related to the speed of 5G adoption and penetration in China. Critically, China accounted for 35% of global semiconductor sales in 2019, versus 19% for the US and 10% for the whole of Europe. In brief, semiconductor demand from China is now greater than the US and European demand combined. Furthermore, the latest news that the US administration is considering changing its regulations to prevent shipments of semiconductor chips to China’s Huawei Technologies from global companies - including Taiwan's TSMC - could hurt chip stocks further. Since Huawei Technologies is the global leader in 5G networks and smartphones, the ban, if implemented, will instigate a sizable setback to 5G adoption in China and elsewhere. Table II-1Industry Forecasts Of The 2020 Global 5G- Smartphone Shipments
EM: Growing Risk Of A Breakdown
EM: Growing Risk Of A Breakdown
Our updated estimate of global 5G smartphone shipments is between 160 million and 180 million units in 2020, which is below the median of industry expectations of 210 million units (Table II-1). The key reasons why the industry’s expectations are unreasonably high, in our opinion, are as follows: Chinese demand for new smartphones will likely stay weak (Chart II-2). The mainland smartphone market has become extremely saturated, with 1.3 billion units having been sold in just the past three years – nearly equaling the entire Chinese population. Chinese official data show that each Chinese household owned 2.5 phones on average in 2018, and that the average household size was about three persons (Chart II-3). This suggests that going forward nearly all potential phone demand in China is for replacement phones, and that there is no urgent need for households to buy new phones. Chart II-2Chinese Smartphone Demand: Further Decline In 2020
Chinese Smartphone Demand: Further Decline In 2020
Chinese Smartphone Demand: Further Decline In 2020
Chart II-3Chinese Households: No Urgent Need For A New Phone
Chinese Households: No Urgent Need For A New Phone
Chinese Households: No Urgent Need For A New Phone
The Chinese government’s boost to 5G infrastructure investment will likely increase annual installed 5G base stations from 130,000 units last year to about 600,000 to 800,000 this year. However, the total number of 5G base stations will still only account for about 7-9% of total base stations in China in 2020. Hence, geographical coverage will not be sufficiently wide enough to warrant a very high rate of 5G smartphone adoption and penetration. From Chinese consumers’ perspectives, a 5G phone in 2020 will be a ‘nice-to-have,’ but not a ‘must-have.’ Given increasing economic uncertainty and many concerns related to the use of 5G phones, mainland consumers may delay their purchases into 2021 when 5G phone networks will have more geographic coverage. The number of 5G phone models on the market is expanding, but not that quickly. Consumers may take their time to wait for more models to hit the market before making a 5G phone purchase. For example, Apple will release four 5G phone models, but only in September 2020. Moreover, the price competition between 5G and 4G phones is getting increasingly intense. Smartphone producers have already started to cut prices of their 4G phones aggressively. For example, the price of Apple’s iPhone XS, released in September 2018, has already dropped by about 50% in China. Outside of China, 5G infrastructure development will be much slower. The majority of developed countries will likely give in to pressure from the US and limit their use of Huawei 5G equipment. This will delay infrastructure installation and adoption of 5G throughout the rest of the world because Huawei has the leading and cheapest 5G technology. In 2019, China accounted for about 70% of worldwide 5G smartphone shipments. We reckon that in 2020 Chinese 5G smartphone shipments will be between 120 million and 130 million units. Assuming this accounts for about 70-75% of the world shipment of 5G phones this year, we arrive at our estimate of global 5G smartphone shipments of between 160 million and 180 million units. We agree that 5G technology is revolutionary. Nevertheless, we still believe global semi share prices are presently overhyped by unreasonably optimistic 2020 projections. Overall, investors are pricing global semi stocks using the pace and trajectory of 4G smartphones adoption. However, in 2020 the number and speed of 5G phone penetration will continue lagging that of 4G ones when the latter were introduced in December 2013 (Chart II-4). We agree that 5G technology is revolutionary, and its adoption and penetration will surge in the coming years. Nevertheless, we still believe global semi share prices are presently overhyped by unreasonably optimistic 2020 projections (Chart II-5). Chart II-4China 5G-Adoption Pace: Slower Than The Case With 4G
China 5G-Adoption Pace: Slower Than The Case With 4G
China 5G-Adoption Pace: Slower Than The Case With 4G
Chart II-5Net Earnings Of Global Semi Sector: Too Optimistic?
Net Earnings Of Global Semi Sector: Too Optimistic?
Net Earnings Of Global Semi Sector: Too Optimistic?
Investment Implications Global semi stocks’ valuations are very elevated, as shown in Chart II-6 and Chart II-7. Besides, semi stocks are overbought, suggesting they could correct meaningfully if lofty growth expectations currently baked into their prices do not materialize in the first half of this year. Chart II-6Global Semi Stocks Valuations: Very Elevated
Global Semi Stocks Valuations: Very Elevated
Global Semi Stocks Valuations: Very Elevated
Chart II-7Global Semi Stocks’ Valuations: Very Elevated
Global Semi Stocks Valuations: Very Elevated
Global Semi Stocks Valuations: Very Elevated
The coronavirus outbreak and the resulting delay in 5G phone sales in China in the first half of 2020, along with US pressure on global semi producers not to sell to Huawei, will likely trigger a pullback in semiconductor equities. We recommend patiently waiting for a better entry point for absolute return investors. Within the EM equity universe, we have not been underweight Asian semi stocks because of our negative outlook for the overall EM equity benchmark. The Argentine government will drag out foreign debt negotiations with the IMF and foreign private creditors to secure a more favorable settlement. We remain neutral on Taiwan and overweight Korea. The reason is that DRAM makers such as Samsung and Hynix have rallied much less than TSMC. Besides, geopolitical risks in relation to Taiwan in general and TSMC in particular are rising, warranting a more defensive stance on Taiwanese stocks relative to Korean equities. Ellen JingYuan He Associate Vice President ellenj@bcaresearch.com Argentina’s Eternal Tango With Foreign Creditors Chart III-1Downside Risks To Bond Prices
Downside Risks to Bond Prices
Downside Risks to Bond Prices
Our view remains that debt negotiations will be drawn-out because the Argentine government is both unwilling and lacks the financial capacity to service public foreign debt. The administration’s recent attitude toward foreign creditors and the IMF have startled markets: sovereign Eurobond bond prices have tanked (Chart III-1). The reasons why the Fernandez administration will play tough ball with creditors and the IMF are as follows: The country’s foreign funding and the public sector debt situations are precarious. Hence, the lower the recovery rate they negotiate with creditors, the more funds will be available to expand social programs and secure domestic political support. Given Fernandez’s and Peronist’s voter base, the government is inclined to please the population at expense of foreign creditors. Moreover, Alberto Fernandez is facing increasing scrutiny from radical Peronists, who want to dissolve the debt altogether. Vice-president Fernandez de Kirchner stated that Argentina should not pay international agents until the economy escapes a recession. To further add to creditors’ frustration, the government has yet to announce a comprehensive economic plan to revive the economy and service outstanding debt. The public foreign currency debt burden is unsustainable – its level stands at $250 billion, about 4 times larger than exports. The country is still in a recession, and economic indicators do not show much improvement. Committing to fiscal austerity to service foreign debt would entail further economic suffering for Argentine businesses and households, something Fernandez rejected throughout his campaign. The authorities are singularly focused on reviving the economy: government expenditures have grown by over 50% annually under the current administration (Chart III-2). Crucially, Argentina has already achieved a large trade surplus and its current account balance is approaching zero (Chart III-3). Assuming exports stay flat, the economy can afford to maintain its current level of imports. This makes the authorities less willing to compromise and more inclined to adopt a tough stance in debt negotiations. Chart III-2Peronist Government Has Again Boosted Fiscal Spending
Peronist Government Has Again Boosted Fiscal Spending
Peronist Government Has Again Boosted Fiscal Spending
Chart III-3Argentina: Current Account Is Almost Balanced
Argentina: Current Account Is Almost Balanced
Argentina: Current Account Is Almost Balanced
The risk of this negotiation strategy is that the nation will not be able to raise foreign funding for a while. Nevertheless, the country is currently de facto not receiving any external financing. Hence, this risk is less pressing. Moreover, the administration has already delayed all US$ bond payments until August. This allows them to extend negotiations with creditors over the next six months, thereby increasing uncertainty and further pushing down bond prices. A lower market price on Argentine bonds is beneficial for the government’s negotiation strategy as it implies lower expectations for foreign creditors. Thus, the Fernandez administration’s strategy will be to play hardball and draw-out negotiations as long as possible. We expect Argentina to reach a settlement with creditors no earlier than in the third quarter of this year and at recovery rates below current prices of the nation’s Eurobonds. Russian financial assets will be supported due to improving public sector governance, accelerating domestic demand growth and healthy macro fundamentals. Bottom Line: The government will drag out foreign debt negotiations with the IMF and foreign private creditors to secure a more favorable settlement. Continue to underweight Argentine financial assets over the next several months. Juan Egaña Research Associate juane@bcaresearch.com Russia: Harvesting The Benefits Of Macro Orthodoxy Russian financial markets have shown resilience in face of falling oil prices. This has been the upshot of the nation’s prudent macro policies in recent years. We have been positive on Russia and overweight Russian markets over the past two years and this stance remains intact. Going forward, Russian financial assets will be supported due to improving public sector governance, accelerating domestic demand growth and healthy macro fundamentals: Fiscal policy will be relaxed substantially – both infrastructure and social spending will rise. Specifically, the Kremlin is eager to ramp up the national projects program. This is bullish for domestic demand. Russia’s public finances are currently in a very healthy state. Public debt (14% of GDP) is minimal and foreign public debt (4% of GDP) is tiny. The overall fiscal balance is in large surplus (2.7% of GDP). The current account is also in surplus. Hence, a major boost in fiscal spending will not undermine Russia’s macro stability for some time. As a major sign of policy change, President Putin has sidelined or reduced the authority of policymakers who have been advocating tight fiscal policy. This policy change has been overdue as fiscal policy has been unreasonably tight for longer than required (Chart IV-1). Chart IV-1Russia: Government Spending Has Been Extremely Weak
Russia: Government Spending Has Been Extremely Weak
Russia: Government Spending Has Been Extremely Weak
Importantly, the recent changes at the highest levels of government are also positive for governance and productivity. The new Prime Minister Mishustin has earned this appointment for his achievements as the head of the federal tax authority. He has restructured and reorganized the tax department in a way that has boosted its efficiency/productivity substantially and increased tax collection. By promoting him to the head of government, Putin has boosted Mishustin’s authority to reform the entire federal governance system. Given his record of accomplishment, odds are that the new prime minister will succeed in implementing some reforms and restructuring. Thereby, productivity growth that has been stagnant in Russia for a decade could revive modestly. Also, Putin was reluctant to boost infrastructure spending as he was afraid of money being misappropriated without a proper monitoring system. Putin now hopes Mishustin can introduce an efficient governance system of fiscal spending to assure infrastructure projects can be realized with reasonably minimal losses. As to monetary policy, real interest rates are still very high. The prime lending rate is 10%, the policy rate is 6% and nominal GDP growth is 3.3% (Chart IV-2). Weak growth (Chart IV-3) and low inflation will encourage the central bank to continue cutting interest rates. Chart IV-2Russia: Interest Rates Remain Excessively High
Russia: Interest Rates Remain Excessively High
Russia: Interest Rates Remain Excessively High
Chart IV-3Russia's Growth Is Very Sluggish
Russia's Growth Is Very Sluggish
Russia's Growth Is Very Sluggish
Finally, the economy does not have any structural excesses and imbalances. The central bank has done a good job in cleansing the banking system and the latter is in healthy shape. Bottom Line: The ruble will be supported by improving productivity, cyclical growth acceleration and a healthy fiscal position. We continue recommending overweighting Russian stocks, local currency bonds and sovereign credit relative to their respective EM benchmarks. Last week, we also recommended a new trade: Short Turkish bank stocks / long Russian bank stocks. The main risk to the absolute performance of Russian markets is another plunge in oil prices and a broad selloff in EM. On November 14, 2019 we recommended absolute return investors to go long Russian local currency bonds and short oil. This strategy remains intact. Finally, we have been recommending the long ruble / short Colombian peso trade since May 31, 2018. This position has generated large gains and we are reiterating it. Arthur Budaghyan Chief Emerging Markets Strategist arthurb@bcaresearch.com Footnotes Equities Recommendations Currencies, Credit And Fixed-Income Recommendations
Highlights In case you missed it in real-time, please listen to a playback of this this quarter’s webcast ‘What Are The Most Attractive Investments In Europe?’ available at eis.bcaresearch.com. Growth is set to plunge in the first quarter, keeping bond yields depressed for the early part of 2020 at least. Stay structurally overweight equities versus bonds so long as bond yields stay around current or lower levels. A 10 basis points decline in the 10-year bond yield can offset a 2 percent decline in stock market profits. Underweight economically sensitive sectors – and regional and country equity indexes with a high weighting to them – until growth and bond yields enter a convincing uptrend. A strong signal for shifting to a more pro-cyclical stance in the coming months would be if/when the 10-year bond yield has reached a sufficiently strong 6-month deceleration. Fractal trade: the strong outperformance of utilities versus oil and gas is technically stretched. Feature Chart I-1Forget Growth, It's All About Valuation
Forget Growth, It's All About Valuation
Forget Growth, It's All About Valuation
‘Global health scare takes world stock markets to new highs’ would make a jarring, provocative, and counterintuitive headline. But it would be true… at least so far. Most economists expect the global health scare emanating from China to depress economic growth. My colleague, Peter Berezin, forecasts global growth to drop to near zero during the first quarter. Yet the aggregate stock market seems largely unfazed. Most bourses are riding high, and in some cases not far from all-time highs. How can this be if the market is downgrading growth? Ultra-Low Bond Yields Are Protecting The Stock Market Although stock market profits are being revised down, the multiple paid for those profits is rising by more than the profits are falling. Stock market valuations have become hyper-sensitive (inversely) to ultra-low bond yields. Meaning that the valuation boost from a small decline in bond yields is more than sufficient to counter the growth drag from the coronavirus scare. This is not just a recent phenomenon. For the past two years, a good motto for investors has been: forget growth, it’s all about valuation (Chart of the Week). Through 2018-19, profits drifted sideways. Yet the stock market fell 30 percent, then rose 30 percent – because the multiple paid for the profits plunged in 2018, then surged in 2019 (Chart I-2 and Chart I-3). The reason was the dramatic swing in bond yields. This is hardly surprising given that the prospective return on equities is sensitive to the prospective return offered by competing (long-duration) bonds. But crucially, at ultra-low bond yields, this sensitivity becomes hyper-sensitivity. Chart I-2The Big Moves In The Stock Market...
The Big Moves In The Stock Market...
The Big Moves In The Stock Market...
Chart I-3...Have Been About Valuation, Not Growth
...Have Been About Valuation, Not Growth
...Have Been About Valuation, Not Growth
When bond yields approach their lower bound, bonds become extremely risky investments because the scope for price rises diminishes while the scope for price collapses increases. The upshot is that all (long-duration) investments become equally risky, and the much higher prospective returns required on formerly more risky equities collapses to the feeble return offered on now equally-risky bonds. Given that valuation is just the inverse of the prospective return, the valuation of equities becomes hyper-sensitive to small changes in bond yields. A 10 basis points decline in the bond yield can offset a 2 percent decline in stock market profits Through 2018-2019, the 10-year T-bond yield took a round trip from around 2 percent to 3.2 percent and then down to around 1.6 percent today. This explains the mirror-image round trip in the stock market’s multiple: from 16 down to 13 and then up to around 17 today, a 30 percent increase. Which means that broadly speaking, a 10 basis points decline in the bond yield can offset a 2 percent decline in stock market profits (Chart I-4). Chart I-4The Bond Yield Is Driving The Stock Market's Valuation
The Bond Yield Is Driving The Stock Market's Valuation
The Bond Yield Is Driving The Stock Market's Valuation
Therefore, as the coronavirus scare illustrates, the biggest structural threat to the aggregate stock market does not come from slowing growth so long as bond yields continue to adjust downwards. The biggest threat comes from an outsized increase in bond yields, stemming from a subsequent modest acceleration in either growth or inflation. But we do not expect this in the first half of the year (at least). Bond Yields To Stay Depressed For The First Half At Least Although the coronavirus scare is a convenient scapegoat for the growth downgrade, the scare has just amplified a growth deceleration that was going to happen anyway. As we explained at the start of the year in Strong Headwind Warrants Caution In H1, a growth deceleration in Europe and worldwide during early 2020 was already well baked in the cake. The 6-month acceleration in bond yields at the end of 2019 was among the sharpest in recent years. Growth decelerations stem neither from the level of bond yields nor from the change in bond yields (or financial conditions). Growth decelerations stem from the acceleration of bond yields. And the 6-month acceleration in bond yields at the end of 2019 – both in Europe and worldwide – was among the sharpest in recent years (Chart I-5). Chart I-5After A Sharp 6-Month Acceleration In Bond Yields, Yields Stay Depressed For The Following 6 Months
After A Sharp 6-Month Acceleration In Bond Yields, Yields Stay Depressed For The Following 6 Months
After A Sharp 6-Month Acceleration In Bond Yields, Yields Stay Depressed For The Following 6 Months
Although the link between a bond yield acceleration and a GDP deceleration seems hard to grasp, it results from a basic accounting identify. GDP is a flow statistic. So if a credit flow contributes to GDP, it must be a credit flow deceleration that contributes to a GDP deceleration. And if the level of the bond yield establishes the size of a credit flow, it must be a bond yield acceleration that establishes the size of a credit flow deceleration (Chart I-6). Chart I-6A Bond Yield Acceleration Causes A Credit Flow Deceleration
A Bond Yield Acceleration Causes A Credit Flow Deceleration
A Bond Yield Acceleration Causes A Credit Flow Deceleration
Given the lags between bond yields impacting credit flows and credit flows impacting spending, a sharp 6-month acceleration in the bond yield – like the one experienced at the end of 2019 – tends to keep the bond yield depressed for the following six months. On this basis, we would not expect an outsized increase in the bond yield during the first half of this year. In fact, a continued decline in yields could eventually turn into a sharp 6-month deceleration in the bond yield, leading to an acceleration in credit flows and growth, and providing a forthcoming opportunity to become more pro-cyclical. Big Winners And Losers Across Sectors, Regions, And Countries To repeat, the growth scare has not had a major impact on the aggregate stock market (so far) because the valuation boost from a small decline in bond yields is more than sufficient to counter the downgrade to profits. But the growth scare has had a major impact on sector, regional, and country winners and losers. Understandably, the sectors most exposed to the declining bond yield have performed very well. These fall under two categories: the first is bond proxies, meaning sectors that pay a stable bond-like income, such as utilities; the second is long-duration investments meaning sectors whose income is likely to grow rapidly, such as tech and healthcare. This is because the more distant is the future cash flow, the greater is the uplift to its ‘net present value’ for a given decline in the bond yield. The growth scare has had a major impact on sector, regional, and country winners and losers. Conversely, the sectors most exposed to short-term growth have performed poorly. These include banks and energy. Banks suffer also because declining bond yields erode their net interest (profit) margin (Chart I-7). In turn, the sector winners and losers have determined the regional and country equity market winners and losers. Nowadays, a stock market’s relative performance is predominantly a play on its distinguishing overweight and underweight ‘sector fingerprint’. This is because major stock markets are dominated by multinational corporations which are plays on their global sectors, rather than the region or country in which they have a stock market listing. It follows that when tech and healthcare outperform, the tech-heavy Netherlands and healthcare-heavy Denmark stock markets must outperform. When energy underperforms, the energy-heavy Norway and UK stock markets must underperform. It also follows that the tech-heavy and healthcare-heavy US stock market must outperform (Chart I-8). Chart I-7Sector Winners And ##br##Losers...
Sector Winners And Losers...
Sector Winners And Losers...
Chart I-8...Explain Regional And Country Winners And Losers
...Explain Regional And Country Winners And Losers
...Explain Regional And Country Winners And Losers
Some of the more extreme sector and country outperformances and underperformances are now technically stretched (see following section). Nevertheless, a general strategy to underweight economically sensitive sectors – and regional and country equity indexes with a high weighting to them – will remain appropriate until growth and bond yields enter a convincing uptrend. To reiterate, one strong signal for shifting to a more pro-cyclical stance in the coming months would be if/when the bond yield has reached a sufficiently strong 6-month deceleration. Stay tuned. Fractal Trading System* The strong outperformance of utilities versus oil and gas is technically stretched, especially in the US, and a reversal is likely within the next three months. Short US utilities versus oil and gas, setting a profit target of 7.5 percent with a symmetrical stop-loss. In other trades, short Ireland versus Europe reached the end of its holding period having achieved half of its profit target. The rolling 1-year win ratio now stands at 59 percent. Chart I-9US: Utilities Vs. Oil And Gas
US: Utilities Vs. Oil And Gas
US: Utilities Vs. Oil And Gas
When the fractal dimension approaches the lower limit after an investment has been in an established trend it is a potential trigger for a liquidity-triggered trend reversal. Therefore, open a countertrend position. The profit target is a one-third reversal of the preceding 13-week move. Apply a symmetrical stop-loss. Close the position at the profit target or stop-loss. Otherwise close the position after 13 weeks. * For more details please see the European Investment Strategy Special Report “Fractals, Liquidity & A Trading Model,” dated December 11, 2014, available at eis.bcaresearch.com. Dhaval Joshi Chief European Investment Strategist dhaval@bcaresearch.com Fractal Trading Model
Forget Growth, It's The Bond Yield That's Driving Markets
Forget Growth, It's The Bond Yield That's Driving Markets
Forget Growth, It's The Bond Yield That's Driving Markets
Forget Growth, It's The Bond Yield That's Driving Markets
Cyclical Recommendations Structural Recommendations
Forget Growth, It's The Bond Yield That's Driving Markets
Forget Growth, It's The Bond Yield That's Driving Markets
Forget Growth, It's The Bond Yield That's Driving Markets
Forget Growth, It's The Bond Yield That's Driving Markets
Forget Growth, It's The Bond Yield That's Driving Markets
Forget Growth, It's The Bond Yield That's Driving Markets
Forget Growth, It's The Bond Yield That's Driving Markets
Forget Growth, It's The Bond Yield That's Driving Markets
Trades Closed Trades Asset Performance Currency & Bond Equity Sector Country Equity Indicators Bond Yields Chart II-1Indicators To Watch - Bond Yields
Indicators To Watch - Bond Yields
Indicators To Watch - Bond Yields
Chart II-2Indicators To Watch - Bond Yields
Indicators To Watch - Bond Yields
Indicators To Watch - Bond Yields
Chart II-3Indicators To Watch - Bond Yields
Indicators To Watch - Bond Yields
Indicators To Watch - Bond Yields
Chart II-4Indicators To Watch - Bond Yields
Indicators To Watch - Bond Yields
Indicators To Watch - Bond Yields
Interest Rate Chart II-5Indicators To Watch - Interest Rate Expectations
Indicators To Watch - Interest Rate Expectations
Indicators To Watch - Interest Rate Expectations
Chart II-6Indicators To Watch - Interest Rate Expectations
Indicators To Watch - Interest Rate Expectations
Indicators To Watch - Interest Rate Expectations
Chart II-7Indicators To Watch - Interest Rate Expectations
Indicators To Watch - Interest Rate Expectations
Indicators To Watch - Interest Rate Expectations
Chart II-8Indicators To Watch - Interest Rate Expectations
Indicators To Watch - Interest Rate Expectations
Indicators To Watch - Interest Rate Expectations
Correlations Matter
Correlations Matter
A dangerous break up in historical correlations marked this year’s trading, as both the VIX and the SPX became positively correlated. Worrisomely, since 2018 every time such a breakdown occurred, the broad market subsequently suffered a setback (see chart). Importantly, while the SPX vaulted to all-time highs, the VIX neither collapsed to all-time lows nor cyclical lows. Equity market volatility also stays stubbornly close to 15, slightly below the ten-year average. As a reminder, a “VIX reading of 15 means that in 30 days the S&P 500 is expected to trade between 4.3% lower and 4.3% higher than its current level”.1 Bottom Line: VIX resilience highlights that there is more stress beneath the equity market’s surface than first meets the eye. Please refer to this Monday’s Weekly Report for more details. 1 https://us.spindices.com/vix-intro/
Remain Overweight S&P Airlines
…
Highlights Duration: Bond yields will stay low until the daily number of new COVID-19 cases falls to zero, at which point a sell-off is likely. We therefore recommend maintaining below-benchmark portfolio duration on a 6-12 month horizon. Rising odds of a Bernie Sanders presidential win could prevent bond yields from rising at all this year. We may adjust our recommendations in the coming months if this risk increases. Spread Product: Investors should maintain an overweight allocation to spread product versus Treasuries, with a preference for high-yield. Accommodative monetary conditions will ensure that the supply of credit remains ample for some time yet. This will keep defaults low and spreads tight. Monetary Policy: The Fed is in no rush to tighten policy, but has also set a high bar for further cuts. Investors should short August 2020 fed funds futures. Yields Will Move Higher … But Not Yet Chart 1A Peak In New Cases?
A Peak In New Cases?
A Peak In New Cases?
Uncertainty about the economic impact of the coronavirus – now officially called COVID-19 – is the cloud that continues to hang over financial markets. Last week, bond yields fell when a change in the definition of what constitutes a confirmed infection caused the number of reported cases to spike. However, even after revisions, the daily number of new cases looks like it may have peaked (Chart 1). The end result is that the 10-year Treasury yield sits at 1.58%, not far from where it was last week (Chart 2). Notably, the 10-year yield continues to shrug off the notable improvement in US economic data (Chart 2, bottom panel), taking its cues instead from COVID-19 headline risk. Even if the downtrend in new COVID-19 cases continues, it is too soon to be looking for higher bond yields. For one thing, the most up-to-date economic data releases were collected during January, before the outbreak. Weaker readings during the next 1-2 months are assured, and investors may not look through the weakness given that many were already skeptical about the prospects for global economic recovery. Our read of the data is that global growth was in the process of bottoming when COVID-19 struck. We therefore expect global growth to move higher once the virus’ impact abates. In terms of timing, using the 2003 SARS outbreak as a comparable, we expect bonds to remain bid until the daily number of new cases falls to zero, at which point a sell-off is likely. Yields continue to shrug off improvements in economic data. It’s not just the long-end of the curve that has responded to COVID-19. The front-end has also moved to price-in high odds of a rate cut in the coming months. Specifically, the overnight index swap curve is priced for a 42 bps decline in the fed funds rate during the next 12 months (Chart 2, panel 2), and the fed funds futures market is pricing a 74% chance of a rate cut by the end of the summer. As we discussed last week, given that any economic impact from COVID-19 will be temporary, we think the bar for a Fed rate cut this year is quite high.1 As such, our Golden Rule of Bond Investing dictates that investors should keep portfolio duration low on a 12-month horizon.2 We also recommend shorting August 2020 fed funds futures, a trade that will earn 23 bps of unlevered return if the Fed stands pat between now and August (Chart 2, panel 3). Turning to corporate credit, we see that, so far, COVID-19’s impact on spreads has been minor. The investment grade corporate bond index spread is only 3 bps wider than at the start of the year, and the junk index spread is only 8 bps wider (Chart 3). Value remains stretched in the investment grade space, but high-yield spreads look quite attractive. The sell-off in the energy sector has boosted the high-yield index spread considerably (Chart 3, bottom 2 panels). We view this as a medium-term buying opportunity for junk. Once the COVID outbreak abates and global growth ticks higher, the oil price is bound to increase, leading to some tightening in energy spreads. Chart 2Bond Yields Driven By COVID
Bond Yields Driven By COVID
Bond Yields Driven By COVID
Chart 3HY More Attractive Than IG
HY More Attractive Than IG
HY More Attractive Than IG
Will Bonds Feel The Bern? Beyond COVID-19, there is one more risk on the horizon this year. Specifically, the risk that Bernie Sanders is elected President in November. This outcome is far from certain. Sanders is currently leading all other candidates in the Democratic Primary, but fivethirtyeight.com’s model puts the odds of a brokered convention at 38%.3 This means that the race is still wide open and might only be settled at the convention in July. But given Sanders’ lead, it is worth considering the bond market implications if he were to become the next President. The most obvious implication is that risk assets (equities and corporate spreads) would respond to Sanders’ agenda of wealth redistribution by selling off. This could spur a flight-to-quality into government bonds, causing Treasury yields to fall. However, that flight-to-quality won’t occur if markets also start to price-in the long-run implications of Sanders’ agenda. I.e. the fact that the redistribution of wealth from capital to labor would lower the economy’s marginal propensity to save, and likely raise inflation expectations, leading to higher interest rates. It’s important to note that there are a lot of hurdles to overcome before Sanders’ full policy agenda is implemented. First he must secure the Democratic nomination, then defeat Donald Trump in the general election. Even after that, he will still need to convince the House and Senate to pass non-watered down versions of his proposals. With such a long road ahead, we don’t think Sanders’ momentum will push bond yields higher in 2020. Rather, the risk is that Sanders’ rise keeps bond yields low in 2020 as risk assets sell off. If Bernie Sanders looks poised to win the nomination, we will consider reducing our 6-12 month allocation to spread product and increasing our recommended portfolio duration. The outlook for the Democratic Primary should become clearer after Super Tuesday on March 3. If Sanders looks poised to win the nomination we will consider reducing our recommended 6-12 month allocation to spread product and increasing our recommended portfolio duration. Bottom Line: Bond yields will stay low until the daily number of new COVID-19 cases falls to zero, at which point a sell-off is likely. We therefore recommend maintaining below-benchmark portfolio duration on a 6-12 month horizon. Rising odds of a Bernie Sanders presidential win could prevent bond yields from rising at all this year. We may adjust our recommendations in the coming months if this risk increases. Investors should maintain an overweight allocation to spread product versus Treasuries, with a preference for junk. Though the credit cycle is far from over (see next section), we may reduce our recommended allocation to spread product versus Treasuries if Sanders’ election chances rise. Bank Lending Standards Won’t Push Credit Spreads Wider In 2020 The net change in commercial & industrial (C&I) bank lending standards, as reported in the Fed’s quarterly Senior Loan Officer Survey, is a vitally important indicator for the credit cycle. Easing lending standards tend to coincide with a low default rate and falling credit spreads, while tightening lending standards usually coincide with spread widening and a rising default rate. With that in mind, it is mildly concerning that bank lending standards have been fluctuating around neutral levels for quite some time, and have in fact tightened in two of the past five quarters (Chart 4). In this week’s report we consider whether tighter bank lending standards could pose a risk to our overweight spread product view in 2020. Chart 4Bank Lending Standards And Monetary Variables
Bank Lending Standards And Monetary Variables
Bank Lending Standards And Monetary Variables
Bank lending standards are such an important credit cycle variable because they tell us about the supply of credit. A corporate default only occurs when credit supply is lower than the amount required for that firm’s survival. On a macro scale, we can think of two main reasons why lenders might restrict the credit supply: They perceive the monetary environment as restrictive. That is, they worry about higher interest rates and slower growth in the future. They perceive corporate balance sheets as being in poor health. That is, they worry that firms won’t be sufficiently profitable to make good on their debts. We find that monetary indicators do a very good job of predicting when lending standards will tighten. Looking back at the past two cycles, lending standards didn’t tighten until after: The yield curve inverted (Chart 4, panel 2). The real fed funds rate was above its estimated equilibrium level (Chart 4, panel 3). Inflation expectations were at or above target levels (Chart 4, bottom panel). Presently, all three of these monetary indicators are supportive. Some portions of the yield curve have been inverted at various times during the past year. But in general, the inversion signal from the yield curve has not been as strong as it was when lending standards tightened in prior cycles. For instance, the 3-year/10-year Treasury slope has not inverted this cycle, and it currently sits at +20 bps (Chart 4, panel 2). Further, the real fed funds rate is below most estimates of its neutral level and the Fed is signaling that it will keep it there for a long time yet. This dovish posture is justified by inflation expectations that remain well below target. It is conceivable that, despite the accommodative monetary environment, banks might be so concerned about poor balance sheet health that they are becoming more cautious with their lending. However, a survey of corporate health metrics doesn’t point to an imminent tightening of bank lending standards either (Chart 5). Chart 5Bank Lending Standards And Corporate Balance Sheet Variables
Bank Lending Standards And Corporate Balance Sheet Variables
Bank Lending Standards And Corporate Balance Sheet Variables
In past cycles, tighter bank lending standards were preceded by: A trough in gross leverage (pre-tax profits over total debt) (Chart 5, panel 2). A peak in interest coverage (Chart 5, panel 3). Negative pre-tax profit growth (Chart 5, panel 4). A peak in profit margins (Chart 5, bottom panel). Currently, gross leverage is the only one of the above four variables that is clearly sending a negative signal. As for the other three, interest coverage and profit margins are barely off their cyclical highs, and profit growth has been fluctuating around zero for three years. If global growth rebounds during the next 12 months, as we expect, then profit growth will also move modestly higher. Bottom Line: Neither monetary nor balance sheet variables point to an imminent tightening of bank lending standards. We expect that the supply of credit will remain ample in 2020, keeping the default rate low and credit spreads tight. A Note On Falling C&I Loan Demand In addition to questions about lending standards, the Fed’s Senior Loan Officer Survey also asks banks to report whether they are seeing stronger or weaker demand for C&I loans. In response, banks have reported weaker C&I loan demand for six consecutive quarters, ending in Q4 2019. Historically, it is unusual for C&I loan demand to fall without a concurrent tightening in lending standards (Chart 6). Chart 6Explaining Weakening Loan Demand
Explaining Weakening Loan Demand
Explaining Weakening Loan Demand
We also see the impact of weaker loan demand in the hard data. C&I loan growth has been falling since early 2019 (Chart 6, panel 2) and net corporate bond issuance had been on a sharp downtrend since 2015, before moving higher last year (Chart 6, bottom panel). So what’s going on with C&I loan demand? We can think of two reasons why firms might seek out less credit. First, they may face a dearth of investment opportunities, or alternatively, they might perceive some benefit from carrying less debt on their balance sheets. On the first point, we find that new orders for core capital goods do a very good job explaining the swings in C&I lending (Chart 7). Specifically, we see that the global growth slowdown of 2015/16 drove both investment spending and C&I lending lower. Then, both series recovered in 2017/18 before moving down again during last year’s slowdown. Surveys about firms’ capital spending plans also dropped last year, consistent with the deceleration in C&I lending, but remain at high levels (Chart 7, bottom three panels). All of this suggests that C&I loan growth will recover this year as global growth improves and the investment landscape brightens. Capital goods new orders do a good job explaining C&I lending. Corporate bond issuance has followed a different path from C&I lending during the past few years. Specifically, bond issuance slowed in 2015/16 as investment spending dried up. But it did not recover in 2017/18 the way that investment spending and C&I lending did. This appears to be a result of the 2018 corporate tax cuts and repatriation holiday. Chart 8 shows that the Financing Gap – the difference between capex spending and retained earnings – plunged in 2018 because firms suddenly received a huge influx of retained earnings. The influx came in part from the lower tax rate, but mostly from repatriated cash that had been stranded overseas. Simply, firms didn’t need to issue bonds to finance their investment plans in 2018 because they had a lot more cash on hand. Chart 7C&I Lending Follows ##br##Investment
C&I Lending Follows Investment
C&I Lending Follows Investment
Chart 8A Negative Financing Gap Limits The Need For Debt
A Negative Financing Gap Limits The Need For Debt
A Negative Financing Gap Limits The Need For Debt
What about the possibility that firms are demanding less debt because they are trying to clean up their balance sheets? Beyond a few anecdotes, we don’t see much support for this idea. In fact, an equity index of firms with low debt/asset ratios has been underperforming an index of firms with high debt/asset ratios (Chart 9). This suggests that there is currently little reward for firms that are paying down debt. Chart 9Firms Not Rewarded For Healthy Balance Sheets
Firms Not Rewarded For Healthy Balance Sheets
Firms Not Rewarded For Healthy Balance Sheets
Bottom Line: Weaker demand for C&I loans is a result of the recent global growth downturn and decline in investment spending. It is not a harbinger of the end of the credit cycle. Loan demand should improve as global growth rebounds this year. Ryan Swift US Bond Strategist rswift@bcaresearch.com Footnotes 1 Please see US Bond Strategy Weekly Report, “How Are Inflation Expectations Adapting?”, dated February 11, 2020, available at usbs.bcaresearch.com 2 For further details on our Golden Rule of Bond Investing please see US Bond Strategy Special Report, “The Golden Rule of Bond Investing”, dated July 24, 2018, available at usbs.bcaresearch.com 3 https://projects.fivethirtyeight.com/2020-primary-forecast/?ex_cid=rrpromo Fixed Income Sector Performance Recommended Portfolio Specification

Highlights Portfolio Strategy Most of the macro and operating indicators we track are sending conflicting messages on the anticipated direction in the cyclical/defensive ratio. Stay on the sidelines on cyclicals versus defensives. While the coronavirus epidemic will take a bite out of airline demand in the near-term, firm consumer confidence, rising consumer outlays, recovering services PMIs, rising airline pricing power, falling kerosene prices, compelling relative valuations and oversold technicals, all signal that airlines are well positioned to regain altitude on a cyclical time horizon. Recent Changes There are no changes to our portfolio this week. Table 1
Will The Fed Save The Day, Again?
Will The Fed Save The Day, Again?
Feature The SPX shrugged off the persistently negative coronavirus epidemic news and made fresh all-time highs last week (top panel, Chart 1). Domestic flush liquidity remains the dominant macro theme coupled with the expectation of a sizable fiscal and monetary easing out of China in the coming months. Importantly, according to the CME there is a 60% chance of a Fed interest rate cut priced in for the July 29, 2020 FOMC meeting which jumps to over 80% probability for the December 16, 2020 meeting. This is sustaining downward pressure on the 10-year Treasury yield, which in turn is boosting equities. A glum JOLTS report along with the 12-month fed funds rate discounter corroborate that additional Fed easing is likely nearing (middle & bottom panels, Chart 1). Chart 1Is A Fed Interest Rate Cut Looming?
Is A Fed Interest Rate Cut Looming?
Is A Fed Interest Rate Cut Looming?
Chart 2Unsustainable Rise In “Tenuous Trio”
Unsustainable Rise In “Tenuous Trio”
Unsustainable Rise In “Tenuous Trio”
The extreme concentration in excess returns in a handful of tech stocks is another potential trouble spot for equities that we have been highlighting recently. Nevertheless, beneath the surface trouble is brewing. Chart 2 shows three asset classes rising concurrently. The “tenuous trio” as we have called stocks, Treasurys and the greenback in the past, cannot rise in tandem. When all three asset prices appreciate, it typically foreshadows equity market trouble. In this particular iteration, even the VIX is up for the year, representing a big break in historical correlations. Worrisomely, since 2018 every time the VIX and the SPX became positively correlated, the broad market subsequently suffered a setback (Chart 3). While the SPX is making all-time highs, the VIX is neither making all-time lows nor cyclical lows. Importantly, equity market volatility is staying stubbornly close to 15, slightly below the ten-year average. As a reminder, a “VIX reading of 15 means that in 30 days the S&P 500 is expected to trade between 4.3% lower and 4.3% higher than its current level”.1 Chart 3Watch Out For Vol
Watch Out For Vol
Watch Out For Vol
The extreme concentration in excess returns in a handful of tech stocks is another potential trouble spot for equities that we have been highlighting recently.2 Chart 4 shows the percentage of GICS2 sectors with negative two-year relative share price momentum. The higher this diffusion rises the fewer the sectors that drive the SPX’s return. Historically, when our diffusion hits the 70% mark, it signals exhaustion in equity market returns. In fact, 70% readings in this diffusion indicator led both the 2000 and 2007 peaks in the SPX. Chart 4Heed The Diffusion Index’s Message
Heed The Diffusion Index’s Message
Heed The Diffusion Index’s Message
This week we update our views on the cyclical /defensive portfolio bent and a niche industrials sub-group. Meanwhile on the economic front, the JOLTS report made for grim reading. Labor market softness was evident across the board and it was not squarely concentrated in the manufacturing sector. While this indicator only goes back two cycles, it is flashing yellow for the prospects of the broad equity market (top panel, Chart 5). Importantly, we will continue to monitor the job openings numbers as they are sending the exact opposite signal compared with unemployment insurance claims (job openings shown inverted, middle & bottom panels, Chart 5). This week we update our views on the cyclical /defensive portfolio bent and a niche industrials sub-group. Chart 5Avoid Getting JOLTed
Avoid Getting JOLTed
Avoid Getting JOLTed
Mixed Signals We have been neutral the cyclicals/defensives ratio for the past 8 months and continue to recommend investors stay on the sidelines for a while longer. It has been particularly difficult to distinguish a clear signal from noise lately for the cyclicals versus defensives ratio. Relevant macro drivers, operating metrics and profit fundamentals, valuations and technicals all have been emitting conflicting messages and the recent coronavirus epidemic will likely make the waters murkier still. US Equity Strategy’s Global Trade Activity Indicator has turned south recently following in the footsteps of the Chinese manufacturing PMI data that ticked down and are slated to drop below the boom/bust line in the current month (top & bottom panels, Chart 6). The bond market also reflects a gloomy global economic backdrop with the global 10-year Treasury yield sinking like a stone. Such a lackluster bond market will likely weigh on relative share prices (middle panel, Chart 6). CEOs remain a depressed bunch and it is all but certain that for, at least, the next three months executives will put capex plans on the backburner. Basic resources are most at risk and keep in mind that relative capex growth was already decelerating prior to the coronavirus epidemic (top & second panels, Chart 7). Chart 6Trade Uncertainty…
Trade Uncertainty…
Trade Uncertainty…
Chart 7… And Capex Softness Weighs On Cyclicals
… And Capex Softness Weighs On Cyclicals
… And Capex Softness Weighs On Cyclicals
A soft sales backdrop coupled with inventory accumulation are firing a warning shot. Relative share prices will likely succumb to the still weak total business sales-to-inventories ratio (third panel, Chart 7). Importantly, an inventory liquidation phase will continue to exert downward pressure on relative profit margins (bottom panel, Chart 7). Chart 8Pricing Power Proxy Blues
Pricing Power Proxy Blues
Pricing Power Proxy Blues
Our simple relative pricing power proxy for the cyclical/defensive ratio best encapsulates these relative selling price pressures. The CRB metals-to-gold price ratio is on the verge of a breakdown and warns that the wide gulf that has opened up between our pricing power proxy and relative share prices will narrow via a sell off in the latter (Chart 8). Nevertheless, this stands in marked contrast to the ISM manufacturing prices paid subcomponent of the Report On Business survey and actual cyclicals/defensives pricing power momentum (bottom panel, Chart 9). Chart 9The US Dollar Holds The Key
The US Dollar Holds The Key
The US Dollar Holds The Key
Were the greenback to depreciate in the coming months as our FX strategists expect, then cyclicals selling prices would definitively regain the upper hand versus their defensives counterparts (top & middle panels, Chart 9). But, the jury is still out. Sell-side analysts remain optimistic that relative profits will stage a significant comeback in the next year, but on a short-term basis have been trimming cyclical versus defensive earnings revisions (middle & bottom panels, Chart 10). While our macro-factor relative profit growth models were staging a comeback all last year, they ticked down last month (second panel, Chart 10). Finally, relative technical and valuation conditions are both tracing out a bottom near the one standard deviation below the historical mean, a level that has marked prior recoveries in relative share prices (Chart 11). Chart 10Mixed Bag
Mixed Bag
Mixed Bag
Chart 11Unloved & Undervalued
Unloved & Undervalued
Unloved & Undervalued
Bottom Line: Most of the macro and operating indicators we track are sending conflicting messages on the anticipated direction in the cyclical/defensive ratio. Remain on the sidelines on cyclicals versus defensives, but stay tuned. Clipped Wings? Airline stocks have taken it to the chin lately on the back of coronavirus demand destruction fears, but we reiterate our overweight stance as extreme bearishness appears overdone. Investors tend to overreact to events such as virus epidemics, but we deem that such fears typically create trading opportunities, especially in the hardest-hit sectors. Similar to hotels (that we upgraded to neutral last week), airlines are part of the tourism-related industries that have suffered disproportionately. Were we not overweight the S&P airlines index, we would not hesitate to initiate such a position. True, consumer and business demand for air transportation services will come under pressure in the near-term, however looking further out such demand destruction will likely prove transitory. Chart 12 shows that the cyclical demand backdrop is robust for the US airline industry. Overall consumer outlays jumped recently, PCE services momentum is perking up, airfare PCE is outpacing overall consumer spending – an impressive feat – and consumer confidence is perched near cycle highs sustaining a wide gap with relative share prices (bottom panel, Chart 12). US domestic and international passenger enplanements are running near the 5%/annum growth rate and the recent rebound in the global and US services PMIs suggests that any kink in demand will likely prove short-lived (Chart 13). Chart 12Firming Cyclical…
Firming Cyclical…
Firming Cyclical…
Chart 13…Demand Backdrop…
…Demand Backdrop…
…Demand Backdrop…
Importantly, this firm cyclical demand backdrop is reflected in accelerating airline selling price inflation both on domestic and international routes (second & third panels, Chart 14). However, profit margins have yet to reflect this encouraging top line growth backdrop. The airline load factor spread (calculated as load factor minus break-even load factor) also heralds a profit margin expansion phase (bottom panel, Chart 14). Chart 14…Is A Boon For Selling Prices
…Is A Boon For Selling Prices
…Is A Boon For Selling Prices
Chart 15Lower Fuel Costs Should Turbocharge Profit Margins
Lower Fuel Costs Should Turbocharge Profit Margins
Lower Fuel Costs Should Turbocharge Profit Margins
Tack on the roughly 16% year-to-date drubbing in oil prices and airline profit margins will expand in 2020. This is true especially for the bulk of the industry that does not hedge kerosene costs (jet fuel shown inverted, Chart 15). The analyst community has been pessimistic about the prospects of airline stocks. Revenue and profit growth expectations are slated to tail the SPX in the coming twelve months. This sets a low bar for the industry to surpass in coming earnings seasons (Chart 16). Finally, investors have thrown in the towel, pushing relative valuations to extremely depressed levels to the tune of nearly two standard deviations below the historical mean (middle panel, Chart 17). Relative technicals are also washed out and signal that, at least, a reflex rebound is in store in the coming months (bottom panel, Chart 17). Chart 16Low Bar To Surpass
Low Bar To Surpass
Low Bar To Surpass
Chart 17Contrary Alert: Pessimism Reigns Supreme
Contrary Alert: Pessimism Reigns Supreme
Contrary Alert: Pessimism Reigns Supreme
In sum, while the coronavirus epidemic will take a bite out of airline demand in the near-term, firm consumer confidence, rising consumer outlays, recovering services PMIs, rising airline pricing power, falling kerosene prices, compelling relative valuations and oversold technicals, all signal that airlines are well positioned to regain altitude on a cyclical time horizon. Bottom Line: Stay overweight the S&P airlines index. The ticker symbols for the stocks in this index are: BLBG S5AIRLX – LUV, DAL, UAL, AAL, ALK. Anastasios Avgeriou US Equity Strategist anastasios@bcaresearch.com Footnotes 1 https://us.spindices.com/vix-intro/ 2 Please see BCA US Equity Strategy Weekly Report, “Three EPS Scenarios”, dated January 13, 2020, and “When The Music Stops…”, dated January 27, 2020, both available at uses.bcaresearch.com. Current Recommendations Current Trades Strategic (10-Year) Trade Recommendations
Will The Fed Save The Day, Again?
Will The Fed Save The Day, Again?
Size And Style Views June 3, 2019 Stay neutral cyclicals over defensives (downgrade alert) January 22, 2018 Favor value over growth May 10, 2018 Favor large over small caps (Stop 10%) June 11, 2018 Long the BCA Millennial basket The ticker symbols are: (AAPL, AMZN, UBER, HD, LEN, MSFT, NFLX, SPOT, TSLA, V).
Cyclical & High-Conviction Overweights Both our cyclical and 2020 high-conviction large caps overweights versus small caps are in the black by 20% and 5%, respectively, since inception. Debt-saddled small caps have been left behind this cycle as they are more than twice as leveraged compared with their large caps peers on a net debt-to-EBITDA basis. Meanwhile, the narrative that small caps have cheapened versus large caps also does not hold as index providers omit negative profits from their forward EPS calculations. Adjusting for that, small caps are dearly priced versus the SPX. Finally, our relative sentiment proxy gauging the relative attractiveness of small caps versus large caps is on the verge of crossing below the zero line, underscoring that investors should stick with a large cap bias. Bottom Line: We reiterate our large cap preference at the expense of small cap stocks.
Stick With A Large Cap Bias
Stick With A Large Cap Bias