Sectors

An analysis on Hong Kong is available below. Highlights The correction in EM risk assets and currencies will be larger than during the SARS outbreak. A number of market indicators that are pertinent for EM assets are sending a disconcerting message. The trouble is that they have relapsed from already low levels. We are closing our long position in EM stocks to manage risk and continue recommending underweighting EM equities and credit versus their DM counterparts. Stay short EM currencies versus the US dollar. A new trade: Go short Hong Kong banks / long Taiwanese banks. Feature Chart I-1Global Equity Correction: SARS- And Coronavirus-Episodes
Global Equity Correction: SARS- And Coronavirus-Episodes
Global Equity Correction: SARS- And Coronavirus-Episodes
It is tempting to compare the potential impact of the current coronavirus outbreak on the global economy and financial markets with that of SARS in the spring of 2003. The correction in global equities due to the SARS outbreak lasted only a couple of days during April 2003, and global share prices sold off by only 2.5% (Chart I-1). During that period, the EM equity index dropped by 4% and emerging Asian bourses by 8% in US dollar terms (Chart I-2). Presently, the drawdowns in global stocks and EM share prices have been 2.5% and 4%, respectively. Thus, the magnitude of the current correction is on a par with what occurred during the 2003 SARS outbreak (Charts I-1 and I-2). Further, in 2003, share prices bottomed when the number of registered new SARS infections – on a rolling fortnight basis – declined (Chart I-3). This was true both worldwide and in the case of Hong Kong. Chart I-2EM And Asian Stock Corrections: SARS- And Coronavirus-Episodes
EM And Asian Stock Corrections: SARS- And Coronavirus-Episodes
EM And Asian Stock Corrections: SARS- And Coronavirus-Episodes
Chart I-3Number Of New Cases And Share Prices: Global And Hong Kong
Number Of New Cases And Share Prices: Global And Hong Kong
Number Of New Cases And Share Prices: Global And Hong Kong
However, such simplistic comparisons between SARS in 2003 and the current coronavirus outbreak are uninformative. There are striking economic differences between these two episodes. The impact on both the Chinese and global economies will be larger today compared with the effects of SARS. This is true even if the spread of the coronavirus is contained soon and the number of infections and deaths peaks earlier and at much lower levels compared to the SARS outbreak. The rationale behind the meaningful impact on Chinese and global growth is two-fold: The safety measures undertaken by the Chinese authorities, including the extension of the Lunar New Year holiday period and imposition of limits on travel – are much greater than their response in 2003. These efforts might contain the spread of the virus and save human lives, but they will likely dampen economic activity in the near term. The importance of the Chinese economy in the world and hence its impact have grown immensely since early 2003. Overall, the current correction in EM risk assets and currencies will be larger than the one during the SARS outbreak. China’s Share Of The Global Economy: Today Versus 2003 Table I-1China’s Importance Now And In 2003
Coronavirus Versus SARS: Mind The Economic Differences
Coronavirus Versus SARS: Mind The Economic Differences
China’s economy is much more important to global aggregate demand and growth today than it was in 2003 (Table I-1). Specifically: China’s GDP at purchasing power parity accounts for 19.3% of world GDP compared to 8.3% in 2002 before the SARS outbreak occurred. In nominal US dollar terms, the mainland currently accounts for 17% of global GDP versus 4.3% in 2002. We use 2002 because the SARS outbreak occurred in early 2003, so China’s share of world GDP in 2002 is the more accurate measure of the country’s importance in early 2003. Chinese imports of goods and services make up 13.5% of global trade at present, significantly greater than their 4.5% share in 2002. The mainland’s share of consumption of various industrial metals has surged, from between 10-20% in 2002 to 50-60% presently (Table I-1). For copper, it has soared from 18% in 2002 to its current share of 53%. China’s iron ore imports have risen from 21% of the global total in 2002 to 64% presently. The nation’s oil consumption presently accounts for 13.5% compared with 6.6% in 2002. Total semiconductor sales in China currently constitute 34.6% of global semiconductor sales versus 5% in 2002. Personal computer sales in China make up 20% of worldwide sales compared with 2.4% in 2002. Mobile phones sales in China constituted 11% of worldwide sales in 2002. Today, smartphone sales account for 29% of global sales. Finally, in the past 12 months, passenger car sales in China were 21.5 million units, or 34.5% of the global total. In 2002, China’s share in global passenger auto demand was only 7.3%. Other relevant differences between China’s economy then and now include: Chart I-4China's Leverage In 2003 And Now
China's Leverage In 2003 And Now
China's Leverage In 2003 And Now
First, leverage among companies and households was low in 2002 compared with the current debt bubble. Aggregate local currency indebtedness of companies, households and the various levels of government stood at 120% of GDP in 2002, compared with 260% currently (Chart I-4). Even a temporary reduction in cash flows of enterprises due to shutdowns and a plunge in demand will weigh on their ability to service debt. This could in turn temporarily curtail their appetite for new investments and hiring. Second, by 2003 China had just completed a major overhaul of its state-owned enterprises (SOEs) and banks. As a result, the nation was in the early stages of a structural economic boom driven by higher productivity growth. Presently, neither SOE reforms nor deleveraging are meaningfully advanced (Chart I-4, bottom panel). Consequently, China is still in a structural decline in terms of productivity growth. Third, China entered the World Trade Organization in late 2001, and by early 2003 it was enjoying an FDI inflow boom and was on the verge of rapidly increasing its market share in global trade (Chart I-5). Presently, both multinational and Chinese producers are moving their production and supply chains out of China in response to US trade protectionism. Chart I-5China's Global Export Market Share In 2003 And Now
China's Global Export Market Share In 2003 And Now
China's Global Export Market Share In 2003 And Now
Finally, enterprises and organizations were not forced to shut down because of the SARS virus in the spring of 2003. Consequently, the hit to economic activity in the spring of 2003 was mild, as shown in Chart I-6A and I-6B. In contrast, the government today has extended the Chinese New Year holidays by a few days, and some companies will be operating on a part-time basis for a couple of weeks. It is impossible to forecast the evolution of the outbreak, but the odds are that a hit to economic activity in China due to the coronavirus outbreak is likely to be worse than during the SARS episode. Chart I-6AChina: Cyclical Variables During SARS Outbreak
China: Cyclical Variables During SARS Outbreak
China: Cyclical Variables During SARS Outbreak
Chart I-6BChina: Cyclical Variables During SARS Outbreak
China: Cyclical Variables During SARS Outbreak
China: Cyclical Variables During SARS Outbreak
On a positive note, the Chinese authorities will certainly augment their stimulus, especially fiscal spending, to counteract the negative impact of the shutdowns on the economy. However, it remains to be seen how long it will take for these stimulus efforts to filter through the economy and offset the drag from poor sentiment. Market Signals Are Disconcerting There are several financial market signals that are often important in terms of gauging primary trends in EM risk assets and currencies: Chart I-7Industrial Metal Prices Are Back To Their Cyclical Lows
Industrial Metal Prices Are Back To Their Cyclical Lows
Industrial Metal Prices Are Back To Their Cyclical Lows
Base metal prices in general and copper prices in particular have relapsed to their cyclical lows (Chart I-7). In short, industrial metal prices are not confirming a durable recovery in global manufacturing and China/EM domestic demand. Industrial metal prices are leveraged to China’s growth as well as closely correlated with EM ex-China currencies (Chart I-8). This is a bearish signpost for EM exchange rates. Notably, Korea’s bond yields are drifting lower, casting doubt on the sustainability of the nation’s export growth (Chart I-9). The latter is a good barometer of global trade. EM assets are very sensitive to global trade and as such remain at risk. EM small-cap stocks have failed to enter a cyclical bull market, despite investor enthusiasm for EM financial markets following the US-China Phase One trade agreement. Their much-muted rebound is not confirming a broad-based recovery in EM/China growth and improvement in EM domestic fundamentals. Chart I-8EM Currencies: Rebound Has Faded
EM Currencies: Rebound Has Faded
EM Currencies: Rebound Has Faded
Chart I-9Korean Bond Yields And Global Manufacturing
Korean Bond Yields And Global Manufacturing
Korean Bond Yields And Global Manufacturing
Chart I-10EM Risks Are Tilted To The Downside
EM Risks Are Tilted To The Downside
EM Risks Are Tilted To The Downside
Similarly, the rebound in our Risk-On/Safe-Haven currency ratio has faded and this indicator has rolled over (Chart I-10). It correlates well with EM share prices, and presently heralds further downside in the latter. The disconcerting message from these market indicators is that they – unlike the S&P 500 - are not correcting from very overbought levels, but have relapsed and are gapping down from already low levels. Economic data from China and Asia in the coming months will be weak due to coronavirus-related disruptions. Therefore, investors cannot rely on economic data to gauge the direction of the business cycle, Instead, market signals and market-based indicators might become the predominant tools for gauging financial markets directions. Investment Strategy Last week we recommended investors consider going long EM volatility. The levels of EM and DM currencies’ implied volatility were at all-time lows (Chart I-11). We are reiterating this recommendation. Notably, the previous historical lows in EM and DM currencies’ implied volatility occurred just before major bear markets in EM share prices (Chart I-11). Hence, the odds of a major drawdown in EM share prices are considerable. We gave the benefit of the doubt to the market action and went long EM stocks on December 19, 2019. Given the latest market action, indicators and uncertainty over the Chinese/Asian business cycle, we are closing the open position in EM equities. This trade has been flat since its initiation. The EM equity index in US dollar terms is hovering above major technical support lines (Chart I-12). If this level is decisively broken, the downside could be substantial. Alternatively, if EM share prices find support around these levels, it would signal a budding major bull market. We will monitor market action and indicators and adjust our strategy accordingly. Chart I-11A Record Low Vol = A Major Top In Risk Assets
A Record Low Vol = A Major Top In Risk Assets
A Record Low Vol = A Major Top In Risk Assets
Chart I-12EM Stocks: Will Long-Term Technical Support Hold?
EM Stocks: Will Long-Term Technical Support Hold?
EM Stocks: Will Long-Term Technical Support Hold?
Although we upgraded our view on the absolute performance of EM stocks in December, we have continued recommending underweighting EM versus DM. In recent weeks, we have been arguing that we will upgrade EM stocks and credit from underweight to overweight relative to their DM peers if EM share prices and currencies demonstrate resilience amid a correction in global risk assets. So far, they have not been resilient – EM equities have sold off more than their DM peers (Chart I-13) and the weakness in EM currencies has been broad-based. For now, investors should continue underweighting EM equities and credit versus their DM counterparts. The odds of a breakdown in EM currencies are rising. Investors should continue shorting a basket of EM currencies versus the US dollar. Our favored shorts are BRL, CLP, COP, IDR, MYR, PHP, KRW and ZAR. Finally, EM local currency bond yields as well as sovereign and corporate credit spreads are either at record lows or at extremely low levels (Chart I-14). EM sovereign credit spreads appear elevated because the index includes de-facto defaulted sovereigns like Argentina, Venezuela, and others. EM currency trends hold the key for these asset classes. If EM currencies break down, as we expect, EM domestic bond yields will rise, and sovereign and credit spreads will widen. Chart I-13EM Equities Versus DM: New Lows Ahead?
EM Equities Versus DM: New Lows Ahead?
EM Equities Versus DM: New Lows Ahead?
Chart I-14Too Much Complacency In EM Local Bonds And Credit Markets
Too Much Complacency In EM Local Bonds And Credit Markets
Too Much Complacency In EM Local Bonds And Credit Markets
Arthur Budaghyan Chief Emerging Markets Strategist arthurb@bcaresearch.com Hong Kong: Into Uncharted Waters The Hong Kong economy is in recession and its equity prices – stocks domiciled in Hong Kong and included in the MSCI Hong Kong equity index – have underperformed considerably. Is it time to turn positive on Hong Kong equities? We continue to recommend underweighting Hong Kong-domiciled stocks, because the heavyweight sectors – financials and property – remain at risk. The basis is that Hong Kong’s interest rates will likely creep higher as capital outflows persist. Higher borrowing costs will weigh on this highly leveraged economy. Capital Flows And Interest Rates The currency board system mandates the Hong Kong Monetary Authority (HKMA) to maintain a pegged exchange rate with the US dollar. With an open capital account and a fixed exchange rate, the HKMA has little control over interest rates. Chart II-1Banks Excess Reserves AT HKMA And Interest Rates
Banks Excess Reserves AT HKMA And Interest Rates
Banks Excess Reserves AT HKMA And Interest Rates
Capital outflows exert depreciation pressure on the currency, forcing the monetary authorities to sell their foreign currency reserves to defend the exchange rate peg. This drains commercial banks’ excess reserves at the central bank, thereby tightening interbank liquidity and lifting interest rates (Chart II-1). In brief, interbank rates need to rise to inhibit capital flight. For now, we expect the heightened socio-political uncertainty in Hong Kong to linger. This will hurt economic growth, thereby depressing economic sentiment and return on capital. In turn, this will continue to spur capital outflows. The latter will exert upward pressure on interest rates. Overall, this could unleash a feedback loop of deteriorating growth conditions, capital outflows and higher interest rates. While it is doubtful that Hong Kong will experience a full-blown crisis, the most likely scenario is a slow leakage of capital out of the city and gradually rising interest rates. A mirror image of capital outflows from Hong Kong is foreign capital inflows in Singapore. In particular, foreigners’ Singapore dollar deposits rose by S$6.8 billion from May to November 2019, and foreign currency deposits in Singaporean banks increased by S$9 billion during the same period (Chart II-2). Chart II-2Non-Residents Deposits In Singapore Confirm Capital Flight Out Of HK
Non-Residents Deposits In Singapore Confirm Capital Flight Out Of HK
Non-Residents Deposits In Singapore Confirm Capital Flight Out Of HK
Real Estate Blues Hong Kong’s property market is under stress from both falling income/cash flow and slowly rising interest rates. Odds are that various segments of the Hong Kong property market – especially the retail, commercial and high-end residential – have entered an extended downturn. The protests and the coronavirus outbreak have all but halted tourism, especially from the mainland. Mainland Chinese visitors accounted for 75% of total arrivals a year ago, and their spending accounted for over 10% of personal consumption expenditures in Hong Kong. Tourists from the mainland are not expected to return soon due to both Hong Kong’s protests and the travel limitations due to the coronavirus outbreak. Hong Kong’s domestic demand is also anemic, and will stay so given poor business sentiment and a weakening labor market. In a nutshell, the value of retail sales in November plunged by a record 23.6% from a year earlier (Chart II-3). Contracting consumption has resulted in sharply rising vacancies and pushed retail property rents and prices off the cliff for the first time since 2008 (Chart II-4). Retail sector rents and prices have on average deflated by 10% from last year. Consistently, high-street rents have also fallen by about 18% in 2019. In short, rising vacancy rates of retail properties herald further rent decline. Chart II-3HK: Retail Sales Have Collapsed
HK: Retail Sales Have Collapsed
HK: Retail Sales Have Collapsed
Chart II-4HK Retail Properties: Vacancy, Rents And Prices
HK Retail Properties: Vacancy, Rents And Prices
HK Retail Properties: Vacancy, Rents And Prices
Hong Kong’s office market is also at risk, with vacancy rates climbing (Chart II-5). Office property prices have dropped by 8%, and prime grade A property prices have plunged a whopping 20% from a year earlier (Chart II-5, bottom panel). Multinational companies and financial firms have been relocating to reduce their rental costs. In the third quarter of this year, office vacancies in the center of Hong Kong reached 7.4%, their highest in 14 years. With respect to Hong Kong‘s residential market, it is a mixed bag. On average, home prices have so far declined by only 3% from their peak in 2019. (Chart II-6, top panel). That said, luxury residential prices have already plunged by 27% from a year ago (Chart II-6, second panel). The residential sector’s resilience in the middle- and low-ends can be explained by strong end-user demand and lack of speculative purchases over the past three years due to the government’s anti-speculative measures. For example, the number of residential transactions involving stamp duties – a proxy for foreign purchases – has fallen sharply since Q4 2016 due to tougher regulations. Chart II-5HK Offices: Vacancy, Rents And Prices
HK Offices: Vacancy, Rents And Prices
HK Offices: Vacancy, Rents And Prices
Chart II-6HK Residential Vacancy, Rents And Prices
HK Residential Vacancy, Rents And Prices
HK Residential Vacancy, Rents And Prices
Chart II-7HK: Retail Yields And Interest Rates
HK: Retail Yields And Interest Rates
HK: Retail Yields And Interest Rates
Even only marginally higher interest rates will be sufficient to hurt real estate. Rental yields on all types of properties are very low and close to borrowing costs (Chart II-7). There is not much of a valuation buffer if borrowing costs rise or rents deflate. In a nutshell, the high-end property market as well as commercial real estate are vulnerable. Importantly, the Hong Kong authorities cannot use lower interest rates to help the economy, leaving fiscal policy as the sole tool. The government has accumulated enormous fiscal surpluses, and it will ramp up spending to stimulate the economy. The authorities have so far announced three tiny fiscal stimulus packages amounting to only 0.8% of GDP in aggregate. This is clearly insufficient to jump start the business cycle amid lingering headwinds. Nevertheless, government expenditures account for only 10% of GDP, and any reasonable jump in spending in the coming months will not be sufficient to preclude a downtrend in the broader economy. Banks Holds The Key Chart II-8HK-Domiciled Banks: Profit Outlook Is Downbeat
HK-Domiciled Banks: Profit Outlook Is Downbeat
HK-Domiciled Banks: Profit Outlook Is Downbeat
Hong Kong-domiciled bank share prices are at risk from a deceleration in loan growth, rising non-performing loans (NPLs) and a drop in their net interest rate margins (Chart II-8). Banks’ domestic loans are concentrated in real estate: About 55% of domestic loans consist of lending to property developers and mortgages. Such a high concentration of real estate lending makes Hong Kong banks vulnerable to a property market correction. If banks begin tightening lending standards, the game will be over. At the moment, bankers might be relaxed as they are comparing the current episode with short-lived corrections in the property market and the economy in 2008, 2013 and 2015. However, odds are that this downturn will be more severe. As the economic stress heightens, banks might begin tightening lending standards. In such a case, property prices and construction activity will sink, feeding back into the economy. Notably, this process seems to have started, as evidenced by bank tightening of credit standards for small businesses (Chart II-9). Importantly, the debt service ratio for Hong Kong’s nonfinancial sectors is among the highest in the world (Chart II-10). Provided all outstanding mortgages are floating-rate, any rise in interest rates will increase borrowing costs. Coupled with shrinking nominal incomes, debtors – both households and companies – will struggle to service their debt. Chart II-9HK Banks Have Been Tightening Credit For Small Businesses
HK Banks Have Been Tightening Credit For Small Businesses
HK Banks Have Been Tightening Credit For Small Businesses
Chart II-10HK Private Sector: Debt-Service Ratio Is the Highest
HK Private Sector: Debt-Service Ratio Is the Highest
HK Private Sector: Debt-Service Ratio Is the Highest
Investment conclusions We continue to reiterate our underweight position in Hong Kong equities within emerging markets, global and Asian equity portfolios (Chart II-11). The Hong Kong currency peg will be maintained for now, even at the cost of rising interest rates and debt deflation in the real economy. We discussed the Hong Kong exchange rate outlook in a special report last June, and the main points of that analysis remain valid. The HKMA has an enormous amount of foreign exchange reserves to defend the currency peg. However, the cost of defending the exchange rate will be higher interest rates. The latter will hurt Hong Kong’s highly leveraged economy in general and its property market in particular. As a bet on property market travails, we continue to recommend being short Hong Kong property stocks and long Singapore real estate equities (Chart II-12). The macro justification for this trade is the ability of Singapore to drop interest rates and tolerate currency depreciation, and Hong Kong’s inability to do so. Finally, as a new trade, we recommend shorting Hong Kong-domiciled banks relative to Taiwanese banks. As discussed, Hong Kong banks are exposed to rising borrowing costs, weakening real estate and rising NPLs. Chart II-11Continue Underweighting HK Stocks
Continue Underweighting HK Stocks
Continue Underweighting HK Stocks
Chart II-12Stay Short HK Property / Long Singapore Property Stocks
Stay Short HK Property / Long Singapore Property Stocks
Stay Short HK Property / Long Singapore Property Stocks
We chose Taiwanese banks because they are defensive in nature – i.e., they will likely be a low-beta play within the Asia equity universe. Lin Xiang, CFA Research Analyst linx@bcaresearch.com Footnotes Equities Recommendations Currencies, Credit And Fixed-Income Recommendations
The Sixth Big Theme For The 2020s
The Sixth Big Theme For The 2020s
Structural Underweight Our sixth big theme for the 2020s is a sustained deceleration of Chinese real GDP growth to a range of 4% to 2%. While this will not happen overnight, the implication is that steadily lower real GDP growth coupled with higher consumption expenditures at the expense of gross fixed capital formation will reduce Chinese appetite for commodities. At the margin, this change in consumption behavior will have knock on effects on the broad basic resources sector in general and the S&P 1500 metals & mining index in particular. Were this Chinese backdrop to pan out in the coming decade as we expect, it would sustain the relative underperformance of metals & mining equities (see chart). Bottom Line: There are high odds that China’s real GDP deceleration will continue for another decade, casting a shadow over the profit prospects of the S&P 1500 metals & mining index. A structural below benchmark allocation is warranted. The ticker symbols for the stocks in this index are: BLBG S15METL – NEM, FCX, NUE, RS, RGLD, STLD, CMC, ATI, CRS, CLF, CMP, X, KALU, WOR, MTRN, HCC, AKS, SXC, HAYN, CENX, TMST, ZEUS.
Vertigo Warning
Vertigo Warning
The SPX remains near all-time highs and the invincible tech sector continues to lead the pack. While the overall market does not fully resemble the excesses of the dot.com bubble era, at least not yet, there are elements that are eerily reminiscent of the late-1990s. We filtered for large cap stocks that are at all-time highs and have increased in value at a minimum 10x since 2010. Among the stocks that met these criteria, five really stand out, Apple, Tesla, Lam Research, Amd & Salesforce, comprising our “ATLAS” index. If history at least rhymes, the mania in these stocks will likely end in tears (see chart). Bottom Line: The SPX remains 6% overvalued according to our EPS scenario analysis published two weeks ago. Caution is still warranted, especially if profit growth fails to materialize in the coming months.
Highlights Portfolio Strategy There are high odds that China’s real GDP deceleration will continue for the next decade, casting a shadow over the profit prospects of the S&P 1500 metals & mining index. A structural below benchmark allocation is warranted. Rising total mutual fund assets under management, improved trading revenue prospects, rising investor confidence along with a revival in IPO and M&A activity, all signal that it still pays to be overweight the S&P capital markets index. Recent Changes There are no changes in our portfolio this week. Table 1
When The Music Stops...
When The Music Stops...
Feature “When the music stops, in terms of liquidity, things will be complicated. But as long as the music is playing, you’ve got to get up and dance. We’re still dancing.” - Charles Owen "Chuck" Prince III (ex-CEO of Citigroup) The SPX remains near all time highs and the invincible tech sector continues to lead the pack. Two weeks ago we showed that the market capitalization concentration of the top five stocks in the S&P 500 surpassed the late-1990s parallel (Chart 1), and Table 2 shows that late in the cycle a handful of stocks explain a sizable part of the broad market’s return.1 However, in terms of valuation overshoot the current forward P/E of these top five stocks is roughly half the late-1990s parabolic episode (Chart 2). Chart 1Vertigo Warning
Vertigo Warning
Vertigo Warning
Chart 2Unlike The Late-1990s
Unlike The Late-1990s
Unlike The Late-1990s
While the overall market does not fully resemble the excesses of the dot.com bubble era, at least not yet, there are elements that are eerily reminiscent of the late-1990s. Table 2Contribution To Late Cycle Rallies In The SPX
When The Music Stops...
When The Music Stops...
Chart 3Correlation Breakdown
Correlation Breakdown
Correlation Breakdown
Contrary to popular belief, during manias historical correlations break down and the forward multiple becomes positively correlated with the discount rate. So in the late 1990s, the fed funds rate and the 10-year yield jumped 200bps in a short time span and the SPX forward P/E soared 40% from roughly 18x to 25x (Chart 3) before collapsing to 14x soon thereafter. Simultaneously, the US dollar was roaring as real interest rates were 4%, but the NASDAQ 100 outperformed the emerging markets, another break in historical correlations. As Chuck Prince mused in 2007, there is a narrative in the equity market today that, “as long as the music is playing, you’ve got to get up and dance”. While the overall market does not fully resemble the excesses of the dot.com bubble era, at least not yet, there are elements that are eerily reminiscent of the late-1990s. We filtered for large cap stocks that are at all-time highs and have increased in value at a minimum 10x since 2010. Among the stocks that met these criteria, five really stand out, Apple, Tesla, Lam Research, Amd & Salesforce, and comprise our “ATLAS” index; the mania in these stocks will likely end in tears (Chart 4). Even their forward P/E ratio has gone exponential, hitting a 60 handle last year similar to top five SPX stocks in the late-1990s. Chart 4ATLAS: Holding The World On His Shoulders
ATLAS: Holding The World On His Shoulders
ATLAS: Holding The World On His Shoulders
Currently, SPX profits are barely growing and the sole reason equities are higher is the massive injection of liquidity via the drubbing in interest rates and the restart of QE. From peak-to-trough the 10-year yield fell 175bps in nine months, and the Fed commenced expanding its balance sheet by $60bn/month since last September; yet profits have barely budged. Ultimately, profits have to show up and the news on this front remains grim. The current non-inflationary trend-growth backdrop is a “goldilocks” scenario especially for tech stocks that thrive during disinflationary periods. While stocks can go higher defying weak EPS fundamentals as they have yet to reach a fully euphoric state according to our Complacency-Anxiety Indicator (Chart 5), a sell-off in the bond market will likely cause some consternation in equities in general and tech stocks in particular similar to early- and late-2018. Chart 5Not Max Complacent Yet
Not Max Complacent Yet
Not Max Complacent Yet
Other catalysts that can suddenly cause “the music to stop” are either the recent coronavirus becoming an epidemic or a geopolitical event that would result in a risk off backdrop. Ultimately, profits have to show up and the news on this front remains grim. Our mid-January “Three EPS Scenarios” analysis still suggests that the SPX is 9% overvalued.2 This week we are updating our capital markets view and adding a sixth long-term theme and a related investment implication to our mid-December 2019, Special Report titled, “Top US Sector Investment Ideas For The Next Decade”.3 Sixth Big Theme For The Decade And Investment Implications China’s ascendancy on the world scene was a mega driver of equity markets in the 2000s following its inclusion in the WTO. The commodity super-cycle captured investors’ imaginations and China’s insatiable appetite for commodities caused a massive bubble in the commodity complex in general and commodity-related equities in particular. Nevertheless, the Great Recession posed a severe threat to China and the authorities injected an extraordinary amount of stimulus into the economy (15% of GDP over two years). This succeeded in doubling real GDP growth, but only temporarily. The unintended consequence was an enormous debt binge fueled by cheap money. Moreover, this debt burden along with falling labor force growth and productivity forced the government to re-think its policies as they caused a steady down drift in real output growth. The sixth big theme for the 2020s is a sustained deceleration of Chinese real GDP growth to a range of 4% to 2% (Chart 6). Not only is the debt overhang weighing on real output growth, but Chinese leaders are adamant about transitioning the economy to developed market status, which is synonymous with higher consumption expenditures at the expense of gross fixed capital formation. Chart 6From Boom…
From Boom…
From Boom…
Chart 7…To Bust
…To Bust
…To Bust
In other words, China remains committed to weaning its economy off of investment and reconfiguring it toward consumption (Chart 7). This is a strategic plan but it is possible that the Chinese economy can achieve this transition in due time. While this will not happen overnight, the implication is steadily lower real GDP growth as is common among large, mature, developed market economies. China will remain one of the top commodity consumers in the world, as urbanization is ongoing, but the intensity of commodity consumption will continue to decelerate (Chart 8). At the margin, this change in consumption behavior will have knock on effects on the broad basic resources sector in general and the S&P 1500 metals & mining index in particular. Were this Chinese backdrop to pan out in the coming decade as we expect, it would sustain the relative underperformance of metals & mining equities as Chart 6 & 7 depict. Chart 8Commodity Consumption Deceleration Will…
Commodity Consumption Deceleration Will…
Commodity Consumption Deceleration Will…
Chart 9…Continue To Weigh On Metals & Mining Profits
…Continue To Weigh On Metals & Mining Profits
…Continue To Weigh On Metals & Mining Profits
Importantly, these commodity producers will have to adjust their still bloated cost structures to lower run rates which is de facto negative both for relative sales and profit growth (Chart 9). Tack on the large negative footprint mining extraction has on the environment, and if ESG investing (our fifth big theme for the decade4) also takes off, investors should avoid the S&P 1500 metals & mining index on a secular basis. Bottom Line: There are high odds that China’s real GDP deceleration will continue for the next decade, casting a shadow over the profit prospects of the S&P 1500 metals & mining index. A structural below benchmark allocation is warranted. The ticker symbols for the stocks in this index are: BLBG S15METL – NEM, FCX, NUE, RS, RGLD, STLD, CMC, ATI, CRS, CLF, CMP, X, KALU, WOR, MTRN, HCC, AKS, SXC, HAYN, CENX, TMST, ZEUS. Capital Markets Update Capital markets stocks have come out of hibernation recently and are on the cusp of breaking out – in a bullish fashion – of their 18-month trading range. A number of the indicators we track signal that an earnings-led outperformance period is in the cards for this financials sub-group and we reiterate our overweight stance. Sloshing liquidity has pushed investors out the risk spectrum and high yield bond option adjusted spreads are flirting with multi-year lows. Such a tame junk bond market backdrop coupled with easy financial conditions are conducive to rising M&A activity (Chart 10). Importantly, the Fed’s Senior Loan Officer Survey paints an improving profit backdrop for investment banks. Not only are bankers willing extenders of credit, but demand for credit for the majority of loan categories that the Fed tracks is squarely in positive territory (top panel, Chart 11). Chart 10Subsiding Risks Are A Boon To Capital Markets
Subsiding Risks Are A Boon To Capital Markets
Subsiding Risks Are A Boon To Capital Markets
Chart 11Positive Profit Catalysts
Positive Profit Catalysts
Positive Profit Catalysts
This is likely a consequence of last year’s drubbing in the price of credit. M&A activity usually goes hand in hand with loan growth, underscoring that business combinations are on track to accelerate (third panel, Chart 10). This will revive a lucrative business line for capital markets firms. Total mutual fund assets are expanding at a brisk rate and hitting fresh all-time highs, signaling an uptick in risk appetite (third panel, Chart 11). Rising investor confidence will facilitate both new and secondary share issuance, an important source of fee generation for capital markets firms. Moreover, equity trading volumes have sprang back to life in recent weeks underscoring that the recent impressive Q4 earnings results will likely continue into Q1/2020 (bottom panel, Chart 10). Meanwhile, the three Fed rate cuts last year should work through the economy and at least stem further losses in the ISM manufacturing survey. The US/China trade détente will also lead to a stabilization in global growth. In fact, the V-shaped recovery in the global ZEW survey suggests that capital markets profits will likely outpace the broad market this year (second & bottom panels, Chart 11). Finally, the recent surge in the stock-to-bond ratio reflects a massive psychological shift, from last year’s recessionary fears to growing investor confidence that tail risks are abating (Chart 12). Still depressed valuations neither reflect the firming capital markets profit outlook nor the rising industry ROE (bottom panel, Chart 12). Adding it all up, accelerating total mutual fund assets under management, improved trading revenue prospects, rising investor confidence and a revival in IPO and M&A activity, all signal that it still pays to be overweight the S&P capital markets index. Bottom Line: Stay overweight the S&P capital markets index. The ticker symbols for the stocks in this index are: BLBG S5CAPM – GS, CME, SPGI, MS, BLK, SCHW, ICE, MCO, BK, TROW, STT, MSCI, NTRS, AMP, MKTX, CBOE, NDAQ, RJF, ETFC, BEN, IVZ. Chart 12Valuation Re-Rating Looms
Valuation Re-Rating Looms
Valuation Re-Rating Looms
Anastasios Avgeriou US Equity Strategist anastasios@bcaresearch.com 1 Please see BCA US Equity Strategy Weekly Report, “Three EPS Scenarios” dated January 13, 2020, available at uses.bcaresearch.com. 2 Ibid. 3 Please see BCA US Equity Strategy Special Report, “Top US Sector Investment Ideas For the Next Decade” dated December 16, 2019, available at uses.bcaresearch.com. 4 Ibid. Current Recommendations Current Trades Size And Style Views Stay neutral cyclicals over defensives (downgrade alert) Favor value over growth Favor large over small caps (Stop 10%)
Highlights Commercial rents have fallen in real terms, revealing that the commercial property price rally has been fueled exclusively by low rates. Limited upside for rents and an upward direction for future rates are two significant headwinds. However, commercial real estate is especially pro-cyclical and inflationary pressures need to work their way into the economy before the risk of a downturn becomes imminent. The good news is that the economy is less vulnerable to slipping commercial property prices. Large banks have shrunk their commercial property loan books and their composition has shifted towards safer categories of commercial loans. While the macroeconomic outlook remains somewhat neutral, CMBS’ risk/reward profile appears reasonably attractive relative to other US bond sectors. Feature Real estate was a bane for markets and the banking system in the last recession, and commercial properties have lately become an increasingly popular source of concern among investors. Average prices have grown by 90% over the past decade, rising well above their pre-Great Financial Crisis peaks. We have made the case that we are heading into the expansion’s last stretch. The study of economic cycles and our relentless quest to identify inflection points ahead of time become more timely as the bull market ages. To this end, current commercial property valuations deserve close scrutiny and we explore whether any underlying excesses could potentially disrupt financial stability or precipitate a recession in the US. We conclude that although commercial property prices have little hope of appreciating significantly from current levels, a reversal is not imminent until inflationary pressure forces rates higher. When prices eventually slip, the impact on the overall economy should be more attenuated than it was in the last recession, as the banking system has become less vulnerable to a downturn in commercial real estate. While the fundamental macro outlook remains neutral, suggesting no imminent pressure on spreads, US bond investors can find relative value in non-agency Aaa-rated CMBS (vs. corporate bonds rated A or higher) and in agency CMBS (vs. agency residential mortgaged-backed securities). A Rate-Driven Rally Chart 1Commercial Rents Have Decoupled From Property Prices
Commercial Rents Have Decoupled From Property Prices
Commercial Rents Have Decoupled From Property Prices
Like all financial assets, commercial property prices are derived from discounting future cash flows to their present value. Since the crisis, a low rate environment, supported by a sluggish inflation backdrop and continuously accommodative monetary policy, has depressed the valuation equation’s denominator. Meanwhile, strong economic fundamentals and demographic trends - such as urbanization and the millennials’ tendency to marry and purchase a home at a later age - have helped boost the numerator for commercial and multi-family residential properties in the past decade. However, with the exception of multi-family residential real estate - for which price appreciation has also been the strongest - real rents have fallen (Chart 1), revealing that low rates have propelled commercial properties’ price appreciation over the past decade. The combination of falling real rents and surging property prices has depressed commercial real estate cap rates1 to cyclical low levels, raising the question of a potential unwind. Mathematically, an increase in cap rates could result, on the one hand, from rent growth outpacing inflation growth, translating into an increase in real rents on the numerator. Alternatively, cap rates could rise from falling property prices, reducing the denominator. On a cyclical horizon, the latter outcome seems more likely than the former. Little Upside Left For Rents First, the fact that rents in real terms have decreased in spite of sluggish inflation is a bad omen for the outlook for future real rents. We have made the case that there is more inflationary pressure than meets the eye beneath the surface of the US economy. The combination of an already very tight labor market and a pickup in manufacturing activity point towards further wage growth. Inflation is a lagging indicator that has more scope to rise than roll-over at this stage of the cycle. All else equal, upward inflationary pressure will depress real rents further. Second, nominal rents themselves are also facing significant headwinds. Office buildings’ and retail shopping centers’ vacancies have barely recovered from the hit they took in the last recession, while new inventory is struggling to get absorbed by new demand (Chart 2). A strong labor market generally supports the demand for office spaces but a tight labor market limits its future upside. The latter, though, increases potential wage gains and consumers’ purchasing power, whose fundamentals are already strong. We have shown that US consumers’ increased savings rates and lower debt levels put them in a good position to spend their incremental income. Chart 2Post-Crisis Office And Shopping Center Vacancies Remain Elevated...
Post-Crisis Office And Shopping Center Vacancies Remain Elevated...
Post-Crisis Office And Shopping Center Vacancies Remain Elevated...
Chart 3...As These Sectors Face Structural Disruptions
...As These Sectors Face Structural Disruptions
...As These Sectors Face Structural Disruptions
However, both sectors are facing structural disruptions. Co-working has introduced a new player in the office segment – a sub-lessor who signs long-term leases on space it rents out in short-term chunks. If a sizable sub-lessor like WeWork were forced to shrink its footprint, a lot of office supply would come back on to the market, while demand is shrinking as businesses attempt to reduce the area each employee occupies. Brick-and-mortar retailers continue to be buffeted as e-commerce captures an increasing share of consumer spending, keeping downward pressure on retail rents (Chart 3). The picture looks slightly brighter in the industrial properties space, where vacancies have recovered to healthier levels, though low vacancies have failed to lift rents as demand for properties is being met by new inventory (Chart 4). The revival in global manufacturing activity that we are expecting to occur this year should support industrial property rents in the near term, but the advanced age of the cycle limits future upside. Chart 4A Brighter Picture For Industrial And Apartment Buildings...
A Brighter Picture For Industrial And Apartment Buildings...
A Brighter Picture For Industrial And Apartment Buildings...
Chart 5...Thanks To Rising Renters Income
...Thanks To Rising Renters Income
...Thanks To Rising Renters Income
Chart 6Over-Construction Of High-Tier Properties
Over-Construction Of High-Tier Properties
Over-Construction Of High-Tier Properties
Multi-family residential housing is the only sector that has experienced steady real rent growth, fueled by a combination of rising rentership rates and rising household income amongst renters (Chart 5). Homebuilders’ focus on building higher-end units has led to an oversupply of more expensive properties, and their prices have already started to contract on a year-on-year basis (Chart 6). Multi-family residential properties rents should lose momentum as the alternative cost of owning homes falls, especially as homebuilders attempt to right-size their mix of properties to offer more lower-end supply. Exhausted Demand A commercial real estate rally fueled by perpetually falling rates is unsustainable. Although the market sees the potential for an additional rate cut, we think the Fed is done cutting. Labor market strength and a revival in global manufacturing activity argue that no further accommodation or insurance rate cuts are necessary. From current levels, the path of least resistance for rates is upwards (Chart 7). Strong demand from institutional investors has also contributed to fueling prices. Pension funds and insurance companies’ holdings of mortgages and agency-backed securities have nearly doubled since 2010 (Chart 8, first panel) and their allocation as a percentage of total assets is nearing pre-recession highs (Chart 8, second panel). These levels allow them little flexibility to sustain their demand impulse, as there is only so much they can allocate to real estate and other alternative investments. Chart 7Stronger Economic Growth Will Put Upward Pressure On Government Bond Yields
Stronger Economic Growth Will Put Upward Pressure On Government Bond Yields
Stronger Economic Growth Will Put Upward Pressure On Government Bond Yields
Chart 8Saturated Demand From Institutional Investors...
Saturated Demand From Institutional Investors...
Saturated Demand From Institutional Investors...
Demand from yield-hungry investors may also get exhausted if CMBS yields deflate to the point where they lose competitiveness relative to other income-producing investments. CMBS yields have broadly moved with other bond yields since the crisis, though US high-yield corporates have widened somewhat over the last few years, making them a slightly more appealing alternative to CMBS, all else equal (Chart 9). The steady downward pressure on multi-family cap rates since 2010 (Chart 10) reveals that the collateral underlying multi-family loans has become increasingly ambitiously priced, suggesting that losses given default on multi-family backed CMBS without agency backing may be rising, eroding prospective default-adjusted returns. Chart 9...And From Yield-Hungry Investors?
...And From Yield-Hungry Investors?
...And From Yield-Hungry Investors?
Chart 10Cap Rates Have Reached Cyclical Lows
Cap Rates Have Reached Cyclical Lows
Cap Rates Have Reached Cyclical Lows
New regulations also have the potential to retract a significant share of demand for commercial mortgages. The severe housing market deterioration during the Great Financial Crisis and the government intervention required to ensure Freddie Mac’s and Fannie Mae’s solvency led the Federal Housing Finance Agency (FHFA) to place these two government sponsored enterprises (GSEs) under conservatorship in 2014 and to cap their holdings of multi-family mortgages to US$ 100 billion for each GSE. A commercial real estate rally fueled by perpetually falling rates is unsustainable. Current holdings of multi-family residential loans far exceed the stated limits (Table 1). GSEs hold nearly half of all multi-family residential loans outstanding. The post-crisis growth in GSE-guaranteed loans is largely attributable to the exclusion from the cap of certain categories of loans such as green energy loans (Chart 11). The FHFA eliminated these exemptions last year, making the US$ 200 billion cap more binding and applicable to all multi-family loans without exception.2 The impact on mortgage originators and investors is yet to be seen but it would naturally follow that demand for multi-family mortgages to bundle into CMBS would decline if the GSEs are forced to take a step back from the space. Table 1Commercial Real Estate Loans By Holder ($US Mn)
Commercial Real Estate And US Financial Stability
Commercial Real Estate And US Financial Stability
Chart 11Multi-Family Mortgage Debt Outstanding By Mortgage Holder
Multi-Family Mortgage Debt Outstanding By Mortgage Holder
Multi-Family Mortgage Debt Outstanding By Mortgage Holder
Late-Cycle Dynamics Commercial mortgages are typically non-recourse (in case of default, the borrower can only recover the value of the collateralized property) making the loss given default a function of property prices. When times are good and property prices rise, borrowers can easily refinance their loans. The opposite holds in bad times. Therefore, commercial real estate prices are especially pro-cyclical. In spite of the headwinds outlined above, a commercial property downturn does not seem imminent. In spite of the headwinds outlined above, a commercial property downturn does not seem imminent. First, the US economy still has momentum, is supported by highly accommodative monetary policy and should get a boost from a global growth revival. Absent any major exogenous shock to the global economy, we expect that a recession is at least eighteen months away. For as long as the economy keeps expanding, commercial real estate prices can remain elevated. Second, sources of financing remain abundant as the emergence of alternative lenders (Chart 12) has offset the banks’ tighter lending standards for commercial properties (Chart 13). The proliferation of non-bank lenders is typically a late-cycle indicator. Chart 12The Proliferation Of Alternative Lenders…
Commercial Real Estate And US Financial Stability
Commercial Real Estate And US Financial Stability
However, when the economy starts contracting, a commercial real estate downturn could have an outsized impact on banks with significant exposure. In the late 1980s, the commercial property downturn induced a recession and the subprime mortgage bust gave rise to the Great Financial Crisis. Healthier Balance Sheets The good news for the economy today is that banks are less vulnerable to a downturn in commercial real estate than they were back then. The good news for the economy today is that banks are less vulnerable to a downturn in commercial real estate. Banks have decreased their overall exposure to commercial property loans to levels below their 2008 and 1989 peaks (Chart 14). It is worth noting, though, that smaller banks have taken an increasingly important role in the commercial property market as they now finance 65% of all commercial property loans. However, a stronger concentration in smaller banks represents a localized rather than systemic risk, as smaller banks tend to have a more concentrated geographic exposure. Conversely, large banks have significantly shrunk their commercial real estate loan books.3 Chart 14Large Banks Have Shrunk Their CRE Books...
Large Banks Have Shrunk Their CRE Books...
Large Banks Have Shrunk Their CRE Books...
Chart 15...And Shifted Away From Speculative-Grade Loans
...And Shifted Away From Speculative-Grade Loans
...And Shifted Away From Speculative-Grade Loans
Most importantly, the composition of the commercial property loan book has changed drastically since the Great Financial Crisis. Banks have significantly reduced their exposure to more speculative construction and development loans (Chart 15). Risk appetite typically increases in the latter stages of an expansion, yet construction loans remain at relatively depressed levels. The growth in commercial property loans since 2013 has entirely been explained by the rise in relatively less risky multi-family and non-residential non-farm loans. Investment Implications A commercial real estate downturn is probably not a 2020 event. Inflationary pressures need to make their presence felt across a wide swath of the economy before Fed hikes will give rates the scope to move sustainably higher. In the meantime, bond investors with a mandate to remain exposed to CMBS can reap the benefits of attractive risk/reward profiles relative to other segments of the US bond market. US Bond Strategy’s Excess Return Bond Map measures the number of standard deviations of spread widening a sector would need to experience, before losing 100 basis points relative to a duration-matched position in Treasuries4 (Chart 16). Sectors plotting near the top-right of the Map carry both high expected return and low risk. Sectors plotting near the bottom-left carry low expected return and high risk. Chart 16BCA US Bond Strategy’s Excess Return Bond Map
Commercial Real Estate And US Financial Stability
Commercial Real Estate And US Financial Stability
Chart 17Tighter Standards And Decelerating Prices
Tighter Standards And Decelerating Prices
Tighter Standards And Decelerating Prices
This valuation framework currently suggests that CMBS look reasonably attractive. Non-agency Aaa-rated CMBS’ expected return is more promising than Aaa-and Aa-rated corporate bonds and somewhat similar to the expected return on an A-rated corporate bond. Meanwhile, CMBS exhibit a lower risk of losing 100 bps. Similarly, Agency CMBS offer greater expected return than Conventional 30-year Agency-backed residential MBS, along with a similar risk of losses. Although relative valuations appear attractive, the fundamental outlook remains neutral for CMBS spreads, for now. Periods of tightening commercial real estate lending standards and weakening commercial loan demand have historically coincided with decelerating commercial real estate prices and widening CMBS spreads. The Fed’s Q3 2019 Senior Loan Officer Survey revealed only a small net tightening of lending standards and unchanged demand (Chart 17). Overall, the lack of inflationary pressure suggests that neither a commercial real estate downturn nor a meaningful widening of CMBS spreads is an imminent threat. Jennifer Lacombe Senior Analyst JenniferL@bcaresearch.com Ryan Swift US Bond Strategist rswift@bcaresearch.com Footnotes 1 A capitalization rate is the ratio of net operating income (rent) to price and measures the expected rate of return on a real estate investment. As such, a property’s price can also be derived by dividing its rent by its cap rate. 2 More information about GSE’s conservatorship can be found on the FHFA’s website (https://www.fhfa.gov/Conservatorship/Pages/History-of-Fannie-Mae--Freddie-Conservatorships.aspx and https://www.fhfa.gov/Media/PublicAffairs/Pages/New-Multifamily-Caps-9132019.aspx). 3 An analysis of the largest banks’ earnings call we carried out last October also revealed that large banks were unanimously shrinking their commercial real estate books. For more details, please refer to US Investment Strategy Weekly Report from October 28, 2019, "What The Biggest Banks See", available at usis.bcaresearch.com. 4 For more details on the methodology behind our Excess Return Bond Map please see US Bond Strategy October 15, 2019 Weekly Report "A Perspective On Risk And Reward", available at usbs.bcaresearch.com.
Pricing Power Blues
Pricing Power Blues
Underweight While Johnson & Johnson’s (JNJ) recent earnings release was in line with expectations, one phrase caught our attention: “Our robust growth can be attributed to volume, not price” - JNJ CEO Alex Gorsky. We agree with Alex Gorsky that industry pricing dynamics are disappointing to say the least, and will remain a headwind for the foreseeable future (third panel). Meanwhile, on the volume front industry level data reveals that retail sales have “caught the flu” and are infecting relative share prices (second panel). Adding insult to injury, the capex cycle has clearly turned for the worse underscoring that the path of least resistance remains to the downside for Big Pharma. Bottom Line: We remain underweight the S&P pharmaceuticals index. The ticker symbols for the stocks in this index are: BLBG: S5PHAR – JNJ, PFE, MRK, LLY, BMY, ZTS, AGN, MYL, PRGO.
Highlights An analysis on India is available on page 12. There is extreme complacency in global financial markets. With currency markets’ implied volatility at a record low, we recommend going long EM currency volatility. The latter will rise in the next six month regardless the direction of global risk assets. For now, we remain long the EM MSCI equity index with a stop point at 1050. In India, nominal income growth has fallen below lending rates. The latter have not declined despite monetary easing. The authorities will force banks to reduce their lending rates, which will hurt bank stocks. Feature “…we have probably seen the end of the boom-bust cycle.” Bob Prince, Co-CIO of Bridgewater World Economic Forum, Davos January 22, 2020 Low Volatility = Complacency Chart I-1Go Long Currency Volatility
Go Long Currency Volatility
Go Long Currency Volatility
The comment above by co-CIO of the largest hedge fund declaring the end of boom-bust cycle is consistent with lingering complacency in global financial markets. Any time an influential person made a similar declaration in the past, it marked a major turning point in financial markets. Remarkably, implied volatility for the US dollar has plummeted to a record low, as it has for EM currencies and a wide range of equity markets. Chart I-1 illustrates the implied volatility for EM currencies and the US dollar. Such low levels of implied currency market volatility historically preceded major moves in currency markets and often led to a material selloff in broad EM financial markets. It does not mean that the world economy will crash but financial markets volatility in general and currency market volatility in particular are bound to rise considerably in the months ahead. The risk-reward profile of going long EM currency or US dollar volatility appears very attractive. Today we recommend investors to go long EM currency volatility. The latter will rise regardless the direction of global risk assets. Concerning overall strategy, EM financial markets are entering a testing period. How broader EM risk assets and currencies perform in the coming weeks will signal how durable and long-lasting the current EM rally will be. Given global risk assets are overbought, a correction or consolidation phase is overdue. If EM equities, currencies and credit markets outperform, or at least do not underperform their DM peers in the course of this indigestion phase, it will beckon more upside for EM risk assets in 2020. If during budding market turbulence EM risk assets and currencies underperform their DM peers, it will signal their vulnerability in 2020.Implied volatility for the US dollar has plummeted to a record low, as it has for EM currencies. Implied volatility for the US dollar has plummeted to a record low, as it has for EM currencies. For now, we remain long the EM MSCI equity index with a stop point at 1050. We will upgrade our EM equity and credit market allocations versus DM if the EM universe generally exhibits relative resilience in the coming weeks, and more of our indicators confirm China’s growth recovery. Hints Of Recovery… December economic data out of China were strong, and it seems that the credit and fiscal stimulus are finally beginning to lift growth: Chinese imports and nominal industrial output – among the most reliable measures of the Chinese business cycle – posted very robust growth numbers in December (Chart I-2). DRAM and NAND semiconductor prices are climbing, and China’s container freight index is also in revival mode (Chart I-3). These high-frequency (daily and weekly) data confirm improving business activity in both the global semiconductor sector and in overall world trade. Chart I-2China's December Economic Data Were Strong
China's December Economic Data Were Strong
China's December Economic Data Were Strong
Chart I-3Asia's Trade Is Recovering
Asia's Trade Is Recovering
Asia's Trade Is Recovering
There are tentative signs of amelioration in our proxies for marginal propensity to spend by households and enterprises in China (Chart I-4). A more decisive improvement in these indicators is needed to reinforce the positive outlook for China’s growth. …But Doubts Still Linger Despite the recent improvement in Chinese economic data and the rebound in China-related plays, there are a number of financial market indicators that are not yet confirming a sustainable business cycle recovery in China and global trade. In particular: First, apart from semiconductor stocks, global cyclical equity sectors and sub-sectors – industrials, materials, and freight and logistics – have begun, once again, underperforming defensive sectors (Chart I-5). Outperformance by these cyclical sectors against defensives is essential in confirming that global and Chinese capital spending – which were the primary sources of the most recent slowdown – are picking up again. Chart I-4China: Tentative Improvement In Household And Corporate Marginal Propensity To Spend
China: Tentative Improvement In Household And Corporate Marginal Propensity To Spend
China: Tentative Improvement In Household And Corporate Marginal Propensity To Spend
Chart I-5Global Equities: Cyclicals Are Again Underperforming Defensives
Global Equities: Cyclicals Are Again Underperforming Defensives
Global Equities: Cyclicals Are Again Underperforming Defensives
Notably, the relative performance of EM share prices to the global equity benchmark historically tracks the relative performance of global materials versus the global overall stock index.1 However, the two have recently diverged (Chart I-6). In short, global materials are not corroborating sustainability in the recent EM outperformance. If EM equities, currencies and credit markets outperform, or at least do not underperform their DM peers in the course of this indigestion phase, it will beckon more upside for EM risk assets in 2020. Second, the rebound in Chinese and EM shares prices is not corroborated by Chinese onshore government bond yields, which are dipping to new cyclical lows (Chart I-7). In other words, interest rate expectations in China are falling – i.e., they are not confirming a robust recovery. Chart I-6Unsustainable Decoupling
Unsustainable Decoupling
Unsustainable Decoupling
Chart I-7A Message From The Chinese Fixed-Income Market
A Message From The Chinese Fixed-Income Market
A Message From The Chinese Fixed-Income Market
Third, EM ex-China currencies have not yet broken out versus the US dollar (Chart I-8). Consistently, the broad trade-weighted US dollar has not yet broken down. Chart I-9 illustrates that the greenback’s advance-decline line has not yet fallen below its 200-day moving average, a condition that has historically been required to confirm the dollar’s cyclical bear market. Chart I-8EM Currencies: No Breakout Yet
EM Currencies: No Breakout Yet
EM Currencies: No Breakout Yet
Chart I-9The US Dollar Is At A Critical Juncture
The US Dollar Is At A Critical Juncture
The US Dollar Is At A Critical Juncture
We view these exchange rate patterns as a litmus test to validate turning points in the global business cycle. Finally, the technical profiles of the KOSPI, EM small cap stocks and copper prices are inconclusive (Chart I-10). These markets have rebounded but seem to be confronting a critical technical test. If they decisively break above these technical levels, it will be a sign that the EM bull market will be lasting and durable. Otherwise, caution is still warranted. Bottom Line: There is a good amount of complacency among global investors at a time when there are several market signals that are still challenging the view of enduring revival in China/EM growth. Corporate Profits Will Be The Arbiter Ultimately, economic growth and corporate profits will determine the direction of not only share prices but also EM sovereign and corporate credit spreads as well as their currencies. So far, the EM equity rebound of the past 12 months has been solely due to multiples expansion amid a deepening EM profit recession: Earnings per share in US dollar terms has been contracting by 10% from a year ago, and the rate of change has so far not turned around (Chart I-11). Chart I-10The KOSPI And Copper Are Facing A Resilience Test
The KOSPI And Copper Are Facing A Resilience Test
The KOSPI And Copper Are Facing A Resilience Test
Chart I-11EM Equities: A Profitless Rally?
EM Equities: A Profitless Rally?
EM Equities: A Profitless Rally?
Going forward, however, EM corporate profits growth is set to improve. Our indicator for semiconductor companies’ revenues is heralding a revival in semi sector profits (Chart I-12, top panel). The rate-of-change improvement in commodities prices is also foreshadowing potential amelioration in corporate earnings growth among energy producers and materials (Chart I-12, middle and bottom panels). Chart I-12EPS Growth In EM Technology, Energy And Materials
EPS Growth In EM Technology, Energy And Materials
EPS Growth In EM Technology, Energy And Materials
We are negative on EM bank profits due to their need to recognize and provision for non-performing loans as well as the authorities’ mounting pressures on them to reduce lending rates. The latter will shrink banks’ elevated net interest rate margins. The profit profile of other EM equity sectors is illustrated in Chart I-13A and I-13B. Chart I-13AEM EPS Growth By Sectors
EM EPS Growth By Sectors
EM EPS Growth By Sectors
Chart I-13BEM EPS Growth By Sectors
EM EPS Growth By Sectors
EM EPS Growth By Sectors
Provided technology, materials and energy stocks account for 33% of the MSCI EM aggregate equity index’s earnings (banks account for another 28% of total profits), it is safe to assume that the growth rate of EM EPS will move from -10% currently to zero or mildly positive territory by mid-2020. Nevertheless, beyond the next several months, our leading indicators on the EM profit outlook are not positive. China’s narrow money growth leads EM EPS by 12 months, and currently suggests the EPS recovery will be both muted and short-lived (Chart I-14). The technical profiles of the KOSPI, EM small cap stocks and copper prices are inconclusive. Further, China’s broad money impulse points to a peak in the credit impulse in the first half of the year (Chart I-15). Given that EM share prices bottomed a year ago, simultaneously with China’s credit impulse, odds are that EM equities could slump with a rollover in the latter. Chart I-14EM EPS: Marginal Improvement Ahead But No Robust Recovery
EM EPS: Marginal Improvement Ahead But No Robust Recovery
EM EPS: Marginal Improvement Ahead But No Robust Recovery
Chart I-15China: A Signpost Of A Potential Top In The Credit Impulse
China: A Signpost Of A Potential Top In The Credit Impulse
China: A Signpost Of A Potential Top In The Credit Impulse
Chart I-16DM Central Banks' Assets And EM Stocks And Currencies: No Stable Correlation
DM Central Banks' Assets And EM Stocks And Currencies: No Stable Correlation
DM Central Banks' Assets And EM Stocks And Currencies: No Stable Correlation
What if the current liquidity-driven rally continues? In our report last week titled A Primer On Liquidity, we elaborated at great length about the different liquidity measures and how they influence financial asset prices. Empirically, changes in DM central banks’ balance sheets have had no stable correlation with either EM share prices or EM local currency bonds, as demonstrated in Chart I-16. There have been periods over the past 10 years when EM risk assets and currencies have performed poorly, despite an accelerating pace of QE programs worldwide (Chart I-16). The true and critical driver for EM equity and currency performance has been EM’s own domestic fundamentals and China’s business cycle (please refer to Chart I-11 on page 7). To be sure, we are not suggesting that DM central bank policies have not affected global and EM financial markets at all. They have done so in spades. By purchasing and withdrawing about $9 trillion in high-quality securities from the marketplace, the monetary authorities have shrunk the stock of available financial assets. Consequently, even though QE programs have expanded broad money supply only modestly,2 the upshot has been that more money has been chasing fewer financial assets. Also, low interest rates reduce the opportunity cost of owning risk assets. These two phenomena have led investors to bid up prices of various securities, including EM ones. Nevertheless, despite the ongoing and indiscriminate global search for yield, EM share prices in US dollar terms and EM ex-China currencies (including carry, i.e. on a total-return basis) are still below their 2010 levels. Such poor performance of EM risk assets has been a corollary of just how bad EM fundamentals have been. Bottom Line: EM corporate profits will improve on a rate-of-change basis in the coming months. However, forward-looking indicators do not yet point to a robust recovery in EM corporate profits as occurred in 2017. Investment Conclusions We are maintaining our long EM equities position with a stop point at 1050 for the MSCI EM stock index (7% below the current level). If EM share prices, credit markets and currencies outperform their DM peers during a correction/consolidation phase, we will upgrade EM allocations to overweight in global equity and credit portfolios. At the moment, EM is confronting a resilience test. Within the EM equity universe, our overweights are Russia, Korea, Thailand, Mexico, UAE, Pakistan and central Europe. Our recommended equity underweights include Indonesia, the Philippines, Hong Kong domestic stocks, South Africa, Turkey and Colombia. In sovereign credit and local bond markets, our overweights are Mexico, Russia, Thailand, Malaysia, Pakistan and Ukraine. In turn, South Africa, Turkey, Philippines and Indonesia warrant an underweight stance. Today we are upgrading Indian bonds from neutral to overweight (see page 17). In the currency space, we continue holding a short position versus the US dollar in the following basket of currencies: BRL, ZAR, CLP, COP, IDR, PHP and KRW. As always, the full list of our positions is presented at the end of report (please refer to pages 18-19 and on our website). Arthur Budaghyan Chief Emerging Markets Strategist arthurb@bcaresearch.com India: Beware Of Private Banks And Consumer Perils Indian private banks and consumer staple stocks have been holding up the Indian equity market at a time when the rest of the bourse has been sluggish. Both sectors, however, are extremely expensive and thus tremendously sensitive to minor profit disappointments. Remarkably, private banks now trade at a price-to-earnings (P/E) ratio of 31 and price-to-book value (PBV) ratio of 4. Indian consumer staple stocks, on the other hand, trade at a P/E ratio of 41 (Chart II-1 and Chart II-2). Chart II-1Indian Private Bank Stocks Are Expensive
Indian Private Bank Stocks Are Expensive
Indian Private Bank Stocks Are Expensive
Chart II-2Indian Consumer Staple Stocks Are Very Pricey
Indian Consumer Staple Stocks Are Very Pricey
Indian Consumer Staple Stocks Are Very Pricey
Chart II-3A Credit Boom Among Indian Private Banks
A Credit Boom Among Indian Private Banks
A Credit Boom Among Indian Private Banks
Given that private banks have been specializing in both mortgages and non-mortgage consumer lending, the call on both private bank and consumer staple stocks is contingent on consumer financial health. The loan book of private banks has expanded tremendously: since 2010 it has grown at a compounded annual growth rate (CAGR) of 20% and 14% in nominal and real (inflation-adjusted) terms, respectively (Chart II-3).3 In turn, the share of household loans is reasonably large at around 52% of private banks total loan book. Unfortunately, India’s consumer sector appears to be fragile at the moment. Employment and wage growth have downshifted – the Manpower employment index is at a 14-year low (Chart II-4). Consequently, household disposable income growth has decelerated to 9% in nominal terms (Chart II-5). Critically, households’ ability to service debt has deteriorated as nominal disposable household income growth has fallen slightly below borrowing costs, i.e., bank lending rates (Chart II-5). This development is precarious not only because it makes it more difficult for consumers to service their debt – causing NPLs to rise – but it also dampens consumer credit demand. Consequently, private banks’ considerable exposure to consumers could reverse the fortunes of the former as consumers face increasing difficulties servicing their debt. Moreover, with borrowing costs above nominal income growth, banks in India could face adverse selection problem. The latter is a phenomenon when loan demand primarily comes from riskier borrowers who are in desperate need for funding. In such a case, non-performing loans are bound to mushroom. Chart II-4India's Labor Market Is In Doldrums
India's Labor Market Is In Doldrums
India's Labor Market Is In Doldrums
Chart II-5India: Household Nominal Income And Lending Rate
India: Household Nominal Income And Lending Rate
India: Household Nominal Income And Lending Rate
Overall, household spending is in the doldrums. Two- and three-wheeler and passenger car unit sales have all been contracting. In the meantime, consumer demand for non-durable goods has also weakened, as reflected by stalling non-durable consumer goods production. Residential property demand has plummeted. According to the Reserve Bank of India’s December Financial Stability Report – quoting data from PropTiger DataLabs – housing sales units contracted by 20% in September from a year ago. In turn, growth in house prices has been anemic (Chart II-6). Prices are now growing below core inflation, i.e. property prices are deflating in real terms. Households’ ability to service debt has deteriorated as nominal disposable household income growth has fallen slightly below borrowing costs. Going forward, odds are that employment and wage growth will remain weak in India. The basis is the corporate sector is also struggling and still reluctant to invest and hire. Chart II-7 illustrates that the number of investment projects has collapsed, while capital goods production and capital goods imports are both shrinking (Chart II-7). Chart II-6India: Housing Market Is Feeble
India: Housing Market Is Feeble
India: Housing Market Is Feeble
Chart II-7India: Companies Are Not Investing
India: Companies Are Not Investing
India: Companies Are Not Investing
Overall, the entire Indian economy is suffering from high borrowing costs in real (adjusted for inflation) terms (Chart II-8, top panel). Chart II-8Lending Rates Have Not Declined Despite Monetary Easing
Lending Rates Have Not Declined Despite Monetary Easing
Lending Rates Have Not Declined Despite Monetary Easing
Importantly, the monetary policy transmission mechanism has not been working effectively in India. Even though the central bank has cut its policy rate by 135 basis points in 2019, prime borrowing did not budge (Chart II-8, middle panel). Consequently, loan growth has decelerated sharply (Chart II-8, bottom panel). On the whole, for the economy to recover, it requires considerably lower borrowing costs or a substantial fiscal boost. Indian central and state fiscal aggregate budget deficit is already wide at 6% of GDP. With public debt-to-GDP ratio at 68%, there is some but not enormous room for boosting government expenditures drastically. This makes reducing commercial bank lending rates the most feasible mechanism to jump-start the economy. Consequently, the authorities will become more aggressive in forcing commercial banks to cut their lending rates. This seems to be taking place as in September 2019 the RBI asked Indian commercial banks to link lending rates on certain types of loans more closely to the central bank’s policy rate to ensure more effective monetary policy transmission. Yet doing so will squeeze down commercial banks’ net interest rate margins – which have widened – and will hit banks’ profits. Alternatively, if lending rates do not fall, non-performing loans (NPLs) will increase because only risky borrowers will be willing to borrow while existing debtors will struggle to service their debt at current elevated interest rates. This will also depress bank profits. These two negative scenarios are probably reflected in low valuations of public bank share prices, but they are not yet priced in among private banks stocks. Given the latter’s exuberant valuations, only a small drop in net interest rate margins or a small rise in NPLs, will be enough to drag their share prices lower. Investment Conclusions Chart II-9India Vs. EM Relative Equity Performance Is Often About Oil
India Vs. EM Relative Equity Performance Is Often About Oil
India Vs. EM Relative Equity Performance Is Often About Oil
Travails of the Indian economy will persist for now. Much more policy support is required to turn the business cycle around. EM equity investors should keep a neutral allocation to Indian stocks within an EM equity portfolio. Indian share prices often outperform their EM peers when oil prices drop and lag when crude prices rally (Chart II-9). Given our negative view on oil prices,4 we are reluctant to downgrade this bourse to underweight. Private banks are susceptible to a drawdown as either their net interest rate margins will drop or they will face rising non-performing loans. Consumer staples stocks are expensive and, hence, are vulnerable to marginal profit disappointments. We are upgrading our allocation to Indian domestic bonds from neutral to overweight within an EM local bond portfolio. Consistently, we are closing our yield curve steepening trade in India. This position has produced a 30 basis points gain since July 2016. Low inflation, weak real growth, a struggling credit system and ineffective transmission of monetary easing argue for even lower interest rates in India. The surge in food prices should be viewed as a relative price shock, not inflation. Higher food prices will curb the spending power of consumers and weaken their expenditures on non-food items. In addition, core inflation remains very low. Ayman Kawtharani Editor/Strategist ayman@bcaresearch.com Footnotes 1 Please click on the link to access EM: Perception versus Reality report. 2 Commercial banks’ reserves at central banks do not constitute and are not a part of narrow or broad money supply. 3 The calculation is based on the annual reports of four large Indian private banks: HDFC Bank, ICICI Bank, Kotak Mahindra Bank, and Axis Bank. 4 This is the Emerging Markets Strategy team’s view and it differs for BCA’s house view on oil. Equities Recommendations Currencies, Credit And Fixed-Income Recommendations
Ignition Sequence: Complete
Ignition Sequence: Complete
Overweight In our most recent Special Report we outline why we believe the S&P industrials index is set to outperform the market. Among other reasons, industrials forward earnings breadth – defined as the net number of sub-sectors with higher forward earnings revisions – has bounced off extreme lows signaling that the sell-off in relative share prices is reaching exhaustion. Historically, similar sharp bounces have marked previous price reversals (second panel). With regard to fundamentals, expanding profit margins since mid-2018 also reflect positive sector dynamics, despite the industry having borne the brunt of the US/China trade war. In fact, CEOs managed to compensate for the falling selling prices at the expense of labor (third & bottom panels). Bottom Line: Remain overweight the S&P industrials index. For more details please refer to the most recent Special Report.
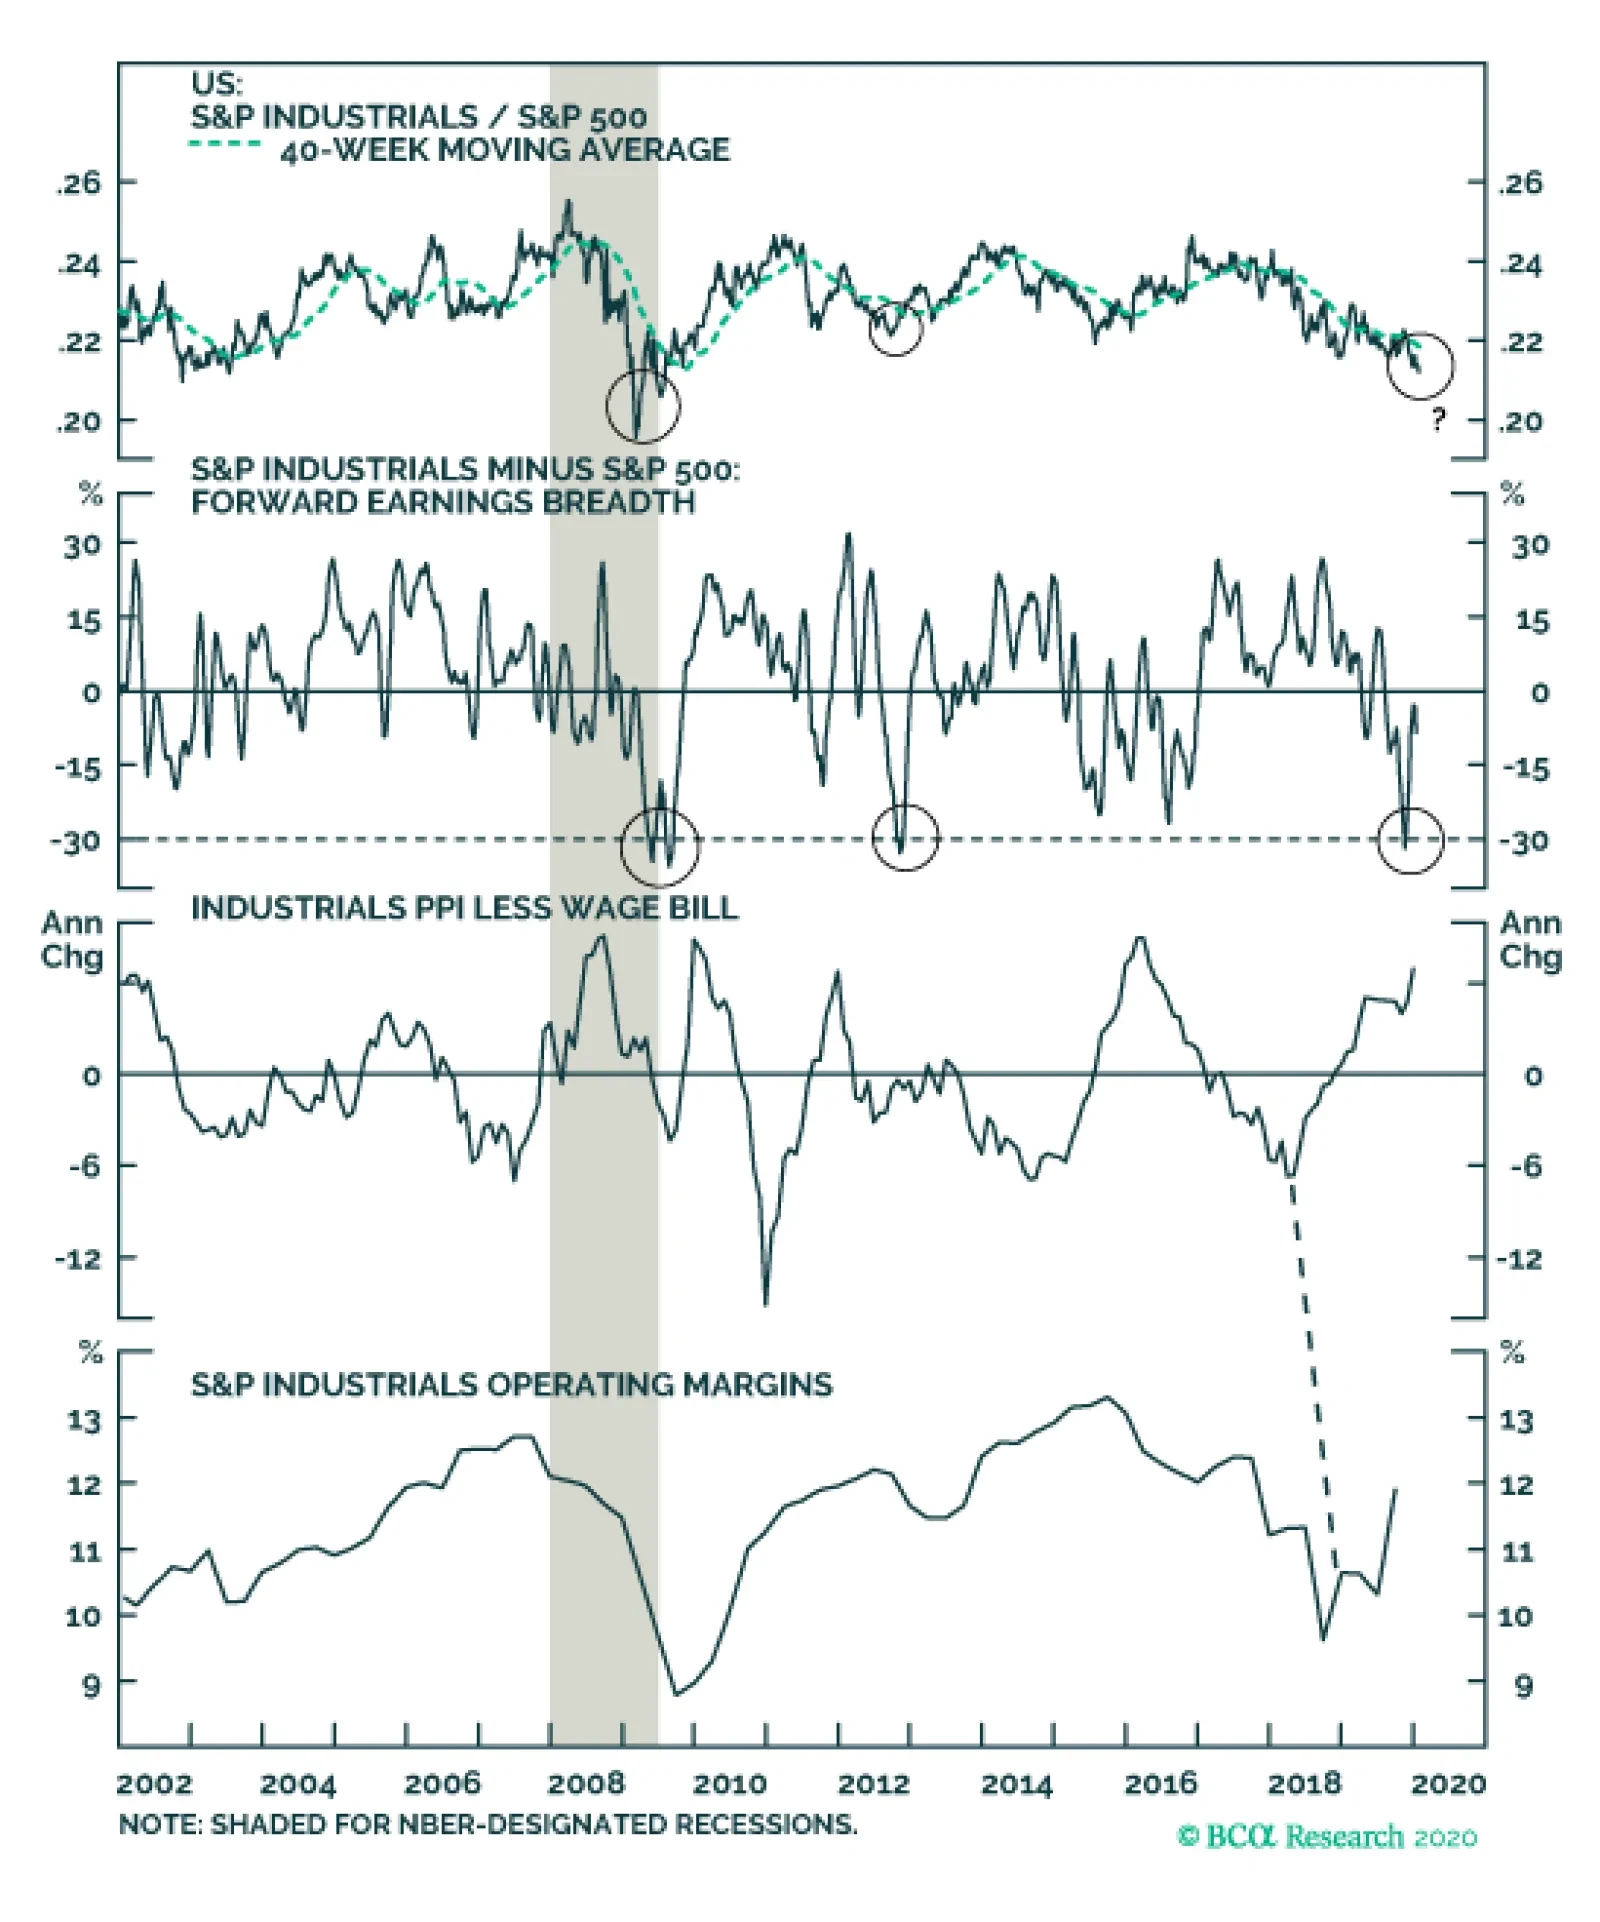
First, industrials' forward earnings breadth – defined as the net number of sub-sectors with higher forward earnings revisions – has bounced off extreme lows signaling that the sell-off in relative share prices is reaching exhaustion. Historically, similar…
Highlights Macro winds are slowly changing, compelling investors to take a second look at highly cyclical sectors such as industrials. In this Special Report we highlight that the S&P industrials index is trading at a nearly 10% discount to the market on a forward P/E basis, meanwhile a list of welcoming omens has appeared on the horizon which will serve as a foundation for the relative share price outperformance. Increasing odds of a modest rebound in the US manufacturing PMI Stabilization in EM in general and Chinese economy in particular BCA’s House View of a weaker dollar Healthy industry operating metrics Table 1
Industrials: Start Your Engines
Industrials: Start Your Engines
Feature While US manufacturing remains in recession, investors have already positioned for a V-shaped recovery according to the spectacular run-up in the S&P 500. However, drilling beneath the surface is revealing. Instead of hypersensitive industrials equities sniffing out a recovery in the manufacturing sector, the SPX’s advance has been solely driven by tech mega caps, and thus leaving in the dust all their deep cyclical peers. Why? Because the industrials complex has borne the brunt of the trade war (Chart 1). However, our expectation remains for a natural healing of the economy sometime in the first half of the year, and a rotation out of tech equities into capital goods stocks. Industrials equities will be among the first beneficiaries of this improving macro backdrop. Specifically, four key themes underpin our bullish stance on the S&P industrials index: Increasing odds of a modest rebound in the US manufacturing PMI Stabilization in EM in general and Chinese economy in particular BCA’s House View of a weaker dollar Healthy industry operating metrics Chart 1Trade War Echoes
Trade War Echoes
Trade War Echoes
The ISM Will Soon Turn The Corner ISM’s manufacturing PMI survey is still below the 50 boom/bust line, but much of the macro pessimism is likely already reflected in the data, as it is set to bottom by the end of Q1 2020 and rebound into Q2 2020. To be clear, we are not expecting a jump into the high 50s, but rather look for a more balanced recovery into the low 50s. Nevertheless, it is a 5-point rise from the current recessionary level, and the S&P industrials index will cheer a relief in macro data. Charts 2 & 3 clearly depict that the ISM manufacturing PMI is set to improve in the coming months. First, our demand/supply proxy for the overall US economy (comprising of retail and industrial production data) is signaling that industrial production will likely bottom by mid-2020, despite Boeing’s ails (Chart 2, bottom panel). Industrial production is also known to lag PMI by roughly three months, which translates into PMI bottoming in Q1 2020, if history at least rhymes. Moreover, the bond market is also sending a similar message (Chart 2, third panel). As a reminder, BCA’s House View calls for a sell-off in the bond market to a range of 2.25-2.5% for this year. Chart 2Long Term And …
Long Term And …
Long Term And …
Chart 3… Short Term Drivers Are Positive
… Short Term Drivers Are Positive
… Short Term Drivers Are Positive
Both coincident and short-term leading economic variables also emit a positive signal. Lumber prices have recovered sharply over the past year (Chart 3, second panel), and given their close correlation with the ISM manufacturing PMI, the move underscores that the bottoming process in the latter has already begun. Moreover, survey internals have made a modest turn on a three-month moving average basis, suggesting that the path of least resistance is to the upside (Chart 3, bottom panel). On the political front, our sister Geopolitical Strategy service has been right on Trump having to retreat and to agree on a “ceasefire” deal as the 2020 elections are looming. Following the October and December tariff “postponement/cancelation” coupled with lower chances of any tariff hikes at all until the 2020 election will likely provide a further boost to the “soft” survey data. As a reminder, the increase in trade policy uncertainty over 2018-2019 has been a large contributor to data deterioration (Chart 1). EM And Chinese Green Shoots A rising share of international sales for the S&P industrials index originates from the EM, as those countries are responsible for a large percent of world total commodity consumption and construction activity. The EM manufacturing PMI has done a good job at tracing the S&P industrials relative share price performance, and the current divergence between the two can serve as yet another catalyst for a rally (Chart 4, top panel). Most importantly, China is also enjoying green shoots. BCA’s Chinese credit & fiscal impulse has been grinding higher over the past year foreshadowing a further rebound in EM data, and consequently benefiting US industrials. Finally, Chinese infrastructure spending that managed to climb out of negative territory will, at the margin, further boost industrials end-demand (Chart 4, middle & bottom panels). Chart 4International Arena Improving
International Arena Improving
International Arena Improving
The Dollar Is Petering Out Switching gears to the greenback, more good news is in store for the S&P industrials index. Forty-four percent of sales are international for the S&P industrials sector, making it sensitive to FX fluctuations. BCA’s House View for 2020 calls for a weaker USD and should it be proven correct, industrials P&Ls will enjoy positive currency translation tailwinds. Chart 5 shows a newly created dollar model first published by our sister The Bank Credit Analyst service, heralding a softer greenback in the coming months. The real trade-weighted US dollar has been a key driver for the S&P industrials’ sales ever since 1975 as they remained in positive territory even during the recent manufacturing recession. A turn in the US dollar will reignite sales growth and underpin the relative share price ratio (Chart 6, bottom panel). Chart 5The Softening US Dollar …
The Softening US Dollar …
The Softening US Dollar …
In addition, a depreciating US dollar has been synonymous with a relative multiple expansion phase, and a definitive fall in the dollar will likely serve as a catalyst to unlock excellent value in bombed out relative valuations (Chart 6, third panel). Looking at sales from a different angle, our industrials sector exports proxy has a tight inverse correlation with the USD, and is likely to hook higher given that the US dollar is flat on a year-over-year basis (Chart 6, second panel). Chart 6… Holds The Key …
… Holds The Key …
… Holds The Key …
Chart 7… And So Do Our EPS Models
… And So Do Our EPS Models
… And So Do Our EPS Models
Finally, our relative earnings growth model does an excellent job at encapsulating all the profit drivers and is signaling that an earnings-led outperformance period looms (Chart 7). Enticing Operating Metrics Drilling down and away from macro and toward industry-level data is instructive. First, industrials forward earnings breadth – defined as the net number of sub-sectors with higher forward earnings revisions – has bounced off extreme lows signaling that the sell-off in relative share prices is reaching exhaustion. Historically, similar sharp bounces have marked previous price reversals (Chart 8, second panel). Chart 8Selling Climax?
Selling Climax?
Selling Climax?
Chart 9More Welcoming News
More Welcoming News
More Welcoming News
Expanding profit margins since mid-2018 also reflect positive sector dynamics as the industry managed to shrug off falling selling prices at the expense of labor (Chart 8, third & fourth panels). Importantly, the CRB raw industrials index is tracing a bottom and a depreciating US dollar will assist in orchestrating a recovery in industrials PPI (Chart 9). With regard to balance sheet health, interest coverage and net debt-to-EBITDA ratios are not sounding alarm bells as they are comparable to the broad market. Industrials are also steadily pumping out healthy free cash flow numbers, which should be a welcoming sign for investors (Chart 10). Despite all these tailwinds, sell-side analysts are still overly pessimistic on relative long-term profit prospects (Chart 11, fourth panel). Chart 10Good B/S All Around
Good B/S All Around
Good B/S All Around
Chart 11No Red Flags
No Red Flags
No Red Flags
Neither BCA composite Valuations nor Technical Indicators caution against overweighting the S&P industrials index (Chart 11, second and third panels). In fact, on a forward P/E basis, the sector is trading at a nearly 10% discount to the broad market making it an historically “cheap” addition to one’s portfolio (Chart 11, bottom panel). Risks To Monitor There are a few key risks to our view. First, we treat the current de-escalation in the trade war as temporary. Should Trump get reelected in 2020 for another term, all of the pre-election constraints will be lifted, likely allowing him to get back to his tariff hawkishness. Second, the US economy has already suffered too much damage making it vulnerable to an external shock. Were a black swan to materialize, the dollar would skyrocket putting our industrials view offside. Finally, should the Chinese government miscalculate the amount of stimulus required to reignite their economy, US industrials will again be among the first ones to suffer the consequences via the final-demand link. Put simply, any combination of these risks would slay animal spirits and postpone capex-led US industrials sector recovery. Bottom Line: Increasing chances of a rebound in the ISM manufacturing PMI coupled with green shoots in the EM, expectations for a weaker US dollar and sound industry level data, argue for an above benchmark allocation in the S&P industrials index. Please stay tuned for an upcoming Special Report on how to position within the industrials complex. Arseniy Urazov Research Associate ArseniyU@bcaresearch.com