Sectors

An analysis on Ukraine is available below. Highlights A number of liquidity and technical reasons have led us to give benefit of the doubt to the bullish market action and chase this EM rally. We still doubt that the US-China trade truce alone is sufficient to propel a cyclical recovery in global trade and manufacturing. However, it seems the market is operating on a “buy now, ask questions later” principle. Therefore, we are initiating a long position in the EM equity index as of today. Despite the potential for higher EM share prices in absolute terms, we are still reluctant to upgrade EM versus DM stocks. The basis is that EM corporate profits will continue lagging those in DM. Feature We could be in for a replay of the 2012-2014 DM equity rally, where EM stocks rebounded in absolute terms but massively underperformed DM on a relative basis. Chart I-1EM Share Prices: In Absolute Terms And Relative To DM
EM Share Prices: In Absolute Terms And Relative To DM
EM Share Prices: In Absolute Terms And Relative To DM
EM share prices have spiked on the announcement of a trade truce between the US and China. As a result, our buy stop at 1075 on the EM MSCI Equity Index has been triggered, and we are initiating a long position in EM stocks as of today (Chart I-1, top panel). That said, we are still reluctant to upgrade EM versus DM stocks. Regardless of the direction of the market (bull, bear or sideways), EM share prices will likely underperform the global equity benchmark. As we discussed in our report, the primary risk to our view has been that EM share prices get pulled higher as a result of rallying DM markets. Nevertheless, our fundamental assessment remains that EM corporate profits will lag those in DM, heralding EM relative equity underperformance. In fact, we could be in a replay of the 2012-2014 DM equity rally where EM stocks massively underperformed (Chart I-1, bottom panel), as we elaborated in our November 28 report. In this report, we review the indicators that support a bullish stance, the ones that are inconclusive and those that are not confirming the current rally in China-plays in general and EM risk assets in particular. Bullish Liquidity And Technical Settings The following points have led us to give benefit of the doubt to recent market action and to chase this rally: The global liquidity backdrop appears to be conducive for higher share prices. Global narrow and broad money growth have accelerated (Chart I-2). That said, a caveat is in order: These money measures do not always strongly correlate with both global share prices and the global business cycle. There are numerous times when they gave a false signal or were too early or late at turning points. Chart I-2Global Narrow And Broad Money: A Useful But Not Always Reliable Indicator
Global Narrow And Broad Money: A Useful But Not Always Reliable Indicator
Global Narrow And Broad Money: A Useful But Not Always Reliable Indicator
The technical profile of EM equities is rather bullish. As shown on the top panel of Chart I-1 on page 1, EM share prices have found a support at their six-year moving average. When a market fails to break down below its long-term technical support line, odds are that a major bottom has been reached, and the path of the least resistance is up. The reason we look at these long-term (multi-year) moving averages is because they have historically worked very well for key markets like the S&P 500 and 10-year US Treasury bond yields (Chart I-3A & I-3B). Chart I-3AThe Reason Why We Use Multi-Year Moving Averages
The Reason Why We Use Multi-Year Moving Averages
The Reason Why We Use Multi-Year Moving Averages
Chart I-3BThe Reason Why We Use Multi-Year Moving Averages
The Reason Why We Use Multi-Year Moving Averages
The Reason Why We Use Multi-Year Moving Averages
As another positive development, both EM share prices in local currency terms and the EM equity total return index in US dollar terms have bounced from their three-year moving averages (Chart I-4). Chart I-4A Bullish Chart Formation For EM Equities
A Bullish Chart Formation For EM Equities
A Bullish Chart Formation For EM Equities
In addition, when a market does not drop below its previous top, this creates a bullish chart configuration (Chart I-4). This seems to be the case with EM share prices currently. Bottom Line: A number of liquidity and technical reasons have led us to give benefit of the doubt to the bullish market action and to chase this rally. Inconclusive Indicators It is rare that all types of indicators – directional market, business cycle, valuation and technical – all line up together to convey the same investment recommendation. Below we present the market indicators and signals that we have been watching to get confirmation of sustainability in the bull market in EM risk assets, commodities and global cyclical equity sectors. They are still inconclusive: The US broad trade-weighted dollar has recently sold off, but it has not broken down technically (Chart I-5). A decisive relapse below its 200-day moving average will signify that the greenback has entered a major bear market. The latter would be consistent with a sustainable and extended bull market in EM risk assets, commodities and global cyclical equity sectors. Chart I-5The US Dollar Has Fallen But Not Broken Down
The US Dollar Has Fallen But Not Broken Down
The US Dollar Has Fallen But Not Broken Down
Chart I-6Indecisive Signals From Commodities And Commodity Currencies
bca.ems_wr_2019_12_19_s1_c6
bca.ems_wr_2019_12_19_s1_c6
Even though copper prices have recently rebounded, they have not yet broken above their three-year moving average (Chart I-6, top panel). The latter can be viewed as the neckline of the head-and-shoulders pattern that has formed in recent years. The same holds true for the overall London Metals Exchange Industrial Metals Price Index, as well as our Risk-On/Safe-Haven currency ratio1 (Chart I-6, middle and bottom panels). Barring a decisive break above their three-year moving averages, the jury is still out on the durability of the rally in commodities prices and EM/China plays. Finally, global industrial share prices and US high-beta stocks have advanced to their 2018 highs, but have not yet broken out (Chart I-7). The same is true for the euro area aggregate stock index in local currency terms (Chart I-8). A decisive breakout above these levels will confirm that global equities in general and cyclical segments in particular are in an enduring bull market. Chart I-7Decisive Breakouts Here Are Needed To Confirm The EM Rally
Decisive Breakouts Here Are Needed To Confirm The EM Rally
Decisive Breakouts Here Are Needed To Confirm The EM Rally
Chart I-8European Share Prices Are At A Critical Juncture
European Share Prices Are At A Critical Juncture
European Share Prices Are At A Critical Juncture
Bottom Line: Several cyclical and high-beta segments of global financial markets are at a critical juncture. A decisive breakout from these key technical levels is required for us to uphold that EM risk assets and global cyclical plays are in a medium-term bull market. The Eye Of The Storm? There are a number of leading indicators and market signals that do not corroborate the common narrative of a sustainable improvement in global manufacturing/trade in general and China’s industrial cycle in particular: First, China’s narrow and broad money growth appear to be rolling over (Chart I-9). Notably, the money impulses lead the credit impulse, as illustrated in Chart I-10. Consequently, we expect the credit impulse – which is the main indicator currently portraying a revival in the Chinese economy as well as in the global business cycle – to roll over in early 2020. Chart I-9China: Narrow And Broad Money Growth Are Rolling Over
bca.ems_wr_2019_12_19_s1_c9
bca.ems_wr_2019_12_19_s1_c9
Chart I-10China: Money Impulses Are Coincident Or Lead Credit Impulse
bca.ems_wr_2019_12_19_s1_c10
bca.ems_wr_2019_12_19_s1_c10
This entails that the recent tentative improvements in China’s manufacturing, its imports and global trade will not be sustained going forward. Crucially, China’s narrow money (M1) growth point to the lack of a cyclical upturn in EM corporate profits in H1 2020 (Chart I-11). In short, EM listed companies’ profit growth rate stabilizing at around -10% is not a recovery. Second, government bond yields in both China and Korea are not corroborating a revival in their respective business cycles (Chart I-12). Chart I-11EM Corporate Profit Growth To Remain Negative In H1 2020
bca.ems_wr_2019_12_19_s1_c11
bca.ems_wr_2019_12_19_s1_c11
Chart I-12Asian Rates Are Not Confirming A Recovery
Asian Rates Are Not Confirming A Recovery
Asian Rates Are Not Confirming A Recovery
Chinese onshore interest rates have been a reliable compass for both its business cycle as well as EM share prices and currencies as we illustrated in Chart 15 of the November 28 report. For now, the mainland fixed-income market is not predicting an upturn in China’s industrial economy (Chart I-12, top panel). In Korea, exports account for 40% of GDP. Hence, without a considerable export recovery, there cannot be a business cycle revival in Korea. In brief, the latest relapse in local bond yields could be sending a downbeat signal for global trade (Chart I-12, bottom panel). Third, the four-month rise in the Chinese Caixin manufacturing PMI can be partially explained by front-running production and shipments of smartphones, laptops, computers and other electronics ahead of the December 15 round of US tariffs on imports from China. Right after President Trump announced these tariffs in the summer, businesses likely did not take a chance to wait and see. In fact, whether or not these tariffs would have come into effect was unknown till December 13. Manufacturers and US importers of these electronic goods initiated orders, produced and shipped these goods to the US ahead of December 15. Chart I-13Caixin And Taiwanese PMIs Benefited From Front Running
Caixin And Taiwanese PMIs Benefited From Front Running
Caixin And Taiwanese PMIs Benefited From Front Running
Given the focus on that particular round of tariffs was electronics, producers of these goods got a temporary but notable boost from such front-running. Smartphone and electronics manufacturers and their suppliers are predominantly located in Shenzhen and Taiwan. The Caixin manufacturing PMI is a survey of 500 companies, many of which are private enterprises located in Shenzhen. Not surprisingly, the Caixin manufacturing PMI index often fluctuates with Taiwan’s electronics and optical PMI (Chart I-13). In brief, there has been meaningful improvement in China’s and Taiwan’s tech manufacturing. Yet it can be attributed to front-running of production and shipments of electronic products to the US ahead of the December 15 tariff deadline as well as stockpiling of semiconductors by China. The odds are that these measures of manufacturing will slump in early 2020 as the front-running ends. Chart I-14Commodities Prices In China
Commodities Prices In China
Commodities Prices In China
Finally, several commodities prices in China, that troughed in late 2015 ahead of the bottom in global and EM/Chinese equities in early 2016, continue to drift lower or exhibit only a mild uptick. Specifically, these include prices of nickel, steel, iron ore, thermal coal, coke, polyethylene and rubber (Chart I-14). They corroborate that there has been no broad-based amelioration in the mainland’s industrial sector. Bottom Line: In China, narrow and broad money growth has rolled over, onshore interest rates are subsiding and many commodities prices are weak. All of these signify the lack of sustainable growth revival in China in the coming months. Putting It All Together EM risk assets have rallied on the consensus market narrative that the temporary truce between the US and China will lift global growth. We have written at length that China’s domestic demand – not its exports – has been the epicenter of and basis for the global slowdown over the past two years. Without Chinese domestic demand and imports, not exports, staging a material amelioration, global trade and manufacturing are unlikely to experience a cyclical upturn. In short, we doubt that the US-China trade truce is alone sufficient to propel a cyclical recovery in global trade and manufacturing. Yet, when the majority of investors perceive things the same way and act on these perceptions, asset prices can move a lot. We continue to believe that China’s industrial sector, global trade, EM ex-China domestic demand and consequently EM corporate profits will continue to disappoint in the first half of 2020. Nevertheless, we presently concede that we need to give benefit of the doubt to markets. We still doubt that the US-China trade truce alone is sufficient to propel a cyclical recovery in global trade and manufacturing. It could be that the EM equity and currency market rallies are not driven by their fundamentals – i.e., corporate profits/exports do not matter. However, it is rather possible that this rally is only stoked by the worst-kept secret in the investment industry: the search for yield. If that is the case, then there is no dichotomy between our fundamental thesis – that EM/China profits/growth will disappoint in H1 2020 – and the rally in EM markets. It seems the market is operating on a “buy now, ask questions later” principle. We had thought that the ongoing and enduring contraction in EM corporate profits (please refer to Chart I-11 on page 8) amid various structural malaises would overwhelm the impact of the global search for yield. However, it seems the market is operating on a “buy now, ask questions later” principle. Overall, we are initiating a long position in the EM equity index as of today. Provided the high uncertainty over the outlook, we are also instituting a stop point at 1050 for the MSCI EM equity index, 5% below its current level. For global equity investors, we continue recommending favoring DM over EM stocks. Finally, our country equity overweights are Korea, Thailand, Russia, central Europe, Pakistan, Vietnam and Mexico. A basket of these bourses is likely to outperform the EM equity benchmark in any market scenario in terms of EM absolute share price performance. We have been and remain neutral on Chinese, Indian, Taiwanese and Brazilian equities. As always, our list of overweight, underweight and market weight recommendations for EM equities, local and US dollar government bonds and currencies are available at the end of our report on pages 17-18 and on our website. Arthur Budaghyan Chief Emerging Markets Strategist arthurb@bcaresearch.com Ukraine: Buy Local Currency Bonds EM fixed-income investors should buy Ukraine local currency government bonds as well as overweight Ukraine sovereign credit within an EM credit portfolio. The exchange rate is the key for EM fixed-income investors. The Ukrainian hryvnia will be supported by high real interest rates, improving public debt and balance of payment dynamics, as well as abating geopolitical risks. In turn, a stable currency will keep inflation at bay. In such an environment, investors should favor local currency government bonds, as local interest rates will continue falling. Chart II-1Inflation Will Fall Further
Inflation Will Fall Further
Inflation Will Fall Further
In turn, a stable currency will keep inflation at bay (Chart II-1). In such an environment, investors should favor local currency government bonds, as local interest rates will continue falling. The primary risk of owning Ukrainian domestic bonds is a major depreciation in the hryvnia stemming from a risk-off phase in EM. However, as a periphery country, Ukraine’s financial markets might not correlate with their EM peers. Besides, these bonds offer high carry, which protects them against moderate currency depreciation. Overall, the case for buying Ukraine local currency government bonds is based on the following: First, Ukraine satisfies the two prerequisites for public debt sustainability, namely (1) it runs a robust primary fiscal surplus and/or (2) the government’s borrowing costs are below nominal GDP growth. The public debt-to-GDP ratio stands at 56% and will continue to fall so long as the above two conditions are satisfied. The primary consolidated fiscal surplus currently amounts to 1.8% of GDP (Chart II-2). The recently approved 2020 budget projects the primary surplus to be above 1% of GDP and the overall fiscal deficit to be close to 2% of GDP. Local currency interest rates are below nominal GDP growth (Chart II-3). In addition, public debt servicing is at 3.2% and 9% as a share of GDP and total government expenditures, respectively. According to the new budget, the government plans to use close to 12% of total spending for debt repayments in 2020. This will further help reduce the public debt load. Chart II-2A Healthy Fiscal Position
A Healthy Fiscal Position
A Healthy Fiscal Position
Chart II-3Interest Rates Are Below Nominal GDP Growth And Are Falling
Interest Rates Are Below Nominal GDP Growth And Are Falling
Interest Rates Are Below Nominal GDP Growth And Are Falling
Second, the central bank has more scope to cut interest rates because various measures of inflation will continue falling. Real (adjusted for inflation) interest rates are still very elevated. In particular, the prime lending rate is at 17% for companies and 35% for households, both in nominal terms. Provided core inflation is running at 6%, lending rates are extremely high in real terms. Not surprisingly, narrow and broad money growth are sluggish (Chart II-4). Commercial banks are undergoing major balance sheet deleveraging: their asset growth is in the low single digits in nominal terms, while their value is dropping relative to nominal GDP (Chart II-5). Chart II-4Money Growth Is Sluggish
Money Growth Is Sluggish
Money Growth Is Sluggish
Chart II-5Deleveraging In The Banking Sector
Deleveraging In The Banking Sector
Deleveraging In The Banking Sector
Meanwhile, tighter regulations are forcing banks to recognize bad assets and boost their capital. This has led to a sharp drop in the number of registered banks. Such a structural overhaul of the banking system is cyclically deflationary and warrants lower interest rates. Critically, these reforms are a positive for the exchange rate in the long run. Third, receding foreign funding pressures are helping the balance of payments dynamics and are supportive for the currency. Ukrainian exports have been outperforming global exports since 2017 (Chart II-6). Agricultural exports – which represent 40% of total exports – are an important source of foreign currency revenue for the country. Chart II-6Ukraine Exports Are Outperforming Global Trade
Ukraine Exports Are Outperforming Global Trade
Ukraine Exports Are Outperforming Global Trade
Chart II-7Tight Fiscal And Monetary Policies Are Good For The Current Account Balance
Tight Fiscal And Monetary Policies Are Good For The Current Account Balance
Tight Fiscal And Monetary Policies Are Good For The Current Account Balance
The current account deficit has been narrowing due to slowing domestic demand, arising from tight fiscal and monetary policies (Chart II-7). Foreign ownership of local currency government bonds is $4.6 billion and it makes only 12% of total outstanding amount. Consequently, risk of major foreign portfolio capital outflows due to a risk-off phase in global markets is low. Lastly, Ukraine’s foreign debt obligations – the sum of short-term claims, interest payment and amortization – have been declining and are presently well covered by exports. They comprise 34% of total exports. Finally, geopolitical risks will continue to subside over the coming months. Peace talks between Ukraine and Russia will continue. Importantly, two sets of constraints could force Ukraine and Russia towards resolving the conflict. Specifically: Russia is constrained by its commitment to be a reliable gas supplier to the EU. Half of its gas export capacity passes through Ukraine. European demand for Russian gas is falling and Gazprom gas revenues are decelerating. Cutting transit of gas through Ukraine could now severely jeopardize Russia’s relations with Europe. Therefore, as much as Europe is dependent on Russian gas, Russia is as dependent on European demand for its natural gas. The EU’s support for Ukraine is contingent on reliable transits of Russian gas into EU countries. As such, President Zelensky is under pressure from Europe to assure transmission of Russian gas to Europe. This has led Zelensky into opening a dialogue with Russia and motivated him to seek a new gas transit deal with Gazprom. Given President Zelensky’s high popularity at home, he has political capital to pursue a rapprochement with Russia and attempt to find a resolution to end the conflict in the Donbass. All of these developments have been, and will continue to be, positively perceived by international investors, sustaining the recent stampede into Ukraine’s fixed-income markets. Investment Recommendation We recommend investors purchase 5-year local currency government bonds currently yielding 12%. EM fixed-income investors should also consider overweighting US dollar sovereign bonds in an EM credit portfolio on the back of improving public debt and balance of payments dynamics. Andrija Vesic Research Analyst andrijav@bcaresearch.com Footnotes 1 The Risk-On/Safe-Haven currency ratio is the average of high-beta commodity currencies such as the CAD, AUD, NZD, BRL, CLP and ZAR total return (including carry) indices relative to the average of JPY and CHF total returns (including carry). This ratio is dollar-agnostic. Equities Recommendations Currencies, Credit And Fixed-Income Recommendations
Investors are increasingly looking at allocating assets based on environmental, social, and governance (ESG) considerations, and this theme has the potential to become a big trend in the 2020s. While there are a few ESG related ETFs, we would rather…
2020 High-Conviction Calls: S&P Banks
2020 High-Conviction Calls: S&P Banks
Overweight The expected price of credit, still pristine credit quality, and a looming reacceleration in credit growth all argue for including the S&P banks index in our high-conviction overweight list. Banks stocks troughed in mid-August, sniffing out a sell-off in the bond market. As the bond sell-off gained steam, the bank outperformance phase also caught on fire. BCA’s view for next year calls for a 50-75bps selloff in the 10-year Treasury yield, further boosting the allure of bank equities. Beyond the rising price of credit, credit growth is another key industry profit driver. Importantly, the latest Fed Senior Loan Officer Survey painted a bright picture on both the demand and supply of credit. In more detail, bankers reported that a rising number of credit categories reversed course and demand for loans slingshot higher. The upshot is that bank credit growth will likely reaccelerate in the first half of 2020. Finally, credit quality, the third key bank profit driver, is also emitting a positive signal. While a few loan categories have deteriorated recently in absolute terms, as percentage of loans outstanding, credit quality remains pristine. Despite all this enticing news, bank valuations remain anchored near rock bottom levels and a resurgent ROE is signaling that there is a long runway ahead for relative bank valuation. The ticker symbols for the stocks in this index are: BLBG: S5BANKX – WFC, JPM, BAC, C, USB, PNC, BBT, STI, MTB, FITB, CFG, RF, KEY, HBAN, CMA, ZION, PBCT, SIVB, FRC.
Feature The purpose of this Special Report is to identify and provoke a healthy debate on the prevailing investment themes for the 2020s and to speculate on what the key US sector beneficiaries and likely losers may be. Every decade a dominant theme captures investors’ imaginations and morphs into a bubble. Massive speculation typically propels the relevant asset class into the stratosphere as investors extrapolate the good times far into the future and go on a buying frenzy. Chart 1 shows previous manic markets starting with the Nifty Fifty, gold bullion, the Nikkei 225, the NASDAQ 100, crude oil and most recently the FAANGs. Chart 1Manias: An Historical Roadmap
Manias: An Historical Roadmap
Manias: An Historical Roadmap
What will be the dominant themes of the next decade? How should investors capitalize on some of these big trends? The purpose of this Special Report is to identify and provoke a healthy debate on the prevailing investment themes for the 2020s and to speculate on what the key US sector beneficiaries and likely losers may be. Theme #1: De-Globalization Picks Up Steam The first investment theme for the upcoming decade is the “apex of globalization” or “de-globalization”. We have written about this theme extensively at BCA Research and it is the mega-theme of our sister Geopolitical Strategy (GPS) service. Odds are high that countries will continue looking inward as the US adopts a more aggressive trade policy, China’s trend growth slows, and US-China strategic tensions intensify. The three pillars of globalization are the free movement of goods, capital, and people across national borders. We expect to see marginally less of each in the future. Chart 2 shows that we are at the conclusion of a period of tranquility. Pax Americana underpinned globalization as much as Pax Britannica before it. The US is in a relative decline after decades of geopolitical stability allowed countries like China to rise to “great power” status and rivals like Russia to recover from the chaos of the 1990s. Chart 2De-globalization Has Commenced
De-globalization Has Commenced
De-globalization Has Commenced
De-globalization has become the consensus since the election of Donald Trump. But Trump is not the prophet of de-globalization; he is its acolyte. Globalization is ending because of structural factors, not cyclical ones. And its decline was pre-written into its “source code.” Three factors stand at the center of this assessment, outlined in our 2014 Special Report, “The Apex Of Globalization – All Downhill From Here”: multipolarity, populism and protectionism. Events have since confirmed this view. The three pillars of globalization are the free movement of goods, capital, and people across national borders. We expect to see marginally less of each in the future. Investment Implication #1: Profit Margin Peak The most profound and provocative investment implication from de-globalization is that SPX profit margins have peaked and will likely come under intense pressure, especially for US conglomerates that – on a relative basis to international peers – most enthusiastically embraced globalization. Reconstructed S&P 500 profits and sales data date back to the late-1920s. Historically, corporate profit margins and globalization (depicted as global trade as a percentage of GDP) have been positively correlated (Chart 3). Chart 3Profit Margin Trouble
Profit Margin Trouble
Profit Margin Trouble
As countries are more outward looking, trade flourishes and openness to trade allows the free flow of capital to take advantage of profit-maximizing projects. Following the Great Recession and similar to the Great Depression, trade has suffered and trade barriers have risen. The Sino-American trade war has accelerated the inward movement of countries, including Korea and Japan, and has had negative knock-on effects on trade as evidenced by the now two-year old global growth deceleration. China’s response to President Trump’s election was to redouble its pursuit of economic self-sufficiency, which meant a crackdown on corporate debt and a fiscal boost to household consumption. Trump’s tariffs then damaged sentiment and trade between the two countries. Any deal reached prior to the 2020 US election will remain in doubt among global investors. The longer the trade war remains unresolved, the deeper the cracks will be in the foundations of the global trading system. Such a backdrop is negative for profit margins, as inward looking countries prevent capital from being allocated most efficiently. Moreover, the uprooting of supply chains due to the trade war hurts margins and the redeployment of equipment in different jurisdictions will do the same at a time when final demand is suffering a setback. In addition, rising profit margins are synonymous with wealth accruing to the top 1% of US families and vice versa. This relationship dates back to the late-1920s, as far back as our dataset goes. Using Piketty and Saez data, which exclude capital gains, it is clear that profit margin expansion exacerbates income inequality (top panel, Chart 4). Chart 4Heightened Risk Of Wealth Re-distribution
Heightened Risk Of Wealth Re-distribution
Heightened Risk Of Wealth Re-distribution
Expanding margins lead to higher profits. Because families at the top of the income distribution are more often than not business owners, income disparities are the widest when margins are in overshoot territory. Eventually this income chasm comes to a head and generates political discontent. Populism has emerged on both the right and left wings of the US political spectrum – and since the rise of Trump, even Republicans complain about inequality and the excesses of “corporate welfare” and laissez-faire capitalism. Because inequality is extreme – relative to America’s developed peers – and political forces are mobilizing against it, the probability of wealth re-distribution is rising in the coming decades (middle panel, Chart 4). Labor’s share of national income has nowhere to go but higher in coming years and that is negative for profit margins, ceteris paribus (bottom panel, Chart 4). Drilling beneath the surface, the three secular US equity sector/factor implications of the apex of globalization paradigm shift are: prefer small caps over large caps prefer value over growth overweight the pure-play BCA Defense Index Investment Implication #2: Small Is Beautiful While a small cap bias is contrary to the cyclical US Equity Strategy view of preferring large caps to small caps, the issue is timing: the small cap preference is a secular view with a time horizon that spans the next decade. The small versus large cap share price ratio’s ebbs and flows persist over long cycles. Small caps outshined large caps uninterruptedly from 1999 to 2010. Since then large caps have had the upper hand (Chart 5). Were the apex of globalization theme to gain traction in the 2020s, small caps should reclaim the lead from large caps, especially in the wake of the next US recession. Similar to the death of the global banking model, companies with global footprints will suffer the most, especially compared with domestically focused outfits. One way to explore this theme is via domestic versus global sector preference. But a more investable way to position for this sea change, is to buy small caps (or microcaps) at the expense of large caps (or mega caps). Small caps are traditionally domestically geared compared with large caps that have significantly more foreign sales exposure. Chart 5It’s A Small World After All
It’s A Small World After All
It’s A Small World After All
The closest ETF ticker symbols resembling this trade is long IWM:US/short SPY:US. Investment Implication #3: Buy Value At The Expense Of Growth Similar to the size bias, the style bias also moves in secular ways. Value outperformed growth from the dot com bust until the GFC. Since then growth has crushed value, even temporarily breaking below the year 2000 relative trough. This breakneck pace of appreciation for growth stocks is clearly unsustainable and offers long-term oriented investors a compelling entry point near two standard deviations below the historical mean (Chart 6). Chart 6Value Has The Upper Hand Versus Growth
Value Has The Upper Hand Versus Growth
Value Has The Upper Hand Versus Growth
Financials populate value indexes, a similarity with small cap outfits. Traditionally, financials are a domestically focused sector with export exposure registering at half of the S&P’s average 40% level of internationally sourced revenues. On the flip side, tech stocks sit atop the growth table and they garner 60% of their revenue from abroad. This value over growth style preference will pay handsome dividends if the de-globalization theme becomes more main stream as countries become more hawkish on trade and the Sino-American war continues to erect barriers to trade that took decades to lift. The caveat? If President Trump strikes a short-term deal with China ahead of the 2020 election, the de-globalization theme will suffer a setback. But our geopolitical strategists expect a ceasefire at best, not a durable deal, and also expect the trade war to resume in some way, shape or form in 2021-22, regardless of the outcome of the US election. The closest ETF ticker symbols resembling this trade is long IVE:US/short IVW:US. Investment Implication #4: Defense Fortress One final long-term playable investment idea from the apex of globalization is a structural bull market in defense stocks (Chart 7). Our October 2016 “Brothers In Arms” Special Report drew parallels with the late nineteenth century period of European rearmament, and the American and Soviet arms race of the 1960s. These movements were greatly beneficial to the aerospace and defense industry. Currently, the move by several countries to adopt more independent foreign policies, i.e. to move away from collaboration and cooperation toward isolationism and self-sufficiency, entails an accompanying arms race. Chart 7Stick With Pure-play Defense Stocks
Stick With Pure-play Defense Stocks
Stick With Pure-play Defense Stocks
Table 1
Top US Sector Investment Ideas For The Next Decade
Top US Sector Investment Ideas For The Next Decade
China’s challenge to the regional political status quo motivates a boost to defense spending globally. In fact SIPRI data on global military spending by 2030 (Table 1) increases our conviction that this trade will succeed on a five-to-ten year horizon. Beyond the global arms race, two additional forces are at work underpinning pure-play defense contractors. A global space race with China, India and the US wanting to have manned missions to the moon, and the rise of global cybersecurity breaches. Defense companies are levered to both of these secular forces and should be prime sales and profit beneficiaries to rising space budgets and increasing cybersecurity combat budgets. The ticker symbols for the stocks in the pure-play BCA defense index are: LMT, RTN, NOC, GD, HII, AJRD, BWXT, CW, MRCY. Theme #2: Tech Sector Regulation, US Enacts Privacy Laws The second long-term geopolitical theme that we are exploring is the regulatory or “stroke of pen” risk that is rising on FAANG stocks – Facebook, Apple, Amazon, Netflix, and Google. These companies were this decade’s undisputed stock market winners. The US anti-trust regulatory framework was designed to curb broad anti-competitive actions of trusts. As Lina Khan discusses in her seminal article, these actions “include not only cost but also product quality, variety, and innovation.” However, through subsequent regulatory evolution, the Chicago School has focused the US anti-trust process on consumer welfare and prices. If President Reagan and the courts could change how anti-trust laws were administered in the 1980s, so too can future administrations and courts. Today the US Congress, on both sides of the aisle, is looking into regulatory tightening, while the judicial system will take longer to change its approach. Moreover, the impetus for tougher anti-trust policy is here. It comes from a long period of slow growth, income inequality, and economic volatility – such as in the 1870s-80s. This was certainly the case for Standard Oil in 1911, which became a nation-wide boogeyman despite most of its transgressions occurring in the farm belt states. Today, income inequality is a prominent political theme and source of consumer discontent. A narrative is emerging – which will be super-charged during the next recession – that growth has been unequally distributed between the old economy and the twenty-first century technology leaders. With regard to privacy, the news is equally grim for large tech outfits. The EU General Data Protection Regulation (GDPR), which came into force on May 2018, imposes compliance burdens on any company handling user data. In the US, California has signed its own version of the law – the Consumer Privacy Act – which will go into effect in January 2020. These laws give consumers the right to know what information companies are collecting about them and what companies that data is being shared with. They also allow consumers to ask technology companies to delete their data or not to sell it. While tech companies are likely to fight the new California law, and the US court system is a source of uncertainty, we believe the writing is on the wall. The EU is by some measures the largest consumer market on the planet. California is certainly the largest US market of the states. It is unlikely that the momentum behind consumer protection will change, especially with the EU and California taking the lead. The odds of a federal privacy law, following in the footsteps of the Consumer Privacy Act, are also rising. Investment Implication #5: Shun Interactive Media & Services Stocks These risks introduce a severe overhang for FAANG stocks. We are especially worried for the S&P interactive media & services index that includes GOOGL and FB. Tack on the threat of federal regulation and this represents another major headwind for profits and net profit margins that are extremely elevated for these near monopolies. Given that advertising revenue is crucial to the business model of social media companies (GOOGL and FB included), a significant uptick in privacy regulation will likely hurt their bottom line. With regard to profit margins, tech stocks in general command a profit margin twice as high as the SPX. Specifically, FB and GOOGL enjoy margins that are 500 basis points higher than the broad tech sector (Chart 8)! This is unsustainable and will likely serve as easy prey for policymakers. Our view does not necessarily call for breaking up these monopolies. The US will have to weigh the economic consequences of anti-trust policy in a context of multipolarity in which China’s national tech champions are emerging to compete with American companies for global market share. Nevertheless increased regulation is inevitable and some forced sales of crown jewel assets may take place. Moreover, the threat of a breakup will lurk in the background, creating uncertainty until key legislative and judicial battles have already been fought. That will take years. Finally, we doubt the tech sector will be left alone to “self-regulate” its incumbents and negotiate a price on consumers’ privacy. More likely, a new privacy law will loom overhead, serving as a negative catalyst for profit growth. Uncertainty will weigh on the S&P interactive media & services relative performance. Chart 8Regulation Will Squeeze Tech Margins
Regulation Will Squeeze Tech Margins
Regulation Will Squeeze Tech Margins
The ticker symbols to short/underweight the S&P interactive media & services index are an equally weighted basket of GOOGL and FB (they command a 98% market cap weight in the index). Theme #3: SaaS, Artificial Intelligence, Augmented Reality And Autonomous Driving Are Not Fads The third big theme that will even outlive the upcoming decade is the proliferation of software as a service (SaaS). The move to cloud computing and SaaS, the wider adoption of artificial intelligence, machine learning, autonomous driving and augmented reality are not fads, but enjoy a secular growth profile. In the grander scheme of things today’s world is surrounded by software. Millions of lines of code go even into gasoline powered automobiles, let alone electric vehicles. Autonomous driving is synonymous with software, the Internet of Things (IoT) needs software, the space race depends on software, modern manufacturing and software are closely intertwined, phone calls for quite some time have been a software solution, and the list goes on and on. This tidal effect is hard to reverse and is already embedded in workflows across industries. Opportunities to penetrate health care and financial services more deeply remain unexplored and it is difficult to envision another competing industry unseating “king software”. These secular trends are not only productivity enhancing, but will also most likely prove recession-proof. When growth is scarce investors flock to any source of growth they can come by and we are foreseeing that when the next recession arrives, investors will likely seek shelter in pure play SaaS firms. Investment Implication #6: Software Is Eating The World Buying software stocks for the long haul seems like a bulletproof investment idea. But the recent stellar performance of software stocks that has moved valuations to overshoot territory. Our recommended strategy is to buy or add software stock exposure on any weakness with a 10-year investment time horizon. All of these secular trends have pushed capital outlays on software into a structural uptrend. Software related capex is not only garnering a larger slice of the tech spending budgets but also of the overall capex pie. If it were not for software capex, the contraction in non-residential investment in recent quarters would have been more severe (Chart 9). Private sector software capex is near all-time highs as a share of total outlays. Government investment in software is also reaccelerating at the fastest pace since the tech bubble. When productivity gains are anemic, both the business and government sectors resort to software upgrades in order to boost productivity. Cyber security is another more recent source of software related demand as governments around the globe are taking such risks extremely seriously (bottom panel, Chart 9). Given this upbeat demand backdrop and ongoing equity retirement, software stocks are primed to grow into their pricey valuations. Chart 9Software Is Eating The World
Software Is Eating The World
Software Is Eating The World
Finally, this long-term trade will also serve as a hedge to the short/underweight position we recommend in the S&P interactive media & services index. The closest ETF ticker symbol resembling the S&P software index is IGV:US. Theme #4: Millennials Already Are The Largest Cohort And Will Dominate Spending The fourth long-term theme we anticipate will gain traction in the 2020s is the demographic rise of the Millennial generation. Much has been made of preparing for the arrival of the Millennial generation, accompanied by well-worn stereotypes of general "failure to launch" as they reach adulthood. However, "arrival" is a misnomer as this age cohort is already the largest and "failure" is simply untrue. According to the U.S. Census Bureau, Millennials are the US’s largest living generation. Millennials (or Echo Boomers) defined as people aged 18 to 37 (born 1982 to 2000), now number more than 80mn and represent more than one quarter of the US’s population. Baby Boomers (born 1946 to 1964) number about 75mn. Stealthily becoming the largest age group in the US over the last few years, Millennials per-year-birth-rate peaked at 4.3mn in 1990. Surprisingly, the pace matched that of the post-war Baby Boom peak-per-year-birth-rate in 1957 - the per-year average over the period was higher for the Baby Boomers (Chart 10). Chart 10Millennials Are The Largest Cohort
Millennials Are The Largest Cohort
Millennials Are The Largest Cohort
This gap is now set to grow rapidly as the death rate of Baby Boomers accelerates. What is more, the largest one-year age cohort is only 25 years old, thus, Millennials will be the dominant generation for many years. It is unclear how these “kids” will impact the market as they become the most important consumers, borrowers and investors, but make no mistake: this is a seismic shift in economic power and it is here to stay. The Echo Boom is a big, generational demographic wave. A difficult and painful delay has not tempered its looming importance. Finally, this wave of echo-boomers is educated, relatively unburdened by debt (please see BOX in the June 11, 2018 Special Report on demystifying the student debt load as it pertains to Millennials), and as they inevitably “grow up”, form new households and have kids. They will borrow, spend, earn, but not necessarily save and invest to the same extent as the Boomers. And this will be an important long-term theme going forward. Near term we might already be seeing signs of their arrival and firms have begun to pivot accordingly. Investment Implication #7: Buy The BCA Millennials Equity Basket Millennials will boost consumption spending in a number of different ways. The relatively unburdened Millennial cohort will be entering prime home acquisition age soon and this should underpin the long-term prospects of the US housing market and derivative industries. Further, Millennials consume differently from their parents; social media, online shopping and smart phones are not the consumption categories of the Baby Boomers. With this in mind, we have created a basket of ten stocks that we think will be driven over the long term by the demographic rise of the Millennial. We note that these stocks are heavily weighted to the technology and consumer discretionary sectors, which is logical as Millennial consumption habits tend to be discretionary focused and technology-based. Beginning with consumer discretionary, we are highlighting AMZN, NFLX and SPOT as core holdings in our Millennials basket. AMZN’s heft dwarfs consumer discretionary indexes but it could fall in several categories; the acquisition of Whole Foods makes it a Millennials-focused consumer staples retailer and its cloud computing web services segment is a tech leader. NFLX and SPOT represent the means by which Millennials consume media, by streaming movies and music over the internet. The idea of owning physical media is rapidly becoming an anachronism. The home ownership themes noted in the report above lead us to add HD and LEN to the basket. Millennials are “doers” and are set to be the dominant DIYers in the next few years, making HD a logical choice. LEN, as the nation’s largest home builder, should benefit from the Millennials coming of age into home buyers. We are also adding TSLA to our basket as a lone clean tech-oriented equity. TSLA capitalizes on the increasing shift to clean energy of Millennials (the key reason why no traditional energy companies have a spot in our basket). The technology stocks in our Millennials basket are AAPL, UBER (which replaces FB as of today) and MSFT, together representing more than 9% of the total value of the S&P 500. AAPL’s inclusion in the list is predictable as the leading domestic purveyor of devices on which Millennials consume media content. FB is a predictable holding, with more than half of all Americans being monthly active users, dominated by the Millennial cohort. It has served our basket well since inception, but today we are compelled to remove it and replace it with UBER. UBER is a Millennial favorite and the epitome of the sharing economy. In reality UBER is a logistics company and while it is losing money it is eerily reminiscent of AMZN in its early days. Maybe UBER will dominate all means of transportation and its ease of use will propel it to a mega cap in the coming decade. Our inclusion of MSFT is based on its leadership in cloud computing, a rapidly growing industry. We expect the connectivity and mobile computing demands of Millennials will accelerate. The last stock we are adding to our basket is also the only financial services equity. Though avid consumers, Millennials have shown an aversion to cash, preferring card payment systems, including both debit and credit-based. Accordingly, we are adding the leader in both of these, V, to our Millennials basket (Chart 11). Chart 11Buy BCA’s Millennial Equity Basket
Buy BCA’s Millennial Equity Basket
Buy BCA’s Millennial Equity Basket
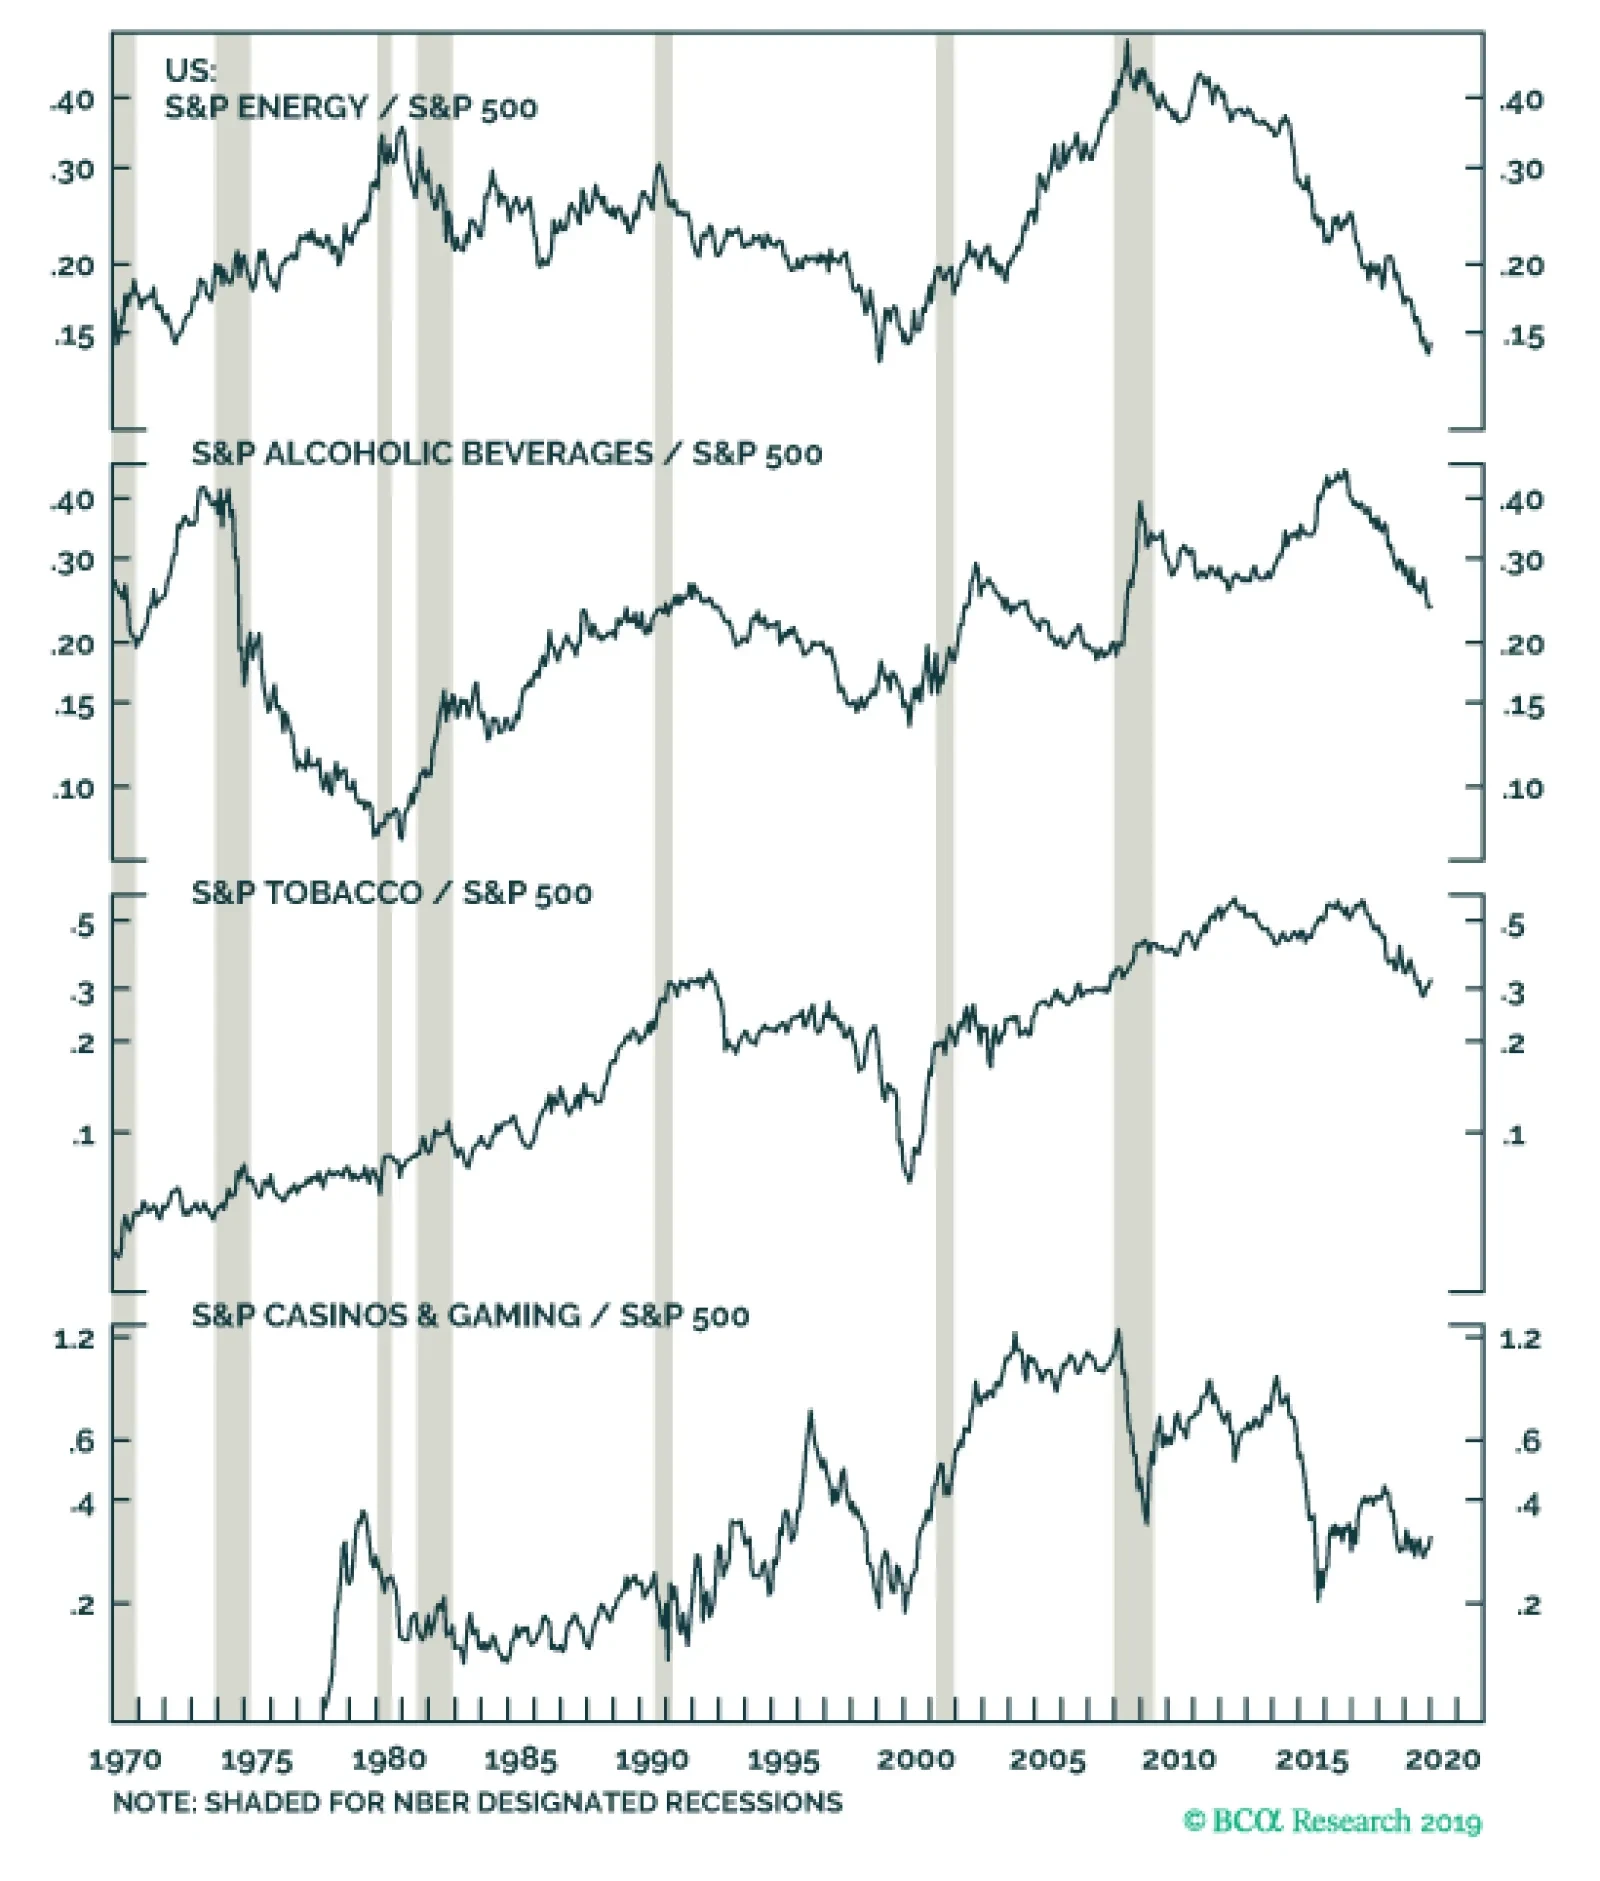
Investors seeking long term exposure to stocks lifted by the supremacy of the Millennial generation should own our Millennial basket (AAPL, AMZN, UBER, HD, LEN, MSFT, NFLX, SPOT, TSLA, V). We would not hesitate to add other sharing economy stocks, including Airbnb, to this basket should they become investable in the near future. Theme #5: ESG Becomes Mainstream Investors are increasingly looking at allocating assets based on environmental, social, and governance (ESG) considerations, and this mini-theme has the potential to become a big trend in the 2020s. There are a number of factors that underpin ESG investing. First, Millennials are climate conscious and given that they already are the largest cohort in the US they will not only dominate spending, but also influence election results. Moreover, via social media Millennials can sway public opinion and participate in the ESG conversation. Second, ECB President Christine Lagarde recent speech to the Economic and Monetary Affairs Committee of the European Parliament is a must read.1 If the ECB were to explicitly focus on climate change policy as part of its monetary policy operations then this is a game changer. Green investment financing including “green bonds” could become mainstream. Keep in mind the as reported in the FT “the European Parliament has declared a climate emergency; the new European Commission (EC) has taken office on a promise of an imminent “green new deal”, and Commission president Ursula von der Leyen has vowed to accelerate emissions cuts.” Last Wednesday, the EC released “The European Green Deal” with a pretty aggressive time table. The EC president said “The green deal is Europe’s man on the moon moment” and presented 50 policies slated to get rolled by 2022 to meet revamped climate goals. The implication is that once ESG takes center stage at a number of these institutions it will be easier to become mainstream and propagate the world over. Third, large institutional investors are starting to adopt an ESG mindset, especially pension plans. These investors with trillions of dollars at their disposal can not only disfavor fossil fuel investment, but also undertake investments in “green projects” via private and public equity markets. Banks are also moving in the “greening of finance” direction and given that they are the pipelines of the global plumbing system, swift adoption will go a long way in taking ESG mainstream. Finally, the electric vehicle (EV) proliferation is another key driver on how the ESG theme will play out in the 2020s. As a reminder, in the US 50% of all energy consumption is gasoline related linked to automobiles. While battery technology still has limitations, EV is no longer a fad as the German and Japanese automakers are starting to make inroads on TSLA. These car manufacturers do not want to be left out, especially if this shift toward EV becomes mainstream in the 2020s. The Chinese are not far behind on the EV manufacturing front, however government policy can really become a game changer. If a number of countries and/or California mandate a large share of all new vehicles sold be EV, then the investment implications will be massive. Investment Implication #8: Avoid Fossil Fuels, Gambling, Alcohol And Tobacco… While there are a few ESG related ETFs, we would rather explore this theme’s investment implications of sectors to avoid in the coming decade. We are believers that ESG criteria will continue to gain in importance in institutional investment management decisions. Accordingly, we would tend to avoid ‘sin stocks’, including gambling, tobacco and alcohol; demand for their services is unlikely to decline but investment weightings should mean that share prices will underperform. Further, we think a clean energy shift will mean energy stocks will likely continue to be long-term underperformers (Chart 12). Chart 12Areas To Avoid As ESG Becomes Mainstream
Areas To Avoid As ESG Becomes Mainstream
Areas To Avoid As ESG Becomes Mainstream
Final Thoughts On The US Dollar In this report, we tried to focus on the upcoming decade’s big themes that we deem will play out, and centered recommendations on US equities/sectors. We do not want to neglect some macroeconomic variables that tend to mean revert over time. Specifically, the US dollar, interest rates and most importantly US indebtedness, will also be key drivers of investment theses in the 2020s. Currently, debt is rising faster than nominal GDP growth with the government and non-financial business debt-to-GDP profiles on an unsustainable path (second panel, Chart 13). Granted, the saving grace has been generationally low interest rates as the debt service ratios have fallen (top panel, Chart 13). However, if the four decade bull market in Treasury bonds is over, or may end definitively with the next US recession sometime in the early 2020s, then rising interest rates are the only mechanism to concentrate CEOs’ and politicians’ minds. On the dollar front, Chart 14 highlights the ebbs and flows of the trade-weighted US dollar since it floated in the early-1970s. The DXY index has moved in six-to-ten year bull and bear markets. The most recent trough was during the depths of the Great Recession, while the (tentative?) peak was in late-2016. If history repeats, eventually the dollar will mean revert lower in the 2020s, especially given the fiscal profligacy of the current administration that may continue into 2024, assuming President Trump gets re-elected next November. Chart 13Unsustainable Debt Profiles
Unsustainable Debt Profiles
Unsustainable Debt Profiles
Chart 14Greenback’s Historical Ebbs And Flows
Greenback’s Historical Ebbs And Flows
Greenback’s Historical Ebbs And Flows
The US dollar remains the reserve currency of the world today, but that exorbitant privilege is clearly fraying on the edges as the balance-of-payments dynamics are heading in the wrong direction. Over the next five years, the US Congressional Budget Office (CBO) estimates that the US budget deficit will swell to 4.8% of GDP. Assuming the current account deficit widens a bit then stabilizes (usually happens when global growth improves), this will pin the twin deficits at 8% of GDP. This assumes no recession, which would have the potential to swell the deficit even further. The US saw its twin deficits swell to almost 13% of GDP following the financial crisis, but the difference then was that in the wake of the commodity boom the dollar was cheap (and commodity currencies overvalued). The subsequent shale revolution also greatly cushioned the US trade deficit. Shale productivity remains robust and US output will continue to rise, but the low-hanging fruit has already been plucked. Another dollar-negative force is its expensiveness. By rising 35% since its trough, the USD has sapped the competitiveness of the US manufacturing sector, which is accentuating the American trade deficit outside of the commodity sector. If the ESG trend ends up hurting oil prices, the US current account will follow the widening deficit in manufactured products. Moreover, the US is lagging Europe on the green revolution. Either the US will have to import green technologies, or the US government will have to provide more subsidies to the private sector. Either way, both of these dynamics will hurt the US current account deficit further. Historically, the currency market is the main vehicle to correct such imbalances. Chart 15Twin Deficits Will Weigh On The US Dollar
Twin Deficits Will Weigh On The US Dollar
Twin Deficits Will Weigh On The US Dollar
The apex of globalization will also hurt the greenback. In a world where all the markets are integrated, borrowers in EM nations often use the reserve currency to issue liabilities at a lower cost. This boosts the demand by EM central banks for US dollar reserves to protect domestic banking systems funded in USD. Moreover, some countries like China implement pegs (both official and unofficial) to the US dollar in order to maintain their competitiveness and export their production surpluses to the US. To do so they buy US assets. If the global economy becomes more fragmented and the Sino-US relationship continues to deteriorate structurally as we expect, then these sources of demand for the dollar will recede. Overlay the widening US current account deficit, and you have the perfect recipe for a depreciating trade-weighted US dollar. Finally, the US is likely to experience more inflation than the rest of the world following the next recession. The US economy has a smaller capital stock as a share of GDP than Europe or Japan, and American demographics are much more robust. This means that the neutral rate of interest is higher in the US than in other advanced economies. As a result, the Fed will have an easier time generating inflation by cutting real rates than both the ECB and the BoJ. Higher inflation will ultimately erode the purchasing power of the dollar and prove to be a structurally negative force for the USD. Anastasios Avgeriou US Equity Strategist anastasios@bcaresearch.com Matt Gertken Geopolitical Strategist mattg@bcaresearch.com Marko Papic Chief Strategist, Clocktower Group marko@clocktowergroup.com Chester Ntonifor Foreign Exchange Strategist chestern@bcaresearch.com Mathieu Savary The Bank Credit Analyst mathieu@bcaresearch.com References Please click on the links below to view reports: Peak Margins - October 7, 2019 The Polybius Solution - July 5, 2019 War! What Is It Good For? Global Defense Stocks! - October 31, 2018 The Dollar: Will The U.S. Invoke A "Nuclear" Option? - August 30, 2018 Is The Stock Rally Long In The FAANG? - August 1, 2018 Millennials Are Not Coming Of Age; They Are Already Here - June 11, 2018 Brothers In Arms - October 31, 2016 The End Of The Anglo-Saxon Economy? - April 13, 2016 Apex of Globalization - November 12, 2014 Footnotes 1 https://www.imf.org/en/News/Articles/2019/09/04/sp090419-Opening-Statement-by-Christine-Lagarde-to-ECON-Committee-of-European-Parliament
It appears that the US and China have a “phase one” deal in principle and it is in President Trump’s hands to sign it. This is reminiscent of the G20 meeting in Argentina in early-December 2018, when stocks had a snap 200 point rally that abruptly ended the Monday after a deal was agreed to suspend new trade tariffs, in a typical buy the rumor sell the news fashion. Nevertheless, there are elements of portfolio managers chasing performance into yearend, as we have mentioned in recent research, and the looming Santa rally comes with a hefty multiple tag this year. The chart shows that the S&P 500 is trading north of 18x forward earnings – a handle that, during the current cycle, the market only managed to surpass in the early-2018 exuberant bull run. EPS growth stands at 11% for next year, which implies that the SPX is even more expensive as a double digit EPS growth rate will be almost impossible to attain. At best, we expect 5% profit growth next year, with risks squarely tilted to the downside. Bottom Line: The SPX is in overshoot territory, defying profit fundamentals; the risk/reward trade-off remains poor.
Buy The Rumor Sell The News?
Buy The Rumor Sell The News?
Small Improvements in Rails
Small Improvements in Rails
Underweight – Upgrade Alert Two recent positive developments in railroad operating metrics compel us to put rails on an upgrade alert. Specifically, our operating margin proxy is expanding at a healthy pace (second panel). Further, our core rail shipments diffusion indicator is also predicting that demand for rail freight services is primed to stage a comeback (middle panel). Despite improving operating metrics, the macro picture remains bleak. The ISM manufacturing survey, the CASS freight expenditures index and the most recent roundtable CEO survey are still firing warning shots (fourth panel). Meanwhile, the railroad debt profile remains worrisome, as CEOs have been shunning capex in favor of shareholder friendly activities (bottom panel). Bottom Line: We remain underweight the S&P railroads index, but it is now on our upgrade watch list. The ticker symbols for the stocks in this index are: BLBG: S5RAIL - UNP, CSX, NSC, KSU.
The 2019 UK General Election result offers four possible medium-term outcomes for UK exposed investments: Conservatives win 340 seats or more: This comfortable majority for the Conservatives is medium-term positive for UK exposed investments, as prime minister Johnson would not be dependent on the 20 or so hard Brexit extremists to pass any free trade deal (FTA) through parliament. Albeit the markets are already pricing the Conservatives to win 337-343 seats. Conservatives win 320-340 seats: This marginal majority for the Conservatives is medium-term risky for UK exposed investments, because the hard Brexit extremists would have disproportionate influence and leverage, keeping open the possibility of a hard Brexit on WTO terms after the standstill transition period ends on December 31 2020. Conservatives win 310-320 seats: This ‘marginally hung’ parliament is medium-term risky for UK exposed investments, as it is essentially no change from the current gridlocked parliament. Conservatives win less than 310 seats: This ‘comfortably hung’ parliament is medium-term positive for UK exposed investments, as it creates the possibility of the softest (or no) Brexit under a Labour-led minority government. At the same time, a minority government would be unable to pass its most contentious and supposedly ‘market unfriendly’ policies. If the result is 2. the marginal majority, and the market does not appreciate the risk, then it presents a sell opportunity. Conversely, if the result is 4. the comfortably hung parliament, and the market does not appreciate the upside, then it presents a buy opportunity. Fourth Time Lucky For The UK Pollsters? The 2019 UK General Election is the fourth major UK vote since 2015 in which the UK/EU relationship has featured front and centre. The first was the 2015 General Election, in which then prime minister David Cameron promised a referendum on EU membership, subject to the Conservative party winning an outright parliamentary majority, which it duly did. The second was the subsequent 2016 in/out EU referendum in which the UK voted to leave the EU. The third was the 2017 General Election called by prime minister May to bolster her Brexit negotiating position. But May’s plan backfired. She managed to lose the Conservative majority, her party’s Brexit negotiating position, and ultimately her job. So here we are at the fourth major UK vote in little over four years. Significantly, the pollsters got the 2015, 2016, and 2017 UK votes very wrong. In 2015, they predicted a hung parliament; but the actual outcome was a comfortable majority for the Conservatives, forcing Cameron to deliver his promise of an EU referendum. In the ensuing 2016 referendum, the pollsters predicted a narrow win for remain; the actual outcome was a narrow win for leave. Then in 2017, the pollsters predicted a very healthy vote share win for the Conservatives – and the spread betting markets priced the party to win 364-370 seats in the 650 seat UK parliament; but the actual outcome was 317 seats and a hung parliament – because the pollsters had underestimated the Labour vote by five percentage points. Today, just as in 2017, the pollsters are predicting a healthy vote share win and comfortable parliamentary majority for the Conservatives. At the time of writing (election eve) the spread betting markets are pricing the Conservative party to win 337-343 seats. When the election day exit poll comes out at 10pm UK time, we will get a good idea whether it is fourth time lucky for the pollsters. But irrespective of whether they are right or wrong, the immediate market reaction might still offer some medium-term investment opportunities. The Key Numbers… And Where The Immediate Market Reaction Could Be Wrong The Conservatives need a working majority – because having burnt their bridges with the DUP (Northern Ireland unionists), no other party is likely to support prime minister Johnson’s EU withdrawal agreement. Given that the speaker, deputy speakers, and Sinn Fein (Northern Ireland republicans) do not vote in the UK parliament, and depending on the number of seats that Sinn Fein win, the threshold for a working majority will be around 320 seats. This creates four potential outcomes for the markets: Conservatives win 340 seats or more: This comfortable majority for the Conservatives is medium-term positive for UK exposed investments, as Johnson would not be dependent on the 20 or so hard Brexit extremists to pass any free trade deal (FTA) through parliament. But as noted above, the markets are already pricing the Conservatives to win 337-343 seats. Conservatives win 320-340 seats: This marginal majority for the Conservatives is medium-term risky for UK exposed investments, because the hard Brexit extremists would have disproportionate influence and leverage, keeping open the possibility of a hard Brexit on WTO terms after the standstill transition period ends on December 31 2020. Conservatives win 310-320 seats: This ‘marginally hung’ parliament is medium-term risky for UK exposed investments, as it is essentially no change from the current gridlocked parliament. Conservatives win less than 310 seats: This ‘comfortably hung’ parliament is medium-term benign for UK exposed investments, as it creates the possibility of the softest (or no) Brexit under a Labour-led minority government. At the same time, a minority government would be unable to pass its most contentious and supposedly ‘market unfriendly’ policies. Of these four possibilities, if the immediate market reactions to 2. the marginal majority, or 4. the comfortably hung parliament do not appreciate the risk and upside respectively, then they will create sell and buy opportunities for UK exposed investments. What Are The UK Exposed Investments? The most obvious UK exposed investment is the pound, which is still trading at a near 10 percent discount versus the euro and the dollar, based on the pre-referendum relationship with real interest rate differentials (Chart I-1 and Chart I-2). However, the extent to which that discount can narrow depends on how much worse off (if at all) the UK economy finds itself in its new trading relationships with the EU and the rest of the world compared with full membership of the EU. Chart I-1The Pound Is Cheap Versus The Euro
The Pound Is Cheap Versus The Euro
The Pound Is Cheap Versus The Euro
Chart I-2The Pound Is Cheap Versus The Dollar
The Pound Is Cheap Versus The Dollar
The Pound Is Cheap Versus The Dollar
In this regard, the best outcomes are a rapidly negotiated and maximally-aligned FTA with the EU, or the softest (or no) Brexit. Meaning that the aforementioned possibilities 1. or 4. – a comfortable Conservative win or a comfortably hung parliament – are the best outcomes for the UK economy, and therefore for the pound. To the extent that the Bank of England policymakers recognise this, the same conclusion applies to the direction of UK gilt yields, and therefore inversely to UK gilt prices. Turning to the stock market, the FTSE100 is categorically not a UK exposed investment – because it comprises multinationals with minimal exposure to the UK economy. If anything, the FTSE100 is an anti-UK exposed investment. This is because sales and profits are denominated in international currencies, and if these non-pound currencies weaken versus the pound (meaning the pound strengthens) it weighs down the pound-denominated FTSE100 versus other markets (Chart I-3). In fact, the ‘real’ UK stock market is the more UK focussed FTSE250 (Chart I-4), or the FTSE Small Cap index (Chart I-5). Chart I-3When The Pound Strengthens, The FTSE 100 Underperforms
When The Pound Strengthens, The FTSE 100 Underperforms
When The Pound Strengthens, The FTSE 100 Underperforms
Chart I-4The 'Real' UK Stock Market Is The FTSE 250, Not The FTSE 100
The 'Real' UK Stock Market Is The FTSE 250, Not The FTSE 100
The 'Real' UK Stock Market Is The FTSE 250, Not The FTSE 100
Chart I-5Small Caps Are Exposed To The UK Economy
Small Caps Are Exposed To The UK Economy
Small Caps Are Exposed To The UK Economy
In terms of equity sectors, the least exposed to the UK economy are the multinationals with international currency earnings. As well as the obvious oil and gas, resources, and healthcare sectors, it includes the global banks and clothing and apparel (Chart I-6). Chart I-6Clothing Is Not Exposed To The UK Economy
Clothing Is Not Exposed To The UK Economy
Clothing Is Not Exposed To The UK Economy
The sectors most exposed to the UK economy are the homebuilders (Chart 7), real estate (Chart 8), and general retailers (Chart 9). All of these, plus the FTSE250 and FTSE Small Cap, and of course the pound, can outperform in the medium term in the aforementioned possibilities 1. and 4. – a comfortable win for the Conservatives or a comfortably hung parliament. But they will face pressure in possibilities 2. and 3. – a marginal win for the Conservatives or a marginally hung parliament. Chart I-7Homebuilders Are Exposed To The UK Economy
Homebuilders Are Exposed To The UK Economy
Homebuilders Are Exposed To The UK Economy
Chart I-8Real Estate Is Exposed To The UK Economy
Real Estate Is Exposed To The UK Economy
Real Estate Is Exposed To The UK Economy
Chart I-9General Retailers Are Exposed To The UK Economy
General Retailers Are Exposed To The UK Economy
General Retailers Are Exposed To The UK Economy
Fractal Trading System* This week's recommended trade is long nickel / short gold, the reverse of the successful trade we recommended on October 3. Back then the nickel price had become technically extended due to scares about an Indonesian export ban. And as predicted, the price subsequently collapsed (by 30 percent) to the point where the price has now become technically depressed. Accordingly, this week's recommendation is long nickel / short gold setting a profit target of 10 percent with a symmetrical stop-loss. The rolling 1-year win ratio stands at 64 percent.
A UK Election Special (Again)
A UK Election Special (Again)
When the fractal dimension approaches the lower limit after an investment has been in an established trend it is a potential trigger for a liquidity-triggered trend reversal. Therefore, open a countertrend position. The profit target is a one-third reversal of the preceding 13-week move. Apply a symmetrical stop-loss. Close the position at the profit target or stop-loss. Otherwise close the position after 13 weeks. Use the position size multiple to control risk. The position size will be smaller for more risky positions. * For more details please see the European Investment Strategy Special Report “Fractals, Liquidity & A Trading Model,” dated December 11, 2014, available at eis.bcaresearch.com. Dhaval Joshi Chief European Investment Strategist dhaval@bcaresearch.com Fractal Trading Model
A UK Election Special (Again)
A UK Election Special (Again)
A UK Election Special (Again)
A UK Election Special (Again)
Cyclical Recommendations Structural Recommendations
A UK Election Special (Again)
A UK Election Special (Again)
A UK Election Special (Again)
A UK Election Special (Again)
A UK Election Special (Again)
A UK Election Special (Again)
A UK Election Special (Again)
A UK Election Special (Again)
Trades Closed Trades Asset Performance Currency & Bond Equity Sector Country Equity Indicators Bond Yields Chart II-1Indicators To Watch - Bond Yields
Indicators To Watch - Bond Yields
Indicators To Watch - Bond Yields
Chart II-2Indicators To Watch - Bond Yields
Indicators To Watch - Bond Yields
Indicators To Watch - Bond Yields
Chart II-3Indicators To Watch - Bond Yields
Indicators To Watch - Bond Yields
Indicators To Watch - Bond Yields
Chart II-4Indicators To Watch - Bond Yields
Indicators To Watch - Bond Yields
Indicators To Watch - Bond Yields
Interest Rate Chart II-5Indicators To Watch - Interest Rate Expectations
Indicators To Watch - Interest Rate Expectations
Indicators To Watch - Interest Rate Expectations
Chart II-6Indicators To Watch - Interest Rate Expectations
Indicators To Watch - Interest Rate Expectations
Indicators To Watch - Interest Rate Expectations
Chart II-7Indicators To Watch - Interest Rate Expectations
Indicators To Watch - Interest Rate Expectations
Indicators To Watch - Interest Rate Expectations
Chart II-8Indicators To Watch - Interest Rate Expectations
Indicators To Watch - Interest Rate Expectations
Indicators To Watch - Interest Rate Expectations
SPX Return In Perspective
SPX Return In Perspective
Overweight The handsome year-over-year SPX return will hit a zenith later this month of roughly 35%. However, putting this impressive recovery from last year’s doldrums in perspective is instructive. Tech stocks (including GOOGL and FB) have massively outperformed the SPX (top panel). Within the tech universe, software stocks have in turn trounced the tech sector (top panel). In fact, the SPX return profile excluding tech stocks is eerily similar to the emerging markets that have been global laggards and failed to break out to fresh cycle highs (bottom panel). In other words, returns have been extremely concentrated, and if portfolio managers have missed the software rally, then they have left sizable returns on the table. As a reminder, while we recommend a benchmark allocation on the S&P tech sector, we have been secularly overweight the S&P software index since November 27, 2017, and we are currently up 35 percentage points above and beyond the SPX’s return, since inception. Bottom Line: Stay overweight the S&P software index, but maintain the trailing stop at the 27% return mark since inception. The ticker symbols for the stocks in this index are: BLBG – S5SOFT: MSFT, ADBE, CRM, ORCL, INTU, NOW, ADSK, ANSS, SNPS, CDNS, NLOK, FTNT, CTXS.
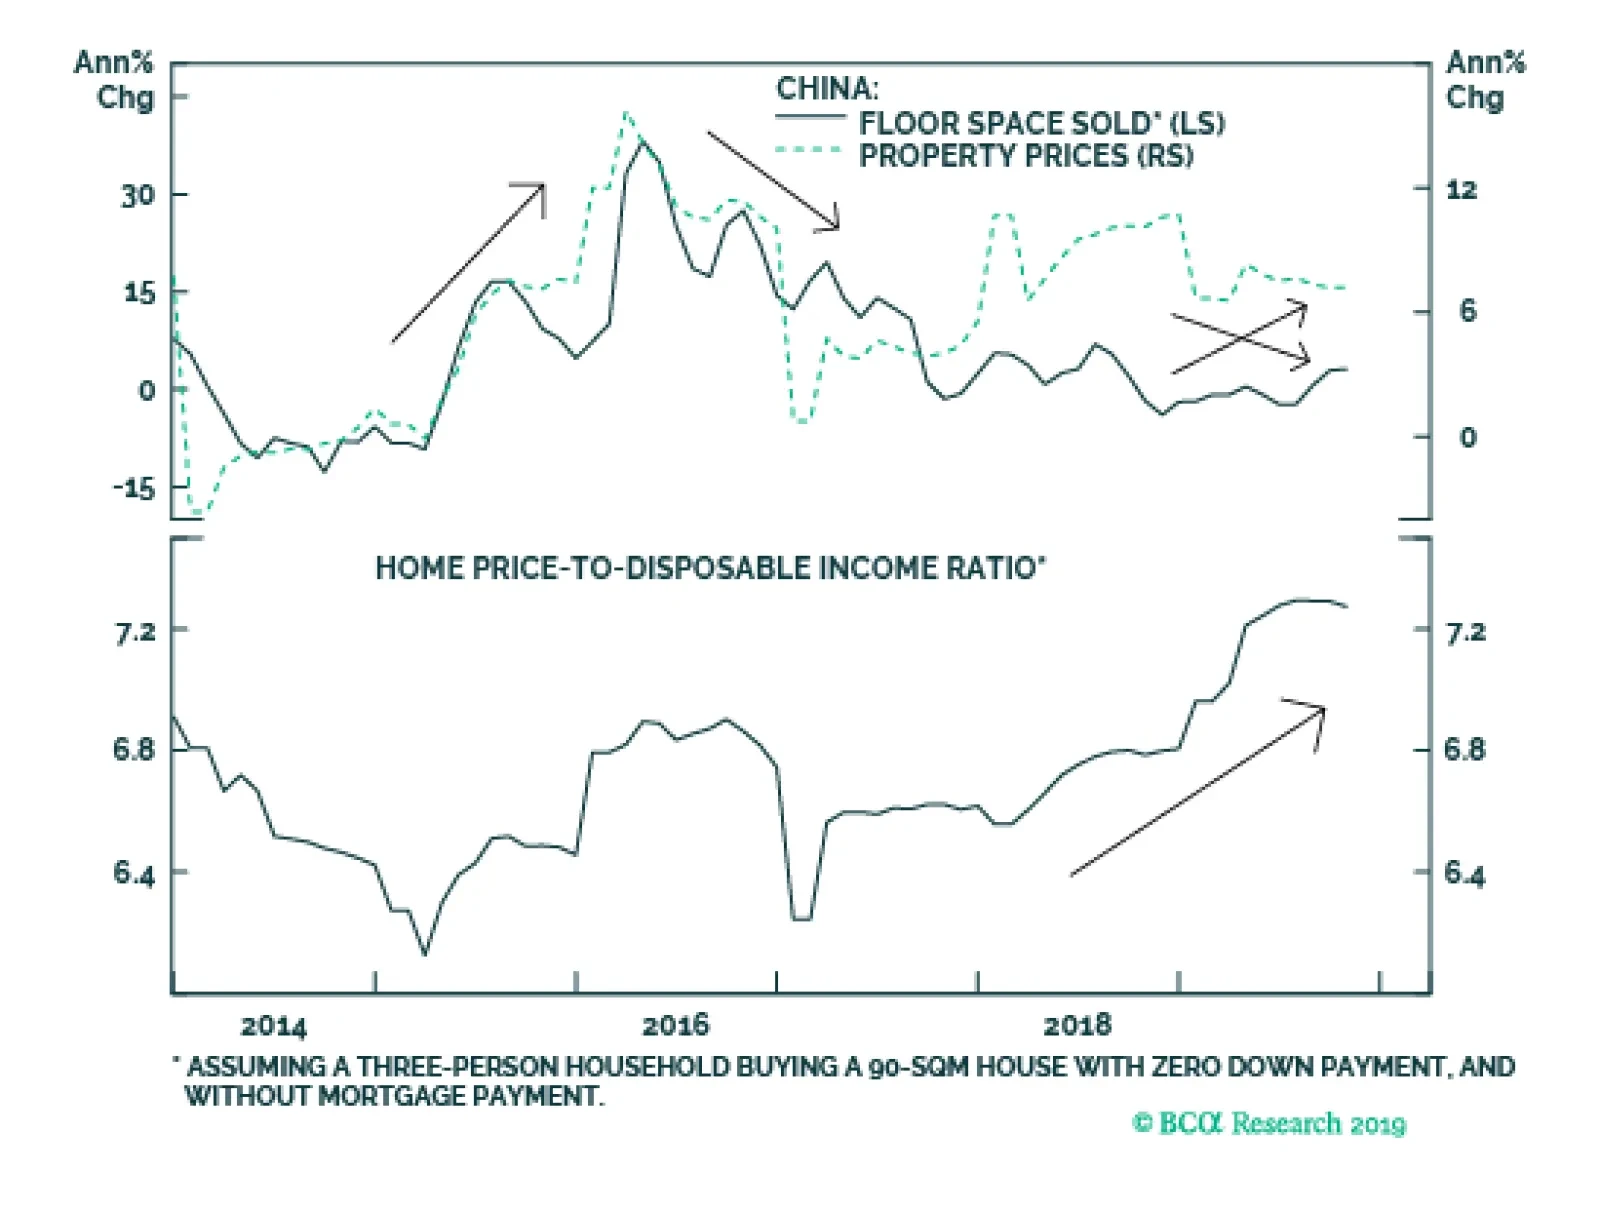
China’s October housing market data highlighted three points: housing sales are modestly improving, the pace of housing construction has again deviated from the trend in sales, and housing price appreciation is slowing in Tier 2 and Tier 3 markets. We are…
2020 High-Conviction Calls: S&P Semi Equipment
2020 High-Conviction Calls: S&P Semi Equipment
Underweight While year-to-date chip equipment stocks are the best performing index in the SPX, we deem them a mania, and include them in our high-conviction underweight basket for 2020. The top panel shows this irrational exuberance that has permeated the semi equipment universe is similar to the dotcom era excesses. Back in the late-1990s relative profit growth was sky high, but today it is flirting with the zero line, warning that gravity will pull these stocks back down to earth. The contracting ISM manufacturing survey signals that relative share price momentum running at a breakneck pace is unwarranted. The same holds true for relative forward profit and revenue growth expectations, especially given the ongoing contraction in global semi sales. This deficient demand for semis and therefore semi equipment manufacturers is also apparent in deflating DRAM prices, our industry pricing power proxy. Historically, relative profit expectations and pricing power have moved in lockstep and the current message is to fade sell-side analysts’ buoyancy. Net earnings revisions have slingshot from extreme pessimism to extreme optimism during the past quarter and are vulnerable to disappointment. In sum, lack of profit growth, deficient industry demand, perky valuations and extremely overbought conditions all suggest that the mania in the S&P chip equipment index will likely turn into a panic next year. The ticker symbols for the stocks in this index are: BLBG – S5SEEQ – AMAT, LRCX, KLAC.