Sectors

2020 High-Conviction Calls: S&P Homebuilding
2020 High-Conviction Calls: S&P Homebuilding
Underweight We downgraded homebuilders to underweight in late-October, and we are adding it to our high-conviction underweight call list. Most, if not all, positive profit drivers are already reflected in relative share prices. Specifically, the drubbing in interest rates has been more than accounted for by the year-to-date outperformance in homebuilders. Now that interest rates are moving in reverse, more pain lies ahead for the S&P homebuilding index. Worrisomely, consumers’ expectations to purchase a new home plunged anew last month according to The Conference Board’s survey, and that demand softness will weigh on housing starts and ultimately homebuilding revenues. Adding insult to injury, new house selling prices are losing ground to existing home prices, but such discounting is no longer boosting volumes as new home sales market share gains have stalled. Already, S&P homebuilding sales are contracting and the risk is that deflation gets entrenched in this construction industry. Simultaneously, lumber prices are gaining steam and coupled with contracting new home prices signal that homebuilding profits will suffer a setback. The ticker symbols for the stocks in this index are: BLBG – S5HOME – DHI, LEN, PHM, NVR.
S&P Managed Health Care: Just What The Doctor Ordered!
…
Overweight A tentative up-tick in EM data in general and China in particular along with improving operating metrics signal that the US/China trade war wounded machinery stocks deserve a high-conviction overweight status for 2020. In more detail, the budding recoveries in the EM and Chinese manufacturing PMIs herald a brighter outlook for relative share prices. China’s fiscal and credit impulse also signals that a bottom in relative share prices is likely already in place. If this leading indicator proves accurate in the coming months, then relative share prices can reclaim the early-2018 highs. On the operating front, the new orders-to-inventories momentum has traced a bottom. Assuming that the Chinese manufacturing PMI reading stays on an upward trajectory, machinery demand will make a durable comeback. None of these green shoots are reflected in sell-side analysts’ bombed out relative profit and sales growth expectations. The ticker symbols for the stocks in this index are: BLBG – S5MACH – CAT, DE, ITW, IR, CMI, PCAR, PH, SWK, FTV, DOV, XYL, IEX, WAB, SNA, PNR, FLS.
2020 High-Conviction Calls: S&P Machinery
2020 High-Conviction Calls: S&P Machinery
S&P Banks: We're Going To Need A Larger Vault
…
Highlights China’s PMIs continue to flash a positive signal, but the hard data trend remains negative. There has been a notable improvement in China’s cyclical sectors (versus defensives) over the past month, but broad equity market performance has been flat-to-down. China’s lackluster equity index performance in the face of rising PMIs suggests that investors can afford to wait for an improvement in the hard economic data before tactically upgrading to overweight. Cyclically, we continue to recommend an overweight stance towards both the investable and A-share markets versus the global benchmark, favoring the former over the latter. Feature Tables 1 and 2 on pages 2 and 3 highlight key developments in China’s economy and its financial markets over the past month. On the growth front, China’s November PMIs were clearly positive, and the rise in the official manufacturing PMI above the 50 mark is notable. However, the odds continue to favor a bottoming in the economy in Q1 rather than Q4, in large part because China’s “hard” economic data has continued to deteriorate during the time that the Caixin PMI has been signaling an expansion in manufacturing activity. In this vein, China’s November update for producer prices and total imports have high potential to be market-moving, and should be closely monitored. Table 1China Macro Data Summary
China Macro And Market Review
China Macro And Market Review
Table 2China Financial Market Performance Summary
China Macro And Market Review
China Macro And Market Review
Within financial markets, China’s cyclical sectors have outperformed defensives, which is consistent with the positive message from China’s PMIs. But China’s broad equity markets have been flat-to-down versus the global index over the past month, suggesting that investors can afford to wait for confirmation of a hard data improvement before upgrading their tactical stance to overweight (from neutral). Cyclically, we continue to recommend an overweight stance towards both the investable and A-share markets, but favor the former over the latter in a trade truce scenario. In reference to Tables 1 and 2, we provide below several detailed observations concerning developments in China’s macro and financial market data: Both measures of the Li Keqiang index (LKI) that we track indicated no obvious improvement in Chinese economy activity in October. The BCA China Activity indicator, a broader coincident measure of China’s economy, also moved sideways in October and (for now) remains in a downtrend. Thus, based on the “hard data”, Chinese economic activity has not yet bottomed. Chart 1A Moderate Strength Economic Recovery Will Begin In Q1
A Moderate Strength Economic Recovery Will Begin In Q1
A Moderate Strength Economic Recovery Will Begin In Q1
The components of our LKI leading indicator continue to tell a story of easy monetary conditions and sluggish money & credit growth (Chart 1). The indicator itself remains in an uptrend, but it is a shallow one that does not match the intensity of previous credit cycles. While the uptrend in the indicator suggests that China’s economy will soon bottom, the shallow pace suggests that the coming rebound in growth will be less forceful than during previous economic recoveries. The uptrend in headline CPI is a notable macro development, with prices having risen 3.8% year-over-year in Oct (the fastest pace in almost eight years). This rise has been driven almost entirely by a surge in pork prices, which have risen over 60% relative to last year (panel 1 of Chart 2). While some investors have questioned whether the rise in headline inflation will cause the PBoC to tighten its stance at the margin, we argued with high conviction in our November 20 Weekly Report that this will not occur.1 Panel 2 of Chart 2 shows that periods of easy monetary policy line up strongly with periods of deflating producer prices, arguing that the PBoC will see through transient shocks to headline inflation. China’s October housing market data highlighted three points: housing sales are modestly improving, the pace of housing construction has again deviated from the trend in sales, and housing price appreciation is slowing in Tier 2 and Tier 3 markets. For now, we are inclined to discount the surge in floor space started, given previous divergences that proved to be unsustainable. The bigger question is whether investors should be concerned about slowing housing prices. Chart 3 shows that floor space sold and property prices have been negatively correlated over the past three years, in contrast to a previously positive relationship. Deteriorating affordability and tight housing regulations have contributed to this shift in correlation, which helps explain why the PBoC’s Pledged Supplementary Lending (PSL) program has been so closely related to housing sales over the past few years. While the growth in PSL injections is becoming less negative, it has not risen to the point that it would be associated with a strong trend in sales. As such, we continue to see poor affordability as a threat to further housing price appreciation, absent stronger funding assistance. Poor affordability will continue to be a headwind for China’s housing market. Chart 2The PBoC Will See Through Transient Shocks To Headline Inflation
The PBoC Will See Through Transient Shocks To Headline Inflation
The PBoC Will See Through Transient Shocks To Headline Inflation
Chart 3Poor Affordability Will Continue To Weigh On Housing Demand
Poor Affordability Will Continue To Weigh On Housing Demand
Poor Affordability Will Continue To Weigh On Housing Demand
Chart 4Investors Need To See Concrete Signs Of A Hard Data Improvement
Investors Need To See Concrete Signs Of A Hard Data Improvement
Investors Need To See Concrete Signs Of A Hard Data Improvement
China’s November PMIs were quite positive, which legitimately increases the odds that China’s economy is beginning the process of recovery. However, we see two reasons to believe that the odds continue to favor a bottoming in the economy in Q1 rather than Q4. First, while they improved in November, several important elements of the official PMI remain in contractionary territory, particularly the new export orders subcomponent. Second, while the Caixin PMI has now been above the 50 mark for 4 consecutive months, China’s hard data has continued to deteriorate since the summer (Chart 4). Given the historical volatility of the Caixin PMI, we advise investors to wait for concrete signs of a hard data improvement before firmly concluding that China’s economy is recovering. Over the last month, China’s investable stock market has rallied roughly 1% in absolute terms, while domestic stocks have fallen about 3%. In relative terms, A-shares underperformed the global benchmark, while the investable market moved sideways. In our view, the underperformance of China’s domestic market reflects increased sensitivity to monetary conditions and credit growth compared with the investable market,2 and a weaker credit impulse in October appears to have been the catalyst for A-share underperformance. Over the cyclical horizon, earnings will improve in both the onshore and offshore markets in response to a modest improvement in economic activity, suggesting that an overweight stance is justified for both markets. But we think the investable market has more upside potential in a trade truce scenario. The outperformance of cyclical versus defensive sectors is sending a positive signal, but investors can afford to wait for better economic data before tactically upgrading. Chart 5A Positive Sign From Cyclicals Versus Defensives
A Positive Sign From Cyclicals Versus Defensives
A Positive Sign From Cyclicals Versus Defensives
Within China’s investable stock market, it is quite notable that cyclicals have outperformed defensives over the past month on an equally-weighted basis (Chart 5). Interestingly, key defensive sectors such as investable health care and utilities have sold off significantly, and equally-weighted cyclicals have also outperformed defensives in the domestic market. The outperformance of cyclicals and underperformance of defensives is consistent with the positive message from China’s PMIs, but the fact that this improvement is occurring against the backdrop of flat-to-down relative performance for China’s equity market suggests that investors can afford to wait for confirmation of a hard data improvement before upgrading their tactical stance to overweight. In this vein, China’s November update for producer prices and total imports have high potential to be market-moving, and should be closely monitored. China’s government bond yields fell slightly in November, potentially reflecting expectations of further modest easing. Our view that monetary policy will likely remain easy over the coming year even in a modest recovery scenario suggests that Chinese interbank rates and government bond yields are likely to range-trade over the coming 6-12 months. We expect onshore corporate bonds to continue to outperform duration-matched government bonds in 2020. Chinese onshore corporate bond spreads eased modestly over the past month. Despite continued concerns about onshore corporate defaults, the yield advantage offered by onshore corporate bonds have helped the asset class generate a 5.4% year-to-date return in local currency terms. Barring a substantial intensification of the pace of defaults, we expect onshore corporate bonds to continue to outperform duration-matched government bonds in 2020. The RMB has moved sideways versus the US dollar over the last month. USD-CNY had fallen below 7 in October following the announcement of the intention to sign a “phase one” trade deal, but the move ultimately proved temporary given the deferral of an agreement. We would expect the RMB to appreciate following a deal of any kind (a truce or something more), and it is also likely to be supported next year by improving economic activity. Still, it would not be in the PBoC’s best interests to let the RMB appreciate too rapidly, because an appreciating Chinese currency would act as a deflationary force on China’s export and manufacturing sectors. As such, we expect a modest downtrend in USD-CNY over the coming year. Qingyun Xu, CFA Senior Analyst qingyunx@bcaresearch.com Jing Sima China Strategist jings@bcaresearch.com Footnotes 1 Please see China Investment Strategy Weekly Report "Questions From The Road: Timing The Turn," dated November 20, 2019, available at cis.bcaresearch.com 2 Please see China Investment Strategy Special Report "A Guide To Chinese Investable Equity Sector Performance," dated November 27, 2019, available at cis.bcaresearch.com Cyclical Investment Stance Equity Sector Recommendations
2020 High-Conviction Calls: S&P Managed Health Care
2020 High-Conviction Calls: S&P Managed Health Care
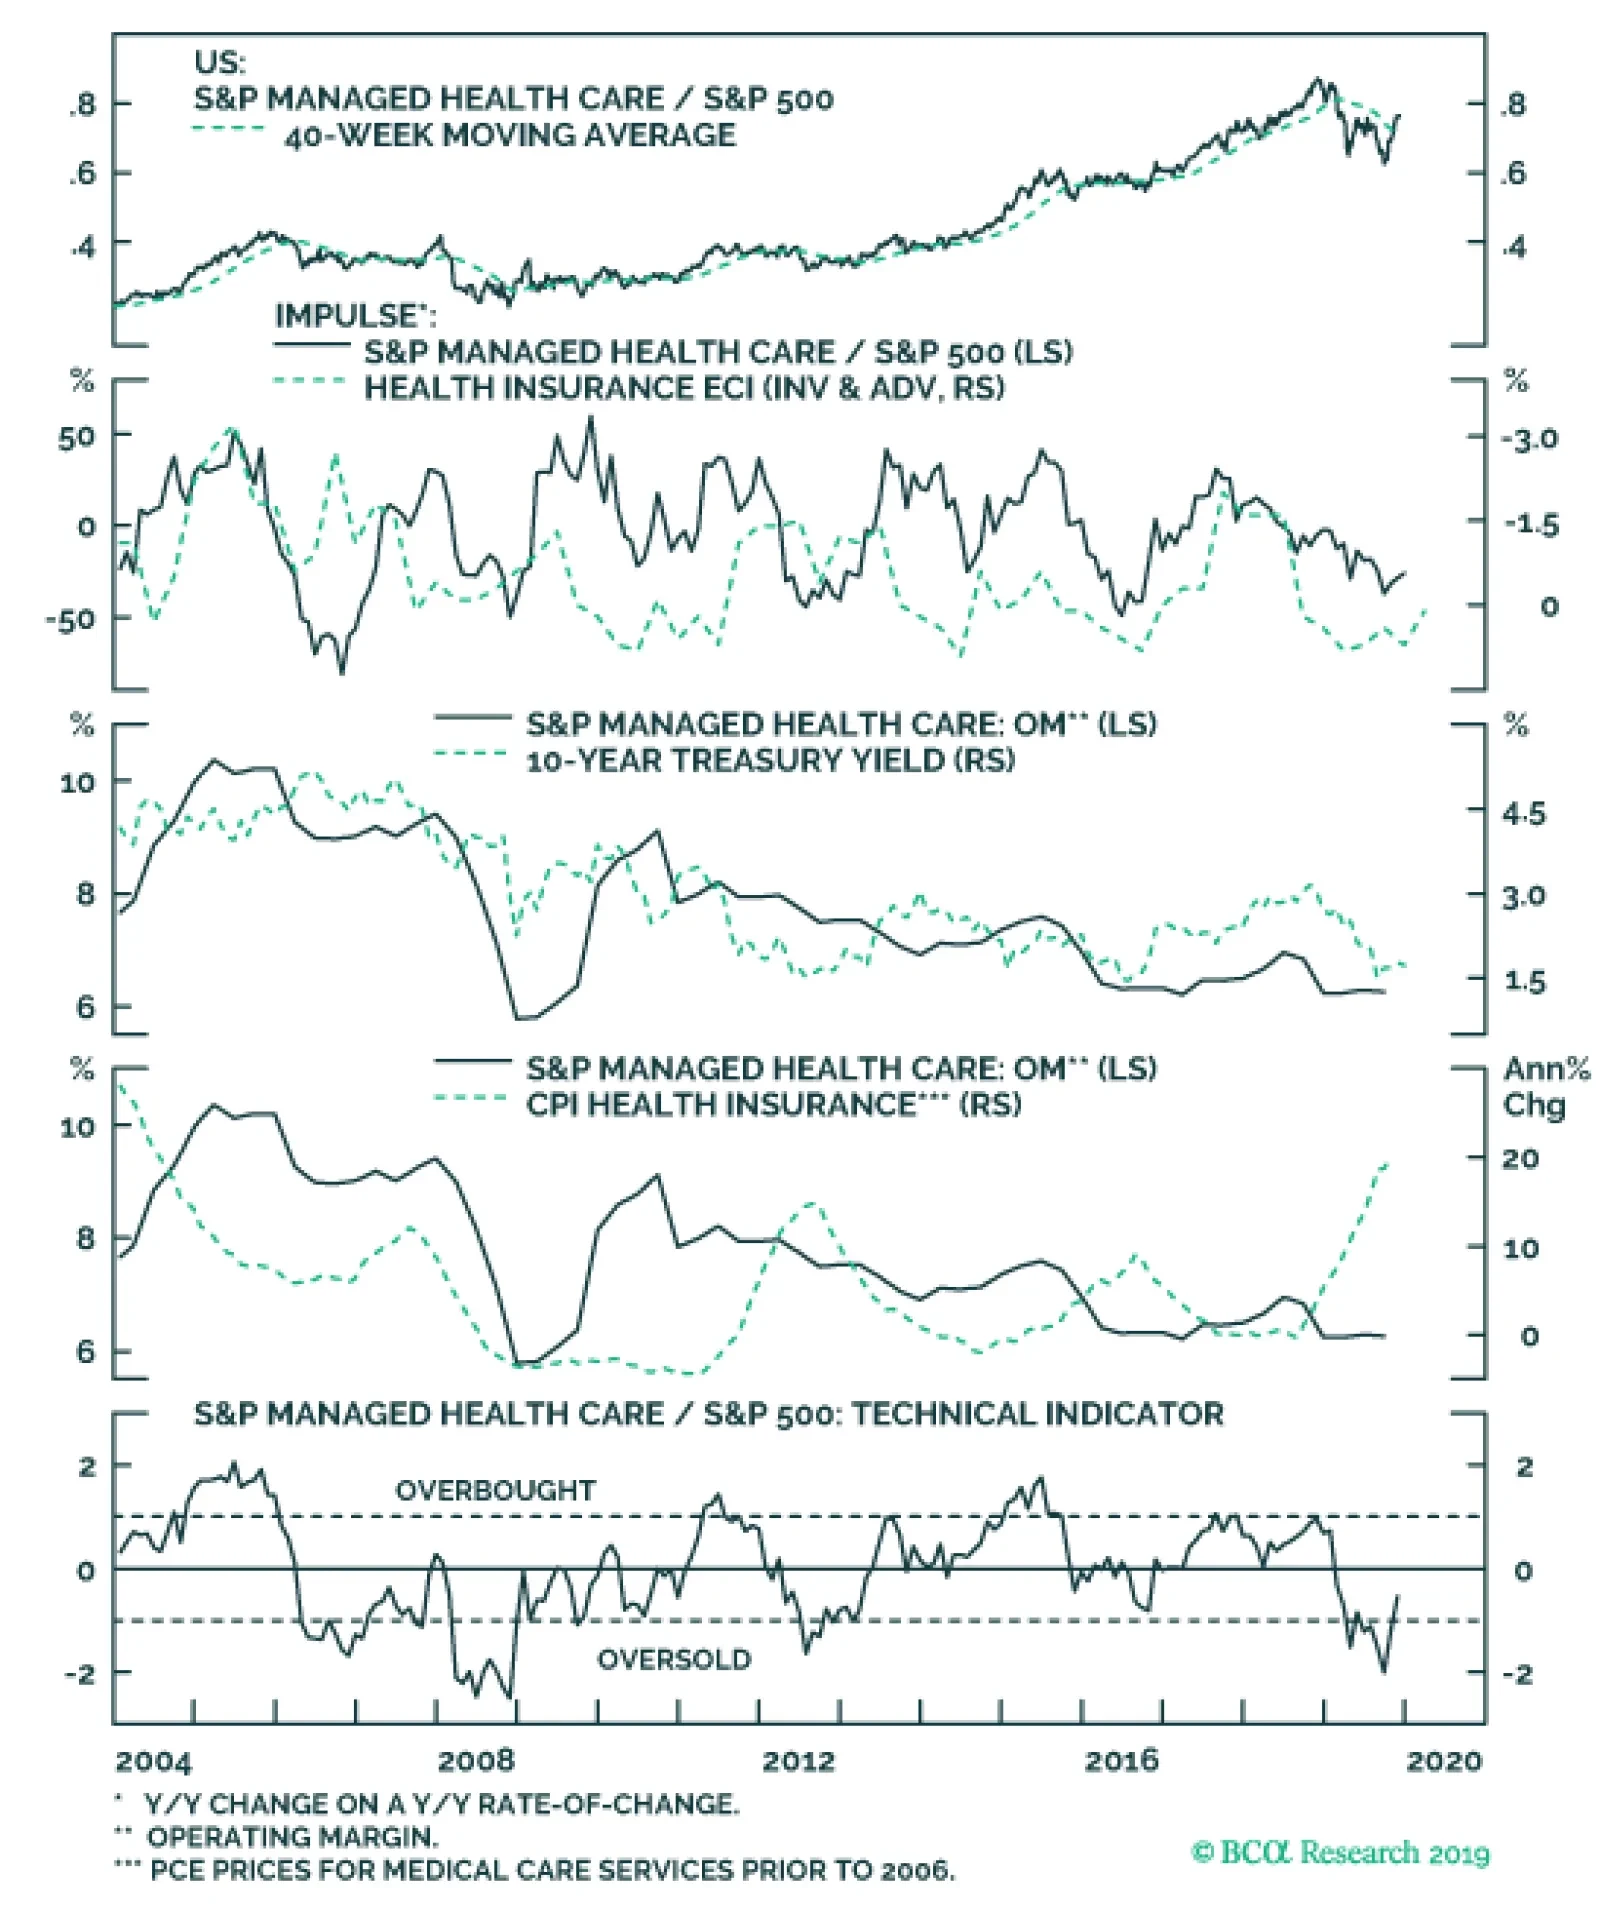
Overweight We upgraded the S&P managed health care group to overweight in April shortly after Bernie Sanders re-introduced his revamped “Medicare For All” bill. Despite the recent explosive run up in relative share prices – partly owing to the drop in Elizabeth Warren’s odds of winning the Democratic candidacy and partly given her watering down of her “Medicare For All” take up plan – we are adding this health care sub-group to our high-conviction overweight call list. HMOs are finally raising prices at the steepest rate of the past fifteen years and while such breakneck pace is unsustainable, profit margins are set to expand smartly. The profit margin backdrop is enticing for health insurers for another reason: labor cost containment. CEOs have been extremely prudent refraining from adding to headcount. One final profit margin booster is the rising 10-year Treasury yield, as roughly 10% of the industry’s operating income is tied to “investment income”. In other words, as insurers receive the premia they typically invest it in Treasurys and that explains the high EPS and margin sensitivity on interest rate moves. Thus, if BCA’s bond view materializes, it will prove a tonic to both margins and profits. With regard to technicals, relative share prices are not as oversold as they were mid-year, but remain below the neutral zone still offering investors a compelling entry point to this position. The ticker symbols for the stocks in this index are: BLBG: S5MANH – UNH, ANTM, HUM, CNC, WCG.
Highlights Chart 1Manufacturing PMIs Track Bond Yields
Manufacturing PMIs Track Bond Yields
Manufacturing PMIs Track Bond Yields
November’s manufacturing PMI data were released yesterday, giving us an update for two of our preferred global growth indicators: the Global Manufacturing PMI and the US ISM Manufacturing PMI (Chart 1). Unfortunately, the two indicators sent conflicting signals, providing us with very little clarity on the global growth outlook. On the positive side, the Global Manufacturing PMI jumped back above 50 for the first time since April. China is the largest weighting in the global index, and its PMI rose for the fifth consecutive month. Conversely, the US ISM Manufacturing PMI dipped further into contractionary territory in November – from 48.3 to 48.1. Optimistically, the index’s inventory component contracted by more than the new orders component, meaning that the difference between new orders and inventories rose to its highest level since May. The difference between new orders and inventories often leads the overall ISM index by several months. All in all, we continue to see tentative signs of stabilization in our preferred global growth indicators. But a more significant rebound will be necessary to push bond yields higher in the first half of next year, as we expect. Stay tuned. Investment Grade: Neutral Chart 2Investment Grade Market Overview
Investment Grade Market Overview
Investment Grade Market Overview
Investment grade corporate bonds outperformed the duration-equivalent Treasury index by 63 basis points in November, bringing year-to-date excess returns up to +494 bps. We consider three main factors in our credit cycle analysis: (i) corporate balance sheet health, (ii) monetary conditions and (iii) valuation.1 On balance sheets, our top-down measure of gross leverage is high and rising (Chart 2). In contrast, interest coverage ratios remain solid, propped up by the Fed’s accommodative stance. With inflation expectations still depressed, the Fed can maintain its “easy money” policy for some time yet. The third quarter’s tightening of C&I lending standards is a concern, because it suggests that monetary conditions may not be sufficiently stimulative for banks to keep the credit taps running (bottom panel). But the yield curve, another indicator of monetary conditions, has steepened significantly since Q3, suggesting that lending standards will soon move back into “net easing” territory. For now, we see valuation as the main headwind for investment grade credit spreads. Spreads for all credit tiers are below our targets, with the Baa tier looking less expensive than the others (panels 2 & 3).2 As a result, we advise only a neutral allocation to investment grade corporate bonds, with a preference for the Baa credit tier. We also recommend increasing exposure to Agency MBS in place of corporate bonds rated A or higher (see page 7). Table 3ACorporate Sector Relative Valuation And Recommended Allocation*
Mixed Messages
Mixed Messages
Table 3BCorporate Sector Risk Vs. Reward*
Mixed Messages
Mixed Messages
High-Yield Overweight Chart 3High-Yield Market Overview
High-Yield Market Overview
High-Yield Market Overview
High-Yield outperformed the duration-equivalent Treasury index by 47 basis points in November, bringing year-to-date excess returns up to +671 bps. The index option-adjusted spread tightened 22 bps on the month and currently sits at 370 bps, 131 bps above our target (Chart 3). Ba and B rated junk bonds outperformed the Treasury benchmark by 79 bps and 76 bps, respectively, in November. But Caa-rated credit underperformed Treasuries by 89 bps. This continues the trend of Caa underperformance that has been in place since late last year (panel 3). We analyzed the divergence between Caa and the rest of the junk bond universe in last week’s report and came to two conclusions.3 First, the historical data show that 12-month periods of overall junk bond outperformance are more likely to be followed by underperformance if Caa is the worst performing credit tier. Second, we can identify several reasons for this year’s Caa underperformance that make us inclined to downplay any potential negative signal. Specifically, we note that the Caa credit tier’s exposure to the shale oil sector is responsible for the bulk of this year’s underperformance (bottom panel). With elevated spreads, accommodative monetary conditions and a looming recovery in global economic growth, we expect junk spreads to tighten during the next 6-12 months. MBS: Overweight Chart 4MBS Market Overview
MBS Market Overview
MBS Market Overview
Mortgage-Backed Securities outperformed the duration-equivalent Treasury index by 19 basis points in November, bringing year-to-date excess returns up to +22 bps. The conventional 30-year zero-volatility spread tightened 3 bps on the month, as a 5 bps tightening of the option-adjusted spread (OAS) was offset by a 2 bps increase in expected prepayment losses (aka option cost). We recommend an overweight allocation to Agency MBS, particularly relative to corporate bonds rated A or higher, for three reasons.4 First, expected compensation is competitive. The conventional 30-year MBS OAS is now 50 bps (Chart 4). This is very close to its pre-crisis average and only 3 bps below the spread offered by Aa-rated corporate bonds (panel 4). Also, spreads for all investment grade corporate bond credit tiers trade below our targets. Second, risk-adjusted compensation heavily favors MBS. The Excess Return Bond Map in Appendix C shows that Agency MBS plot well to the right of investment grade corporates. This means that the sector is less likely to see losses versus Treasuries on a 12-month horizon. Finally, the macro environment for MBS remains supportive. Mortgage lending standards have barely eased since the financial crisis (bottom panel), and most homeowners have already had at least one opportunity to refinance their mortgages. This burnout will keep refi activity low, and MBS spreads tight (panel 2). Government-Related: Underweight Chart 5Government-Related Market Overview
Government-Related Market Overview
Government-Related Market Overview
The Government-Related index outperformed the duration-equivalent Treasury index by 14 basis points in November, bringing year-to-date excess returns up to +197 bps. Sovereign debt outperformed duration-equivalent Treasuries by 36 bps on the month, bringing year-to-date excess returns up to +513 bps. Local Authorities outperformed the Treasury benchmark by 24 bps, bringing year-to-date excess returns up to +245 bps. Meanwhile, Foreign Agencies outperformed by 4 bps, bringing year-to-date excess returns up to +266 bps. Domestic Agencies outperformed by 11 bps in November, bringing year-to-date excess returns up to +51 bps. Supranationals outperformed by 5 bps on the month, bringing year-to-date excess returns up to +36 bps. We continue to recommend an underweight allocation to USD-denominated sovereign bonds, given that spreads remain expensive compared to US corporate credit (Chart 5). However, we noted in a recent report that Mexican and Saudi Arabian sovereigns look attractive on a risk/reward basis.5 This is also true for Foreign Agencies and Local Authorities, as shown in the Bond Map in Appendix C. Our Emerging Markets Strategy service also thinks that worries about Mexico’s fiscal position are overblown, and that bond yields embed too high of a risk premium (bottom panel).6 Municipal Bonds: Overweight Chart 6Municipal Market Overview
Municipal Market Overview
Municipal Market Overview
Municipal bonds outperformed the duration-equivalent Treasury index by 70 basis points in November, bringing year-to-date excess returns up to +6bps (before adjusting for the tax advantage). The average Aaa-rated Municipal / Treasury (M/T) yield ratio fell 4% in November, and currently sits at 83% (Chart 6). We upgraded municipal bonds in early October, as yield ratios had become significantly more attractive, especially at the long-end of the Aaa curve (panel 2).7 Specifically, 2-year and 5-year M/T yield ratios are somewhat below average pre-crisis levels at 68% and 72%, respectively. However, M/T yield ratios for longer maturities (10 years and higher) are all above average pre-crisis levels. M/T yield ratios for 10-year, 20-year and 30-year maturities are 84%, 93% and 97%, respectively. Fundamentally, state & local government balance sheets remain solid. Our Municipal Health Monitor remains in “improving health” territory and state & local government interest coverage has improved considerably in recent quarters (bottom panel). Both of these trends are consistent with muni ratings upgrades continuing to outnumber downgrades going forward. Treasury Curve: Maintain A Barbell Curve Positioning Chart 7Treasury Yield Curve Overview
Treasury Yield Curve Overview
Treasury Yield Curve Overview
The Treasury curve shifted higher in November, steepening out to the 7-year maturity and flattening beyond that. The 2/10 Treasury slope was unchanged on the month. It currently sits at 17 bps. The 5/30 slope flattened 7 bps to end the month at 59 bps (Chart 7). In a recent report we discussed the 6-12 month outlook for the 2/10 Treasury slope.8 We considered the main macro factors that influence the slope of the yield curve: Fed policy, wage growth, inflation expectations and the neutral fed funds rate. We concluded that the 2/10 slope has room to steepen during the next few months, as the Fed holds down the front-end of the curve in an effort to re-anchor inflation expectations. However, we see the 2/10 slope remaining in a range between 0 bps and 50 bps, owing to strong wage growth and downbeat neutral rate expectations. Despite the outlook for modest curve steepening, we continue to recommend holding a barbelled Treasury portfolio. Specifically, we favor holding a 2/30 barbell versus the 5-year bullet, in duration-matched terms. This position offers strong positive carry (bottom panel), due to the extreme overvaluation of the 5-year note, and looks attractive on our yield curve models (see Appendix B). TIPS: Overweight Chart 8TIPS Market Overview
Inflation Compensation
Inflation Compensation
TIPS outperformed the duration-equivalent nominal Treasury index by 47 basis points in November, bringing year-to-date excess returns up to -70 bps.The 10-year TIPS breakeven inflation rate rose 8 bps on the month and currently sits at 1.62%. The 5-year/5-year forward TIPS breakeven inflation rate rose 9 bps on the month and currently sits at 1.73%. Both rates remain well below the 2.3%-2.5% range consistent with the Fed’s target. The divergence between the actual inflation data and inflation expectations remains stark. Trimmed mean PCE inflation has been fluctuating around the Fed’s target for most of the year (Chart 8). However, long-maturity TIPS breakeven inflation rates remain stubbornly low. As we have pointed out in prior research, it can take time for expectations to adapt to a changing macro environment.9 That being said, the 10-year TIPS breakeven inflation rate is currently 29 bps too low according to our Adaptive Expectations Model, a model whose primary input is 10-year trailing core inflation (panel 4). It is highly likely that the Fed will have to tolerate some overshoot of its 2% inflation target in order to re-anchor inflation expectations near desired levels. We anticipate that the committee will do so, and maintain our view that long-dated TIPS breakevens will move above 2.3% before the end of the cycle. ABS: Underweight Asset-Backed Securities outperformed the duration-equivalent Treasury index by 7 basis points in November, bringing year-to-date excess returns up to +74 bps. Chart 9ABS Market Overview
ABS Market Overview
ABS Market Overview
The index option-adjusted spread for Aaa-rated ABS widened 2 bps on the month. It currently sits at 34 bps; its minimum pre-crisis level (Chart 9). Our Excess Return Bond Map (see Appendix C) shows that Aaa-rated consumer ABS rank among the most defensive US spread products and also offer more expected return than other low-risk sectors such as Domestic Agency bonds and Supranationals. However, we remain wary of allocating too much to consumer ABS because credit trends continue to shift in the wrong direction. The consumer credit delinquency rate is still low, but has put in a clear bottom. The is true for the household interest expense ratio (panel 3). Senior Loan Officers also continue to tighten lending standards for both credit cards and auto loans. Tighter lending standards usually coincide with rising delinquencies (bottom panel). All in all, our favorable outlook for global growth causes us to shy away from defensive spread products, and deteriorating ABS credit metrics are also a cause for concern. Stay underweight. Non-Agency CMBS: Neutral Chart 10CMBS Market Overview
CMBS Market Overview
CMBS Market Overview
Non-Agency Commercial Mortgage-Backed Securities underperformed the duration-equivalent Treasury index by 12 basis points in November, dragging year-to-date excess returns down to +221 bps. The index option-adjusted spread for non-agency Aaa-rated CMBS widened 1 bp on the month. It currently sits at 72 bps, below its average pre-crisis level but somewhat above levels seen in 2018 (Chart 10). The macro outlook for commercial real estate (CRE) is somewhat unfavorable, with lenders tightening loan standards (panel 4) in an environment of tepid demand. The Fed’s Senior Loan Officer Survey shows that banks saw slightly stronger demand for nonfarm nonresidential CRE loans in Q3, after four consecutive quarters of falling demand (bottom panel). CRE prices are still not keeping pace with CMBS spreads (panel 3). Despite the poor fundamental picture, our Excess Return Bond Map shows that CMBS offer a reasonably attractive risk/reward trade-off compared to other bond sectors (see Appendix C). Agency CMBS: Overweight Agency CMBS outperformed the duration-equivalent Treasury index by 7 basis points in November, bringing year-to-date excess returns up to +107 bps. The index option-adjusted spread tightened 2 bps on the month, and currently sits at 54 bps. The Excess Return Bond Map in Appendix C shows that Agency CMBS offer a compelling risk/reward trade-off. An overweight allocation to this high-rated sector remains appropriate. Appendix A: The Golden Rule Of Bond Investing We follow a two-step process to formulate recommendations for bond portfolio duration. First, we determine the change in the federal funds rate that is priced into the yield curve for the next 12 months. Second, we decide – based on our assessments of the economy and Fed policy – whether the change in the fed funds rate will exceed or fall short of what is priced into the curve. Most of the time, a correct answer to this question leads to the appropriate duration call. We call this framework the Golden Rule Of Bond Investing, and we demonstrated its effectiveness in the US Bond Strategy Special Report, “The Golden Rule Of Bond Investing”, dated July 24, 2018, available at usbs.bcaresearch.com. Chart 11 illustrates the Golden Rule’s track record by showing that the Bloomberg Barclays Treasury Master Index tends to outperform cash when rate hikes fall short of 12-month expectations, and vice-versa. Chart 11The Golden Rule's Track Record
The Golden Rule's Track Record
The Golden Rule's Track Record
At present, the market is priced for 26 basis points of cuts during the next 12 months. We anticipate a flat fed funds rate over that time horizon, and therefore anticipate that below-benchmark portfolio duration positions will profit. We can also use our Golden Rule framework to make 12-month total return and excess return forecasts for the Bloomberg Barclays Treasury index under different scenarios for the fed funds rate. Excess returns are relative to the Bloomberg Barclays Cash index. To forecast total returns we first calculate the 12-month fed funds rate surprise in each scenario by comparing the assumed change in the fed funds rate to the current value of our 12-month discounter. This rate hike surprise is then mapped to an expected change in the Treasury index yield using a regression based on the historical relationship between those two variables. Finally, we apply the expected change in index yield to the current characteristics (yield, duration and convexity) of the Treasury index to estimate total returns on a 12-month horizon. The below tables present those results, along with 95% confidence intervals. Excess returns are calculated by subtracting assumed cash returns in each scenario from our total return projections.
Mixed Messages
Mixed Messages
Mixed Messages
Mixed Messages
Appendix B: Butterfly Strategy Valuations The following tables present the current read-outs from our butterfly spread models. We use these models to identify opportunities to take duration-neutral positions across the Treasury curve. The following two Special Reports explain the models in more detail: US Bond Strategy Special Report, “Bullets, Barbells And Butterflies”, dated July 25, 2017, available at usbs.bcaresearch.com US Bond Strategy Special Report, “More Bullets, Barbells And Butterflies”, dated May 15, 2018, available at usbs.bcaresearch.com Table 4 shows the raw residuals from each model. A positive value indicates that the bullet is cheap relative to the duration-matched barbell. A negative value indicates that the barbell is cheap relative to the bullet. Table 4Butterfly Strategy Valuation: Raw Residuals In Basis Points (As Of November 29 2019)
Mixed Messages
Mixed Messages
Table 5 scales the raw residuals in Table 4 by their historical means and standard deviations. This facilitates comparison between the different butterfly spreads. Table 5Butterfly Strategy Valuation: Standardized Residuals (As Of November 29, 2019)
Mixed Messages
Mixed Messages
Table 6 flips the models on their heads. It shows the change in the slope between the two barbell maturities that must be realized during the next six months to make returns between the bullet and barbell equal. For example, a reading of 45 bps in the 5 over 2/10 cell means that we would only expect the 5-year to outperform the 2/10 if the 2/10 slope steepens by more than 45 bps during the next six months. Otherwise, we would expect the 2/10 barbell to outperform the 5-year bullet. Table 6Discounted Slope Change During Next 6 Months (BPs)
Mixed Messages
Mixed Messages
Appendix C: Excess Return Bond Map The Excess Return Bond Map is used to assess the relative risk/reward trade-off between different sectors of the US bond market. It is a purely computational exercise and does not impose any macroeconomic view. The Map’s vertical axis shows 12-month expected excess returns. These are proxied by each sector’s option-adjusted spread. Sectors plotting further toward the top of the Map have higher expected returns and vice-versa. Our novel risk measure called the “Risk Of Losing 100 bps” is shown on the Map’s horizontal axis. To calculate it, we first compute the spread widening required on a 12-month horizon for each sector to lose 100 bps or more relative to a duration-matched position in Treasury securities. Then, we divide that amount of spread widening by each sector’s historical spread volatility. The end result is the number of standard deviations of 12-month spread widening required for each sector to lose 100 bps or more versus a position in Treasuries. Lower risk sectors plot further to the right of the Map, and higher risk sectors plot further to the left. Chart 12Excess Return Bond Map (As Of November 29, 2019)
Mixed Messages
Mixed Messages
Ryan Swift US Bond Strategist rswift@bcaresearch.com Footnotes 1 Please see US Bond Strategy Weekly Report, “Corporate Bond Investors Should Not Fight The Fed”, dated September 17, 2019, available at usbs.bcaresearch.com 2 For details on how we arrive at our spread targets please see US Bond Strategy Weekly Report, “The Value In Corporate Bonds”, dated February 19, 2019, available at usbs.bcaresearch.com 3 Please see US Bond Strategy Weekly Report, “Caa-Rated Bonds: Warning Sign Or Buying Opportunity?”, dated November 26, 2019, available at usbs.bcaresearch.com 4 Please see US Bond Strategy Weekly Report, “Two Themes And Two Trades”, dated October 1, 2019, available at usbs.bcaresearch.com 5 Please see US Bond Strategy Weekly Report, “A Perspective On Risk And Reward”, dated October 15, 2019, available at usbs.bcaresearch.com 6 Please see Emerging Markets Strategy Weekly Report, “Country Insights: Malaysia, Mexico & Central Europe”, dated October 31, 2019, available at ems.bcaresearch.com 7 Please see US Bond Strategy Weekly Report, “Two Themes And Two Trades”, dated October 1, 2019, available at usbs.bcaresearch.com 8 Please see US Bond Strategy Weekly Report, “Position For Modest Curve Steepening”, dated October 29, 2019, available at usbs.bcaresearch.com 9 Please see US Bond Strategy Weekly Report, “Adaptive Expectations In The TIPS Market”, dated November 20, 2018, available at usbs.bcaresearch.com Fixed Income Sector Performance Recommended Portfolio Specification Corporate Sector Relative Valuation And Recommended Allocation
Highlights Portfolio Strategy Interest rates are one of the most important macro drivers of overall equity returns via valuations. BCA’s view of a selloff in the bond market is a key factor underpinning most of our 2020 high-conviction calls. A 50bps to 75bps rise in the 10-year Treasury yield in 2020, as BCA predicts, will have significant knock on effects on sector selection. Recent Changes There are no changes to our portfolio this week. Table 1
2020 Key Views: High-Conviction Calls
2020 Key Views: High-Conviction Calls
Feature As 2019 draws to a close, this week we reveal our high-conviction calls for the coming year. But before proceeding, a brief market comment is in order. As 2019 draws to a close, this week we reveal our high-conviction calls for the coming year. But before proceeding, a brief market comment is in order. We remain perplexed by the market’s euphoric rise and near total neglect of weak profit growth fundamentals. This “hope rally”, as we have characterized it in the recent past, may have some more legs with the traditional Santa Rally around the corner, but the set up for stocks could not be more treacherous for 2020. Importantly, we deem the risk of not getting a Sino-American trade deal to be significantly greater than a relief rally in case of a successful deal. Most of the positive trade-related news is already reflected into equities. This complacent backdrop is reminiscent of the early 2018 SPX catapult to 2,870 as back then the fresh fiscal easing package was all priced into stocks in the first 20 trading days of that year. Chart 1 vividly depicts this euphoric melt-up in stocks with the longest dated VIX future trouncing the squashed front month VIX future. While this ratio is not at the stratospheric level hit in late-December 2017, it hit a wall recently forewarning that equities are skating on thin ice. Chart 1VOL...
VOL...
VOL...
Similarly, speculators are net short vol, but a snap can occur at any time. This is eerily reminiscent of February 2018. Since 2017, this vol positioning measure has consistently troughed prior to the SPX peak on three occasions and a “four-peat” likely looms (vol net spec positions shown inverted, bottom panel, Chart 2). On the profit front, sector earnings breadth is sinking like a stone confirming the negatively anchored S&P 500 net EPS revisions ratio (Chart 3). We doubt that 10% EPS growth for calendar 2020 is even plausible, especially given the looming steep deceleration in equity retirement that we highlighted recently.1 Tack on the mighty US dollar, and profit headwinds abound. Chart 2...A Coiled Spring
...A Coiled Spring
...A Coiled Spring
Chart 3No Earnings Pulse
No Earnings Pulse
No Earnings Pulse
Market internals are also screaming that something is off in the equity markets. Small caps are trailing large caps, transports are at stall speed, weak balance sheet stocks are underperforming strong balance sheet stocks, the median stock as per the Value Line Geometric Index is far from all-time highs and high yield bonds (especially CCC rated) are also not confirming the SPX breakout (Chart 4). Importantly, the CBOE’s S&P 500 implied correlation index, which gauges “the expected average correlation of price returns of S&P 500 Index components, implied through SPX option prices and prices of single-stock options on the 50 largest components of the SPX”,2 is rising again over the 40% mark, underscoring that stocks are more and more beginning to move in tandem. Historically this has been a negative omen (implied correlation index shown inverted, top panel, Chart 5). Chart 4Watch Market Internals
Watch Market Internals
Watch Market Internals
Chart 5Reflation No More?
Reflation No More?
Reflation No More?
Downtrodden M&A activity is also firing a warning shot. A steep divergence of M&A deals from stock prices is atypical at this late stage of the business cycle (middle panel, Chart 5). In fact, out Reflation Gauge comprising the greenback, oil prices and the 10-year Treasury yield has taken a turn for the worse, signaling that economic surprises will likely suffer the same fate (bottom panel, Chart 5). All of this, warns that the risks of a significant pullback in the SPX are rising. What follows is four high-conviction overweight and four underweight calls. Similar to last year, we are using BCA’s view of a selloff in the bond market is a key factor underpinning most of our 2020 high-conviction calls.3 While last year this was offside, the collapse in the 10-year US Treasury yield from 3% last December to 1.75% currently offers a better backdrop for this view to pan out. A 50bps to 75bps rise in the 10-year Treasury yield in 2020, as our BCA house view predicts, will have significant knock on effects on sector selection.4 As a reminder, interest rates are one of the most important macro drivers of overall equity returns via valuations (10-year Treasury yield shown inverted, Chart 6). Moreover on a sector basis, the ebbs and flows of the risk free asset directly influence utilities, real estate, financials, consumer discretionary and tech growth stocks or more than half of the S&P 500’s market capitalization. Chart 6Priced To Perfection
Priced To Perfection
Priced To Perfection
What follows is four high-conviction overweight and four underweight calls. Anastasios Avgeriou US Equity Strategist anastasios@bcaresearch.com S&P Managed Health Care (Overweight) We upgraded the S&P managed health care group to overweight in April shortly after Bernie Sanders re-introduced his revamped “Medicare For All” bill. Despite the recent explosive run up in relative share prices – partly owing to the drop in Elizabeth Warren’s odds of winning the Democratic candidacy and partly given her watering down of her “Medicare For All” take up plan – we are adding this health care sub-group to our high-conviction overweight call list. HMOs are finally raising prices at the steepest rate of the past fifteen years and while such breakneck pace is unsustainable, profit margins are set to expand smartly (Chart 7). The profit margin backdrop is enticing for health insurers for another reason: labor cost containment. CEOs have been extremely prudent refraining from adding to headcount. One final profit margin booster is the rising 10-year Treasury yield, as roughly 10% of the industry’s operating income is tied to “investment income”. In other words, as insurers receive the premia they typically invest it in Treasurys and that explains the high EPS and margin sensitivity on interest rate moves. Thus, if BCA’s bond view materializes, it will prove a tonic to both margins and profits. With regard to technicals, relative share prices are not as oversold as they were mid-year, but remain below the neutral zone still offering investors a compelling entry point to this position (bottom panel, Chart 7). The ticker symbols for the stocks in this index are: BLBG: S5MANH – UNH, ANTM, HUM, CNC, WCG. Chart 7S&P Managed Health Care
S&P Managed Health Care
S&P Managed Health Care
S&P Machinery (Overweight) A tentative up-tick in EM data in general and China in particular along with improving operating metrics signal that the US/China trade war wounded machinery stocks deserve a high-conviction overweight status for 2020. In more detail, the budding recoveries in the EM and Chinese manufacturing PMIs herald a brighter outlook for relative share prices. China’s fiscal and credit impulse also signals that a bottom in relative share prices is likely already in place. If this leading indicator proves accurate in the coming months, then relative share prices can reclaim the early-2018 highs. On the operating front, the new orders-to-inventories momentum has traced a bottom. Assuming that the Chinese manufacturing PMI reading stays on an upward trajectory, machinery demand will make a durable comeback. None of these green shoots are reflected in sell-side analysts’ bombed out relative profit and sales growth expectations (bottom panel, Chart 8). The ticker symbols for the stocks in this index are: BLBG – S5MACH – CAT, DE, ITW, IR, CMI, PCAR, PH, SWK, FTV, DOV, XYL, IEX, WAB, SNA, PNR, FLS. Chart 8S&P Machinery
S&P Machinery
S&P Machinery
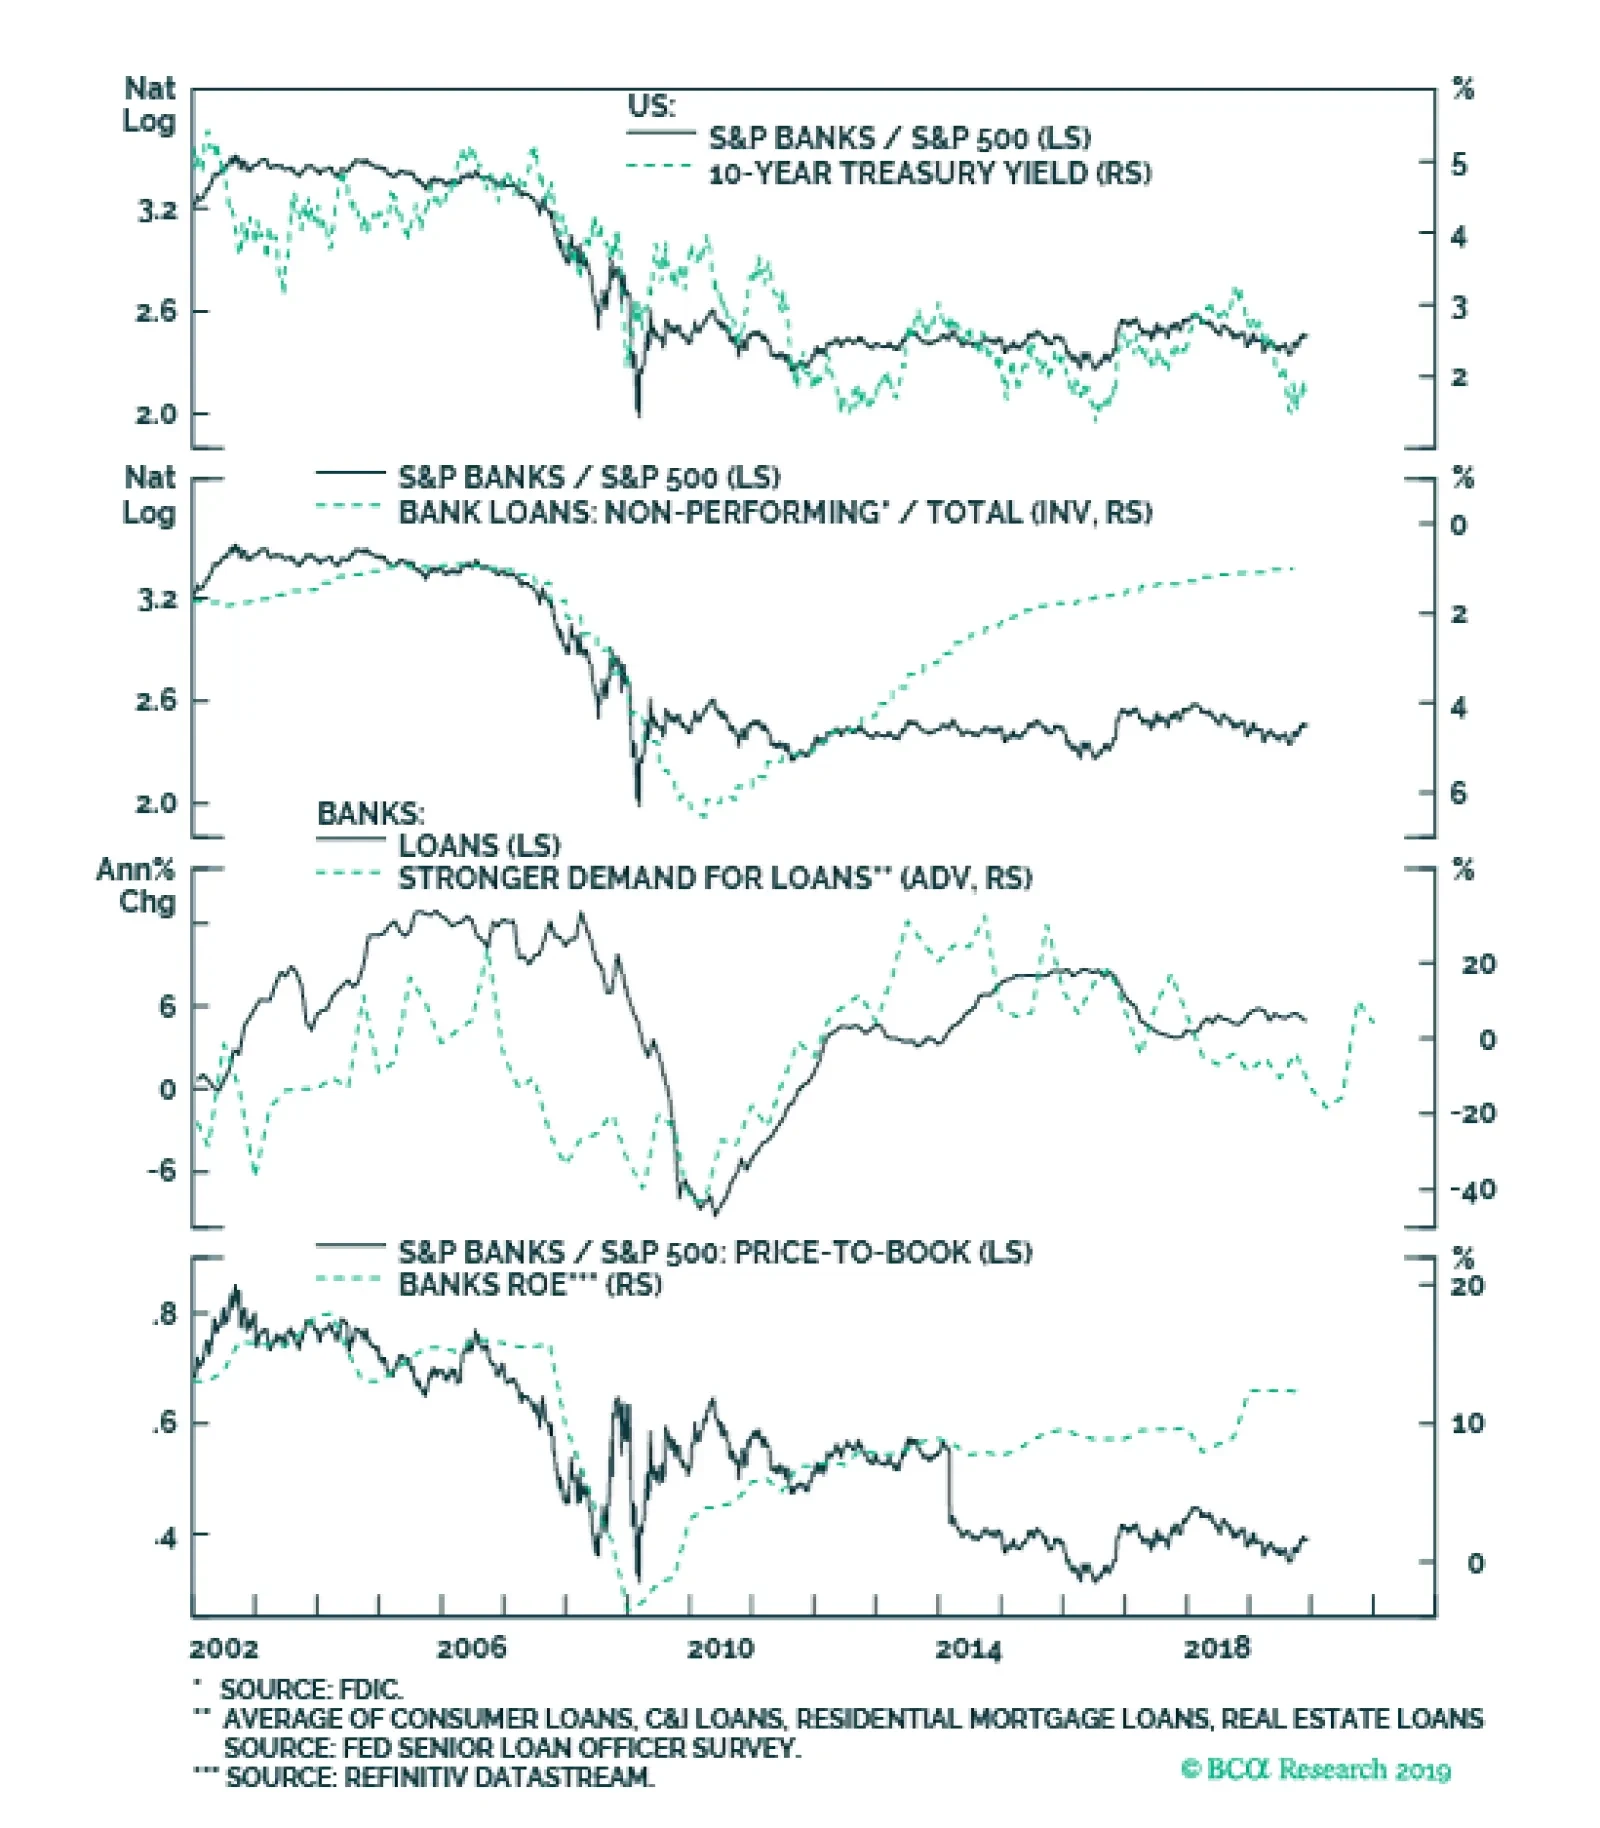
S&P Banks (Overweight) The expected price of credit, still pristine credit quality, and a looming reacceleration in credit growth all argue for including the S&P banks index in our high-conviction overweight list. Banks stocks troughed in mid-August, sniffing out a sell-off in the bond market. As the bond sell-off gained steam, the bank outperformance phase also caught on fire. BCA’s view for next year calls for a 50-75bps selloff in the 10-year Treasury yield, further boosting the allure of bank equities (top panel, Chart 9). Beyond the rising price of credit, credit growth is another key industry profit driver. Importantly, the latest Fed Senior Loan Officer Survey painted a bright picture on both the demand and supply of credit. In more detail, bankers reported that a rising number of credit categories reversed course and demand for loans slingshot higher. The upshot is that bank credit growth will likely reaccelerate in the first half of 2020 (third panel, Chart 9). Finally, credit quality, the third key bank profit driver, is also emitting a positive signal. While a few loan categories have deteriorated recently in absolute terms, as percentage of loans outstanding, credit quality remains pristine. Despite all this enticing news, bank valuations remain anchored near rock bottom levels and a resurgent ROE is signaling that there is a long runway ahead for relative bank valuations (bottom panel, Chart 9). The ticker symbols for the stocks in this index are: BLBG: S5BANKX – WFC, JPM, BAC, C, USB, PNC, BBT, STI, MTB, FITB, CFG, RF, KEY, HBAN, CMA, ZION, PBCT, SIVB, FRC. Chart 9S&P Banks
S&P Banks
S&P Banks
Long Large Caps/Short Small Caps (Overweight) The large cap size bias is our sole hold out from last year’s high-conviction list despite getting stopped out and booking a handsome 9% profit. Today we recommend reinstating a large cap size bias. This call actually represents a slight hedge on BCA’s overall higher interest rates view for next year. Financials comprise 13% of the SPX, but the weight jumps to 18% in small cap indexes. Thus, if the rising interest view is off the mark, the large cap bias will provide an offset. Relative forward profit growth favors mega caps and by a wide margin. One key factor underpinning this increasing profit gap is the massive profit margin divergence (Chart 10). Tack on the fact that index providers omit negative forward profits from their index EPS calculations and the narrative that small caps have cheapened versus large caps falls flat on an adjusted basis. Why? Because a large number of small caps have negative forward EPS. Moreover, we recently created a relative employment proxy that is firing on all cylinders. Not only is the small business labor market crumbling according to the latest NFIB survey, but hard data also suggest that nonfarm private small business payroll employment has ground to a halt. Finally, small caps are debt saddled compared with large caps and small cap b/s have actually been degrading of late (Chart 10). Chart 10Long Large Caps/Short Small Caps
Long Large Caps/Short Small Caps
Long Large Caps/Short Small Caps
S&P Homebuilding (Underweight) We downgraded homebuilders to underweight in late-October, and today we are adding it to our high-conviction underweight call list. Most, if not all, positive profit drivers are already reflected in relative share prices. Specifically, the drubbing in interest rates has been more than accounted for by the year-to-date outperformance in homebuilders. Now that interest rates are moving in reverse, more pain lies ahead for the S&P homebuilding index (Chart 11). Worrisomely, consumers’ expectations to purchase a new home plunged anew last month according to The Conference Board’s survey, and that demand softness will weigh on housing starts and ultimately homebuilding revenues (Chart 11). Adding insult to injury, new house selling prices are losing ground to existing home prices, but such discounting is no longer boosting volumes as new home sales market share gains have stalled. Already, S&P homebuilding sales are contracting and the risk is that deflation gets entrenched in this construction industry (Chart 11). Simultaneously, lumber prices are gaining steam and coupled with contracting new home prices signal that homebuilding profits will suffer a setback. The ticker symbols for the stocks in this index are: BLBG – S5HOME – DHI, LEN, PHM, NVR. Chart 11S&P Homebuilding
S&P Homebuilding
S&P Homebuilding
S&P Semi Equipment (Underweight) While year-to-date chip equipment stocks are the best performing index in the SPX, we deem them a mania, and include them in our high-conviction underweight basket for 2020. The top panel of Chart 12 shows this irrational exuberance that has permeated the semi equipment universe is similar to the dotcom era excesses. Back in the late-1990s relative profit growth was sky high, but today it is flirting with the zero line, warning that gravity will pull these stocks back down to earth (second panel, Chart 12). The contracting ISM manufacturing survey signals that relative share price momentum running at a breakneck pace is unwarranted. The same holds true for relative forward profit and revenue growth expectations, especially given the ongoing contraction in global semi sales (middle panel, Chart 12). This deficient demand for semis and therefore semi equipment manufacturers is also apparent in deflating DRAM prices, our industry pricing power proxy. Historically, relative profit expectations and pricing power have moved in lockstep and the current message is to fade sell-side analysts’ buoyancy. Net earnings revisions have slingshot from extreme pessimism to extreme optimism during the past quarter and are vulnerable to disappointment (bottom panel, Chart 12). In sum, lack of profit growth, deficient industry demand, perky valuations and extremely overbought conditions all suggest that the mania in the S&P chip equipment index will likely turn into a panic next year. The ticker symbols for the stocks in this index are: BLBG – S5SEEQ – AMAT, LRCX, KLAC. Chart 12S&P Semi Equipment
S&P Semi Equipment
S&P Semi Equipment
S&P Utilities (Underweight) Heavily indebted utilities are a high-conviction underweight call for next year. · Relative share prices and the 10-year Treasury yield are closely inversely correlated. Now that the risk free asset is having a more competitive yield, investors will likely start to abandon this niche defensive sector. The jury is still out on the final outcome of the Sino-American trade war. However, there has been a decisive change of heart in US exporters and the ISM manufacturing survey’s new export orders subcomponent reflects an, at the margin, improvement in the US/China trade relationship. This bodes ill for safe haven utilities stocks (Chart 13). Utilities command a 19.4 forward P/E multiple representing roughly a 10% premium to the broad market, but their forecast EPS growth rate at 5% trails the SPX by 400bps. Our composite relative Valuation Indicator has surged to one standard deviation above the historical mean, a level typically associated with recession (Chart 13). On the operating front, natural gas prices are contracting at the steepest pace of the past four years, and electricity capacity utilization is in a multi-decade downtrend, warning that the relative profitability will remain under pressure in 2020. The implication is that this crowded trade is at risk of deflating, especially if the breakout in bond yields gains steam as BCA expects. The ticker symbols for the stocks in this index are: BLBG – S5UTIL– PPL, PNW, ATO, PEG, FE, EIX, AEE, SO, SRE, AEP, XEL, DTE, EVRG, WEC, AES, CMS, LNT, ED, NRG, D, AWK, DUK, ETR, EXC, NEE, CNP, NI, ES. Chart 13S&P Utilities
S&P Utilities
S&P Utilities
S&P Real Estate (Underweight) We would refrain from chasing high yielding real estate stocks higher, and instead we are including them in our high-conviction underweight call list for 2020. The commercial real estate (CRE) sector is a bubble candidate that exemplifies this cycle’s excesses. CRE prices sit at roughly two standard deviations above both the historical time trend and the previous cycle’s peak (not shown). Worryingly, CRE demand is waning. Not only our proprietary real estate demand indicator has sunk recently, but also the latest Fed Senior Loan Officer survey revealed that demand for CRE loans remains feeble. Simultaneously, fewer bankers are willing to extend CRE credit according to the same quarterly Fed survey (Chart 14). Occupancy rates have crested and there are increasing anecdotes of credit quality deterioration. As a result, CRE rents are also failing to keep up with inflation which eats into relative cash flow growth prospects. The supply side build up tilts this delicate balance further into deficit. Non-residential construction shows no signs of abating, with multi-family housing starts still running at an historically high rate of roughly 400K/annum (Chart 14). Finally, interest rate related headwinds will also weigh on this high-yielding sector in coming quarters, especially if the selloff in the bond market gains steam as BCA expects. (Chart 14). The ticker symbols for the stocks in this index are: BLBG – S5RLST – AMT, PLD, CCI, SPG, EQIX, WELL, PSA, EQR, AVB, SBAC, O, DLR, WY, VTR, ESS, BXP, CBRE, ARE, PEAK, MAA, UDR, EXR, DRE, HST, REG, VNO, IRM, FRT, KIM, AIV, SLG, MAC. Chart 14S&P Real Estate
S&P Real Estate
S&P Real Estate
Footnotes 1 Please see BCA US Equity Strategy Weekly Report, “Gasping For Air” dated November 18, 2019, available at uses.bcaresearch.com. 2 https://www.cboe.com/micro/impliedcorrelation/impliedcorrelationindicator.pdf 3 Please see BCA The Bank Credit Analyst Monthly Report, “OUTLOOK 2020: Heading Into The End Game” dated November 22, 2019, available at bca.bcaresearch.com. 4 Ibid. Current Recommendations Current Trades Size And Style Views Stay neutral cyclicals over defensives (downgrade alert) Favor value over growth Favor large over small caps (Stop 10%)
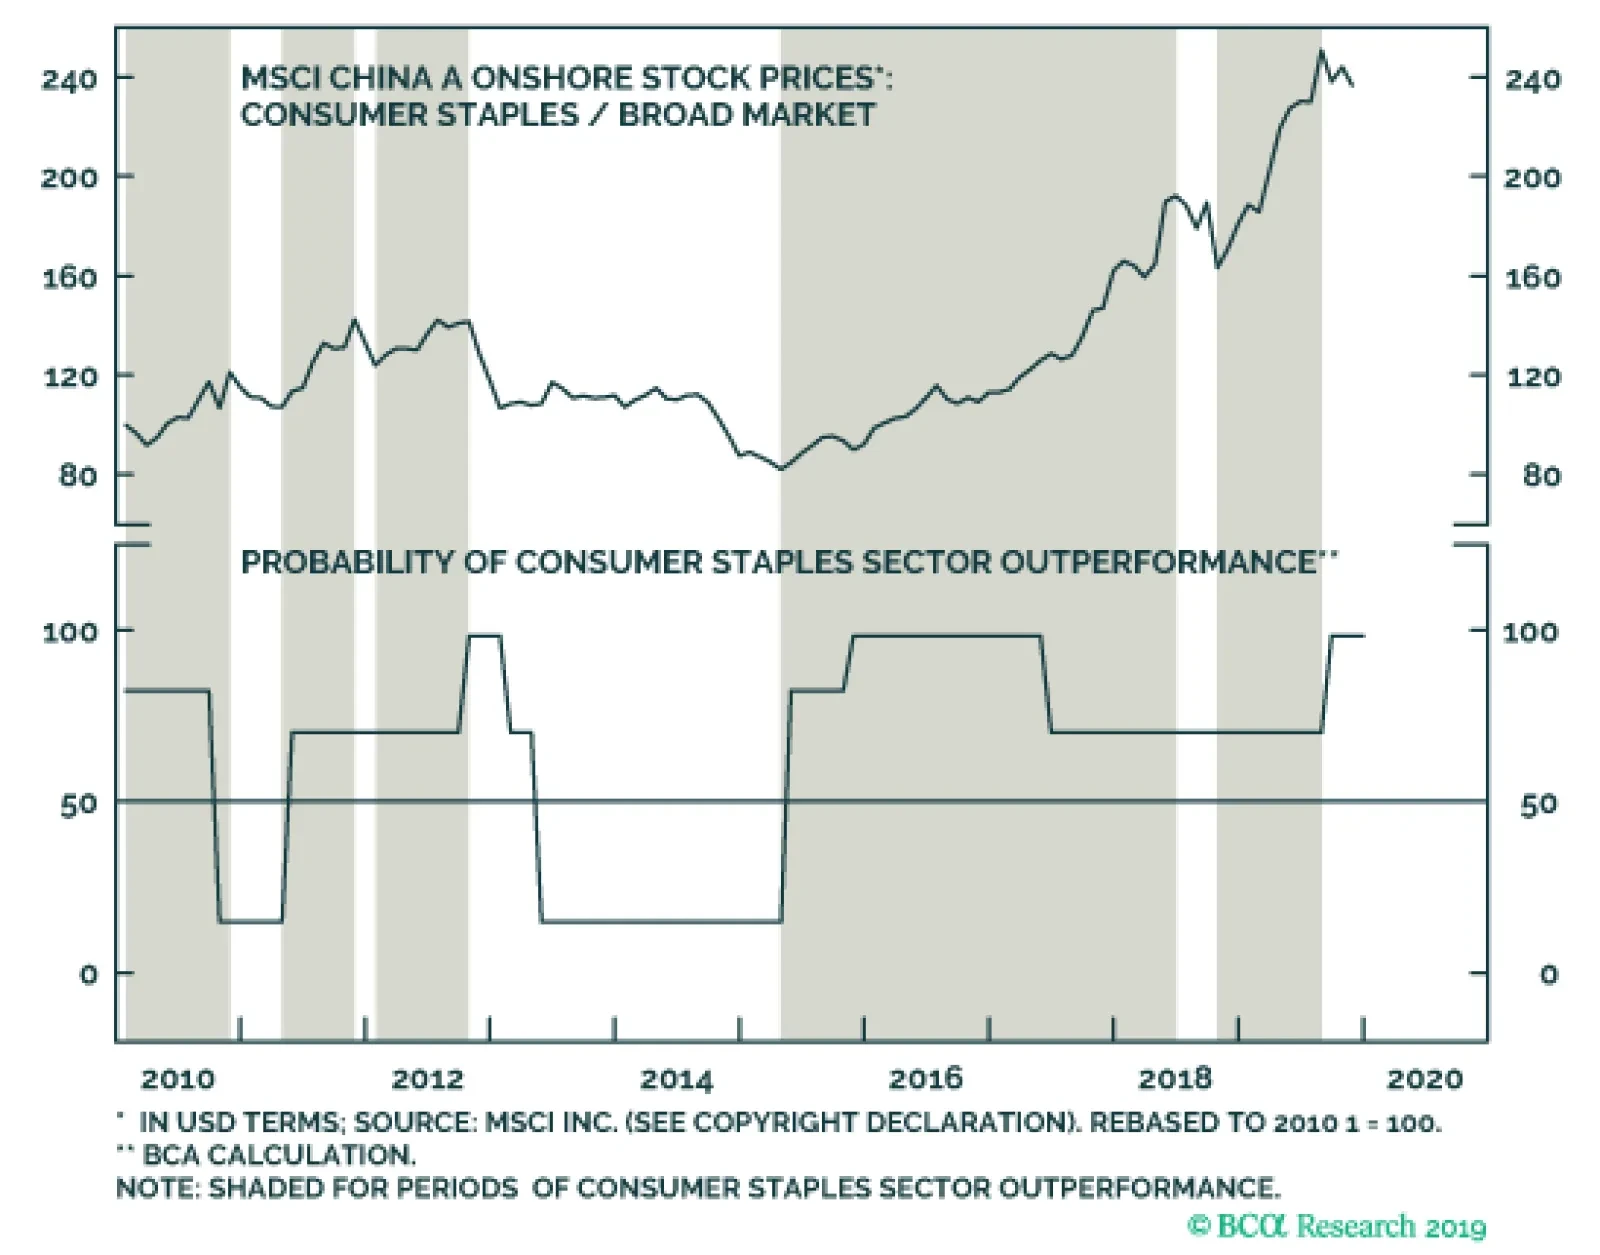
are a defensive sector and the most important determinant of their relative performance is their negative correlation with the broad domestic market EPS. The trend in staples relative earnings closely follows in importance, showing that the tremendous…
Health Care Leading The Pack
Health Care Leading The Pack
Overweight While we were a tad early lifting the broad S&P health care sector to an overweight stance mid-year, quarter-to-date, health care stocks are the best performing GICS1 sector up 10%, besting the SPX by 450bps. Such consistent health care outperformance is significant and we reiterate our overweight stance on this defensive sector. Elizabeth Warren’s moves in the polls are a key driver behind the recent health care stellar returns and we would continue to lean against any increase in her probabilities of both winning the Democratic nomination and the 2020 Presidency (see chart). Importantly, Warren’s toning down of her “Medicare For All” speedy adoption to a more pragmatic phase-in approach over a number of years fueled the stampede into health care stocks in general and managed health care (which we are also overweight) in particular. Bottom Line: Any selloff in health care equities due to Warren’s rise in the polls presents an excellent buying opportunity. Stay overweight the S&P health care sector.