Sectors

Dear Client, Over the past two weeks, I have been in Asia visiting BCA’s clients. Next week’s Report, on November 20 will be a recap of my observations from the road. This week we are sending you a Special Report on global semiconductor stock performance published by our Emerging Markets Strategy service, authored by my colleague Ellen JingYuan He. This Special Report offers great insights on the development of 5G network industry, global demand beyond 5G smartphones, as well as investment implications derived from the research. I hope you find it interesting and insightful. Best regards, Jing Sima, China Strategist Highlights Since early this year, global semiconductor stock prices have been front-running a demand recovery that has not yet begun. There is strong industry optimism surrounding a potential demand boost for semiconductors from the rollout of 5G networks and phones in 2020. Yet we expect actual 2020 Chinese 5G smartphone shipments to fall considerably short of what industry observers expect, especially in the first half of the year. Global semiconductor stocks are over-hyped. Even though momentum could push them higher in the short term, we believe there will be a better entry point in the coming months. Given that Korean semiconductor stocks have lagged, we are upgrading Korean tech stocks and the KOSPI to overweight within the EM equity benchmark. Feature Global semiconductor stock prices have been rallying strongly, increasingly diverging from global semiconductor sales since early January. The former have risen to new highs, while the latter have remained in deep contraction (Chart 1). Chart 1A Puzzle: Semiconductors Stock Prices Skyrocketed When Sales Remain In A Deep Contraction
Global Semiconductor Market: Sales & Share Prices A Puzzle: Semiconductors Stock Prices Skyrocketed When Sales Remain In A Deep Contraction
Global Semiconductor Market: Sales & Share Prices A Puzzle: Semiconductors Stock Prices Skyrocketed When Sales Remain In A Deep Contraction
We are puzzled by such a dramatic divergence between share prices and the industry’s top line. After all, the ongoing contraction in worldwide semiconductor sales has been broad-based across both regions and the majority of top 10 semiconductor companies (Charts 2 and 3). Chart 2A Broad-Based Contraction Across All Regions…
A Broad-Based Contraction Across All Regions...
A Broad-Based Contraction Across All Regions...
Chart 3…And Most Top Semiconductor Companies
...And Most Top Semiconductor Companies
...And Most Top Semiconductor Companies
In our June1 report, we argued that world semiconductor sales would continue to shrink through the remainder of 2019. This view has played out, but global semiconductor share prices have surged and outperformed the global equity benchmark. Global semiconductor stock prices have been front-running a demand recovery that has not yet begun. It seems the market has been looking beyond the current weakness. It currently expects a potential demand boost for semiconductors from 5G phones in 2020 on the back of rising hopes of a US-China trade conflict resolution. Is such hype about 5G network and corresponding shipments justified? Our research leads us to contend that global semiconductor sales will likely post only low- to middle-single-digit growth in 2020, with most of the recovery back loaded in the second half of the year. Hype over 5G phones among industry participants and investors may continue pushing semiconductor share prices higher in the near term. However, the odds are that the reality of tepid semiconductor sales growth will likely set in early next year, and semiconductor stocks will correct considerably. In short, we do not recommend chasing the rally. There will be a better entry point in the months ahead. 5G-Smartphones: The Savior Of Semiconductor Demand? Chart 4Semiconductor Sales Are Still Contracting At A Double-Digit Rate
Strong Global 5G-Smartphone Shipments In 2020?
Strong Global 5G-Smartphone Shipments In 2020?
The primary driver behind the rally in semiconductor share prices is strong optimism among major semiconductor producers and investors about a rapid ramp-up of global 5G-smartphone adoption. In addition, the market is also holding onto a good amount of hope for a US-China trade conflict resolution, which will also facilitate the pace of global 5G deployment. Mobile phones account for the largest share (29%) of global semiconductor revenue. The industry expects strong global 5G-smartphone shipments in 2020 to spur a meaningful recovery in semiconductor demand (Chart 4). Table 1 shows a list of estimates for 2020 global 5G-smartphone shipments by major semiconductor companies, industry analysts and investors, ranging from 120 million to 225 million units, with a mean of 180 million units. Table 1Market Forecasts Of In 2020 Global 5G-Smartphone Shipments
Semiconductor Stocks: Is The 5G Hype Warranted?
Semiconductor Stocks: Is The 5G Hype Warranted?
In particular, Taiwan Semiconductor Manufacturing Company (TSMC), the world’s largest dedicated integrated circuit (IC) foundry, recently almost doubled its forecast for 5G smartphone penetration for 2020 to a mid-teen percentage from a single-digit percentage forecast made just six months ago. Given that global smartphone shipments currently stand at roughly 1.4 billion units per year, a 15% penetration rate would translate into 210 million units of 5G smartphone shipments in 2020. Meanwhile, Qualcomm, the world's largest maker of mobile application processors and baseband modems, last week predicted that 2020 global 5G smartphone shipments will range between 175 million units and 225 million units. We agree that 5G smartphone sales in 2020 will increase sharply from currently very low levels, but we also believe the penetration pace estimated by the industry is optimistic. The basis for our conclusion is as follows: Chart 5So Far, China 5G-Adoption Pace Has Been Much Slower Than Its 4G
So Far, China 5G-Adoption Pace Has Been Much Slower Than Its 4G
So Far, China 5G-Adoption Pace Has Been Much Slower Than Its 4G
5G-smartphone shipments in China will largely determine the pace of worldwide 5G-phone shipments. The country will be the world leader in the 5G smartphone market due to the government’s promotion of it and the advanced 5G technology held by China's largest telecom equipment producer, Huawei. China announced the debut of the 5G-era on June 6. Since then, total 5G-smartphone shipments have been only about 800,000 units through the end of September. In terms of the pace of penetration (5G-smartphone shipments as a share of total mobile phone shipments during the first three months of launch), the rate was a mere 0.3%. In comparison with the debut of the 4G-era in December 2013, shipments of 4G phones in China were significantly larger, and their adoption rate was much faster (Chart 5). During the first three months of the 4G launch, 4G phone shipments were 9.7 million units, reaching 10% of total smartphone shipments. Here are the most important reasons behind what will be a much slower penetration pace for 5G smartphones in China compared with the 4G rollout. We agree that 5G smartphone sales in 2020 will increase sharply from currently very low levels, but we also believe the penetration pace estimated by the industry is optimistic. Market saturation: The Chinese smartphone market has become much more saturated than it was six years ago when 4G was launched. Since then, there have been about 2.3 billion units of 4G smartphones sold, with 1.3 billion units sold in the past three years – nearly equaling the total Chinese population. This means the replacement need in China is low. High prices: 5G smartphones in China are currently much more expensive than 4G ones. 5G phone prices range from RMB 4000-7000 in China, while most of the 4G ones sell within the range of RMB 1000-3000. According to data from QuestMobile, a professional big data intelligence service provider in China's mobile internet market, in the first half of 2019, about 41% of smartphones were sold at RMB 1000-2000, about 30% at RMB 2000-3000, and only 10% at RMB 4000 and above. Functionality: At the moment, except for faster data download/upload speed, 5G smartphones do not offer much more functionality than 4G ones. Back in 2014, 4G phones had much more attractive features than 3G. For example, while 3G smartphones only allowed audio and picture transmission, those with 4G enabled video chatting and high-quality streaming video. In addition, for now, there are very few smartphone apps that can only be used for 5G phones. 5G Infrastructure: Presently, there is only very limited geographical coverage of 5G base stations. The number of 5G base stations is estimated to be 130 thousand units this year, only accounting for 1.6% of total base stations in China. In comparison, 65% of all Chinese base stations are 4G-enabled. Meanwhile, to cover the same region, the number of 5G base stations needs to at least double that of 4G ones. It will take at a minimum two or three years to develop decent coverage of 5G base stations. Besides, the cost of building 5G-enabled infrastructure is much more expensive than the deployment of the 4G ones. There are two types of 5G networks: Non-standalone (NSA) and Standalone (SA). The 5G data transmission speed is significantly faster in SA mode than in NSA mode. However, the deployment cost of the SA network is much higher than the cost for NSA networks, as the latter can be built from existing 4G networks, but the former cannot. Critically, the Chinese government recently announced only SA-compatible 5G smartphones will be allowed to have access to the 5G network in China, starting January 1, 2020. This signals that the focus of future 5G network development will be centered around SA mode instead of this year’s NSA mode. Over 90% of China’s 5G network was NSA mode in 2019. Building a 5G SA network will take longer and cost more. The market expects China to build as much as 1 million units of 5G base stations in 2020. Even if this goal is achieved, it only accounts for about 11% of total Chinese base stations. Chart 6Chinese Smartphone Sales: Still In Contraction
Chinese Smartphone Sales: Still In Contraction
Chinese Smartphone Sales: Still In Contraction
Lack of variety of SA-compatible 5G-phone models. There are also limited options for SA-compatible 5G smartphones models. So far, even though Huawei, Xiaomi, Vivo, Oppo, ZTE and Samsung have all released 5G smartphones, only models from Huawei work under SA networks.2 All others only work under the NSA network. Hence, the variety of SA-compatible 5G phone models is very limited. This will likely delay sales of 5G phones in China. Many more models of SA-compatible 5G smartphones will likely be released only in the second half of next year, which may both drive down 5G smartphone prices and attract more buyers. Consumer spending slowdown: 4G smartphones can meet the needs of the majority of users, and most users have purchased a new phone within the past three years. With elevated economic uncertainty and slowing income growth, a larger proportion of people in China may decide to delay upgrading from 4G-phones to much more expensive 5G ones. This echoes a continuing decline in Chinese smartphone sales (Chart 6). Overall, from Chinese consumers’ perspective, a 5G phone in 2020 will be a nice-to-have, but not a must-have. Given all the aforementioned factors, our best guess for 2020 Chinese 5G smartphone shipments is 40-60 million units, with a larger proportion occurring in the second half of the year. From Chinese consumers’ perspective, a 5G phone in 2020 will be a nice-to-have, but not a must-have. As China is much more aggressive in moving to 5G network adaptation than other large economies, we share industry experts’ forecasts that China will account for 50% of total global 5G shipments. Provided our estimate for China is about 50 million units, our global forecast for 5G phone shipments in 2020 comes to about 100 million units worldwide. This is substantially lower than industry and analyst average estimates of 180 million units (see Table 1 on page 4). Notably, rising 5G smartphone sales will cannibalize some 4G-phone demand. Consequently, aggregate demand for semiconductors will not grow, but the share of high-valued-added chips in the overall product mix will rise. Bottom Line: The penetration pace of 5G smartphones will be meaningfully slower than both the semiconductor producers and analysts expect. Most likely, a meaningful recovery in global aggregate smartphone sales will not occur over the next six months. We suspect the positive impact of 5G phone sales will be felt by global semiconductor producers largely in the second half of 2020. Semiconductor Demand Beyond 5G In terms of end usage, except smartphones, the top five end uses for semiconductors are personal computers (PCs) (12%), servers (11%), diverse consumer products (12%), automotive (10%), and industrial electronics (9%). Structural PC demand is down, but sales have been more or less flat in the past three years (Chart 7). Next year, commercial demand may accelerate as enterprises work through the remainder of their Windows 10 migration. However, household demand is still facing strong competition from tablets. Overall, we expect PC demand to remain stagnant. Global server shipments sank deeper into contraction in the second quarter of this year due to a slowdown in purchasing from cloud providers and hyperscale customers. They may stay in moderate contraction over the next six months as global economic uncertainty remain elevated, which may discourage enterprises’ investment plans (Chart 8). Chart 7Structural PC Demand Is Stagnant And Will Remain So In 2020
Global PCs Sales: Deeply Saturated Structural PC Demand: Remain Stagnant In 2020
Global PCs Sales: Deeply Saturated Structural PC Demand: Remain Stagnant In 2020
Chart 8Global Server Shipments: A Moderate Contraction In 2020
Global Server Shipment: Are In Contraction Global Server Shipments: Moderate Contraction In 2020
Global Server Shipment: Are In Contraction Global Server Shipments: Moderate Contraction In 2020
Chart 9Automotive-Related Semiconductor Demand: A Moderate Growth Ahead
Automotive-Related Semiconductor Demand: A Moderate Growth Ahead
Automotive-Related Semiconductor Demand: A Moderate Growth Ahead
Chinese auto sales – about 30% of the world total – will likely stage a rate-of-change improvement, moving from deep to mild contraction or stagnation over the next six months.3 Increasing penetration of new energy vehicles and continuing 5G deployment may still result in moderate growth in auto-related semiconductor demand (Chart 9). Semiconductor demand from diverse consumer products slightly declined in the third quarter, with robust growth in tablets, eReaders and portable navigation devices, and contraction in all other subsectors including TV sets, gaming, printers and images, cameras and set-top boxes (Chart 10). This may remain in slight contraction or stagnation over the next three to six months. Automation and 5G deployment will likely continue to increase semiconductor sales in the industrial sector (Chart 11). Chart 10Semiconductor Demand From Consumer Products: A Slight Contraction Or Stagnation Ahead
Semiconductor Stocks: Is The 5G Hype Warranted?
Semiconductor Stocks: Is The 5G Hype Warranted?
Chart 11Industrial Semiconductor Demand: More Upside Ahead
Industrial Semiconductor Demand: More Upside Ahead
Industrial Semiconductor Demand: More Upside Ahead
Chart 12Memory Prices Still Signal Sluggish Semiconductor Demand
Memory Prices Still Signal Sluggish Semiconductor Demand
Memory Prices Still Signal Sluggish Semiconductor Demand
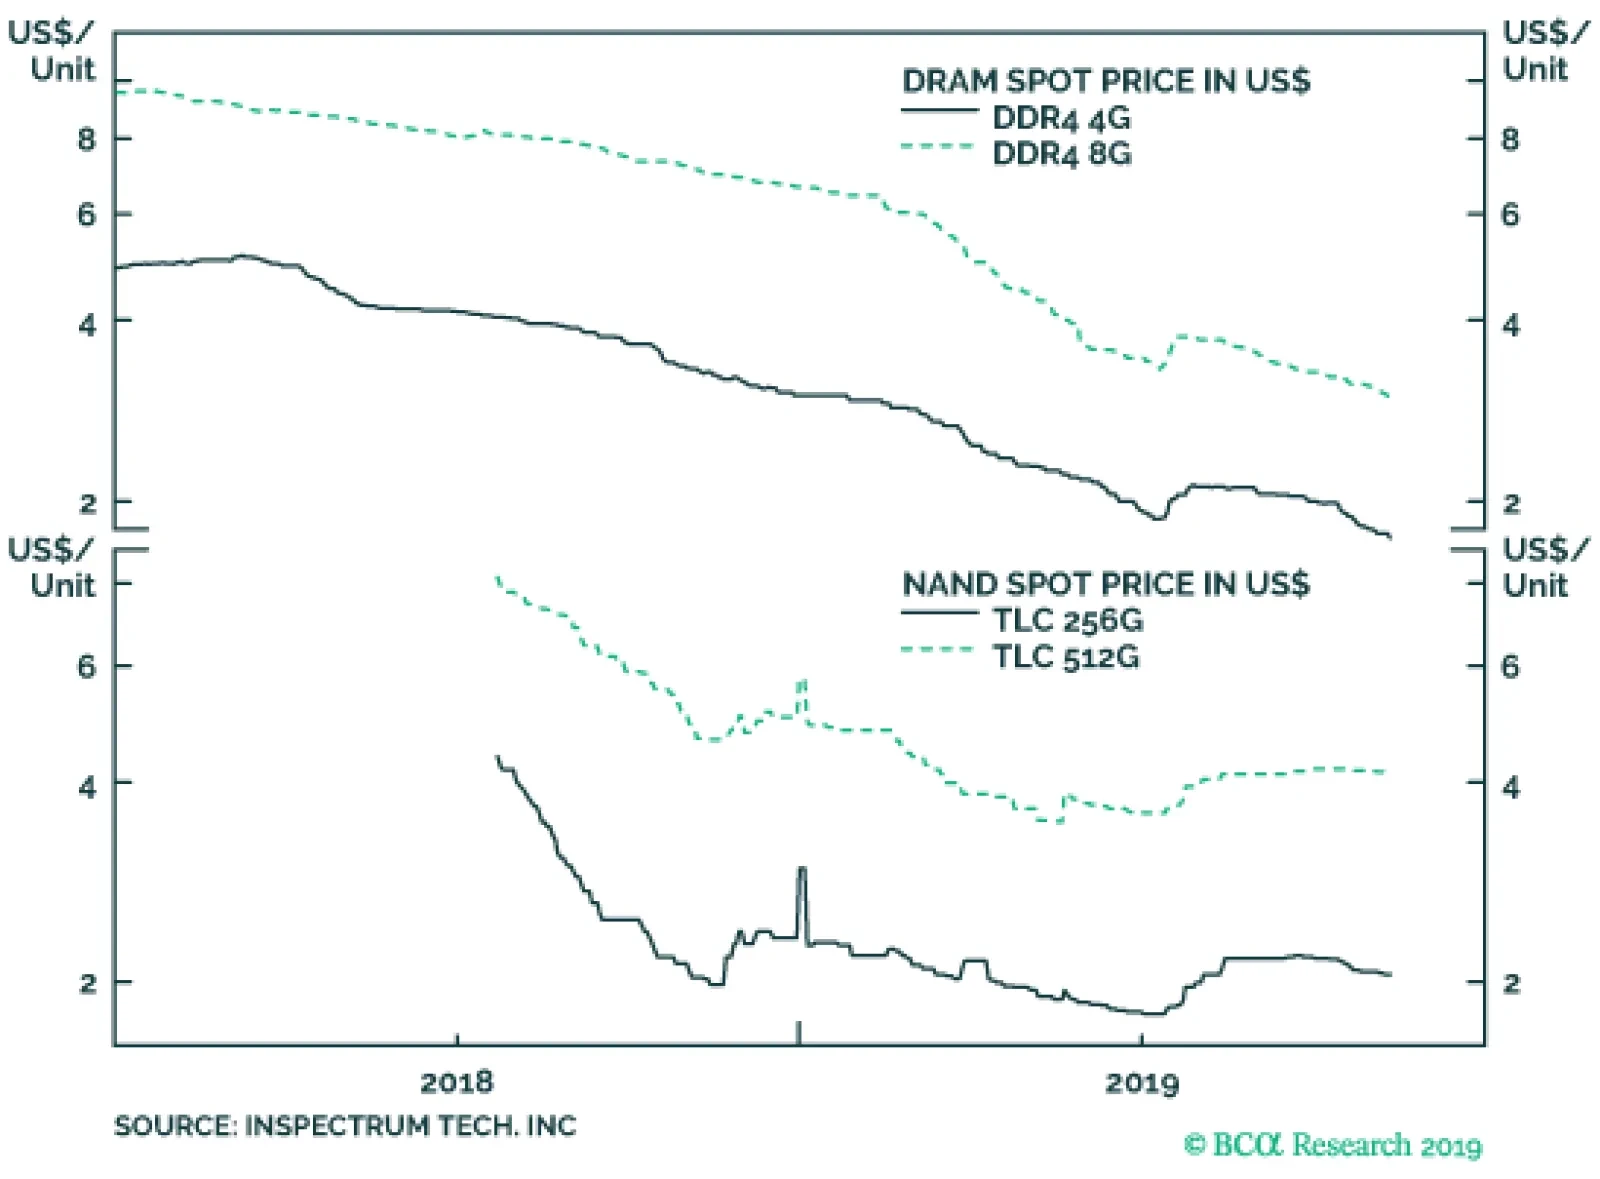
Overall, demand recovery has not yet begun. The lack of price recovery in DRAM prices after 18 months of declines and still-low NAND prices are also signaling sluggish semiconductor demand (Chart 12). Bottom Line: Odds are that global semiconductor demand in sectors other than smartphones will show improvement in terms of rate of change, but will still likely be flat in 2020. TSMC Sales: A Harbinger Of Industry Recovery? TSMC, the world’s biggest semiconductor company, posted a revival in sales over four consecutive months from June to September. Do TSMC sales lead global semiconductor sales? The answer is not always. TSMC sales do not always correlate well with global semiconductor sales (Chart 13). For example, TSMC sales diverged from global semiconductor sales in 2017-‘18 and 2013-‘14. So what are the reasons for strong increase in TSMC sales? First, it reflects market share rotation in the global smartphone market in favor of smartphone producers that use TSMC-fabricated chips. Chart 13TSMC Sales Do Not Always Lead Global Semiconductor Sales
TSMC Sales Do Not Always Lead Global Semiconductor Sales
TSMC Sales Do Not Always Lead Global Semiconductor Sales
Demand from the global smartphone sector contributes to almost half of TSMC’s total revenue. Apple and Huawei are TSMC’s two top customers. The most recent report from market research firm Canalys shows that while Apple’s smartphone shipments declined 7% year-on-year last quarter, Huawei’s shipments soared 29%.4 Combined, smartphone shipments from these two companies still jumped nearly 12% year-on-year in the third quarter of the year. This has increased their market share in the global smartphone market to 31% now from 28% a year ago. Second, rising TSMC sales also reflect market share rotation in the global server market, in particular rising shipments and growing market share of servers using AMD high-performing-computing (HPC) chips instead of Intel ones. AMD’s 7nm Epyc CPU, launched this August and manufactured by TSMC, has been taking share from Intel in the global server market. This has driven the increase in TSMC’s revenue from the HPC sector. Third, the share of value-added products (high-end chips) in TSMC’s product mix has been rising rapidly. TSMC’s share of revenue from 7nm technology jumped from 21% to 27% in the third quarter, as most of Apple’s and Huawei’s chips and all of AMD’s Epyc CPUs are 7nm-based. Back in the third quarter of 2018, TSMC’s 7nm business only accounted for 11% of its total revenue. Chart 14Both TSMC Sales And Taiwanese PMI Could Continue To Improve While Global Semiconductor Sales Remain In Contraction
Both TSMC Sales And Taiwanese PMI Could Continue To Improve While Global Semiconductor Sales Remain In Contraction
Both TSMC Sales And Taiwanese PMI Could Continue To Improve While Global Semiconductor Sales Remain In Contraction
Finally, although internet of things (IoT) and automotive chips only account for 9% and 4% of TSMC’s total share of revenue respectively, strong growth in both segments –33% year-on-year in IoT and 20% year-on-year in automotive – indeed shows exceptional demand in these two sectors in a weakening global economic environment. As IoT and automotive development will highly rely on global 5G infrastructure development, their impact will be meaningful once the global 5G network becomes well advanced and widely installed. To conclude, while a 40% boost in TSMC’s capital spending indeed paints a positive picture on global semiconductor demand over the longer term, rising TSMC sales do not mean an imminent and strong recovery in the global semiconductor sector is in the works. Huawei is the global 5G technology leader and the major supplier in both 5G-network equipment and 5G smartphones; the company will be a major revenue contributor to TSMC. As Huawei will likely place more orders to TSMC for chip fabrication, this will likely result in further improvement in TSMC’s sales (Chart 14). Bottom Line: Rising TSMC sales do not necessarily herald an imminent and robust cyclical recovery in the global semiconductor sector. Investment Conclusions Global semiconductor stock prices have been front running a recovery that has not yet begun. In addition, there is still uncertainty about the technology aspect of US-China trade negotiations. The US will likely continue to have Huawei and other Chinese high-tech companies on its trade-ban list – its so-called Entity List. TSMC sales do not always correlate well with global semiconductor sales. Notably, global semiconductor sales and profits are still in deep contraction, while share prices are at all-time highs (Chart 15). As a result, semiconductor stocks’ multiples have spiked to their previous highs (Chart 16). Chart 15Semiconductor Companies Profits: Still In Deep Contraction
Semiconductor Companies Profits: Still In Deep Contraction
Semiconductor Companies Profits: Still In Deep Contraction
Chart 16Elevated Semiconductor Stocks Multiples
Elevated Semiconductor Stocks Multiples
Elevated Semiconductor Stocks Multiples
While it is common for share prices to rally ahead of a business cycle/profit revival, we believe a true recovery will only emerge in spring 2020, and it will initially be much more subdued than industry watchers and investors expect. In the near term, strong momentum could still push semiconductor stock prices higher. However, the reality will then set in and there will be an air pocket before a more sustainable bull market emerges. Our US Equity Investment Strategy earlier this week downgraded S&P semiconductor equipment companies to underweight and put the S&P Semiconductors Index on a downgrade alert.5 Their newly created top-down semiconductor profit growth model warns that an earnings recovery is not yet imminent (Chart 17). For EM-dedicated equity managers, we have been neutral on Asian semiconductor sectors. We continue to recommend a market-weight allocation to Taiwan’s overall market, while we are upgrading the Korean technology sector from a neutral allocation to overweight. Korean semiconductor stocks have rallied much less than their global peers. Hence, the risk of a major relapse is lower. Given that we have been overweight non-tech Korean stocks, upgrading tech stocks to overweight means we will be overweight the KOSPI within the EM equity benchmark (Chart 18). Chart 17Semiconductor Earnings Recovery: Not Imminent
Semiconductor Earnings Recovery: Not Imminent
Semiconductor Earnings Recovery: Not Imminent
Chart 18Upgrade Korean Tech Stocks And Overweight KOSPI Within EM
Upgrade Korean Tech Stocks And Overweight KOSPI Within EM
Upgrade Korean Tech Stocks And Overweight KOSPI Within EM
Meanwhile, we remain long the Bloomberg Asia-Pacific Semiconductor Index and short the S&P 500 Semiconductor Index. This trade has produced a 7% gain since its initiation on June 13, 2019. The Bloomberg Asia-Pacific Semiconductor index has 12 stocks. Samsung and TSMC account for 38% and 37% of the index, respectively. The S&P 500 Semiconductor Index has 13 stocks. Intel, Broadcom, Texas Instruments and Qualcomm are the top five constituents, together accounting for nearly 77% of the index. Although the US and China may reach a temporary trade deal, the US will continue to restrict sales of tech products and high-end semiconductors to China. As a result, these US semiconductor companies, most of which are IC designing companies, will likely experience a more subdued than expected recovery in sales. Ellen JingYuan He Associate Vice President ellenj@bcaresearch.com Footnotes 1 Please see Emerging Markets Strategy Special Report "The Global Semiconductor Sector: Is A Cyclical Upturn Imminent?" dated June 13, 2019, available at ems.bcaresearch.com 2 https://www.guancha.cn/ChanJing/2019_09_21_518748.shtml http://www.cac.gov.cn/2019-10/23/c_1573361796389322.htm 3 Please see Emerging Markets Strategy Special Report "Chinese Auto Demand: Time For A Recovery?" dated October 17, 2019, available at ems.bcaresearch.com 4 https://www.canalys.com/analysis/smartphone+analysis 5 Please see US Equity Strategy Special Report "Defying Gravity," dated November 4, 2019, available at uses.bcaresearch.com Cyclical Investment Stance Equity Sector Recommendations
In terms of end usage, except smartphones, the top five end uses for semiconductors are personal computers (PCs) (12%), servers (11%), diverse consumer products (12%), automotive (10%), and industrial electronics (9%). Structural PC demand is down, but…
Energy stocks have come full circle and are trading at levels last seen two decades ago when WTI oil was fetching less than half of today’s $55/bbl price. Encouragingly, there seems to be long-term support for relative share prices at the current overly…
The Lion King
The Lion King
Overweight Consumer data has taken a hit in the past quarter as the University of Michigan, ISM and NFIB surveys all fired warning shots. However, we are still compelled to stick with our overweight S&P movies & entertainment call for three reasons. First, Disney’s most recent earnings release revealed healthy consumer demand in the entertainment industry (middle panel) as the company’s major titles for the quarter delivered solid performance. Second, we expect that the industry’s competitive pricing will prove to be a shield against softening consumer data. As a reminder Disney’s streaming service, that gets launched this week, is priced to capture a larger audience, thus volume gains should offset price concessions. Finally, as we have argued in the past, more than one streaming services can flourish, underscoring that NFLX will not necessarily drift into oblivion. Bottom Line: We reiterate our overweight S&P movies & entertainment call. The ticker symbols for the stocks in this index are: BLBG: S5MOVI – DIS, NFLX, VIAB.
Highlights Portfolio Strategy Depressed technicals, compelling valuations, macro tailwinds, improving operating fundamentals and the messages from our relative profit growth models and relative Cyclical Macro Indicators all signal that the time is ripe to initiate a long energy/short utilities pair trade. Pricey valuations, overbought technicals, the sell-off in the bond market and weak profit fundamentals, all warrant an underweight stance in the S&P utilities sector. Recent Changes Initiate a long S&P Energy/short S&P Utilities pair trade today. Table 1
Why The SPX Does Not Resemble The Late-Nineties
Why The SPX Does Not Resemble The Late-Nineties
Feature Equities propelled to uncharted territory, celebrating an easy Fed and the US/China détente with a hint of a tariff rollback, overcoming the seasonally difficult months of September and October. Historically, investors chase performance during the end of the year and seasonality will likely favor further flows into equities in the last two months of the year. On the economic front, while manufacturing remains in recession, a resilient labor market is providing a significant offset allaying fears of recession gripping the broad economy. Drilling deeper on the labor front is revealing. The unemployment rate ticked higher to 3.6% last month based on the household survey as the participation rate increased. However, according to the Sahm Rule Recession Indicator (SRRI), courtesy of Fed economist Claudia R. Sahm,1 were the unemployment rate to average 4% for three consecutive months by September 2020, the US economy will enter recession. In other words, based on empirical evidence the SRRI shows that when the three-month average unemployment rate has jumped by 50bps compared with previous twelve month low, the US has entered recession 100% of the time since the end of WWII (Chart 1). Chart 1Watch The Sahm Rule Recession Indicator
Watch The Sahm Rule Recession Indicator
Watch The Sahm Rule Recession Indicator
Meanwhile, the parallels drawn with the mid-to-late 1990s and the current market backdrop have mushroomed, but our view is that the differences could not be wider. Since the history of our reconstructed SPX data going back to the late-1920s, there has never been a five-year period when the S&P 500 rose by at least 20% every year except for the 1995-1999 era. In that five-year period the SPX soared more than threefold, increasing annually by 34%, 20%, 31%, 27% and 20%, respectively. Investors forget that those were manic markets and despite a high and rising fed funds rate that peaked at 6.5% in early 2000 (real rates were over 4%), the forward P/E multiple went to the stratosphere ignoring theory and defying logic (Chart 2). Putting the late-1990s exuberance into perspective is instructive: if 1995 is similar to 2016 (and 1998 is similar to 2019) then the SPX should spike to over 6000 by the end of next year! Moving over to economic green shoots, we turn our attention to the signal the emerging markets are emitting. While both the EM and the Chinese manufacturing PMIs are expanding smartly, leading indicators suggest that the recovery may be running on empty. Chart 2One Of A Kind
One Of A Kind
One Of A Kind
Chart 3Mixed Signals
Mixed Signals
Mixed Signals
Chart 3 shows that the Chinese credit impulse is contracting, weighing on EM FX momentum and also signaling that the CAIXIN China manufacturing PMI, that has opened the widest gap with the official China NBS manufacturing PMI since the history of the data, will likely suffer a setback in the coming quarters. In the transportation sector, the Baltic Dry Index is down 33% since the early-September peak and is also losing steam on year-over-year basis, warning that a global trade recovery is skating on thin ice. Moreover, EM sentiment is downbeat. Investor flows into EM equities, according to the most liquid iShares MSCI EM ETF, have been drifting lower since the 2018 peak and have more recently gapped down (bottom panel, Chart 3). Thus, the recent green shoots may prove fleeting. This week we are initiating a new market-neutral pair trade and reiterate our negative view on a niche defensive sector. With regard to US liquidity, that we have been inundated with client requests recently, we highlight our simple liquidity indicator: industrial production (IP) growth versus M2 money supply growth. In other words, we gauge how fast a unit of currency is translated into IP. Chart 4 highlights that IP/M2 is contracting at an accelerating pace, heralding further earnings growth pain for the S&P 500. US dollar based liquidity is also contracting as we showed in last week’s US Equity Strategy Webcast slides. Chart 4Clogged Pipelines Weighing On Profit Growth
Clogged Pipelines Weighing On Profit Growth
Clogged Pipelines Weighing On Profit Growth
Other SPX profit indicators we track continue to suggest that the earnings soft patch is not out of the woods yet (we use forward EBITDA estimates to gauge trend growth, which excludes the one time fiscal easing boost to net EPS). Net forward EBITDA revisions are below zero, the ISM manufacturing new orders-to-inventories ratio has fallen 40% from the 2018 peak and is hovering near parity, momentum in the key ISM manufacturing new orders subcomponent is contracting and BCA’s boom/bust indicator continues to deflate. All of this, suggests that a turnaround in profits remains elusive and is a first half of 2020 outcome, at the earliest (Chart 5). Already, Q4/2019 profit growth estimates have now sunk into negative territory according to the latest FactSet data.2 Finally, the Fed released the last Senior Loan Officer Survey of the year in the past week and demand for C&I loans collapsed. This data series has broken below the 2016 trough and warns that C&I credit origination will continue to contract. Chart 5No Pulse
No Pulse
No Pulse
Chart 6Capex Contraction Dampens Need For Credit
Capex Contraction Dampens Need For Credit
Capex Contraction Dampens Need For Credit
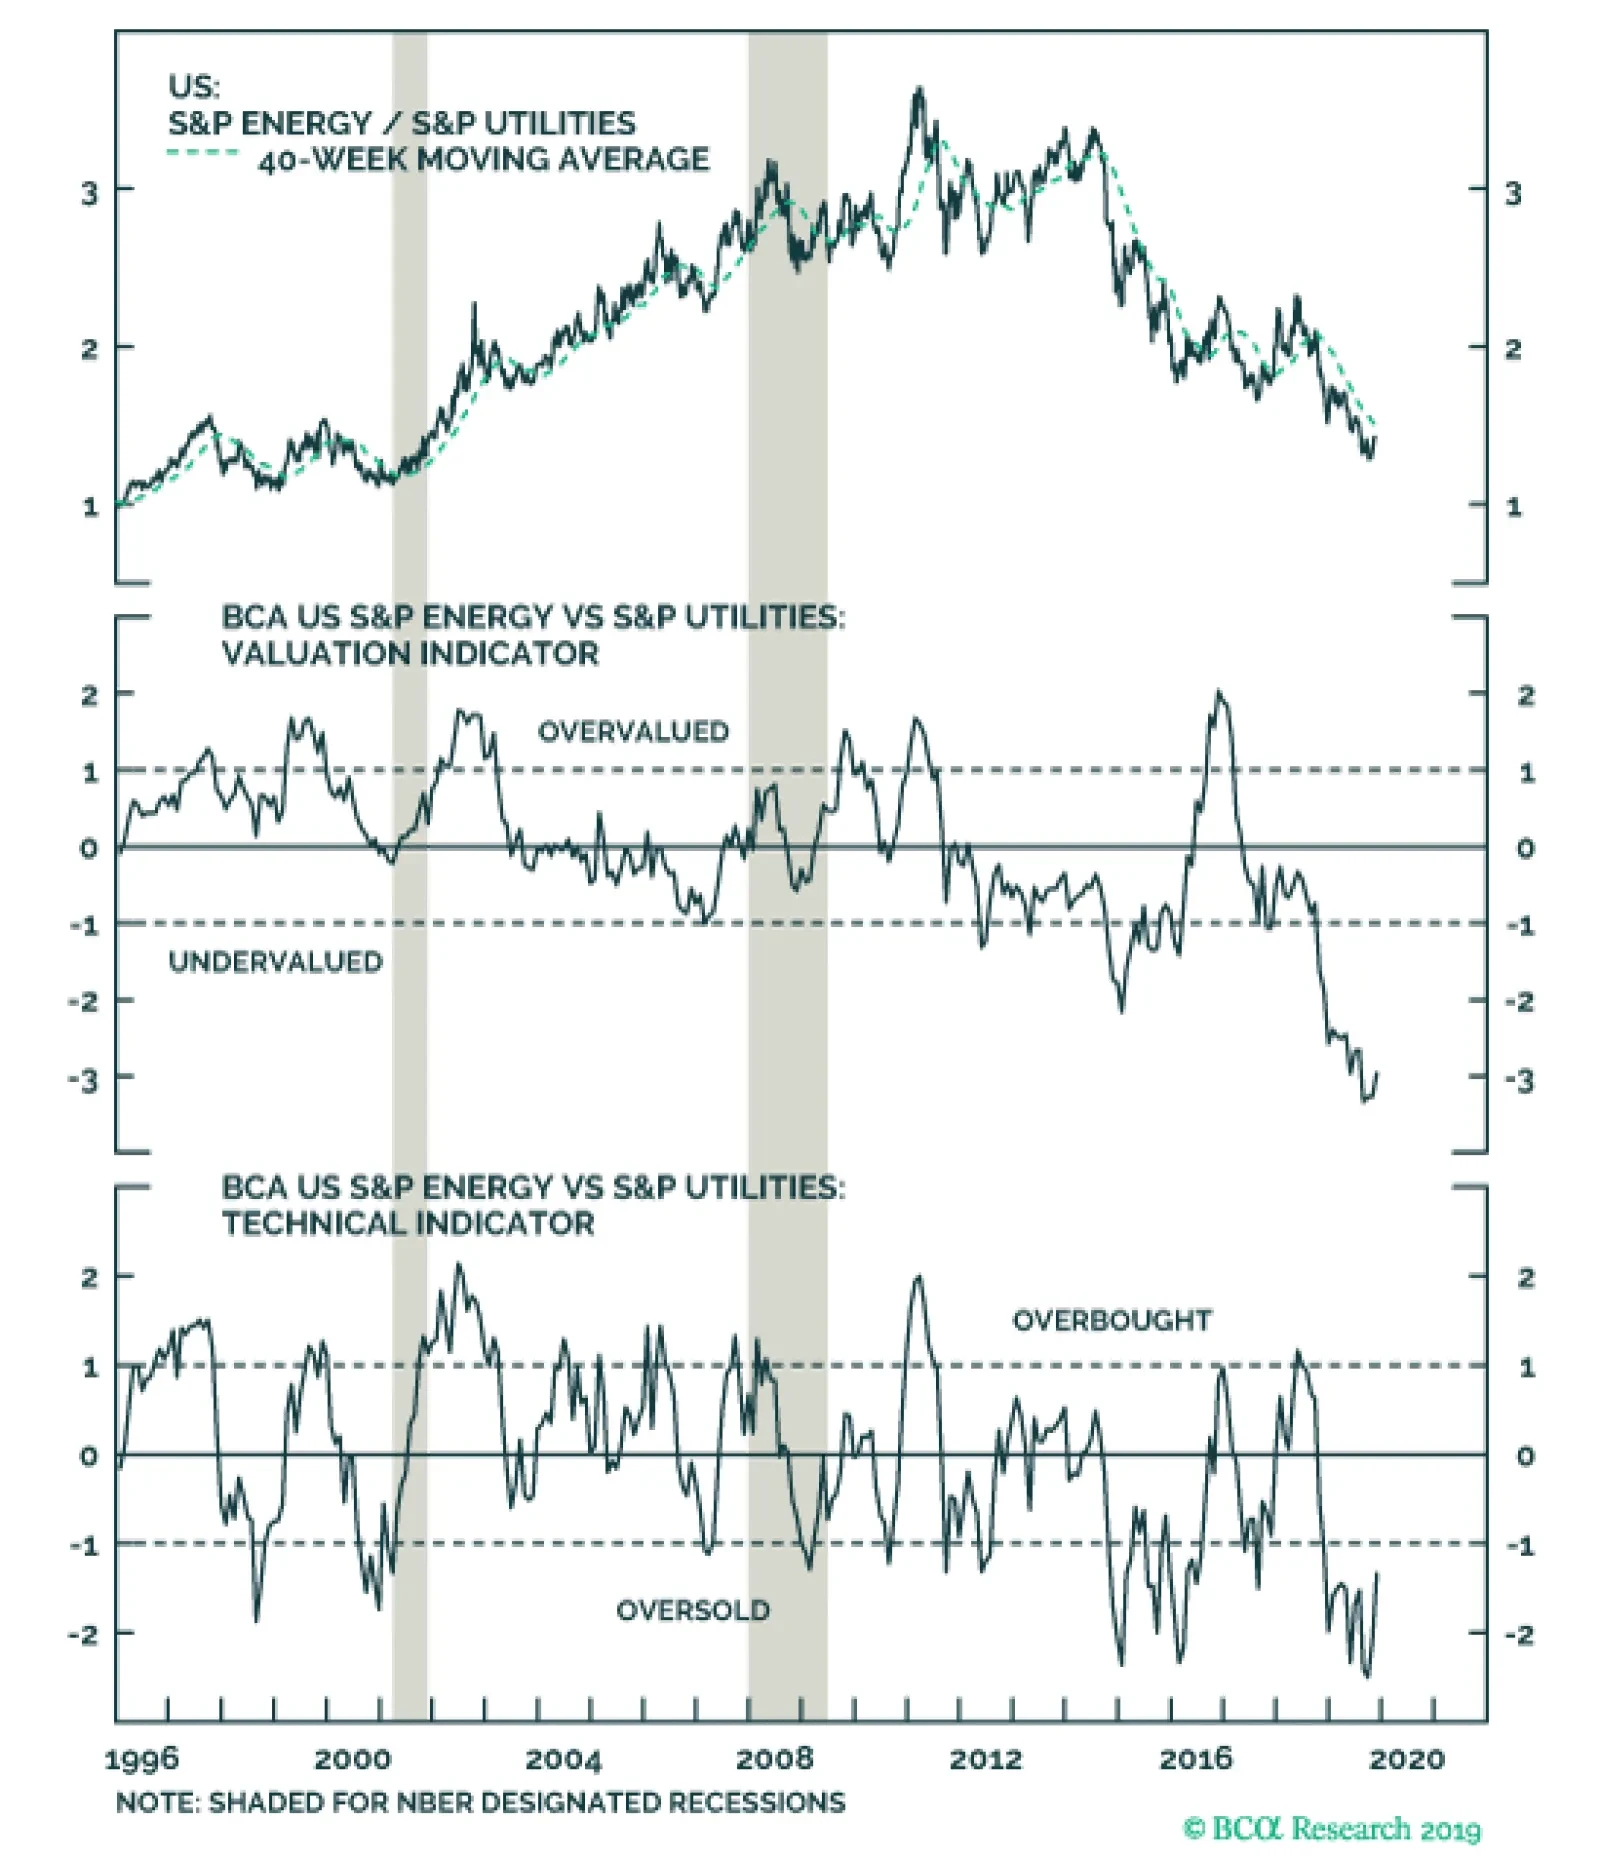
Such a souring backdrop makes intuitive sense as animal spirits have died down courtesy of the Sino-American trade war. CEO’s are still voting with their feet and are canceling/postponing capital outlays. Absent capex, C&I credit demand runs aground (Chart 6). It remains unclear if a US/China “phase one” trade deal including tariff rollbacks can reverse the ongoing global trade contraction, signaling that caution is still warranted on the prospects of the broad equity market for the next 9-12 months. This week we are initiating a new market-neutral pair trade and reiterate our negative view on a niche defensive sector. Long/Short Idea: Buy Energy/Sell Utilities There is an exploitable opportunity in going long the S&P energy sector/short the S&P utilities sector and we recommend initiating this market-neutral trade today. The top panel of Chart 7 shows that energy stocks have come full circle and are trading at levels last seen two decades ago when WTI oil was fetching less than half of today’s $55/bbl price. Encouragingly, there seems to be long-term support for relative share prices at the current overly depressed level. While utilities have been making headlines all year long given their outperformance, when put in proper perspective this niche defensive sector with a mere 3% weight in the SPX looks like a shipwreck (bottom panel, Chart 7). Taken together, this battle between two diminishing sectors presents a tradable opportunity by favoring energy stocks at the expense of utilities. In fact, this ratio trades at more than two standard deviations below the historical uptrend, and thus offers a lucrative risk/reward profile (Chart 8). Chart 7Buy Energy…
Buy Energy…
Buy Energy…
Chart 8…At The Expense Of Utilities
…At The Expense Of Utilities
…At The Expense Of Utilities
Beyond depressed technicals and compelling overall valuations with an alluring relative dividend yield (investors are paid an unprecedented 100bps in dividend yield carry to put on this trade, Chart 9), macro tailwinds, improving operating fundamentals, and the messages from our relative profit growth models and relative Cyclical Macro Indicators (CMI), all signal that the time is ripe to initiate a long energy/short utilities pair trade. On the macro front, inflation expectations have tentatively troughed and if oil rebounds further, as our Commodity & Energy Strategy service expects, then given their tight positive correlation with oil prices, rising inflation expectations should put a definitive floor under the relative share price ratio (Chart 10). Chart 9Unloved And Oversold
Unloved And Oversold
Unloved And Oversold
Chart 10Return Of Inflation…
Return Of Inflation…
Return Of Inflation…
However, the real interest rate component (i.e. growth) also explains roughly half of the selloff in the 10-year Treasury yield since early September, which also moves in lockstep with relative share price momentum (bottom panel, Chart 10). Were this budding global growth recovery to gain steam into the first half of 2020, then energy profits would outshine utility sector profits. As a reminder, oil is a global growth barometer and rises with increasing global growth while defensive utilities flourish when growth sputters (Chart 11). The US dollar’s recent appreciation has also dealt a blow to this trade and a grinding lower currency which is synonymous with a modest global growth recovery would also reverse this pair trade’s fortunes (top two panels, Chart 12). Chart 11…And Green Shoots Beneficiary
…And Green Shoots Beneficiary
…And Green Shoots Beneficiary
Chart 12Operating Metrics Also…
Operating Metrics Also…
Operating Metrics Also…
Zooming into the relative operating outlook, the bottom panel of Chart 12 shows that oil price inflation is outpacing natural gas selling prices. This relative underlying commodity backdrop is important as energy stocks move with the ebbs and flows of the oil market, whereas the marginal price setter for utility services is natural gas prices. The upshot is that heading into 2020, bombed out relative share prices should play catch up to the firming relative commodity backdrop. Capital spending outlays also favor energy shares over utilities stocks (top two panels, Chart 13). Surprisingly, the utilities sector net debt-to-EBITDA ratio is above 5x, waving a red flag, but energy indebtedness is coming down fast in the aftermath of the early 2016 oil price collapse and the energy sector’s net debt-to-EBITDA ratio is close to 2x (bottom panel, Chart 13). Our relative CMIs and relative profit growth models do an excellent job capturing all these moving parts and are unanimously sending a bullish message that an earnings-led recovery is in store for the relative share price ratio (Chart 14). Chart 13…Favor Energy Over Utilities
…Favor Energy Over Utilities
…Favor Energy Over Utilities
Chart 14Green Light From US Equity Strategy Models
Green Light From US Equity Strategy Models
Green Light From US Equity Strategy Models
Bottom Line: Initiate a long S&P energy/short S&P utilities pair trade today. Out Of Power Warning Utilities stocks have been all the rave this year, but given their small weighting in the SPX they only explain a very small part of the broad market’s run (in contrast, the heavyweight tech sector explains most of the S&P 500’s rise as we highlighted in recent research).3 We reiterate our underweight stance in this small defensive sector that has run way ahead of soft profit fundamentals. Worrisomely, utilities trade with a 20 forward P/E handle and command a 20% premium to the broad market, but their forecast EPS growth rate at 5% trails the SPX by 350bps (not shown). Chart 15 shows that our composite relative Valuation Indicator has surged to one standard deviation above the historical mean, a level typically associated with recession. Technicals are also extended (bottom panel, Chart 15), warning that this crowded trade is at risk of deflating, especially if the breakout in bond yields gains steam. Chart 15Overbought And Overvalued
Overbought And Overvalued
Overbought And Overvalued
In sum, pricey valuations, overbought technicals, the selloff in the bond market and weak profit fundamentals, all warrant an underweight stance in the S&P utilities sector. The top panel of Chart 16 shows that relative share prices and the 10-year Treasury yield are closely inversely correlated. Now that the risk free asset is having a more competitive yield, investors will likely start to abandon this niche defensive sector. Similarly, the recent selloff in the total return bond-to-stock ratio also warns that buying up expensive utilities at the current juncture is fraught with danger (second panel, Chart 16). The jury is still out on the final outcome of the Sino-American trade war. However, there has been a decisive change of heart in US exporters and the ISM manufacturing survey’s new export orders subcomponent reflects an, at the margin, improvement in the US/China trade relationship. This bodes ill for safe haven utilities stocks (new export orders shown inverted, bottom panel, Chart 16). Chart 16Budding Recovery Weighing On Utilities
Budding Recovery Weighing On Utilities
Budding Recovery Weighing On Utilities
Chart 17Sell The Strength
Sell The Strength
Sell The Strength
Turning over to the sector’s operating metrics reveals that investors piling into utilities is unwarranted. Natural gas prices are contracting at the steepest pace of the past four years (middle panel, Chart 17) and signal that the path of least resistance is lower for relative share price momentum. Meanwhile, electricity capacity utilization is in a multi decade downtrend, warning that the relative profitability will remain under pressure in the coming quarters (bottom panel, Chart 17). In sum, pricey valuations, overbought technicals, the sell-off in the bond market and weak profit fundamentals, all warrant an underweight stance in the S&P utilities sector. Bottom Line: Shy away from the expensive S&P utilities sector. The ticker symbols for the stocks in this index are: BLBG – S5UTIL– PPL, PNW, ATO, PEG, FE, EIX, AEE, SO, SRE, AEP, XEL, DTE, EVRG, WEC, AES, CMS, LNT, ED, NRG, D, AWK, DUK, ETR, EXC, NEE, CNP, NI, ES. Anastasios Avgeriou US Equity Strategist anastasios@bcaresearch.com Footnotes 1 https://www.federalreserve.gov/econres/claudia-r-sahm.htm 2 https://insight.factset.com/sp-500-now-projected-to-report-a-year-over-year-decline-in-earnings-in-q4-2019 3 Please see BCA US Equity Strategy Insight Report, “Deciphering Sector Returns” dated August 30, 2019, available at uses.bcaresearch.com. Current Recommendations Current Trades Size And Style Views Stay neutral cyclicals over defensives (downgrade alert) Favor value over growth Favor large over small caps (Stop 10%)
Highlights Since early this year, global semiconductor stock prices have been front-running a demand recovery that has not yet begun. There is strong industry optimism surrounding a potential demand boost for semiconductors from the rollout of 5G networks and phones in 2020. Yet we expect actual 2020 Chinese 5G smartphone shipments to fall considerably short of what industry observers expect, especially in the first half of the year. Global semiconductor stocks are over-hyped. Even though momentum could push them higher in the short term, we believe there will be a better entry point in the coming months. Given that Korean semiconductor stocks have lagged, we are upgrading Korean tech stocks and the KOSPI to overweight within the EM equity benchmark. Feature Global semiconductor stock prices have been rallying strongly, increasingly diverging from global semiconductor sales since early January. The former have risen to new highs, while the latter have remained in deep contraction (Chart 1). Chart 1A Puzzle: Semiconductors Stock Prices Skyrocketed When Sales Remain In A Deep Contraction
Global Semiconductor Market: Sales & Share Prices A Puzzle: Semiconductors Stock Prices Skyrocketed When Sales Remain In A Deep Contraction
Global Semiconductor Market: Sales & Share Prices A Puzzle: Semiconductors Stock Prices Skyrocketed When Sales Remain In A Deep Contraction
We are puzzled by such a dramatic divergence between share prices and the industry’s top line. After all, the ongoing contraction in worldwide semiconductor sales has been broad-based across both regions and the majority of top 10 semiconductor companies (Charts 2 and 3). Chart 2A Broad-Based Contraction Across All Regions…
A Broad-Based Contraction Across All Regions...
A Broad-Based Contraction Across All Regions...
Chart 3…And Most Top Semiconductor Companies
...And Most Top Semiconductor Companies
...And Most Top Semiconductor Companies
In our June1 report, we argued that world semiconductor sales would continue to shrink through the remainder of 2019. This view has played out, but global semiconductor share prices have surged and outperformed the global equity benchmark. Global semiconductor stock prices have been front-running a demand recovery that has not yet begun. It seems the market has been looking beyond the current weakness. It currently expects a potential demand boost for semiconductors from 5G phones in 2020 on the back of rising hopes of a US-China trade conflict resolution. Is such hype about 5G network and corresponding shipments justified? Our research leads us to contend that global semiconductor sales will likely post only low- to middle-single-digit growth in 2020, with most of the recovery back loaded in the second half of the year. Hype over 5G phones among industry participants and investors may continue pushing semiconductor share prices higher in the near term. However, the odds are that the reality of tepid semiconductor sales growth will likely set in early next year, and semiconductor stocks will correct considerably. In short, we do not recommend chasing the rally. There will be a better entry point in the months ahead. 5G-Smartphones: The Savior Of Semiconductor Demand? Chart 4Semiconductor Sales Are Still Contracting At A Double-Digit Rate
Strong Global 5G-Smartphone Shipments In 2020?
Strong Global 5G-Smartphone Shipments In 2020?
The primary driver behind the rally in semiconductor share prices is strong optimism among major semiconductor producers and investors about a rapid ramp-up of global 5G-smartphone adoption. In addition, the market is also holding onto a good amount of hope for a US-China trade conflict resolution, which will also facilitate the pace of global 5G deployment. Mobile phones account for the largest share (29%) of global semiconductor revenue. The industry expects strong global 5G-smartphone shipments in 2020 to spur a meaningful recovery in semiconductor demand (Chart 4). Table 1 shows a list of estimates for 2020 global 5G-smartphone shipments by major semiconductor companies, industry analysts and investors, ranging from 120 million to 225 million units, with a mean of 180 million units. Table 1Market Forecasts Of In 2020 Global 5G-Smartphone Shipments
Semiconductor Stocks: Is The 5G Hype Warranted?
Semiconductor Stocks: Is The 5G Hype Warranted?
In particular, Taiwan Semiconductor Manufacturing Company (TSMC), the world’s largest dedicated integrated circuit (IC) foundry, recently almost doubled its forecast for 5G smartphone penetration for 2020 to a mid-teen percentage from a single-digit percentage forecast made just six months ago. Given that global smartphone shipments currently stand at roughly 1.4 billion units per year, a 15% penetration rate would translate into 210 million units of 5G smartphone shipments in 2020. Meanwhile, Qualcomm, the world's largest maker of mobile application processors and baseband modems, last week predicted that 2020 global 5G smartphone shipments will range between 175 million units and 225 million units. We agree that 5G smartphone sales in 2020 will increase sharply from currently very low levels, but we also believe the penetration pace estimated by the industry is optimistic. The basis for our conclusion is as follows: Chart 5So Far, China 5G-Adoption Pace Has Been Much Slower Than Its 4G
So Far, China 5G-Adoption Pace Has Been Much Slower Than Its 4G
So Far, China 5G-Adoption Pace Has Been Much Slower Than Its 4G
5G-smartphone shipments in China will largely determine the pace of worldwide 5G-phone shipments. The country will be the world leader in the 5G smartphone market due to the government’s promotion of it and the advanced 5G technology held by China's largest telecom equipment producer, Huawei. China announced the debut of the 5G-era on June 6. Since then, total 5G-smartphone shipments have been only about 800,000 units through the end of September. In terms of the pace of penetration (5G-smartphone shipments as a share of total mobile phone shipments during the first three months of launch), the rate was a mere 0.3%. In comparison with the debut of the 4G-era in December 2013, shipments of 4G phones in China were significantly larger, and their adoption rate was much faster (Chart 5). During the first three months of the 4G launch, 4G phone shipments were 9.7 million units, reaching 10% of total smartphone shipments. Here are the most important reasons behind what will be a much slower penetration pace for 5G smartphones in China compared with the 4G rollout. We agree that 5G smartphone sales in 2020 will increase sharply from currently very low levels, but we also believe the penetration pace estimated by the industry is optimistic. Market saturation: The Chinese smartphone market has become much more saturated than it was six years ago when 4G was launched. Since then, there have been about 2.3 billion units of 4G smartphones sold, with 1.3 billion units sold in the past three years – nearly equaling the total Chinese population. This means the replacement need in China is low. High prices: 5G smartphones in China are currently much more expensive than 4G ones. 5G phone prices range from RMB 4000-7000 in China, while most of the 4G ones sell within the range of RMB 1000-3000. According to data from QuestMobile, a professional big data intelligence service provider in China's mobile internet market, in the first half of 2019, about 41% of smartphones were sold at RMB 1000-2000, about 30% at RMB 2000-3000, and only 10% at RMB 4000 and above. Functionality: At the moment, except for faster data download/upload speed, 5G smartphones do not offer much more functionality than 4G ones. Back in 2014, 4G phones had much more attractive features than 3G. For example, while 3G smartphones only allowed audio and picture transmission, those with 4G enabled video chatting and high-quality streaming video. In addition, for now, there are very few smartphone apps that can only be used for 5G phones. 5G Infrastructure: Presently, there is only very limited geographical coverage of 5G base stations. The number of 5G base stations is estimated to be 130 thousand units this year, only accounting for 1.6% of total base stations in China. In comparison, 65% of all Chinese base stations are 4G-enabled. Meanwhile, to cover the same region, the number of 5G base stations needs to at least double that of 4G ones. It will take at a minimum two or three years to develop decent coverage of 5G base stations. Besides, the cost of building 5G-enabled infrastructure is much more expensive than the deployment of the 4G ones. There are two types of 5G networks: Non-standalone (NSA) and Standalone (SA). The 5G data transmission speed is significantly faster in SA mode than in NSA mode. However, the deployment cost of the SA network is much higher than the cost for NSA networks, as the latter can be built from existing 4G networks, but the former cannot. Critically, the Chinese government recently announced only SA-compatible 5G smartphones will be allowed to have access to the 5G network in China, starting January 1, 2020. This signals that the focus of future 5G network development will be centered around SA mode instead of this year’s NSA mode. Over 90% of China’s 5G network was NSA mode in 2019. Building a 5G SA network will take longer and cost more. The market expects China to build as much as 1 million units of 5G base stations in 2020. Even if this goal is achieved, it only accounts for about 11% of total Chinese base stations. Chart 6Chinese Smartphone Sales: Still In Contraction
Chinese Smartphone Sales: Still In Contraction
Chinese Smartphone Sales: Still In Contraction
Lack of variety of SA-compatible 5G-phone models. There are also limited options for SA-compatible 5G smartphones models. So far, even though Huawei, Xiaomi, Vivo, Oppo, ZTE and Samsung have all released 5G smartphones, only models from Huawei work under SA networks.2 All others only work under the NSA network. Hence, the variety of SA-compatible 5G phone models is very limited. This will likely delay sales of 5G phones in China. Many more models of SA-compatible 5G smartphones will likely be released only in the second half of next year, which may both drive down 5G smartphone prices and attract more buyers. Consumer spending slowdown: 4G smartphones can meet the needs of the majority of users, and most users have purchased a new phone within the past three years. With elevated economic uncertainty and slowing income growth, a larger proportion of people in China may decide to delay upgrading from 4G-phones to much more expensive 5G ones. This echoes a continuing decline in Chinese smartphone sales (Chart 6). Overall, from Chinese consumers’ perspective, a 5G phone in 2020 will be a nice-to-have, but not a must-have. Given all the aforementioned factors, our best guess for 2020 Chinese 5G smartphone shipments is 40-60 million units, with a larger proportion occurring in the second half of the year. From Chinese consumers’ perspective, a 5G phone in 2020 will be a nice-to-have, but not a must-have. As China is much more aggressive in moving to 5G network adaptation than other large economies, we share industry experts’ forecasts that China will account for 50% of total global 5G shipments. Provided our estimate for China is about 50 million units, our global forecast for 5G phone shipments in 2020 comes to about 100 million units worldwide. This is substantially lower than industry and analyst average estimates of 180 million units (see Table 1 on page 4). Notably, rising 5G smartphone sales will cannibalize some 4G-phone demand. Consequently, aggregate demand for semiconductors will not grow, but the share of high-valued-added chips in the overall product mix will rise. Bottom Line: The penetration pace of 5G smartphones will be meaningfully slower than both the semiconductor producers and analysts expect. Most likely, a meaningful recovery in global aggregate smartphone sales will not occur over the next six months. We suspect the positive impact of 5G phone sales will be felt by global semiconductor producers largely in the second half of 2020. Semiconductor Demand Beyond 5G In terms of end usage, except smartphones, the top five end uses for semiconductors are personal computers (PCs) (12%), servers (11%), diverse consumer products (12%), automotive (10%), and industrial electronics (9%). Structural PC demand is down, but sales have been more or less flat in the past three years (Chart 7). Next year, commercial demand may accelerate as enterprises work through the remainder of their Windows 10 migration. However, household demand is still facing strong competition from tablets. Overall, we expect PC demand to remain stagnant. Global server shipments sank deeper into contraction in the second quarter of this year due to a slowdown in purchasing from cloud providers and hyperscale customers. They may stay in moderate contraction over the next six months as global economic uncertainty remain elevated, which may discourage enterprises’ investment plans (Chart 8). Chart 7Structural PC Demand Is Stagnant And Will Remain So In 2020
Global PCs Sales: Deeply Saturated Structural PC Demand: Remain Stagnant In 2020
Global PCs Sales: Deeply Saturated Structural PC Demand: Remain Stagnant In 2020
Chart 8Global Server Shipments: A Moderate Contraction In 2020
Global Server Shipment: Are In Contraction Global Server Shipments: Moderate Contraction In 2020
Global Server Shipment: Are In Contraction Global Server Shipments: Moderate Contraction In 2020
Chart 9Automotive-Related Semiconductor Demand: A Moderate Growth Ahead
Automotive-Related Semiconductor Demand: A Moderate Growth Ahead
Automotive-Related Semiconductor Demand: A Moderate Growth Ahead
Chinese auto sales – about 30% of the world total – will likely stage a rate-of-change improvement, moving from deep to mild contraction or stagnation over the next six months.3 Increasing penetration of new energy vehicles and continuing 5G deployment may still result in moderate growth in auto-related semiconductor demand (Chart 9). Semiconductor demand from diverse consumer products slightly declined in the third quarter, with robust growth in tablets, eReaders and portable navigation devices, and contraction in all other subsectors including TV sets, gaming, printers and images, cameras and set-top boxes (Chart 10). This may remain in slight contraction or stagnation over the next three to six months. Automation and 5G deployment will likely continue to increase semiconductor sales in the industrial sector (Chart 11). Chart 10Semiconductor Demand From Consumer Products: A Slight Contraction Or Stagnation Ahead
Semiconductor Stocks: Is The 5G Hype Warranted?
Semiconductor Stocks: Is The 5G Hype Warranted?
Chart 11Industrial Semiconductor Demand: More Upside Ahead
Industrial Semiconductor Demand: More Upside Ahead
Industrial Semiconductor Demand: More Upside Ahead
Chart 12Memory Prices Still Signal Sluggish Semiconductor Demand
Memory Prices Still Signal Sluggish Semiconductor Demand
Memory Prices Still Signal Sluggish Semiconductor Demand
Overall, demand recovery has not yet begun. The lack of price recovery in DRAM prices after 18 months of declines and still-low NAND prices are also signaling sluggish semiconductor demand (Chart 12). Bottom Line: Odds are that global semiconductor demand in sectors other than smartphones will show improvement in terms of rate of change, but will still likely be flat in 2020. TSMC Sales: A Harbinger Of Industry Recovery? TSMC, the world’s biggest semiconductor company, posted a revival in sales over four consecutive months from June to September. Do TSMC sales lead global semiconductor sales? The answer is not always. TSMC sales do not always correlate well with global semiconductor sales (Chart 13). For example, TSMC sales diverged from global semiconductor sales in 2017-‘18 and 2013-‘14. So what are the reasons for strong increase in TSMC sales? First, it reflects market share rotation in the global smartphone market in favor of smartphone producers that use TSMC-fabricated chips. Chart 13TSMC Sales Do Not Always Lead Global Semiconductor Sales
TSMC Sales Do Not Always Lead Global Semiconductor Sales
TSMC Sales Do Not Always Lead Global Semiconductor Sales
Demand from the global smartphone sector contributes to almost half of TSMC’s total revenue. Apple and Huawei are TSMC’s two top customers. The most recent report from market research firm Canalys shows that while Apple’s smartphone shipments declined 7% year-on-year last quarter, Huawei’s shipments soared 29%.4 Combined, smartphone shipments from these two companies still jumped nearly 12% year-on-year in the third quarter of the year. This has increased their market share in the global smartphone market to 31% now from 28% a year ago. Second, rising TSMC sales also reflect market share rotation in the global server market, in particular rising shipments and growing market share of servers using AMD high-performing-computing (HPC) chips instead of Intel ones. AMD’s 7nm Epyc CPU, launched this August and manufactured by TSMC, has been taking share from Intel in the global server market. This has driven the increase in TSMC’s revenue from the HPC sector. Third, the share of value-added products (high-end chips) in TSMC’s product mix has been rising rapidly. TSMC’s share of revenue from 7nm technology jumped from 21% to 27% in the third quarter, as most of Apple’s and Huawei’s chips and all of AMD’s Epyc CPUs are 7nm-based. Back in the third quarter of 2018, TSMC’s 7nm business only accounted for 11% of its total revenue. Chart 14Both TSMC Sales And Taiwanese PMI Could Continue To Improve While Global Semiconductor Sales Remain In Contraction
Both TSMC Sales And Taiwanese PMI Could Continue To Improve While Global Semiconductor Sales Remain In Contraction
Both TSMC Sales And Taiwanese PMI Could Continue To Improve While Global Semiconductor Sales Remain In Contraction
Finally, although internet of things (IoT) and automotive chips only account for 9% and 4% of TSMC’s total share of revenue respectively, strong growth in both segments –33% year-on-year in IoT and 20% year-on-year in automotive – indeed shows exceptional demand in these two sectors in a weakening global economic environment. As IoT and automotive development will highly rely on global 5G infrastructure development, their impact will be meaningful once the global 5G network becomes well advanced and widely installed. To conclude, while a 40% boost in TSMC’s capital spending indeed paints a positive picture on global semiconductor demand over the longer term, rising TSMC sales do not mean an imminent and strong recovery in the global semiconductor sector is in the works. Huawei is the global 5G technology leader and the major supplier in both 5G-network equipment and 5G smartphones; the company will be a major revenue contributor to TSMC. As Huawei will likely place more orders to TSMC for chip fabrication, this will likely result in further improvement in TSMC’s sales (Chart 14). Bottom Line: Rising TSMC sales do not necessarily herald an imminent and robust cyclical recovery in the global semiconductor sector. Investment Conclusions Global semiconductor stock prices have been front running a recovery that has not yet begun. In addition, there is still uncertainty about the technology aspect of US-China trade negotiations. The US will likely continue to have Huawei and other Chinese high-tech companies on its trade-ban list – its so-called Entity List. TSMC sales do not always correlate well with global semiconductor sales. Notably, global semiconductor sales and profits are still in deep contraction, while share prices are at all-time highs (Chart 15). As a result, semiconductor stocks’ multiples have spiked to their previous highs (Chart 16). Chart 15Semiconductor Companies Profits: Still In Deep Contraction
Semiconductor Companies Profits: Still In Deep Contraction
Semiconductor Companies Profits: Still In Deep Contraction
Chart 16Elevated Semiconductor Stocks Multiples
Elevated Semiconductor Stocks Multiples
Elevated Semiconductor Stocks Multiples
While it is common for share prices to rally ahead of a business cycle/profit revival, we believe a true recovery will only emerge in spring 2020, and it will initially be much more subdued than industry watchers and investors expect. In the near term, strong momentum could still push semiconductor stock prices higher. However, the reality will then set in and there will be an air pocket before a more sustainable bull market emerges. Our US Equity Investment Strategy earlier this week downgraded S&P semiconductor equipment companies to underweight and put the S&P Semiconductors Index on a downgrade alert.5 Their newly created top-down semiconductor profit growth model warns that an earnings recovery is not yet imminent (Chart 17). For EM-dedicated equity managers, we have been neutral on Asian semiconductor sectors. We continue to recommend a market-weight allocation to Taiwan’s overall market, while we are upgrading the Korean technology sector from a neutral allocation to overweight. Korean semiconductor stocks have rallied much less than their global peers. Hence, the risk of a major relapse is lower. Given that we have been overweight non-tech Korean stocks, upgrading tech stocks to overweight means we will be overweight the KOSPI within the EM equity benchmark (Chart 18). Chart 17Semiconductor Earnings Recovery: Not Imminent
Semiconductor Earnings Recovery: Not Imminent
Semiconductor Earnings Recovery: Not Imminent
Chart 18Upgrade Korean Tech Stocks And Overweight KOSPI Within EM
Upgrade Korean Tech Stocks And Overweight KOSPI Within EM
Upgrade Korean Tech Stocks And Overweight KOSPI Within EM
Meanwhile, we remain long the Bloomberg Asia-Pacific Semiconductor Index and short the S&P 500 Semiconductor Index. This trade has produced a 7% gain since its initiation on June 13, 2019. The Bloomberg Asia-Pacific Semiconductor index has 12 stocks. Samsung and TSMC account for 38% and 37% of the index, respectively. The S&P 500 Semiconductor Index has 13 stocks. Intel, Broadcom, Texas Instruments and Qualcomm are the top five constituents, together accounting for nearly 77% of the index. Although the US and China may reach a temporary trade deal, the US will continue to restrict sales of tech products and high-end semiconductors to China. As a result, these US semiconductor companies, most of which are IC designing companies, will likely experience a more subdued than expected recovery in sales. Ellen JingYuan He Associate Vice President ellenj@bcaresearch.com Footnotes 1 Please see Emerging Markets Strategy Special Report "The Global Semiconductor Sector: Is A Cyclical Upturn Imminent?" dated June 13, 2019, available at ems.bcaresearch.com 2 https://www.guancha.cn/ChanJing/2019_09_21_518748.shtml http://www.cac.gov.cn/2019-10/23/c_1573361796389322.htm 3 Please see Emerging Markets Strategy Special Report "Chinese Auto Demand: Time For A Recovery?" dated October 17, 2019, available at ems.bcaresearch.com 4 https://www.canalys.com/analysis/smartphone+analysis 5 Please see US Equity Strategy Special Report "Defying Gravity," dated November 4, 2019, available at uses.bcaresearch.com
Feature Chart I-1Lebanese Bond Yields Have Surged To Precarious Levels
Lebanese Bond Yields Have Surged To Precarious Levels
Lebanese Bond Yields Have Surged To Precarious Levels
In a May 2018 Special Report, we warned that a devaluation and government default were only a matter of time in Lebanon. The country's sovereign US dollar bond yields have now reached a whopping 21% and local currency interest rates stand at 18% (Chart I-1). On the black market, the Lebanese pound is already trading 12% below its official rate. A public run on banks and bank deposit moratorium, as well as public debt default and a massive currency devaluation are now unavoidable. A Classic Case Of EM Bank Run And Currency Devaluation… The current state of Lebanon’s balance of payments (BoP) is disastrous: The current account (CA) deficit has oscillated between 10% and 20% of GDP in the past 10 years (Chart I-2). This wide CA deficit has been funded by speculative portfolio flows into local currency government bonds, sovereign bonds and bank deposits. However, since the middle of 2018 these inflows have dried up. In turn, to defend the currency peg to the US dollar and avoid a currency depreciation in the face of the BoP deficit, the Central Bank of Lebanon (BDL) has been depleting its foreign exchange (fx) reserves, i.e., the central bank has been financing the BoP deficit (Chart I-3). Chart I-2Lebanon's Chronic Current Account Deficit
Lebanon's Chronic Current Account Deficit
Lebanon's Chronic Current Account Deficit
Chart I-3Lebanon: The BoP Has Been Deteriorating Substantially
Lebanon: The BoP Has Been Deteriorating Substantially
Lebanon: The BoP Has Been Deteriorating Substantially
BDL’s gross fx reserves – including gold – have dropped from $48 billion in 2018 to its current level of $43 billion. We estimate that BDL’s net foreign exchange reserves excluding commercial banks’ US dollar deposits at BDL are at just $26 billion. This amount is insufficient in light of the panic-induced outflows the country and the banking system are experiencing.1 As a result of the two-week long bank shutdown amid massive protests, confidence in the banking system is quickly collapsing and capital is leaving Lebanon. Chart I-4Depositors’ Are Heading For The Exit
Depositors' Are Heading For The Exit
Depositors' Are Heading For The Exit
Worryingly, as a result of the two-week long bank shutdown amid massive protests, confidence in the banking system is quickly collapsing and capital is leaving Lebanon.2 Moreover, after opening their doors, Lebanese commercial banks are now imposing unofficial capital controls – they are paying US dollar deposits in local currency only and are no longer providing dollar-denominated credit lines to businesses and importers. This will only intensify the panic among depositors. Chart I-4 illustrates that local currency deposits have already been declining while US dollar deposits have been slowing, and will likely begin contracting soon. In short, capital outflows will intensify in the coming weeks as people and businesses quickly realize that banks cannot meet their demand for deposits. Critically, we suspect Lebanese commercial banks are short on US dollars to meet people’s demand for the hard currency. Commercial banks’ net foreign currency assets stand at negative $70 billion or 127% of GDP. They hold, roughly, somewhere around $20 billion worth of US dollars in the form of liquid and readily available deposits (in banks abroad and deposits in the central bank) versus $124 billion worth of dollar deposits. Over the years, Lebanese commercial banks have been an attractive place for investors and residents to park their US dollars given the high interest rate paid by the banks. In turn, Lebanese commercial banks have been converting these US dollar deposits into local currency in order to buy government bonds. With domestic bonds yielding well above the rates on US dollar deposits - and given the exchange rate peg to the dollar - commercial banks have been de facto playing the carry trade. In addition, commercial banks also lent some of these dollars directly to the private sector. With the economy collapsing and the widening dollar shortage, banks will not be able to either collect their dollar loans or purchase dollars in the market. Without new dollar funding – which is very likely to persist – banks will fail to meet the demand for dollars. As a result, a bank run is imminent. At this point, the sole option is for the central bank to keep pushing local interest rates higher to discourage capital flight and a run on the banks. Yet, at 18% and surging, interest rates will suffocate the Lebanese economy and the property market. This will dampen sentiment further and cause a bank run. Bottom Line: A bank run is brewing and bank moratorium as well as currency devaluation are inevitable. …As Well As Public Debt Default Lebanese commercial banks are not only being squeezed by capital outflows and deposit withdrawals, they are also about to face a public debt default. Chart I-5Public Debt Dynamics Are Toxic
Public Debt Dynamics Are Toxic
Public Debt Dynamics Are Toxic
Lebanese commercial banks are not only being squeezed by capital outflows and deposit withdrawals, they are also about to face a public debt default. Commercial banks own 37% of outstanding government debt. This will come on top of skyrocketing private-sector non-performing loans and will push banks into outright bankruptcy. Lebanon’s fiscal and public debt dynamics have reached untenable levels. The fiscal deficit stands at 10% of GDP and total public debt stands at 150% of GDP (Chart I-5). Surging government borrowing costs will push interest payments as a share of government aggregate expenditures to extremely high levels. These are unsustainable fiscal and debt arithmetics (Chart I-6). Meanwhile, government revenues will decline as growth falters (Chart I-6, bottom panel). The pillars of the Lebanese economy – private credit growth and construction activity – have been already collapsing (Chart I-7). Chart I-6Surging Interest Rates Will Make Public Debt Servicing Impossible
Surging Interest Rates Will Make Public Debt Servicing Impossible
Surging Interest Rates Will Make Public Debt Servicing Impossible
Chart I-7Lebanon: Domestic Economy Has Been Collapsing
Lebanon: Domestic Economy Has Been Collapsing
Lebanon: Domestic Economy Has Been Collapsing
Bottom Line: The Lebanese government will be forced to default on both local currency and dollar debt. This will be the final nail in the coffin of the Lebanese banking system. Ayman Kawtharani Editor/Strategist ayman@bcaresearch.com Footnotes 1 BDL does not publish its holding of net foreign exchange reserves. However, other estimates of BDL’s net fx reserves are even lower. Please refer to the following paper: Financial Crisis In Lebanon, by Toufic Gaspard and the following article: Lebanon Warned on Default and Recession as Its Reserves Decline. 2 Banks shut down allegedly as a result of the ongoing civil disobedience that was sparked by the government’s reckless decision to tax WhatsApp's call service. The protests quickly escalated to a country-wide uprising, causing the government to resign on October 29.
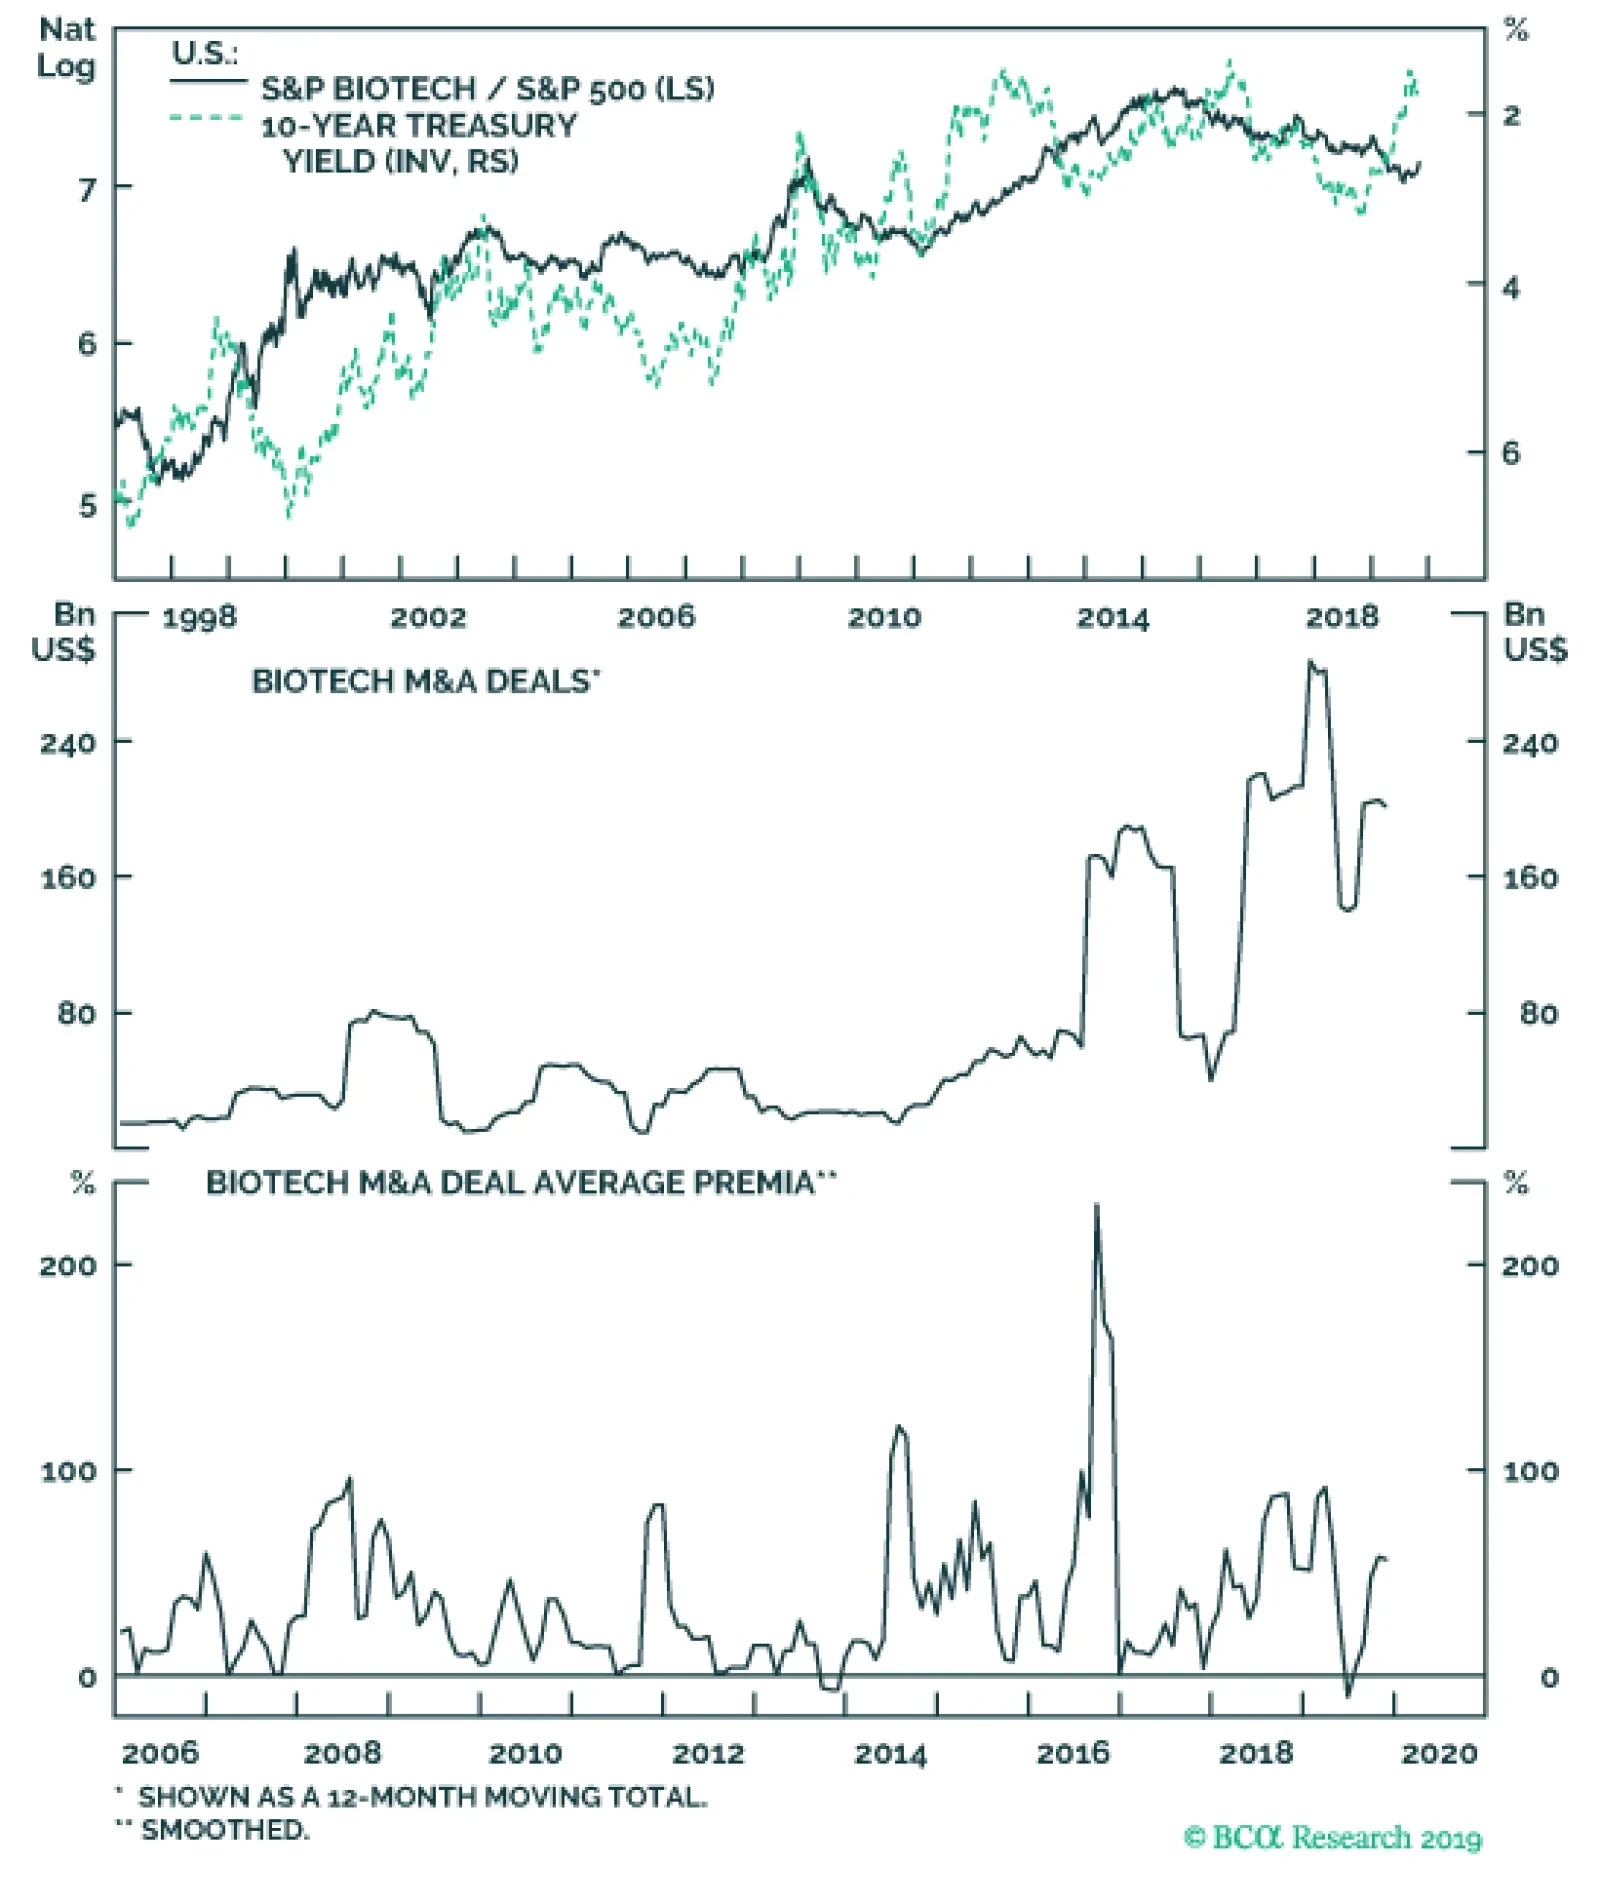
Biotech stocks are now in the recovery ward as the sector made a U-turn in early October and has been rallying ever since. The rebound coincides with the return of M&A activity following the dramatic 50% contraction since the recent peak in dollar…
Highlights The slowdown in global industrial activity appears to have bottomed. This, along with an apparent shared desire for a ceasefire in the Sino-US trade war, points toward a measured recovery in manufacturing and global trade, which will contribute to higher iron-ore and steel demand beginning in 1H20. A trade-war ceasefire, should it endure, will reduce global economic uncertainty. Along with continued monetary accommodation from systematically important central banks, reduced economic uncertainty will boost global growth and industrial-commodity demand generally by allowing the USD to weaken. We expect Beijing policymakers to remain focused on keeping GDP growth above 6.0% p.a. To that end, we believe a boost in infrastructure spending next year is likely, which also will be bullish for steel demand. Given China’s growing share of global steel production, we expect price differentials for high-grade iron ore – most of which comes from Brazil – to widen as steel demand increases next year. Given this view, we are initiating a strategic iron-ore spread trade at tonight’s close: Getting long December 2020 high-grade (65% Fe) futures traded on the Singapore Exchange vs. short the benchmark-grade (62% Fe) December 2020 futures traded on the CME. We recommend a 20% stop-loss on this recommendation. Feature Iron ore and steel demand will get a lift from the rebound our proprietary Global Industrial Activity (GIA) index has been forecasting for the past few months (Chart of the Week). The GIA index is designed to pick up changes in Chinese industrial activity, given its outsized influence on world industrial output, and also makes use of trade data, FX rates, and global manufacturing data. The rebound we are expecting will get a fillip from an apparent shared desire for a ceasefire in the Sino-US trade war, which, based on media reports, is close to being agreed. Should this ceasefire prove to be durable, it would contribute to a lowering of global economic policy uncertainty (GEPU), which, as we have shown recently, has kept the USD well bid to the detriment of industrial-commodity demand.1 Chart of the WeekBCA GIA Index Pick-Up Points To Higher Global Steel Demand
BCA GIA Index Pick-Up Points To Higher Global Steel Demand
BCA GIA Index Pick-Up Points To Higher Global Steel Demand
While we do expect economic uncertainty to decline next year, it will remain elevated due to continued Sino-US trade tensions – even if a “phase-one” deal is agreed – ongoing hostilities in the Persian Gulf, and popular discontent with the political status quo globally. As global economic uncertainty fades, the USD broad trade-weighted index for goods (TWIBG) will fall, which will bolster EM GDP growth, and a recovery in global trade next year (Chart 2). If, as media reports suggest, this so-called “phase-one” agreement includes a relaxation – or complete removal – of tariffs by the US on Chinese imports, we would expect manufacturing activity to pick up as Chinese manufacturers spin-up capacity to meet demand. A reduction in tariffs also will lessen the deadweight loss they imposed on US households, which will support higher consumption.2 Chart 2Reduced Global Economic Uncertainty Bolsters Global Trade Volumes, EM GDP
Iron Ore, Steel Prices Set To Lift
Iron Ore, Steel Prices Set To Lift
That said, economic uncertainty still remains high. This uncertainty is destructive of demand and will remain a key risk factor in 2020. While we do expect economic uncertainty to decline next year, it will remain elevated due to continued Sino-US trade tensions – even if a “phase-one” deal is agreed – ongoing hostilities in the Persian Gulf, and popular discontent with the political status quo globally. China’s Steel Demand Holds Up In Trade War China accounts for more than half of global steel production and consumption, and the lion’s share of seaborne iron-ore consumption (Chart 3). This makes its steel industry critically important to the global economy, and a key barometer of industrial activity worldwide. With global industrial activity bottoming and moving higher, and the USD expected to weaken, we expect iron ore demand and steel production in China to move higher next year as domestic and global demand for steel rises. China’s apparent steel demand held up fairly well during the slowdown observed in manufacturing and in commodity demand growth globally, averaging 8% y/y growth ytd (Chart of the Week, bottom panel). It now appears to be stalling in the wake of the global manufacturing slowdown. In addition, Chinese credit stimulus remains weak, contrary to expectations. However, with global industrial activity bottoming and moving higher, and the USD expected to weaken, we expect iron ore demand and steel production in China to move higher next year as domestic and global demand for steel rises.3 Chart 3China Dominates Global Steel Production and Consumption
China Dominates Global Steel Production and Consumption
China Dominates Global Steel Production and Consumption
Chart 4Construction, Real Estate Strength Offset Lower Chinese Auto Production
Construction, Real Estate Strength Offset Lower Chinese Auto Production
Construction, Real Estate Strength Offset Lower Chinese Auto Production
Greater demand for steel by the construction and real estate sectors offset lower consumption by the automobile industry in China this year, as manufacturing and trade slowed globally (Chart 4). Overall, apparent demand is still growing (Chart 5), which will continue to support iron ore imports, even though domestic production of low-grade ore picked up as steelmakers’ margins tightened earlier in the year (Chart 6). Chart 5China"s Apparent Steel Demand Growth Holds Up During Industrial Slowdown
China"s Apparent Steel Demand Growth Holds Up During Industrial Slowdown
China"s Apparent Steel Demand Growth Holds Up During Industrial Slowdown
Chart 6China Iron Ore Imports Remain Stout
China Iron Ore Imports Remain Stout
China Iron Ore Imports Remain Stout
Chinese imports from Brazil have rebounded following the Brumadinho tailings dam collapse in January at Vale’s Córrego do Feijão iron ore mine, which killed close to 300 people. The collapse in margins from steel mills combined with outages to Brazil and Australia high-grade ore exports led to a rise in imports and domestic production of low-grade iron ore. High-Grade Iron Ore Favored; Policy Uncertainty Persists Our overall view for industrial commodities – iron ore, steel, base metals and crude oil – is constructive but not wildly bullish going into next year. Our oil view, for example, calls for a rally in the average price of crude oil next year of ~ 10% from current levels for Brent crude oil, the world benchmark. While we expect global monetary stimulus to offset much of the tightening of financial conditions brought on by the Fed’s rate hikes last year, and China’s de-leveraging campaign of 2017-18, elevated economic uncertainty will keep the USD better bid that it otherwise would be absent the Sino-US trade war and global economic policy uncertainty. This translates into weaker commodity demand, generally, as a strong USD raises local-currency costs for consumers and lowers local-currency production costs for producers. At the margin, both push commodity prices lower. On a relative basis, we expect the more efficient, less-polluting technology likely will be called on to meet higher steel demand – in China and globally – next year, which means higher-grade iron ore will be favored by Chinese steel mills as profitability improves. For iron ore and steel in particular, environmental considerations also are important, given the Chinese government's “Blue Skies Policy” aimed at reducing the country’s high levels of air pollution.4 This policy has led to the forced retirement of older, highly polluting steelmaking capacity, which has been replaced with newer, less-polluting technology that favors high-grade iron ore. However, the application of regulations designed to reduce pollution has been uneven, and still relies on local compliance, which has been spotty. We expect demand for high-grade ore will increase as global manufacturing and trade also recovers. On a relative basis, we expect the more efficient, less-polluting technology likely will be called on to meet higher steel demand – in China and globally – next year, which means higher-grade iron ore will be favored by Chinese steel mills as profitability improves. The restoration of high-grade exports from Brazil means this ore will be available. It is worthwhile noting that these steelmakers account for an increasing share of global capacity. For this reason, we expect demand for high-grade ore will increase as global manufacturing and trade also recovers (Chart 7). Given our view, at tonight’s close we will get long December 2020 high-grade iron-ore futures (65% Fe) traded on the Singapore Exchange vs. short benchmark-grade iron-ore futures (62% Fe) traded on the CME. Both are quoted in USD/MT and settle basis Chinese port-delivery (CFR) indexes in cash. Given the uncertain nature of the durability and depth of the ceasefire currently being negotiated by the US and China, we will keep a stop-loss on this position of 20%. Bottom Line: China’s steel demand has held up relatively well despite the global slowdown in manufacturing and trade. Given our expectation for a pick-up in global growth – in response to global monetary and fiscal stimulus and lower economic uncertainty in the wake of a ceasefire in the Sino-US trade war – we expect Chinese steel demand to resume growing. This will support iron ore prices, particularly for high-grade ores. On the back of this expectation, we are recommending an iron-ore spread trade, going long high-grade futures vs. short benchmark-grade iron ore futures. Chart 7High-Grade Iron Ore Should Outperform Strategically
High-Grade Iron Ore Should Outperform Strategically
High-Grade Iron Ore Should Outperform Strategically
Robert P. Ryan Chief Commodity & Energy Strategist rryan@bcaresearch.com Hugo Bélanger Senior Analyst Commodity & Energy Strategy HugoB@bcaresearch.com Market Round-Up Energy: Overweight. Bloomberg reported China is looking to invest between $5-$10 billion in the Saudi Aramco IPO through various vehicles. Such an investment would give China a deeper stake in the Kingdom’s oil industry, and a hedge to price shocks. In addition, it could open the way for deeper investment in the Saudi oil and petchems industries. For KSA, as we have argued in the past, a deepening of China’s investment and involvement in the Kingdom’s economy would diversify the states that have a vested interest in ensuring its safety.5 We will be updating our analysis of China’s pivot to the Middle East, and KSA’s pivot to Asia next week. Separately, we the last of our Brent backwardation trades – i.e., long December 2019 Brent vs. short December 2020 Brent – was closed last week with a gain of 110.8%. Base Metals: Neutral. Copper prices are up 6% vs. last month, supported by supply-side worries in Chile and, more recently, easing trade tensions. Cyclically, we believe copper prices are turning up – spurred by easy monetary conditions and fiscal stimulus directed at infrastructure and construction spending. Most of our key commodity-demand indicators have bottomed and are suggesting EM demand growth will move up. This supports a year-end base metal rally. Precious Metals: Neutral. A risk-on sentiment fueled by expectation the U.S. and China will sign a trade deal weighs on gold’s safe-haven demand. Prices fell 2% since last week. Additionally, U.S. 10-year bond yields shot higher – pushing gold prices lower – on Tuesday following a stronger-than-expect ISM services PMI data release. Gold-backed ETF holdings reached a new record in September at 2,855 MT (up 377 MT ytd), surpassing the December 2012 peak. A reversal in investors’ sentiment towards gold could send prices down. Ags/Softs: Underweight. The USDA reported that 52% of the U.S. corn has been harvested, a 13 percentage point increase relative to last week, yet the figure came shy of analysts’ expectation and far below the 2014-2018 average of 75%. On a weekly basis, corn prices are still down 2% due to drier weather forecast. Soybean harvest did better reaching 75%, and meeting expectations. Soybean price is almost unchanged on a weekly basis, despite having edged higher earlier in the week on the back of rising expectations the US and China will agree on a ceasefire in the ongoing trade war. Footnotes 1 We measure this uncertainty using the Baker-Bloom-Davis Global Economic Policy Uncertainty (GEPU) index. This is a GDP-weighted index of newspaper headlines containing a list of words related economic uncertainty. Newspapers from 20 countries representing almost 80% of global GDP are scoured for reports reflecting economic uncertainty. Please see our October 17 and October 31, 2019, reports Policy Uncertainty Lifts USD, Stifles Global Oil Demand Growth and Global Financial Conditions Support Higher Commodity Demand for the original research on this topic. Both are available at ces.bcaresearch.com. 2 We discuss deadweight losses to US households arising from the tariffs in Waiting To Get Long Copper, In China’s Steel Slipstream, published August 29, 2019. It is available at ces.bcaresearch.com. 3 BCA Research’s China Investment Strategy expects China’s business cycle likely will bottom in 1Q20 of next year, rather than in 4Q19. This aligns with our expectation. Please see China Macro And Market Review, published November 6, 2019. It is available at cis.bcaresearch.com. 4 We examined the implications of China’s “Blue Skies” policy in China's Anti-Pollution Resolve Critical To Iron Ore Markets, published April 4, 2019. It is available at ces.bcaresearch.com. 5 We discuss these issues in our Special Report entitled ضد الواسطة published November 16, 2018. The Arabic title of the report translates as "Against Wasta." Wasta means reciprocity in formal and informal dealings. Investment Views and Themes Recommendations Strategic Recommendations Tactical Trades TRADE RECOMMENDATION PERFORMANCE IN 2019 Q3
Iron Ore, Steel Prices Set To Lift
Iron Ore, Steel Prices Set To Lift
Commodity Prices and Plays Reference Table Trades Closed in 2019 Summary of Closed Trades
Iron Ore, Steel Prices Set To Lift
Iron Ore, Steel Prices Set To Lift
Biotech Recovery
Biotech Recovery
Overweight While our overweight call in the S&P biotech index is offside, it is more than offset by the concurrent underweight call we have on the S&P pharma index. But, biotech stocks are now in the recovery ward as the sector made a U-turn in early October and has been rallying ever since. The rebound coincides with the return of M&A activity following the dramatic 50% contraction since the recent peak in dollar terms (middle panel) and completely disappearing premia (bottom panel). As a reminder this is a key theme behind our preference for biotech stocks that big pharma is still on the hunt for (for additional details please refer to our mid-February Weekly Report). Meanwhile, the divergence between biotech’s relative share prices and 10-year Treasury yields has been extreme and is unsustainable. The upshot is that there is plenty of scope for relative share prices to rally further and narrow the gap, despite the recent selloff in the bond market (top panel, 10-year Treasury yield shown inverted). News on the earnings front is also positive as most of the major players have reported a solid quarter. Bottom Line: We continue to recommend a barbell approach preferring the S&P biotech index at the expense of big pharma. The ticker symbols for the stocks in the S&P biotech index are: BLBG: S5BIOT – ABBV, AMGN, GILD, BIIB, CELG, VRTX, REGN, ALXN, INCY.