Sectors

Sell Semi Equipment Exuberance
Sell Semi Equipment Exuberance
Underweight The S&P semi equipment index has made the headlines reaching fresh cycle-highs. While bulls would buy this breakout, we are sticking our heads out and recommend selling the strength and warn that the S&P semi equipment cycle-high looks like a mania (please refer to Chart 8 from this Monday’s Weekly Report). Deflating DRAM prices, which also serve as our industry’s pricing power proxy, highlight that demand remains deficient both for semis and semi equipment. Historically, the sector’s relative profit expectations and pricing power have moved in lockstep and the current message is to fade sell-side analysts’ buoyancy (bottom panel). Moreover, the plunge in overall tech capex growth (especially excluding software) further dims an already bleak semi equipment profit outlook. Bottom Line: This week we downgraded the S&P semi equipment index to underweight, but given the industry’s volatility we also set a 10% stop loss. The ticker symbols for the stocks in this index are: BLBG – S5SEEQ – AMAT, LRCX, KLAC. For additional details, please refer to this Monday’s Weekly Report.
Highlights While the Caixin PMI is pointing to improving economic conditions, other data series still reflect weak growth. China’s business cycle is likely to bottom in Q1 of next year, rather than in Q4. The failure of Chinese stocks to significantly outperform the global benchmark and the continued underperformance of cyclical stocks underscore the near-term risks to equities if this month’s trade & manufacturing data disappoint. We continue to recommend a neutral tactical stance (0-3 months) towards Chinese equities versus global stocks, but expect them to outperform on a cyclical (6-12 month) time horizon after economic growth firmly bottoms. Feature Tables 1 and 2 on pages 2 and 3 highlight key developments in China’s economy and its financial markets over the past month. On the growth front, the data remains mixed: the strength in the October Caixin PMI and the September pickup in electricity production are positive signs, but other important datapoints still point to weak conditions. We continue to expect that China’s business cycle is likely to bottom in Q1 of next year, rather than in Q4. We continue to expect that growth will bottom in Q1 of next year, rather than in Q4. Table 1China Macro Data Summary
China Macro And Market Review
China Macro And Market Review
Table 2China Financial Market Performance Summary
China Macro And Market Review
China Macro And Market Review
Within financial markets, Chinese stocks have rallied in absolute terms over the past month in response to greatly increased odds of a trade truce between China and the US, but have failed to outperform the global benchmark. This, in combination with the continued underperformance of cyclical stocks, suggests that hard evidence of an economic improvement in China will be required before Chinese stocks begin to rise in relative terms. The risk of near-term underperformance is still present, especially if October’s hard trade and manufacturing data disappoint. We continue to recommend a neutral tactical stance (0-3 months) towards Chinese equities versus global stocks, but expect them to outperform on a cyclical (6-12 month) time horizon after economic growth firmly bottoms. In reference to Tables 1 and 2, we provide below several detailed observations concerning developments in China’s macro and financial market data: Chart 1Not Yet A Clear Change In Trend
Not Yet A Clear Change In Trend
Not Yet A Clear Change In Trend
The Bloomberg Li Keqiang index (LKI) ticked up in September, led by an improvement in electricity production. An improvement in the LKI in lockstep with a rising Caixin manufacturing PMI (discussed below) raises the odds that the Chinese economy may be bottoming earlier than we expect, but for now only modestly so. Chinese economic data is highly volatile, and Chart 1 shows that the improvement in the LKI is very muted when shown as a 3-month moving average. In addition, a slight improvement also occurred earlier this year, but proved to be a false signal. All told, for now we continue to expect that growth will bottom in Q1 of next year, rather than in Q4. Our leading indicator for the LKI was essentially flat in September on a smoothed basis, with sequential declines in M3 growth and the credit components of the indicator offsetting improvements in monetary conditions and M2. From a big picture perspective, the story of our LKI leading indicator remains unchanged: it continues to trend higher, at a much shallower pace than has been the case during previous easing cycles. The uptrend is the basis of our forecast that China’s growth will soon bottom, but the uncharacteristically shallow nature of the rise suggests that the eventual recovery will be modest. On a smoothed basis, Chinese residential floor space sold improved again in September, following a very significant rise in August. Over the past 12-18 months, we had emphasized that the double-digit pace of growth in China’s housing starts was unsustainable because it had entirely decoupled from the trend in sales (which have reliably led construction activity over the past decade). This gap disappeared over the summer due to a significant slowdown in starts, which is what we predicted would occur. However, the recent acceleration in floor space sold represents a legitimate fundamental improvement in the housing market, that for now is difficult to attribute to the recent drivers of housing demand (Chart 2).1 Still, investors should continue to watch China’s housing demand data closely over the coming few months, for further signs of a potential re-acceleration in housing construction. Investors need to see meaningful sequential improvements in China’s October trade and manufacturing data. The October improvement in China’s Caixin PMI was quite notable, as it appears to confirm the full one-point rise in the index that occurred in September and suggests that manufacturing in China’s private-sector is now durably expanding. Still, conflicting signals remain: the official PMI fell in October and remains below 50, and the significant September improvement in the Caixin PMI was not corroborated by an improvement in producer prices or nominal import growth (Chart 3). As PMIs are simply timely coincident indicators that do not generally have leading properties, investors will need to see meaningful sequential improvements in China’s October trade and manufacturing data in order to have confidence that the Caixin PMI improvement is not a false signal. Chart 2It Is Not Yet Apparent What Is Driving A Pickup In Housing Demand
It Is Not Yet Apparent What Is Driving A Pickup In Housing Demand
It Is Not Yet Apparent What Is Driving A Pickup In Housing Demand
Chart 3If The Caixin PMI Is Not A False Signal, A Hard Data Improvement Must Occur Soon
If The Caixin PMI Is Not A False Signal, A Hard Data Improvement Must Occur Soon
If The Caixin PMI Is Not A False Signal, A Hard Data Improvement Must Occur Soon
Chinese stocks have rallied 6-7% over the past month in absolute terms, but have modestly underperformed global equities. The rally in global stock prices has occurred largely in response to the mid-October announcement of a trade truce between China and the US. The failure of Chinese stocks to outperform during this period suggests hard evidence of an economic improvement in China will be required before Chinese stocks begin to outpace their global peers. At the regional equity level, the other notable development over the past month has been the continued outperformance of the MSCI Taiwan Index versus the global benchmark. Taiwan’s outperformance has been boosted by a rising TWD versus the dollar, but Taiwanese stocks have also outperformed in local currency terms. Taiwan province is highly exposed to global trade, and it is not surprising that equities have reacted positively to the prospect of a trade truce between the US and China. Further meaningful outperformance, however, will likely require a re-acceleration in Taiwanese exports, as export growth has merely halted its contraction (Chart 4). Within China’s investable equity market, cyclicals have underperformed defensives over the past month after having rallied significantly from late-August to mid-September (Chart 5). We noted in our October 30 Special Report that these cyclical sectors have historically been positively correlated with pro-cyclical macroeconomic and equity market variables,2 and their underperformance versus defensives is thus consistent with the failure of Chinese stocks in the aggregate to outperform global equities over the past month. In both cases, outperformance likely requires hard evidence of an upturn in China’s business cycle. Chart 4Export Growth Needs To Improve In Order To Expect Further Taiwanese Relative Outperformance
Export Growth Needs To Improve In Order To Expect Further Taiwanese Relative Outperformance
Export Growth Needs To Improve In Order To Expect Further Taiwanese Relative Outperformance
Chart 5Cyclical Underperformance Underscores The Near-Term Risks To Chinese Vs. Global Stocks
Cyclical Underperformance Underscores The Near-Term Risks To Chinese Vs. Global Stocks
Cyclical Underperformance Underscores The Near-Term Risks To Chinese Vs. Global Stocks
We do not take the rise in Chinese government bond yields as necessarily indicative of an imminent breakout in relative equity performance. Chart 6Chinese Relative Equity Performance Leads Bond Yields, Not The Other Way Around
Chinese Relative Equity Performance Leads Bond Yields, Not The Other Way Around
Chinese Relative Equity Performance Leads Bond Yields, Not The Other Way Around
Chinese 10-year government bond yields have risen roughly 15bps over the past month, and are now 30bps off of their mid-August low. Many market participants view Chinese government bond yields as a leading growth barometer, but 10-year yields have actually lagged Chinese investable stock performance over the past two years (Chart 6). As such, we do not take the rise in yields as necessarily indicative of an imminent breakout in relative equity performance. Chinese onshore corporate bond spreads have declined over the past month as government bond yields have been rising, continuing a pattern of negative correlation between the two that has prevailed since early-2018. A negative correlation between yields and corporate bond spreads is a normal relationship, and it suggests that spreads may narrow over the coming year if the Chinese economy bottoms in Q1, as we expect. Spreads remain elevated despite the substantial easing in monetary conditions that occurred last year, due to persistent concerns about rising onshore defaults. While we acknowledge that defaults are indeed occurring, we have argued on several occasions that the pace of defaults would have to be much faster in order for current spreads to be justified.3 We continue to recommend a long RMB-denominated position in China’s onshore corporate bond market. The RMB has appreciated over the past month in response to news of a likely trade truce between the US and China, with most of the rise having occurred versus the US dollar. USD-CNY is likely to sustainably trade below the 7 mark in a trade truce scenario, but how much further downside is possible in the near-term absent a re-acceleration in Chinese economic activity remains an open question. With the Fed very likely on hold for the next year, stronger than expected economic growth in China would likely catalyze a persistent selloff in USD-CNY barring a re-emergence of the Sino-US trade war. This, however, is not our base-case view, meaning that we expect modest post-deal strength in the RMB. Jonathan LaBerge, CFA Vice President Special Reports jonathanl@bcaresearch.com Jing Sima China Strategist JingS@bcaresearch.com Footnotes 1. Please see China Investment Strategy Special Report, “China’s Property Market: Where Will It Go From Here?” dated September 13, 2018. 2. Please see China Investment Strategy Weekly Report, “A Guide To Chinese Investable Equity Sector Performance,” dated October 30, 2019. 3. Please see China Investment Strategy Weekly Reports, “A Shaky Ladder,” dated June 13, 2018, "Investing In The Middle Of A Trade War,” dated September 19, 2018 and "2019 Key Views: Four Themes For China In The Coming Year,” dated December 5, 2018. Cyclical Investment Stance Equity Sector Recommendations
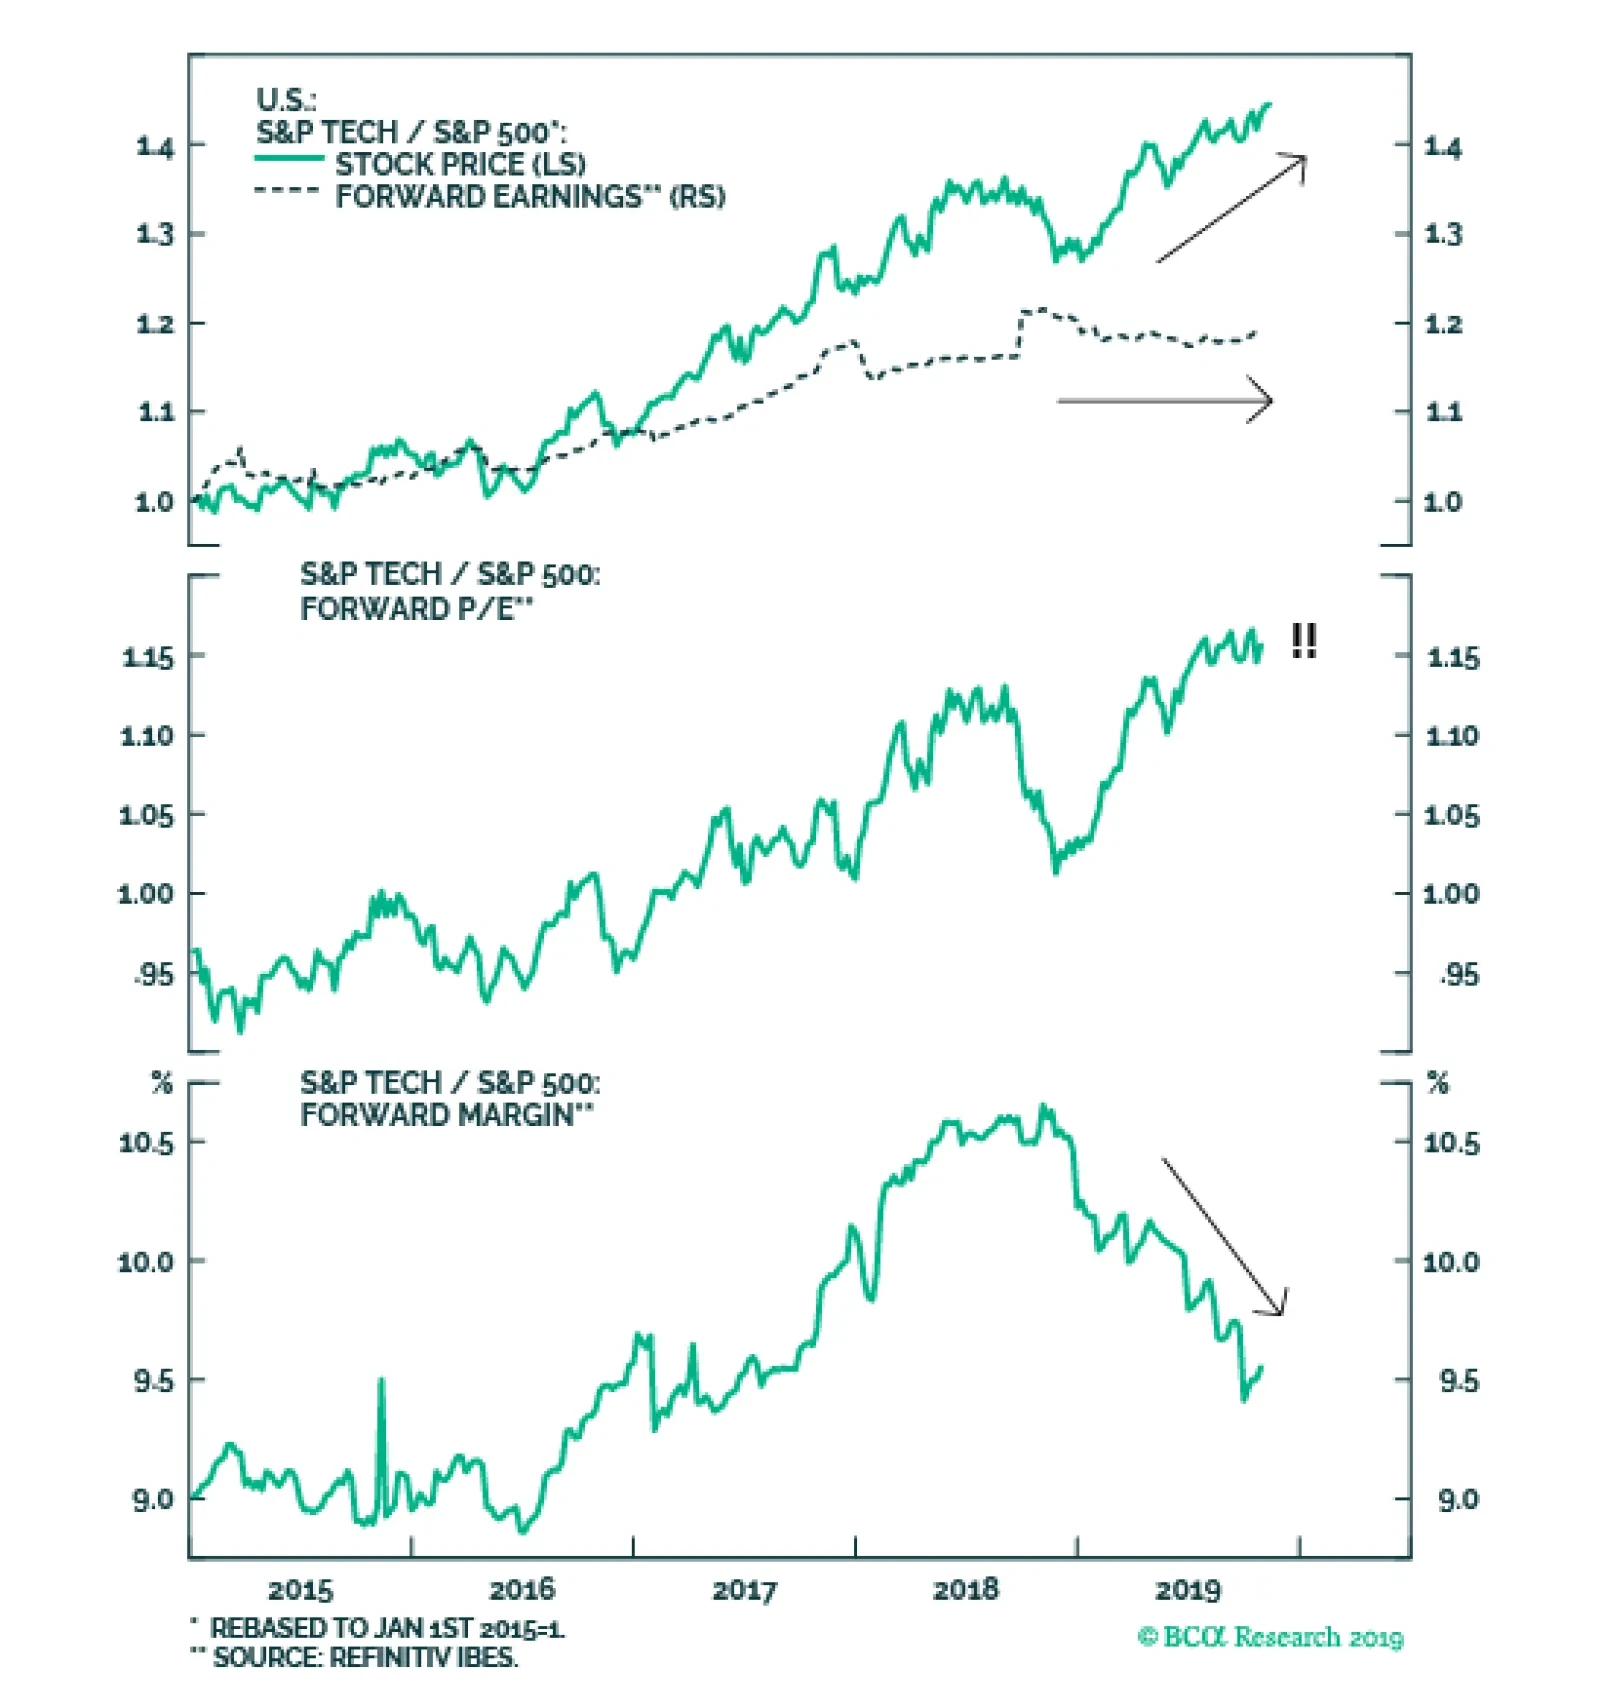
Tech stocks have been on a tear with the sector besting the SPX by over 40% since 2015. Such a breakneck pace is unsustainable without support from earnings. Despite the sector’s share price outperformance, expected tech profit growth has been no better…
The contracting ISM manufacturing survey signals that relative share price momentum running at a 60%/annum clip is unwarranted and bound to return to earth. The same holds true for relative forward profit and revenue growth expectations, especially given the…
Highlights Portfolio Strategy Lack of profit growth, deficient industry demand, perky valuations and extremely overbought conditions all suggest that the time is ripe for an underweight stance in the S&P semi equipment index. The chip down cycle is far from over, leading global semi sales indicators remain downbeat and our semi profit growth model is waving a yellow flag, compelling us to put the S&P semiconductors index on downgrade alert. Recent Changes Downgrade the S&P semiconductor equipment index to underweight, today. Table 1
Defying Gravity
Defying Gravity
Feature The S&P 500 made fresh all-time highs last week, despite the ongoing profit contraction and a well telegraphed hawkish Fed interest rate cut. The “hope rally” continues and the longer it lasts defying sagging profit fundamentals, the larger the snapback will be in the ensuing months. We remain cautious awaiting a turn in our proprietary four-factor macro SPX earnings growth model and in the meantime our strategy is to sell this strength and raise dry powder. Worrisomely, Chart 1 shows that analysts have thrown in the towel and are downgrading SPX long-term profit growth expectations at a faster pace than in the aftermath of the dotcom bubble. Historically, the S&P 500 and its five-year forward EPS growth estimates are joined at the hip, and the current message is bearish for the broad equity market. Chart 1Will Sinking Profit Growth Expectations Pull Stocks Lower?
Will Sinking Profit Growth Expectations Pull Stocks Lower?
Will Sinking Profit Growth Expectations Pull Stocks Lower?
Importantly, on the valuation front, in May of 2018 we first showed the SPX P/E/G ratio and at the time we accurately argued that “on this valuation measure the SPX appears cheap”.1 How times have changed since then. Following that trough, the P/E/G ratio has nearly doubled and is now sitting right at 1.5 or one standard deviation above the historical mean (we divide the 12-month forward price-to-earnings ratio by the long-term EPS growth rate using I/B/E/S data, second panel, Chart 2). We are clearly in overshoot territory and this valuation metric represents another yellow flag. Chart 2SPX P/E/G Ratio Is In Overshoot Territory
SPX P/E/G Ratio Is In Overshoot Territory
SPX P/E/G Ratio Is In Overshoot Territory
Moving on to the bond market, what caught our attention was a recent WSJ article detailing how investors are no longer paying up to own the lowest quality paper and while overall junk spreads were coming in, at the bottom of the pit investors were shunning CCC rated junk bonds.2 What is interesting is that this lowest quality corner of the junk market has some excellent forward looking properties and tends to lead not only the overall junk market, but also equities. Chart 3 shows the CCC rated option adjusted spread (OAS) versus the overall high yield OAS on a year-over-year change basis on inverted scale. This measure of bond market stress is moving in the opposite direction of S&P 500 momentum and we expect stocks to converge lower to this junk bond market stress indicator (JBMSI). Chart 3Bond Market Not Buying Stock Market Euphoria
Bond Market Not Buying Stock Market Euphoria
Bond Market Not Buying Stock Market Euphoria
This week we are downgrading a niche tech subgroup that has gone parabolic and updating another early-cyclical tech subindex. The overall corporate bond ratings migration data (defined as downgrades minus upgrades as a percent of total) corroborates the JBMSI message and warns that the steep divergence with stocks is unsustainable (corporate bond ratings migration data shown inverted, middle panel, Chart 4). Chart 4Unsustainable Divergences
Unsustainable Divergences
Unsustainable Divergences
Similarly, the S&P 500’s net earnings revision ratio is also negative and before long it will exert downward pull on SPX momentum (bottom panel, Chart 4). Under such a backdrop, we continue to recommend investors avoid chasing the broad equity market higher and instead build up their cash coffers, at least until we get a definitive signal that the path of least resistance is higher for profits. This week we are downgrading a niche tech subgroup that has gone parabolic and updating another early-cyclical tech subindex. Sell The Semi Equipment Exuberance Tech stocks have been on a tear with the sector besting the SPX by over 40% since 2015. While such a breakneck pace is unsustainable, what is missing from this outperformance is relative forward earnings participation. In fact, tech profit expectations stalled versus the overall market in late-2018 and have not been able to keep up with relative share prices. In other words, the forward multiple has skyrocketed and is now trading at a 15% premium to the SPX, at a time when relative margins are sinking like a stone (Chart 5). Importantly, given that stock performance should follow profit performance we are perplexed by this dynamic with investors religiously bidding up the sector’s forward multiple. Tack on the recent news of a plunge in overall tech capex growth – especially excluding software – and the tech sector’s bleak profit outlook dims further (Chart 6). Worryingly, within the tech sector the semiconductor equipment space is even more puzzling. Chart 7 shows that relative forward profits are trailing relative share prices as investors have extrapolated the recent positive trade news far into the future. As a reminder this index has a 90% foreign sales exposure with roughly 30% of sales originating from China. As a result, the S&P semiconductor equipment forward P/E is just below the broad market, nearly doubling on a year-over-year basis (middle panel, Chart 7). Chart 5Mind The Gap
Mind The Gap
Mind The Gap
Chart 6Even Tech Investment Is Cracking
Even Tech Investment Is Cracking
Even Tech Investment Is Cracking
The last time we tried to lean against semi equipment exuberance on the back of deteriorating profit fundamentals was on July 8 when we downgraded this index to underweight. But, we were offside and thankfully our risk management metric (stop loss at -7%) limited our downside a mere ten days later. Chart 7Sell Semi Equipment Stocks
Sell Semi Equipment Stocks
Sell Semi Equipment Stocks
Since then, relative share prices have skyrocketed by 40% and we now have more confidence to re-enter our position. Today we recommend a downgrade in the S&P semi equipment index to a below benchmark allocation. This is a speculative/tactical downgrade and thus we also set a trailing stop loss near the -10% relative return mark. While bulls would buy this breakout, we are sticking our heads out and recommend selling the strength and warn that the S&P semi equipment all-time highs look more like a mania, eerily similar to the dotcom bubble era (Chart 8). Chart 8Chip Equipment Mania
Chip Equipment Mania
Chip Equipment Mania
The contracting ISM manufacturing survey signals that relative share price momentum running at a 60%/annum clip is unwarranted and bound to return to earth (second panel, Chart 9). The same holds true for relative forward profit and revenue growth expectations, especially given the ongoing contraction in global semi sales (third & bottom panels, Chart 9). This deficient demand for semis and therefore semi equipment manufacturers is also apparent in deflating DRAM prices, our industry pricing power proxy. Historically, relative profit expectations and pricing power have moved in lockstep and the current message is to fade sell-side analysts’ buoyancy. Net earnings revisions have slingshot from extreme pessimism to extreme optimism during the past quarter and are vulnerable to disappointment (Chart 10). Chart 9To The Moon…
To The Moon…
To The Moon…
Chart 10…And Back?
…And Back?
…And Back?
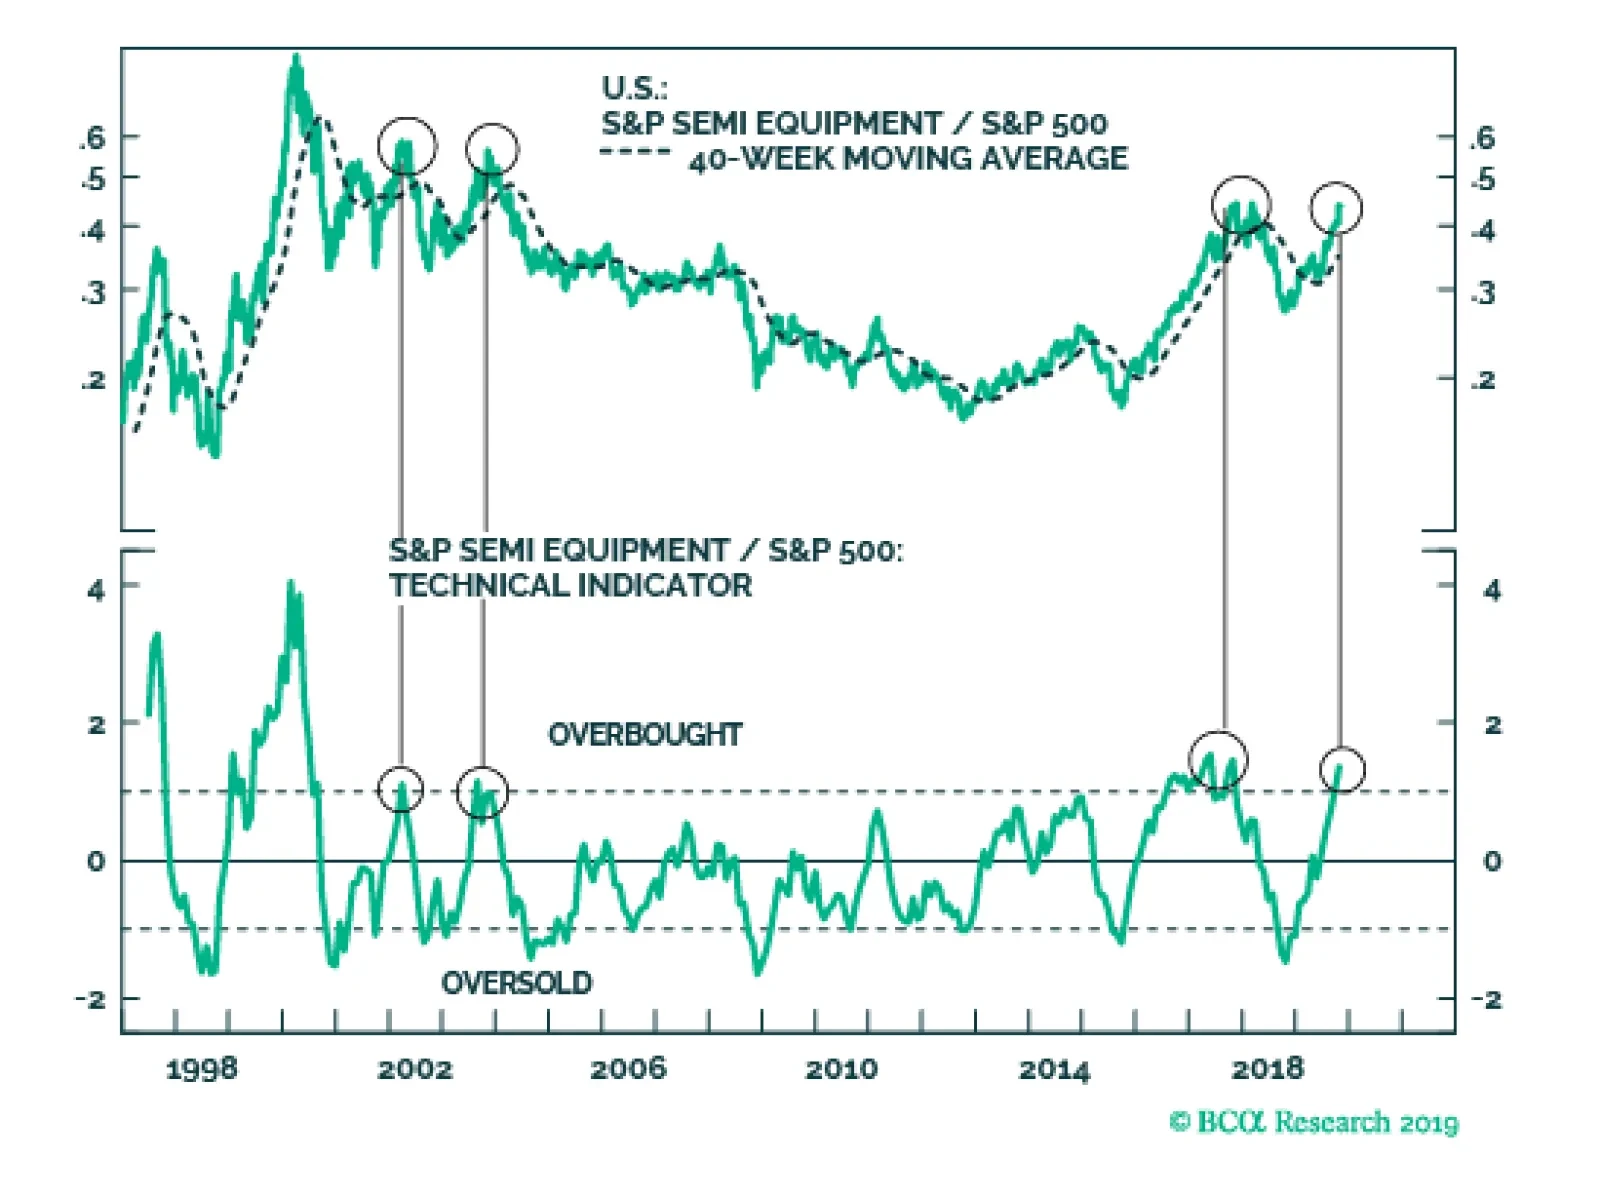
Not only is the relative share price momentum running at the fastest clip in 19 years, but our proprietary Technical Indicator is also signaling that it is a good time to shun away from these hyper-cyclical tech stocks. The last three times our TI spiked to over one standard deviation above the historical mean, relative share prices corrected on average by 36% in the ensuing 12-18 months (Chart 11). While we are confident to downgrade this index to underweight, there is a risk to our bearish view. Were the U.S. dollar to depreciate definitively from current levels, then it would reflate the global economy and put this position offside. In fact, there are some green shoots in the emerging markets that are appearing, but in order for them to blossom further and not get nipped in the bud the trade-weighted U.S. dollar has to fall (Chart 12). Chart 11Time To Be Contrarian
Time To Be Contrarian
Time To Be Contrarian
In sum, lack of profit growth, deficient industry demand, perky valuations and extremely overbought conditions all suggest that the time is ripe for an underweight stance in the S&P chip equipment index. Chart 12Risk To View: U.S. Dollar The Global Reflator
Risk To View: U.S. Dollar The Global Reflator
Risk To View: U.S. Dollar The Global Reflator
Bottom Line: Downgrade the S&P semi equipment index to underweight, today with a stop loss at the -10% relative return mark. The ticker symbols for the stocks in this index are: BLBG – S5SEEQ – AMAT, LRCX, KLAC. Is Semi Euphoria Warranted? Similar to the broad tech space and the S&P semiconductor equipment subgroup, semi producers are also showing signs of excess. Chart 13 shows that relative forward EPS are in a clear and steep downtrend with no end in sight, whereas relative share prices are near post GFC highs, pushing the semi forward P/E on a par with the SPX. While the relative margin squeeze in chip stocks has been a whopping 5%, semi forward margins are still projected to outpace overall market by an impressive 15% (bottom panel, Chart 13). Trailing semiconductor earnings are contracting and our newly created top-down chip profit growth model is sputtering, warning that more earnings pain lies ahead (semi pricing power, global exports and the greenback comprise our proprietary S&P semiconductors earnings model, Chart 14). While chip earnings season has been a mixed bag with INTC on the bullish side and TXN on the bearish camp, TXN’s CFO commentary really grabbed our attention musing that: “When there are tensions in trade and obstacles to trade, what do businesses do? They become more cautious. And they pull back. And we are at the very end of a long supply chain. And when the ones at the very front pull back, it becomes a traffic jam” (emphasis ours). Chart 13Falling Profits Should Exert Downward Pull On Stocks
Falling Profits Should Exert Downward Pull On Stocks
Falling Profits Should Exert Downward Pull On Stocks
Chart 14BCA Chip Profit Growth Model Is Bearish
BCA Chip Profit Growth Model Is Bearish
BCA Chip Profit Growth Model Is Bearish
Our global semi sales-to-inventories ratio is still contracting also warning that the path of least resistance is lower for chip profits (Chart 15). In other words, the inventory liquidation phase has just began and steep price concessions to rebalance the markets will continue to weigh on the sector’s profit prospects. With regard to chip final-demand, while 5G euphoria has gripped the sector, our proprietary global auto sales proxy and global capex indicator (using the IFO’s World Economic Survey dataset) underscore that the global chip down cycle is far from over (Chart 16). Chart 15Semi Down Cycle …
Semi Down Cycle …
Semi Down Cycle …
Chart 16… Is Far…
… Is Far…
… Is Far…
Netting it all out, the chip down cycle is ongoing and leading global semi sales indicators remain downbeat. Other macro variables confirm that semi end-demand remains feeble. The global manufacturing PMI is waning and our diffusion index is probing multi-year lows. Our in-house calculated Global ZEW survey is also heralding additional global semi sales weakness in the coming months as it is hovering near levels last hit during the Great Recession (middle panel, Chart 17). Chinese electronics imports remain in contractionary territory (bottom panel, Chart 17) and U.S. new orders for computers & electronic products are on the verge of contraction (not shown). Despite this souring backdrop, investors have given the semi industry the benefit of the doubt and are anticipating a swift final-demand recovery. Our indicators suggest otherwise, and we expect relative share prices to converge lower to still contracting relative profit and revenue estimates (Chart 18). Chart 17…From Over…
…From Over…
…From Over…
Chart 18…But Investors Are Mesmerized
…But Investors Are Mesmerized
…But Investors Are Mesmerized
Netting it all out, the chip down cycle is ongoing and leading global semi sales indicators remain downbeat. Moreover, our semi profit growth model is waving a yellow flag, compelling us to put the S&P semiconductors index on downgrade alert. Bottom Line: Stay on the sidelines in the S&P semiconductors index for now, remove the upgrade alert and put it on downgrade watch. Stay tuned. The ticker symbols for the stocks in this index are: BLBG – S5SECO – INTC, TXN, ADI, AMD, MXIM, XLNX, MCHP, NVDA, AVGO, QCOM, MU, SWKS, QRVO. Anastasios Avgeriou U.S. Equity Strategist anastasios@bcaresearch.com Footnotes 1. Please see BCA U.S. Equity Strategy Report, “Resilient” dated May 14, 2018, available at uses.bcaresearch.com. 2. https://www.wsj.com/articles/wave-of-financial-stress-hits-low-rated-companies-11571736606 Current Recommendations Current Trades Size And Style Views Stay neutral cyclicals over defensives (downgrade alert) Favor value over growth Favor large over small caps (Stop 10%)
No Change In The Electrical Components & Equipment Industry
No Change In The Electrical Components & Equipment Industry
Underweight This week’s Eaton Corporation weak earnings release was good news for our underweight S&P electrical components & equipment (EC&E) position. More specifically, ETN reported contracting revenues and trimmed 2019 profit guidance. None of this comes as a surprise given the sector’s high exposure to international markets and sensitivity to the U.S. dollar (top panel). Further, ever since the GFC the ISM manufacturing survey’s export subcomponent has been a good predictor of relative share prices. PMI new export orders currently disagree with the recent tick up in relative share price momentum and warn of further losses in the latter in the coming months (bottom panel). On the domestic front, there are also no clear signs of improvement as the industry’s new orders-to-inventories ratio remains in the downtrend, while relative investment spending is flat. Bottom Line: We reiterate our underweight call on the S&P EC&E index. The ticker symbols for the stocks in this index are: BLBG: S5ELCO – AME, EMR, ETN, ROK.
The key question for asset allocators over coming months will be when (or, perhaps, whether) the global manufacturing cycle will turn up. This would trigger a move into more cyclically sensitive markets, for example euro zone equities and Emerging Market assets. It would push up commodity prices and government bond yields, and lead to a weakening of the U.S. dollar. Recommended Allocation
Monthly Portfolio Update: Looking For The Turning-Point
Monthly Portfolio Update: Looking For The Turning-Point
Chart 1First Inklings Of A Pick-Up?
First Inklings Of A Pick-Up?
First Inklings Of A Pick-Up?
For now, the evidence of this turning-point remains ambiguous, and so we hesitate to pull the trigger. BCA Research's calculation of the global OECD Leading Economic Indicator bottomed earlier this year and should lead to a pick-up in manufacturing activity soon (Chart 1). However, only in EM have the manufacturing PMIs bottomed (Chart 1, panel 2) and this was due mainly to a questionably strong September PMI in China which might be reversed when the latest data-point is published on October 1. In the euro zone, the best that one can say is that the PMIs have stopped falling but they remain at a low level (41.9 in Germany, for instance). Some market-based indicators also signal a pick-up – but not yet convincingly (Chart 2). Defensive currencies such as the U.S. dollar and yen have fallen a little against cyclical currencies like the Korean won and Australian dollar. Euro zone equities have shown some strength, especially in the beaten-down auto sector. The global stock-to-bond ratio looks to be about to break out of its recent range. And copper has bounced off its lows. But these moves could turn out to be just noise rather than the beginning of a trend. Chart 2Are Markets Sniffing Out A Turn?
Are Markets Sniffing Out A Turn?
Are Markets Sniffing Out A Turn?
Easier financial conditions are the most likely cause of a rebound. BCA Research's Financial Liquidity Index tends to lead both manufacturing activity and the relative performance of global stocks by around 12-18 months (Chart 3). With the dovish turn of central banks this year, the decline in long-term interest rates (the 10-year U.S. Treasury yield, even after its recent rebound, is only at 1.7% compared to 3.2% a year ago), the contraction in credit spreads, and a pick-up in money supply growth especially in the U.S. (where M2 is now growing 6.5% year-on-year), it would be surprising if these looser monetary conditions do not feed through into stronger activity over coming quarters. Chart 3Financial Liquidity Propels Growth
Financial Liquidity Propels Growth
Financial Liquidity Propels Growth
Chart 4Could Inflation Now Slow?
Could Inflation Now Slow?
Could Inflation Now Slow?
Indeed, one can easily imagine a scenario next year where growth rebounds but inflation slows (due to the lagged effect of this year’s weaker growth, Chart 4), allowing central banks to remain dovish for some time. This non-inflationary accelerating growth would be highly positive for risk assets and negative for the U.S. dollar. Chart 5 shows how various asset classes behaved in such an environment in the past. Chart 5How Assets Behaved Under Rising Growth/Falling Inflation
Monthly Portfolio Update: Looking For The Turning-Point
Monthly Portfolio Update: Looking For The Turning-Point
Easier financial conditions are the most likely cause of a rebound. There are some risks to this optimistic scenario, however. Chinese growth remains sluggish with, for example, imports – the most important factor as far as the rest of the world is concerned – falling by 8.5% year-on-year in September and showing no signs of recovery (Chart 6). The acceleration of Chinese credit growth in early 2019 has petered out since the summer and points to a much flatter recovery of activity than was the case in 2016 (Chart 7). A politburo meeting in late October could lead to monetary stimulus being ramped up but, for now, investors should not assume a big reflationary impulse from China. In the developed world, the biggest risk is that the slowdown in manufacturing spills over into employment, consumption, and services. There are some signs in the U.S. that companies are delaying hiring decisions: job openings have fallen, and the employment component of both the manufacturing and non-manufacturing ISMs points to a deterioration in the labor market (Chart 8). Growing CEO pessimism, presumably because of anemic earnings and the trade war, points to continuing weakness in capex and a further decline in activity indicators (Chart 9). Chart 6Chinese Growth Still Sluggish...
Chinese Growth Still Sluggish...
Chinese Growth Still Sluggish...
Chart 7...As Credit Growth Peters Out
...As Credit Growth Peters Out
...As Credit Growth Peters Out
Chart 8Are Firms Starting To Delay Hiring?
Are Firms Starting To Delay Hiring?
Are Firms Starting To Delay Hiring?
Chart 9CEOs Are Not Happy
CEOs Are Not Happy
CEOs Are Not Happy
Chart 10Stocks Should Outperform Cyclically
Stocks Should Outperform Cyclically
Stocks Should Outperform Cyclically
On balance, we still expect global growth to accelerate next year, and therefore global equities to outperform bonds over the next 12 months (Chart 10). But we want to have greater conviction for that view before we recommend more aggressive pro-cyclical tilts. We remain overweight equities versus bonds, but hedge the downside risk through an overweight in cash, and through tilts towards U.S. equities, and DM over EM equities. We continue to recommend hedging against the upside risk of greater Chinese stimulus and a strong rally in cyclical assets through an overweight in global Financials, Industrials, and Energy, and also through a neutral stance on Australian equities, which are a clean play on a Chinese rebound. We continue to look for the right timing to turn more positive on pure cyclical assets such as euro zone equities, and Emerging Markets. Fixed Income: A cyclical pick-up would imply that global government bond yields have further to rise (Chart 11). Our global fixed-income strategists have a short-term target for the 10-year U.S. Treasury yield of 2.1% (versus 1.7% now) and -0.2% for Bunds (-0.4% now), which would take yields back to their 200-day moving averages (Chart 12).1 We continue to recommend a moderate underweight on duration, and prefer TIPS to nominal bonds, since inflation breakevens imply that the Fed will miss its inflation target by 80 basis points a year on average over the next 10 years. In an environment of accelerating economic growth, credit (both investment grade and high-yield)should outperform in both the U.S. and Europe. The most attractive points on the credit curve are BBB-rated bonds in IG, and the riskiest bonds in HY. For more risk-averse investors, agency MBS currently offer an attractive yield pickup over quality corporate credits. Chart 11Growth Will Push Up Yields Further...
Growth Will Push Up Yields Further...
Growth Will Push Up Yields Further...
Chart 12...Initially To Their 200-Day Average
...Initially To Their 200-Day Average
...Initially To Their 200-Day Average
Equities: Any upside for U.S. equities must come from improved earnings performance. Throughout 2019, earnings have been beating overly pessimistic analysts’ forecasts and Q3 looks to be no exception, with EPS growth on track to be much stronger than the -5% year-on-year that analysts forecast going into the results season (Chart 13). Next year, nominal GDP growth of 4% and a weaker U.S. dollar should produce 7-8% EPS growth. But, with a forward PE of 17x and the Fed unlikely to boost the multiple by further rate cuts, upside is limited. In the right economic environment (as described above), euro zone and EM stocks should do much better. We are currently neutral on euro zone equities, but the recent stronger performance by European banks gives us more confidence that we may be able to move to overweight soon (Chart 14). Similarly, our EM strategists have instituted a buy stop on the MSCI EM index and say they will go overweight EM equities if the index in USD terms rises 3% from its current level.2 Chart 13Analysts Are Too Pessimistic On Earnings
Monthly Portfolio Update: Looking For The Turning-Point
Monthly Portfolio Update: Looking For The Turning-Point
Currencies: The first inklings of U.S. dollar weakness over the past month suggest that it may, too, be sniffing out the start of a cyclical rebound, since it tends to be a very counter-cyclical currency (Chart 15). Going forward, relative interest rates are also unlikely to be as bullish a force for the U.S. dollar as they have been in the past few years. For now, we are neutral on the U.S. dollar on a trade-weighted basis, but do see it depreciating against the Australian dollar and the euro over the next 12 months. The British pound has already risen to take into account the lesser probability of a no-deal Brexit, and we would not expect it to move much either way until the General Election result is clear. There are some risks to the optimistic scenario: Chinese growth remains sluggish, and there are signs that U.S. companies are delaying hiring decisions. Chart 14First Signs Of Euro Banks Recovering?
First Signs Of Euro Banks Recovering?
First Signs Of Euro Banks Recovering?
Chart 15Recovery Would Be Dollar Bearish
Recovery Would Be Dollar Bearish
Recovery Would Be Dollar Bearish
Commodities: Industrial metals prices have bottomed out in recent months, in line with Chinese leading indicators (Chart 16). But we will need to see greater Chinese stimulus before we become more positive. Crude oil has moved largely in a range for the past six months, with tightness in supply offset by some weakness in demand, especially from developed economies (Chart 17). With demand likely to pick up in line with the global economy, and supply still constrained by the Saudi/Russia production pact and geopolitical disturbances, our energy strategists see Brent crude averaging $66 a barrel in Q4 and $70 in 2020, versus $60 now. Chart 16Not Enough China Stimulus For Metals To Bounce
Not Enough China Stimulus For Metals To Bounce
Not Enough China Stimulus For Metals To Bounce
Chart 17Oil Kept Down By Weak Demand
Oil Kept Down By Weak Demand
Oil Kept Down By Weak Demand
As last year, the Global Asset Allocation service will not publish a Q1 Quarterly in mid-December. Instead, we will send clients on November 22 our annual report of the conversation between Mr and Ms X and BCA Research’s managing editors. This report will detail BCA's house views on the outlook for the macro environment and investment markets in 2020. We will publish GAA Monthly Portfolio Outlooks on the first business days of December and January. Garry Evans Senior Vice President Chief Global Asset Allocation Strategist garry@bcaresearch.com Footnotes 1Please see Global Fixed Income Strategy Weekly Report “Big Mo(mentum) Is Turning Positive,” dated 29 October 2019, available at gfis.bcaresearch.com. 2For an explanation, please see the Emerging Markets Strategy Weekly Report " EM Local Bonds: A New Normal?" dated 24 October 2019, available at ems.bcaresearch.com. Recommended Asset Allocation Model Portfolio (USD Terms)
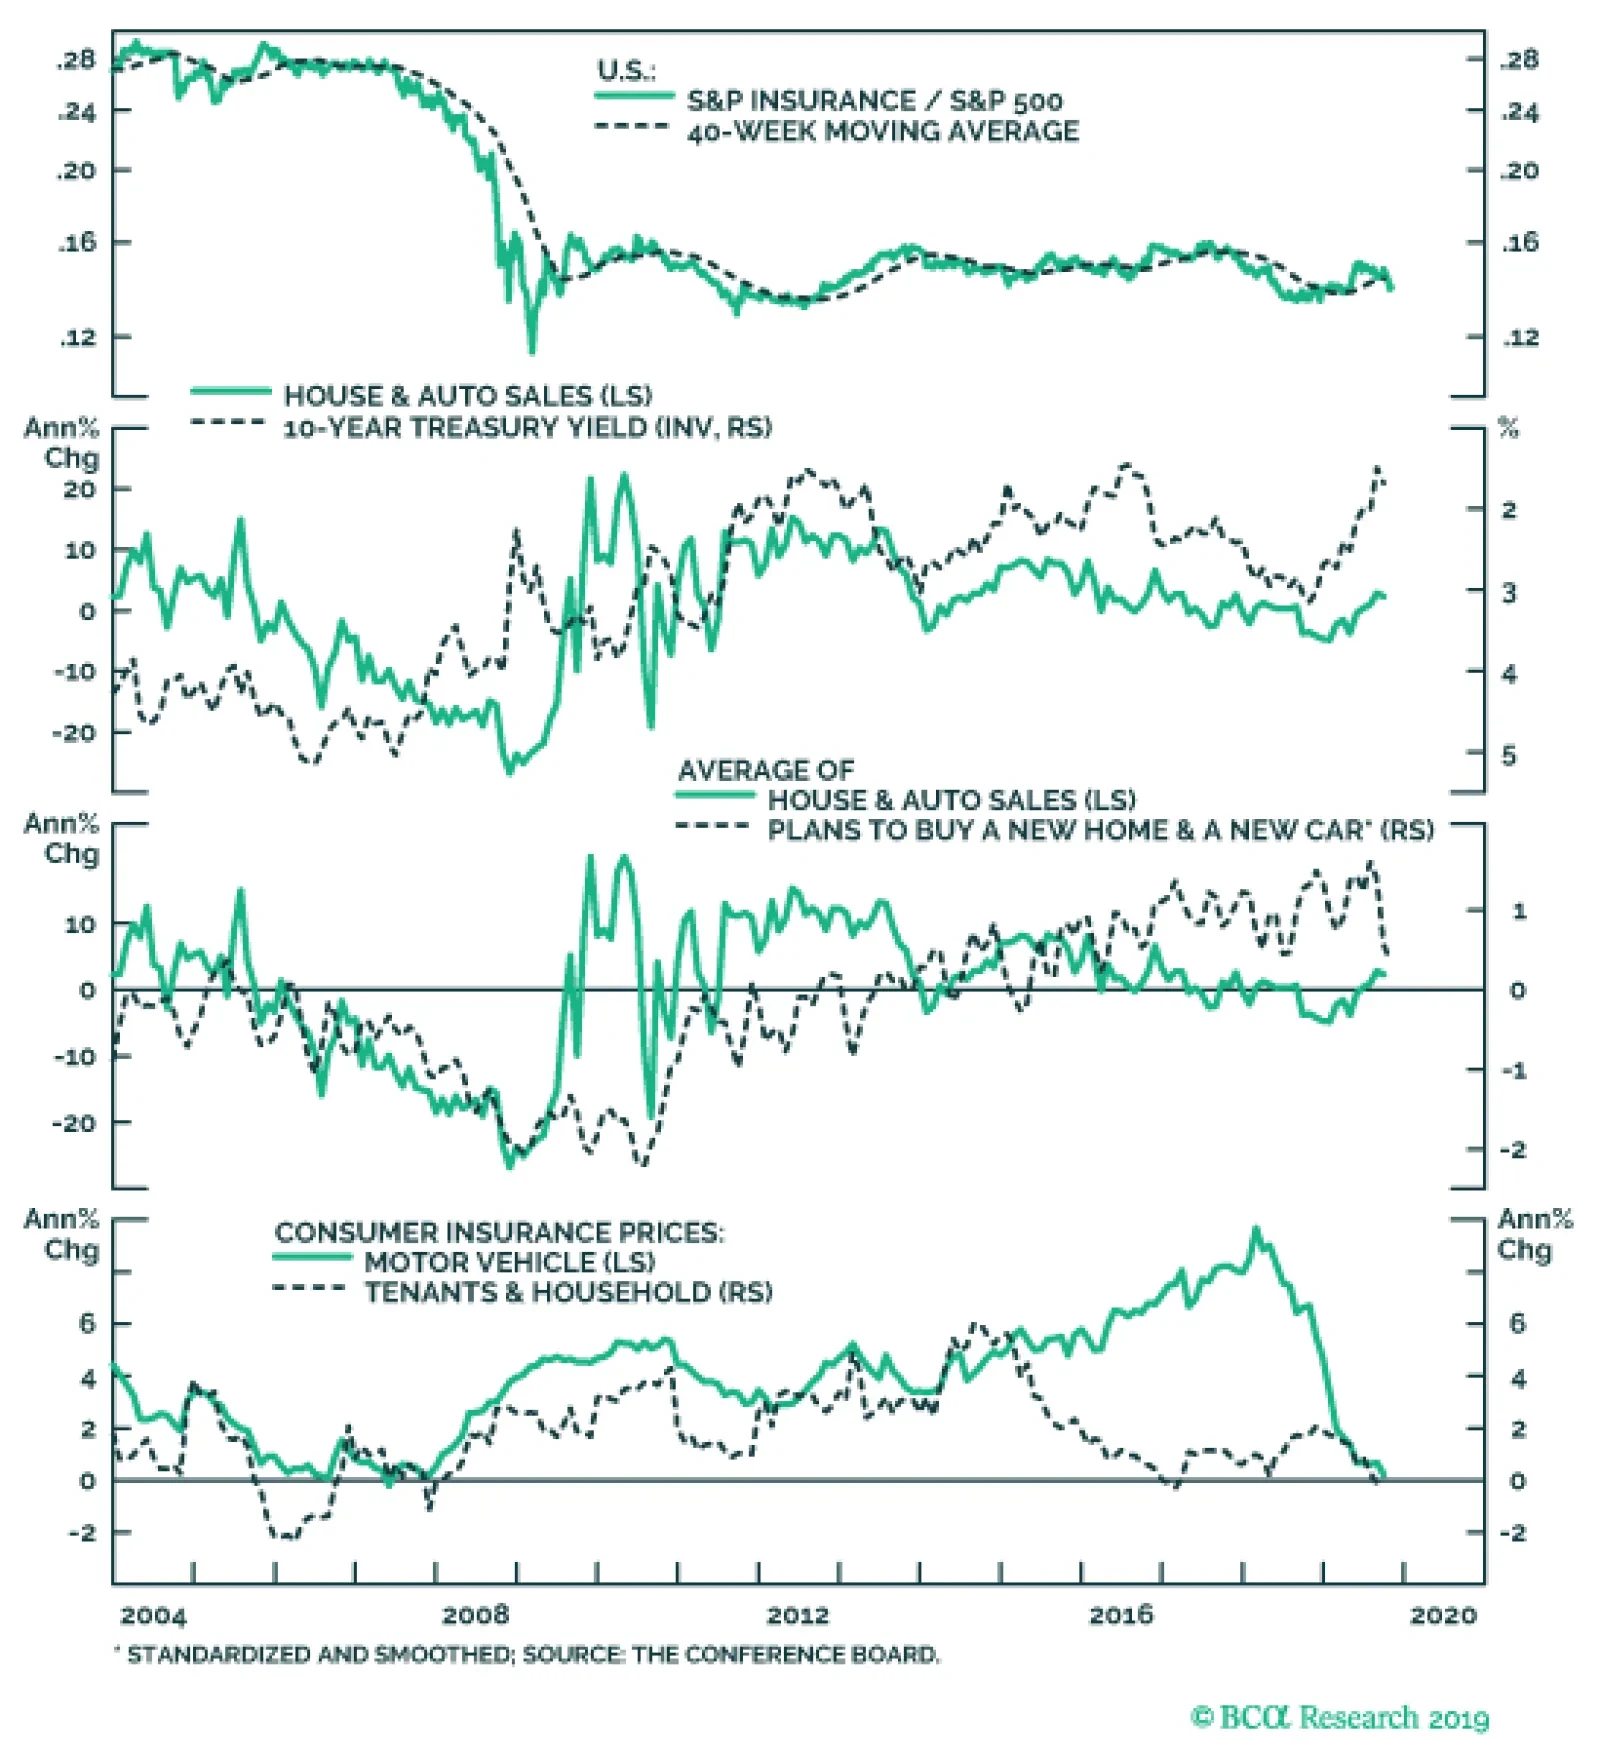
While we remain overweight S&P banks and the broad financials sector, we continue to recommend an underweight stance in the S&P insurance index. This early cyclical subgroup continues to underperform the broad equity market as the industry is facing…

Our technology model has predicted well periods of tech sector outperformance over the past several years. The model suggests that, in addition to being negatively related to prior overbought conditions, periods of technology sector outperformance are…
Underweight The S&P restaurants index is often mistakenly used as an early cyclical vehicle to express the “vibrant consumer” theme. However, the name of the index is deceiving as MCD and SBUX comprise ~80% of the index’s market cap. Such a heavy tilt toward low-cost dining gives the index its defensive properties; up to very recently the relative share price ratio had been joined at the hip with our defensive sector gauge (top panel, on the next page). We remain underweight the S&P restaurants index and expect that the recent steep divergence with safe haven stocks will narrow via a “catch down” phase in the former. Forward looking profit fundamentals also corroborate that relative share prices have run way ahead of themselves. Real dining PCE is falling like a stone, and has historically been an excellent leading indicator of relative share prices, warning that restaurant stocks are vulnerable to a sizable pullback (PCE shown advanced, middle panel, on the next page). Further, the restaurant performance index is sending a similar message that the relative share price ratio’s path of least resistance remains to the downside (third panel, on the next page). Bottom Line: We remain underweight the S&P restaurants index. The ticker symbols for the stocks in this index are: BLBG: S5REST - MCD, SBUX, YUM, DRI, CMG.
S&P Fast Food Index
S&P Fast Food Index