Sectors
We are downgrading the niche S&P homebuilding index to underweight, as most positive profit drivers are already reflected in relative share prices. Specifically, the drop in interest rates has been more than accounted for by homebuilders. Since…

Cracking Homebuilding Foundations
Cracking Homebuilding Foundations
Underweight In yesterday’s Weekly Report1 we recommended downgrading the niche S&P homebuilding index to underweight, as most, if not all, positive profit drivers are already reflected in relative share prices. The drop in interest rates has been more than accounted for by the year-to-date outperformance in homebuilders and is no longer a positive catalyst. For instance, the mortgage application purchase index (MAPI) initially benefited from the plunge in interest rates, but the recent 30bps rise in the 10-year Treasury signals that the MAPI has tentatively crested (second panel). Simultaneously, lumber prices are gaining steam and coupled with contracting new home prices signal that homebuilding profits will suffer a setback (middle & fourth panels). This stands in marked contrast to the sell-side community that has been ratcheting up profit estimates for the S&P homebuilding index (bottom panel). Bottom Line: Downgrade the S&P homebuilding index to underweight. For additional details on the rationale behind this move please refer to the most recent Weekly Report.1 The ticker symbols for the stocks in this index are: BLBG – S5HOME – DHI, LEN, PHM, NVR. 1 Please See U.S. Equity Strategy, "Is This It?," dated October 21, 2019.
Highlights Portfolio Strategy Soft housing demand, the trough in interest rates, new home price deflation and weak industry employment prospects suggest that an underweight stance is now warranted in the S&P homebuilding index. Firming demand/supply dynamics, IMO Sulfur 2020 regulations, and bombed out relative profit expectations all signal that further gains are in store for pure-play refining equities. Recent Changes Downgrade the S&P homebuilding index to underweight, today. Table 1
Is This It?
Is This It?
Feature Equities made a run for fresh all-time highs last week, continuing to cheer the trade war “phase one” deal and breathing a big sigh of relief on better-than-expected bank earnings. We doubt a real deal will materialize which would include Intellectual Property and the tech sector. Instead all we got was a trade truce, at best. Larry Kudlow’s recent football analogy is worth repeating: “It's like being on the seven-yard line at a football game…And as a long suffering New York Giants fan, they could be on the seven and they never get the ball to the end zone…When you get down to the last 10 percent, seven-yard line, it's tough". As a reminder, steep tariffs remain in place and there are high odds that the damage already done to global trade is severe enough that it will be months before the emergence of any green shoots. Meanwhile, following up on our “chart of the year candidate” we published two weeks ago, we drilled deeper and discovered two additional economically sensitive indexes that have consistently peaked prior to the SPX in the past three cycles (Chart 1). They now comprise the U.S. Equity Strategy’s Equity Leading Indicator – an equally weighted composite of the S&P Banks index, the Russell 2000 index and the Value Line Geometric index – which signals that the easy money has already been made this cycle in the SPX (Chart 2). Chart 1Three Bulletproof Signals...
Three Bulletproof Signals...
Three Bulletproof Signals...
Chart 2...Combined Into One Leading Equity Indicator
...Combined Into One Leading Equity Indicator
...Combined Into One Leading Equity Indicator
Importantly, absent profit growth, it remains extremely difficult for equities to embark on a sustainable fresh leg up by solely relying on multiple expansion. Chart 3 shows our updated Corporate Pricing Power Indicator (CPPI) and it continues to deflate. In fact the steep fall in our CPPI more than offsets the fall in wage growth warning that the margin contraction in the S&P 500 has staying power1 (bottom panel, Chart 3). Drilling beneath the surface, our CPPI is waving a red flag. As a reminder, we calculate industry group pricing power from the relevant CPI, PPI, PCE and commodity growth rates for each of the 60 industry groups we track. Table 2 also highlights shorter term pricing power trends and each industry's spread to overall inflation. Only 42% of the industries we cover are lifting selling prices by more than 1%, and 33% are outright deflating. Worrisomely, only 26% of sectors are raising prices at a faster clip than overall inflation. With regard to pricing power trends, two thirds of the industries we cover are either flat or in a downtrend (Table 2). Chart 3Nil Corporate Pricing Power
Nil Corporate Pricing Power
Nil Corporate Pricing Power
Table 2Industry Group Pricing Power
Is This It?
Is This It?
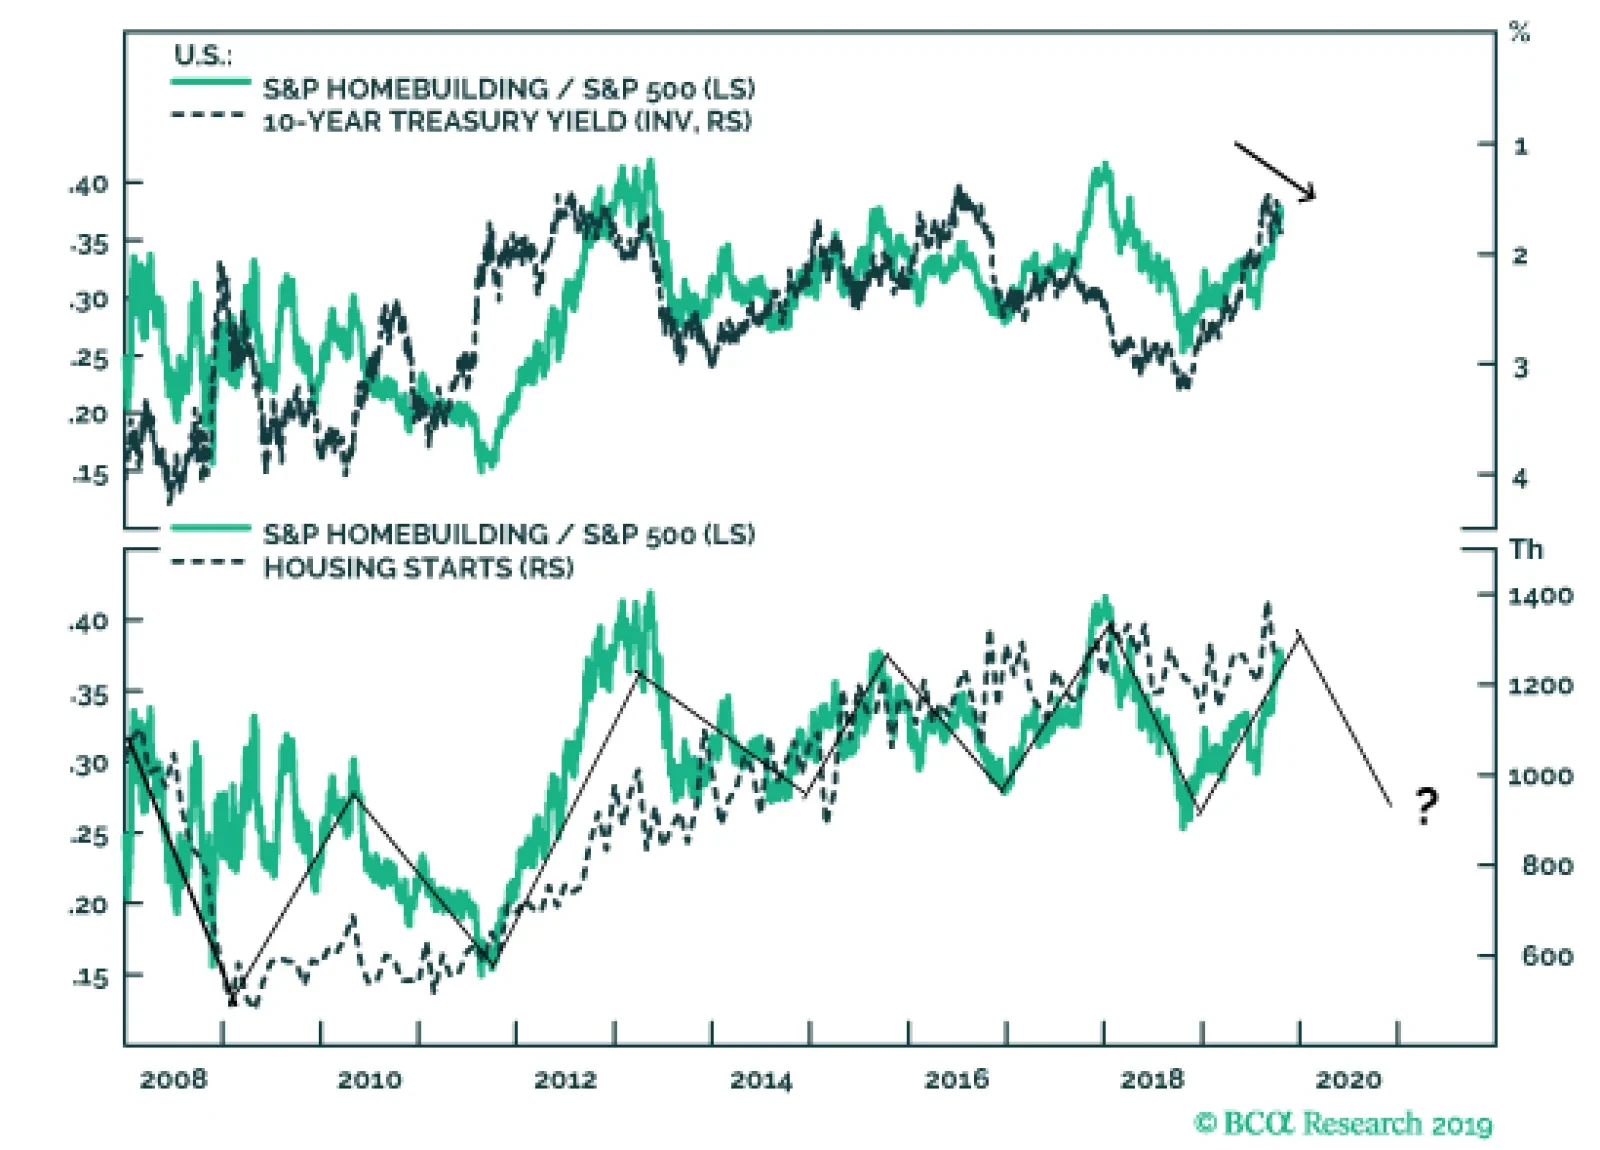
Gold has jumped to the top of our table galloping at a 26%/annum rate (keep in mind it was deflating in our early July update), and only three additional commodity-related industries made it to the top twenty (Table 2). The disappearance of the commodity complex from the top ranks is consistent with global PPI ills and U.S. dollar strength. This week we update two groups, one early and one deep cyclical. Interestingly, defensive sectors have a healthy showing in the top ten spots with five entries. On the flip side, commodities in general and energy-related industries in particular occupy the bottom of the ranks as WTI crude oil is steeply deflating from the October 2018 peak. Adding it up, corporate sector selling price inflation is sinking in line with depressed inflation expectations. As we posited in our recent profit margin Special Report, profit margins have already peaked for the cycle. We reiterate our cautious overall equity market view on a cyclical 9-to-12 month time horizon. This week we update two groups, one early and one deep cyclical. Cracking Homebuilding Foundations We recommend downgrading the niche S&P homebuilding index to underweight, as most, if not all, positive profit drivers are already reflected in relative share prices. Specifically, the drop in interest rates has been more than accounted for by the year-to-date outperformance in homebuilders. Since the Great Recession, homebuilders have been in clearly defined mini up-and-down cycles, and there are high odds we will soon enter a down oscillation (bottom panel, Chart 4). Interest rates bottomed in early September and there is little additional push they can exert to relative share prices (10-year Treasury yield shown inverted, top panel, Chart 4). Chart 4Relative Gains Are Exhausted
Relative Gains Are Exhausted
Relative Gains Are Exhausted
Worrisomely, consumers’ expectations to purchase a new home nosedived last month according to The Conference Board’s survey, and that demand softness will weigh on housing starts and ultimately homebuilding revenues (Chart 5). Chart 5Cracks Forming
Cracks Forming
Cracks Forming
Adding insult to injury, new house selling prices are losing ground to existing home prices, but such discounting is no longer boosting volumes as new home sales market share gains have stalled recently. Already, S&P homebuilding sales are contracting and the risk is that deflation gets entrenched in this construction industry (Chart 6). While the mortgage application purchase index (MAPI) has been rising on the back of the plunge in interest rates, the 30bps rise in the 10-year Treasury yield since September 1 signals that the MAPI has tentatively crested (second panel, Chart 7). Chart 6Contracting Sales
Contracting Sales
Contracting Sales
Chart 7Margin Trouble
Margin Trouble
Margin Trouble
Simultaneously, lumber prices are gaining steam and coupled with contracting new home prices signal that homebuilding profits will suffer a setback (middle & fourth panels, Chart 7). This stands in marked contrast to the sell-side community that has been ratcheting up profit estimates for the S&P homebuilding index (bottom panel, Chart 7). Netting it all out, soft housing demand, the trough in interest rates, deflating new home prices and weakening industry employment prospects suggest that an underweight stance is now warranted in the S&P homebuilding index. On the operating front, the labor market is also emitting a distress signal. Job openings in the construction industry are sinking like a stone and residential construction employment growth is flirting with the contraction zone. Historically, the ebbs and flows in construction jobs have moved in lockstep with relative share price performance and the current message is to expect a drawdown in the latter (Chart 8). Most of the indicators we track underscore a challenging homebuilding backdrop in the coming months. However, there is a key risk to our view: interest rates. Were the 30-year fixed mortgage rate to fall further from current levels, it would entice first time home buyers and cushion the blow to homebuilding demand (mortgage rates shown inverted, top panel, Chart 9). Similarly, bankers are willing extenders of mortgage credit and are reporting rising demand for residential real estate loans as a lagged consequence of falling rates. But, our sense is that the easy gains are exhausted and a reversal is in the offing in most of these measures (Chart 9). Chart 8Heed The Labor Market's Message
Heed The Labor Market's Message
Heed The Labor Market's Message
Chart 9Potentially Lower Rates Are A Key Risk
Potentially Lower Rates Are A Key Risk
Potentially Lower Rates Are A Key Risk
Netting it all out, soft housing demand, the trough in interest rates, deflating new home prices and weakening industry employment prospects suggest that an underweight stance is now warranted in the S&P homebuilding index. Bottom Line: Downgrade the S&P homebuilding index to underweight, today. The ticker symbols for the stocks in this index are: BLBG – S5HOME – DHI, LEN, PHM, NVR. Stick With Refiners While our bullish take on refiners got to a slippery start, it has recovered all the losses and this position is now in the black. Factors are falling into place for additional gains in the coming months and we recommend investors stick with this overweight recommendation in pure-play downstream stocks. Encouragingly, refining stocks have been trouncing the overall energy index of late and have resumed their multi-year relative uptrend (top panel, Chart 10). With regard to the export relief valve, U.S. net exports of refined products are on a secular uptrend and surprisingly unaffected by the greenback’s moves (bottom panel, Chart 10). Tack on the soon to be adopted International Maritime Organization (IMO) Sulfur 2020 regulations in maritime transportation fuel, and U.S. refiners that produce lower-sulfur fuel oil are well positioned to outearn the SPX. Chart 10Resumed Uptrend
Resumed Uptrend
Resumed Uptrend
Domestic refined product consumption remains upbeat and should serve as a catalyst to unlock excellent value in this niche energy subgroup (middle panel, Chart 11). In fact, gasoline consumption is expanding anew on the back of rising vehicle miles travelled (bottom panel, Chart 11). Chart 11Solid Demand...
Solid Demand...
Solid Demand...
Refining product supply dynamics are also moving in the right direction. Gasoline inventories are getting whittled down and should boost beaten down refining relative profit expectations (inventories shown inverted, bottom panel, Chart 12). Importantly, this firming demand/supply backdrop has been a boon to refining margins and should continue to underpin relative share price momentum (middle panel, Chart 12). In terms of what is baked in the cake for this industry, the expected profit growth bar is extremely low and falling and relative value has been fully restored. First in terms of relative valuations, the relative trailing price-to-sales ratio has corrected 35% from the mid-2018 peak (middle panel, Chart 11). On a forward PE ratio basis refiners are extremely appealing compared with the SPX following a near halving in the relative forward PE in the past fifteen months (second panel, Chart 13). Chart 12...Supply Backdrop Is Boosting Crack Spreads
...Supply Backdrop Is Boosting Crack Spreads
...Supply Backdrop Is Boosting Crack Spreads
Chart 13Profit Hurdle Is Uncharacteristically Low
Profit Hurdle Is Uncharacteristically Low
Profit Hurdle Is Uncharacteristically Low
Second, relative EPS growth has sunk below the zero line both twelve months and five years forward. Such pessimism is overdone and we would lean against sell-side bearishness (bottom panel, Chart 13). Even the refining industry’s net earnings revisions ratio has collapsed, which is contrarily positive (third panel, Chart 13). Adding it all up, firming demand/supply dynamics, IMO Sulfur 2020 regulations, and bombed out relative profit expectations all signal that further gains are in store for pure-play refining equities. Bottom Line: Stay overweight the S&P oil & gas refining & marking index. The ticker symbols for the stocks in this index are: BLBG – S5OILR – MPC, VLO, PSX, HFC. Anastasios Avgeriou, U.S. Equity Strategist anastasios@bcaresearch.com Footnotes 1 Please see BCA U.S. Equity Strategy Special Report, “Peak Margins” dated October 7, 2019, available at uses.bcaresearch.com. Current Recommendations Current Trades Size And Style Views Stay neutral cyclicals over defensives (downgrade alert) Favor value over growth Favor large over small caps (Stop 10%)
Highlights The currency market is bifurcated in terms of shorter-term expectations versus longer-term factors. The Swedish krona, Norwegian krone, and British pound are solid long-term buys, but could remain very volatile in the short term. We continue to focus on the crosses rather than outright dollar bets. Remain long SEK/NZD, GBP/JPY, and NOK/SEK. Tighten stops on long GBP/JPY to protect profits. EUR/SEK should top out once global growth improves. Sell the gold/silver ratio at 90, as recommended in last week’s report.1 Feature Chart I-1One Way Street Since 2018
One Way Street Since 2018
One Way Street Since 2018
Of all the G10 currencies we follow, the Swedish krona is probably the one that is the most perplexing. The Riksbank is one of the few central banks to have raised rates this year, but the krona remains the weakest G10 currency. Admittedly, the performance of the Swedish manufacturing sector has been dismal, and was especially so in September, but this has not been a story specific to Sweden alone. The euro area, which is also experiencing a deep manufacturing recession, has seen better currency performance despite a more dovish European Central Bank (ECB). The underperformance of the krona begs the question of whether it signals a much prolonged global manufacturing recession, or is indicative of something more endogenous to Sweden. Put another way, has the driver of USD/SEK (and even USD/NOK) strength been an appreciating dollar, or more domestic factors (Chart I-1)? And if it is the latter, what are the important signposts to look out for should a turnaround be around the corner? The Soft Versus Hard Data Debate The big question for Sweden is whether the manufacturing sector is just in a volatile bottoming process, or about to contract much further. Industrial production is currently growing at 4% year-over-year, but the signal from the soft data is that it should be contracting in the double digits (Chart I-2, top panel). As such there is either a big disconnect between the perception of investors and reality, or we are on the verge of a much deeper manufacturing slump. Exchange rates tend to be extremely fluid in discounting a wide swath of economic data, and in the case of Sweden, in discounting the outcome for global growth. However, with EUR/SEK at 10.8 and USD/SEK at 9.7 – the latter well above its 2008 highs – it is fair to assume that anything other than a deep recession will justify a stronger SEK. One of the more consistent ratios in calling a bottom in the Swedish manufacturing sector in particular (and that of the Eurozone in general) is the manufacturing new orders-to-inventories ratio (Chart I-2, bottom panel). The tick down in September was disconcerting. However, unlike the manufacturing PMI, this ratio is not hitting new lows, tentative evidence that we might be in a volatile bottoming process rather than a protracted slump. The last time we encountered such a divergence was in 2011/2012, at the height of the European debt crisis; in that instance, Swedish hard data ended up sending the right signal for the overall economy. The deterioration in the manufacturing sector has yet to hit domestic consumption in general or the labor market in particular. The deterioration in the manufacturing sector has yet to hit domestic consumption in general or the labor market in particular. The import component of the PMI index remains well above that of exports. Meanwhile, the employment component of the PMI index began to stabilize around the middle of this year, meaning employment growth should bottom at around 1% or so (Chart I-3). Swedish exports are higher up the manufacturing food chain than in most other developed economies, and autos are quite important. But so far, the Swedish economy has weathered the auto slowdown quite well, with production still clocking in at 7% per year. Chart I-2Soft Data Is Much Worse
Soft Data Is Much Worse
Soft Data Is Much Worse
Chart I-3Domestic Demand Is Holding Up Well
Domestic Demand Is Holding Up Well
Domestic Demand Is Holding Up Well
The tick up in the Swedish unemployment rate is problematic, but we do not believe it constitutes a major change in labor market dynamics. Sweden has a long history of higher openness toward asylum seekers and refugees than many other European countries. The Syrian crisis a couple of years ago led to an exceptional surge, where the number of asylum seekers skyrocketed to over 150,000 or almost 1.5% of the total population (Chart I-4). Historically, immigration has provided a big labor dividend to Sweden, allowing growth to outpace both the U.S. and the euro area. But this has also been a source of frictional unemployment, as new migrants integrate into the labor force. Chart I-4A New Pool Of Labor That Has To Be Integrated
A New Pool Of Labor That Has To Be Integrated
A New Pool Of Labor That Has To Be Integrated
Foreign-born workers now constitute about 20% of the total population, a big portion of which need to learn a new language and adopt new skills (Chart I-5A). This growth dividend will be reaped for many years to come. Integration is a politically contentious issue, and so the highly restrictive asylum and reunification law adopted in mid-2016 probably means the immigration boom is behind us. The rise of the anti-immigration Sweden Democrats in the September 2018 elections is a case in point. However, the pivot of the democratic population towards the right has been a global phenomenon, and so is not as negative for Sweden on a relative basis. All that to say, compared to most developed nations, Sweden still enjoys a relatively positive demographic outlook (Chart I-5B). Chart I-5AA Huge Labor Dividend
A Huge Labor Dividend
A Huge Labor Dividend
Chart I-5BNo Apparent Demographic Cliff
No Apparent Demographic Cliff
No Apparent Demographic Cliff
The inflow of migrants has a mixed impact on inflation. While there is downward pressure on wages, due to an increase in the share of employment that pays lower wages, there is still upward pressure on housing and consumption in response to the increased number of workers. This comes on top of a fiscal boost as the government spends more on social services. Meanwhile, the unemployment rate among foreign-born people is around 15%. This means that the Phillips curve is flat for the first few years, before it starts to steepen. But as the new labor force is finally absorbed into the economy, it should start to generate meaningful wage pressures. The Riksbank clearly understands these dynamics, which is why over the prior years, its stance has been dovish even when the Swedish economy has been holding up well. Interest rates were cut to negative territory in 2015 and held at -0.5% (lower than the ECB policy rate) all through the global recovery in 2016 and 2017. Quantitative easing has also been extended up until 2020, well ahead of the ECB’s renewed asset purchase program announcement. Both have tremendously eased monetary conditions in Sweden, including via a weaker currency. Going forward, there are a few key reasons to believe the path of least resistance for the krona is now up: A weak krona has typically helped the manufacturing sector with a lag of twelve months. A weak krona has typically helped the manufacturing sector with a lag of twelve months. Negative divergences only tend to happen ahead of deep recessions. Unless we are in that particular situation now, better demand for relatively cheaper Swedish goods (think Volvo versus BMW) should lead to a stronger krona (Chart I-6). Yes, the Riskbank has been conducting QE, but the pace of expansion in its balance sheet has been slowing in recent quarters. USD/SEK has tended to track relative balance sheet trends between the Riksbank and the Fed, but a gaping wedge has opened up in favor of the krona (Chart I-7). Meanwhile, with the Fed about to re-expand its balance sheet, this should also favor a stronger SEK versus the USD. Chart I-6Swedish Krona And Manufacturing
Swedish Krona And Manufacturing
Swedish Krona And Manufacturing
Chart I-7USD/SEK And Relative Balance Sheets
USD/SEK And Relative Balance Sheets
USD/SEK And Relative Balance Sheets
The Swedish housing market is becoming a thorn in the Riksbank’s side. When negative rates were introduced in 2015, growth in house prices exploded to the tune of 15% year-on-year (Chart I-8). More recently, a curb on migration has allowed a cooling of sorts, but Swedish household leverage remains very elevated. With the memory of the 1990s housing crisis still fresh in their minds, this is making the Riksbank quite uncomfortable with its current policy stance. The carry cost is lower from being short NZD compared to being short the U.S. dollar. Our bias is that though Governor Stefan Ingves prefers to renormalize policy as quickly as possible, given that he is managing a small-open economy with trade a whopping 45% of GDP, but is held hostage to external conditions. The SEK is the cheapest currency in the G10 universe, and could bounce sharply on even the softest evidence indicating global growth has bottomed. Furthermore, rising global growth will tighten resource utilization, which should begin to boost underlying inflationary pressures in Sweden (Chart I-9) Chart I-8House Prices In Sweden##br## Are Bubbly
House Prices In Sweden Are Bubbly
House Prices In Sweden Are Bubbly
Chart I-9Resource Utilization And Inflation In Sweden
Resource Utilization And Inflation In Sweden
Resource Utilization And Inflation In Sweden
In terms of SEK trading strategy, USD/SEK and NZD/SEK tend to be highly correlated; since the SEK has a higher beta to global growth than the kiwi (Sweden exports 45% of its GDP versus 27% for New Zealand). On a relative basis, the Swedish economy appears to have bottomed relative to that of the U.S., making the SEK/NZD an attractive way to play USD/SEK downside. Meanwhile, the carry cost is lower from being short NZD compared to being short the U.S. dollar (Chart I-10). As for EUR/SEK, the cross could consolidate at current levels before heading lower but will ultimately peak once global growth reaccelerates. Chart I-10Remain Long SEK/NZD
Remain Long SEK/NZD
Remain Long SEK/NZD
Bottom Line: We remain long the SEK/NZD as a relative value play, but the true upside lies in the SEK/USD cross. Our bias is that SEK weakness has been driven by the market’s focus on disappointing soft data, while hard data remains relatively resilient. Once it becomes clearer that the global growth environment is not as precarious as the surveys suggest, the krona could bounce sharply. Housekeeping Our long GBP/JPY position hit 5% this week. We are tightening stops to 138 in order to protect profits. We were also stopped out of short EUR/NOK for a 2% loss. We are standing aside for now. EUR/NOK is now trading above 2008 recession levels, which is only justifiable by a prolonged growth recession, but risk management warrants patience for now. Stay tuned. Chester Ntonifor, Foreign Exchange Strategist chestern@bcaresearch.com Footnotes 1 Please see Foreign Exchange Strategy Weekly Report, titled “On Money Velocity, EUR/USD And Silver,” dated October 11, 2019, available at fes.bcaresearch.com Currencies U.S. Dollar Chart II-1USD Technicals 1
USD Technicals 1
USD Technicals 1
Chart II-2USD Technicals 2
USD Technicals 2
USD Technicals 2
Recent data in the U.S. have been soft: Retail sales contracted by 0.3% month-on-month in September. Industrial production fell by 0.4% month-on-month. Both export and import prices fell by 1.6% year-on-year in September. Michigan Consumer Sentiment Index grew to 96 in October, up from 93.2 in the previous month. NY Empire State Manufacturing Index increased to 4 in October, up from 2 in September. Building permits and housing starts both fell by 2.7% and 9.4% month-on-month in September, but the housing recovery remains intact. Initial jobless claims increased to 214K for the week ended Oct 11th. The DXY index depreciated by 0.7% this week. The latest Beige Book summarized that the U.S. economy expanded at a slight-to-modest pace. The slowdown in the manufacturing sector remains the biggest risk to the economy, while trade tensions continue to weigh on business sentiment and capex intensions. The most recent “entente” in trade discussions might represent a pivotal shift from heightened uncertainty that has prevailed throughout the summer. Report Links: On Money Velocity, EUR/USD And Silver - October 11, 2019 Preserving Capital During Riot Points - September 6, 2019 Has The Currency Landscape Shifted? - August 16, 2019 The Euro Chart II-3EUR Technicals 1
EUR Technicals 1
EUR Technicals 1
Chart II-4EUR Technicals 2
EUR Technicals 2
EUR Technicals 2
Recent data in the euro area remain subdued: Headline inflation fell to 0.8% year-on-year in September, the slowest in nearly three years. Core inflation however, increased to 1% year-on-year. Industrial production in the euro area continued to contract, by 2.8% year-on-year in August. The ZEW sentiment in the euro area fell further to -23.5 in October, however this is well above expectations of -33. The ZEW sentiment for Germany also fell to -22.8 in October. It is worth noting that expectations continue to improve relative to the current situation. The trade balance in the euro area improved to €20.3 billion in August, up from the downward-revised €17.5 billion in July. However, this is mostly due to a contraction in imports. EUR/USD rose by 0.9% this week, in part helped by broad dollar weakness. The trade dynamics in the euro area remain worrisome: exports fell by 2.2% year-on-year in August, while imports plunged by 4.1% year-on-year. Notably, year-to-date, the EU’s trade surplus with U.S. grew to €103 billion, up from €91 billion a year earlier, while the trade deficit with China widened further to €127 billion from €116 billion. Report Links: On Money Velocity, EUR/USD And Silver - October 11, 2019 A Few Trade Ideas - Sept. 27, 2019 Battle Of The Central Banks - June 21, 2019 Japanese Yen Chart II-5JPY Technicals 1
JPY Technicals 1
JPY Technicals 1
Chart II-6JPY Technicals 2
JPY Technicals 2
JPY Technicals 2
Recent data in Japan continue to disappoint: Industrial production fell by 4.7% year-on-year in August. Capacity utilization decreased by 2.9% month-on-month in August. The Japanese yen fell by 0.8% against the U.S. dollar this week. Kuroda has again emphasized that the BoJ will not hesitate to act if economic developments continue to deteriorate. On the other hand, while the Fed and the ECB are both on course to expand their balance sheets through asset purchases, it is an open question as to how much more the BoJ can do, beyond yield curve control. We remain long the yen in anticipation that it will require a “Lehman moment” for the BoJ to act aggressively. Report Links: A Few Trade Ideas - Sept. 27, 2019 Has The Currency Landscape Shifted? - August 16, 2019 Portfolio Tweaks Into Thin Summer Trading - July 5, 2019 British Pound Chart II-7GBP Technicals 1
GBP Technicals 1
GBP Technicals 1
Chart II-8GBP Technicals 2
GBP Technicals 2
GBP Technicals 2
Recent data in the U.K. have been mostly negative: The ILO unemployment rate slightly increased to 3.9% in August. Average earnings quarterly growth slowed to 3.8%, however this was above expectations of 3.7%. The Retail price index grew by 2.4% year-on-year in September, a slowdown from 2.6% in the previous month. Headline inflation was unchanged at 1.7% year-on-year in September, while core inflation jumped to 1.7% from 1.5%. Retail sales grew by 3.1% year-on-year in September, up from 2.6% in the previous month. GBP/USD surged by 3.3% this week on optimism towards the European Council Summit on Brexit. From a valuation perspective, the pound is trading at a large discount to its fair value. Should positive Brexit news continue to hit the headlines, the pound could continue to soar. We are long GBP/JPY, which is above 5% in the money. Tighten stop to 138. Report Links: A Few Trade Ideas - Sept. 27, 2019 United Kingdon: Cyclical Slowdown Or Structural Malaise? - Sept. 20, 2019 Battle Of The Central Banks - June 21, 2019 Australian Dollar Chart II-9AUD Technicals 1
AUD Technicals 1
AUD Technicals 1
Chart II-10AUD Technicals 2
AUD Technicals 2
AUD Technicals 2
Recent data in Australia have been modest: NAB business confidence fell further to -2, while conditions improved to 1 in Q3. On the labor market front, the unemployment rate fell further to 5.2% in September. 14.7K jobs were created, consisting of 26.2K full-time jobs and a loss of 11.4K part-time jobs. AUD/USD increased by 0.4% this week. RBA minutes were released earlier this week. Interestingly, it presents a sharp debate about the effects of low rates. On the one hand, lower rates have been theoretically justified to achieve full employment and the inflation target. On the other hand, some RBA members fear that low rates could fuel already inflated house prices. The probability for another rate cut has thus decreased post RBA minutes. Report Links: A Contrarian View On The Australian Dollar - May 24, 2019 Beware Of Diminishing Marginal Returns - April 19, 2019 Not Out Of The Woods Yet - April 5, 2019 New Zealand Dollar Chart II-11NZD Technicals 1
NZD Technicals 1
NZD Technicals 1
Chart II-12NZD Technicals 2
NZD Technicals 2
NZD Technicals 2
Recent data in New Zealand have been negative: Visitor arrivals increased by 1.8% year-on-year in August, slightly down from 2% in the previous month. Headline inflation slowed to 1.5% year-on-year in Q3. NZD/USD has been more or less flat this week. Closely tied to global growth, the New Zealand dollar has been fluctuating with the ebb and flow of the U.S.-China trade headlines. The two countries have agreed on a partial deal last week, however the details remain vague. While the kiwi is a high beta currency, it should unerperform at the crosses. We continue to play the kiwi weakness through the Aussie dollar and the Swedish Krona. Report Links: USD/CNY And Market Turbulence - August 9, 2019 Where To Next For The U.S. Dollar? - June 7, 2019 Not Out Of The Woods Yet - April 5, 2019 Canadian Dollar Chart II-13CAD Technicals 1
CAD Technicals 1
CAD Technicals 1
Chart II-14CAD Technicals 2
CAD Technicals 2
CAD Technicals 2
Recent data in Canada have been relatively strong: The unemployment rate decreased further to 5.5% in September. Moreover, average hourly wages continued to grow by 4.3% year-on-year, up from 3.8% in the previous month. Lastly, 53.7K jobs were created in September, well above expectations of 10K. Both headline and core inflation were unchanged at 1.9% year-on-year in September. The Canadian dollar has appreciated by 1% against the U.S. dollar, on the back of the positive employment data last Friday. All eyes are on the federal election this month, which could be crucial for the future of the Canadian energy sector and environment policies. Report Links: Preserving Capital During Riot Points - September 6, 2019 Portfolio Tweaks Into Thin Summer Trading - July 5, 2019 On Gold, Oil And Cryptocurrencies - June 28, 2019 Swiss Franc Chart II-15CHF Technicals 1
CHF Technicals 1
CHF Technicals 1
Chart II-16CHF Technicals 2
CHF Technicals 2
CHF Technicals 2
Recent data in Switzerland have been positive: The trade surplus (excluding precious metals) widened sharply to CHF 2.88 billion in September. Notably, Swiss exports grew by 8.2% month-on-month to CHF 20.3 billion, led by higher sales of chemical and pharmaceutical products. Swiss imports slightly dropped by 1.4% month-on-month to CHF 17.4 billion. Producer and import prices continued to fall by 2% year-on-year in September. USD/CHF fell by 1% this week. The Swiss franc will continue to fight a tug-of-war between being a defensive currency, but a tool of manipulation by the SNB. Our guestimate is that EUR/CHF 1.06 is an ultimate stress point. Global portfolios should hold the Swiss franc as insurance, for the simple reason that the currency is a structural outperformer. Report Links: Notes On The SNB - October 4, 2019 What To Do About The Swiss Franc? - May 17, 2019 Beware Of Diminishing Marginal Returns - April 19, 2019 Norwegian Krone Chart II-17NOK Technicals 1
NOK Technicals 1
NOK Technicals 1
Chart II-18NOK Technicals 2
NOK Technicals 2
NOK Technicals 2
Recent data in Norway have been depressed: The trade balance shifted to a deficit of NOK 1.2 billion in September. That’s a decrease of NOK 24 billion year-on-year. The Norwegian krone has depreciated by nearly 1% against the U.S. dollar this week. Energy prices remain subdued over the past few weeks. Moreover, the Norwegian trade balance has shifted to a deficit for the first time since November 2017. Exports plunged by 19.5% year-on-year, due to lower sales of energy products, while imports jumped by 12.9% year-on-year. The message is clear – Norway continues to hold up well domestically, but dependence on petroleum exports is introducing volatility into any growth forecasts. BCA has lowered its oil price projections for 2019, which has dampened the appeal of the Norwegian Krone. Stay tuned. Report Links: A Few Trade Ideas - Sept. 27, 2019 Portfolio Tweaks Into Thin Summer Trading - July 5, 2019 On Gold, Oil And Cryptocurrencies - June 28, 2019 Swedish Krona Chart II-19SEK Technicals 1
SEK Technicals 1
SEK Technicals 1
Chart II-20SEK Technicals 2
SEK Technicals 2
SEK Technicals 2
Recent data in Sweden have been neutral: The unemployment rate was unchanged at 7.1% in September. USD/SEK fell by 1.1% this week. As the worst performing G-10 currency this year, the Swedish krona is now trading at a large discount to its fair value. Please refer to our front section this week which presents an in-depth analysis on the Swedish economy and the krona. Report Links: Where To Next For The U.S. Dollar? - June 7, 2019 Balance Of Payments Across The G10 - February 15, 2019 A Simple Attractiveness Ranking For Currencies - February 8, 201 Trades & Forecasts Forecast Summary Core Portfolio Tactical Trades Limit Orders Closed Trades
Going Against The Grain
Going Against The Grain
Overweight Managed health care stocks cheered UnitedHealth Group’s better than expected earnings and higher guidance. The news is offsetting recent HMO uncertainty courtesy of Elizabeth Warren’s slingshot rise in the polls to win the Democratic Presidential nomination (middle panel). Worryingly for HMOs, Warren is also closing in on Trump for the 2020 Presidential Election (bottom panel). Warren is advocating the creation of government-owned pharmaceutical manufacturers, elimination of private health insurance, and price controls on pharmaceuticals. All of her initiatives are a clear negative for the health care stocks in general and HMOs in particular. While the Warren threat is far from negligible, our sister Geopolitical Strategy service still believes that Trump has the upper hand in winning re-election especially if the economy avoids recession. Bottom Line: Stay overweight the S&P managed health care index, despite heightened Presidential Election uncertainty. The ticker symbols for the stocks in the index are: BLBG: S5MANH – UNH, ANTM, HUM, CNC, WCG.
The Message From The Cloud
The Message From The Cloud
Overweight The S&P software index’s – dominated by MSFT – frenetic year-to-date run has lost steam lately, and pure play cloud stocks are sending an unambiguous negative signal. Worryingly, cloud stocks may be sniffing out a services slowdown. Put differently, cloud stocks may be anticipating that the manufacturing sector’s ills are infiltrating services. We have created the U.S. Equity Strategy Cloud Index, comprising five cloud stocks, and their recent drubbing warrants caution for the rest of the software complex (top panel). As a reminder, these stocks troughed in October last year, prior to the SPX and S&P software’s Christmas Eve bottom. Today, we are heeding the leading properties that cloud stocks appear to possess. Bottom Line: Stay overweight the heavyweight S&P software index but sustain the trialing stop at the 27% relative return mark since inception. The ticker symbols in the BCA USES Cloud Index and the S&P Software index are: VEEV, WDAY, NOW, TWLO, SPLK, and BLBG: S5SOFT – MSFT, ORCL, ADBE, CRM, INTU, ADSK, CDNS, SNPS, ANSS, SYMC, CTXS, FTNT, respectively.
Highlights The interim “phase 1” trade agreement reached last week represents a significant step forward towards reaching a détente in the China-U.S. trade war. Regardless of what happens next in the Brexit negotiations, a hard exit will be avoided. Stay long the pound. U.S. earnings growth is likely to be flat in the third quarter, in contrast to bottom-up expectations of a year-over-year decline. Earnings growth should pick up as global growth reaccelerates by year end. Stronger global growth will put downward pressure on the U.S. dollar. Remain overweight global equities relative to bonds over a 12-month horizon. Cyclical stocks should start to outperform defensives. Financials will finally have their day in the sun. Favorable Tradewinds In our Fourth Quarter Strategy Outlook published two weeks ago, we argued that global equities had entered a “show me” phase, meaning that tangible evidence of a de-escalation in the trade war and a recovery in global growth would be necessary for stock indices to move higher.1 We received some positive news on the trade front last Friday. In exchange for suspending the planned October 15th hike in tariffs from 25% to 30% on $250 billion of Chinese imports, China agreed to purchase $40-$50 billion of U.S. agricultural products per year, improve market access for U.S. financial services companies, and enhance the transparency of currency management. Admittedly, there is still much to be done. The text of the agreement has yet to be finalized. Both sides are aiming to conclude the deal by the time of the APEC summit in Santiago, Chile on November 16-17. Considering that a number of key issues remain unresolved, including what sort of enforcement and resolution mechanisms will be included in the deal, further delays or even a breakdown in the talks are possible. The interim deal agreed upon last week also punts the thorny issue of how to handle intellectual property protections to a “phase 2” of the negotiations slated to begin soon after “phase 1” is wrapped up. According to the independent and bipartisan U.S. Commission on the Theft of American Intellectual Property, U.S. producers lose between $225 and $600 billion annually from IP theft.2 China has often been considered among the worst offenders. Given the importance of the IP issue, meaningful progress will be necessary to ensure that tariffs of 15% on about $160 billion of Chinese imports are not introduced on December 15th. Trump Wants A Deal Despite the many hurdles that remain, last week’s developments significantly raise the prospects of a détente in the 18 month-long trade war. As a self-professed “master negotiator,” President Trump has put his credibility on the line by describing the negotiations as a “love fest,” calling the trade pact “the greatest and biggest deal ever made for our Great Patriot Farmers,” and saying that he has “little doubt” that a final agreement will be reached. Just as he did with NAFTA’s successor USMCA – a deal that is substantively similar to the one it replaced – Trump is likely to shift into marketing mode, trumpeting the “tremendous” new deal that he has negotiated on behalf of the American people. From a political point of view, this makes perfect sense. Rightly or wrongly, President Trump gets better marks from voters on his handling of the economy than anything else (Chart 1). A protracted trade war would undermine the U.S. economy, thereby hurting Trump’s re-election prospects. Chart 1Trump Gets Reasonably High Marks On His Handling Of The Economy, But Not Much Else
Kumbaya
Kumbaya
Chart 2Chinese Business Are Not Paying The Bulk Of The Tariffs
Kumbaya
Kumbaya
Notwithstanding his claims to the contrary, the evidence firmly suggests that U.S. consumers, rather than Chinese businesses, are paying the bulk of the tariffs. Chart 2 shows that U.S. import prices from China have barely declined, even as tariff rates on Chinese imports have risen. To the extent that the latest rounds of tariffs are focused on Chinese goods for which there is little U.S. or third-country competition, the ability of Chinese producers to pass on the cost of the tariffs will only increase. If all the tariff hikes that have been announced were implemented, the effective tariff rate on Chinese imports would rise from around 15% as of late August to as high as 25% in December (Chart 3). Such a tariff rate would reduce U.S. household disposable incomes by over $100 billion, wiping out most of the gains from the 2017 tax cuts. Trump can’t let the trade war reach this point. Chart 3Successive Rounds Of Tariffs Have Started To Add Up
Successive Rounds Of Tariffs Have Started To Add Up
Successive Rounds Of Tariffs Have Started To Add Up
Will China Play Hardball? One risk to a favorable resolution to the trade war is that China will increasingly see Trump as desperate to make a deal. This could lead the Chinese to take a hardline stance in the negotiations. While this risk cannot be dismissed, we would downplay it for three reasons: First, even though China’s exporters have been able to maintain some degree of pricing power during the trade war, trade volumes have still suffered, with exports to the U.S. down nearly 22% year-over-year in September. Second, as the crippling sanctions against ZTE have demonstrated, China remains highly dependent on U.S. technologies. This gives Trump a lot of leverage in the trade negotiations. Chart 4Who Will Win The 2020 Democratic Nomination?
Kumbaya
Kumbaya
Third, as Trump himself likes to say, China will find it easier to negotiate with him in his first term in office than in his second. Hoping that Trump would lose his re-election bid might have made sense for China a few months ago when Joe Biden was riding high in the polls; but now that Elizabeth Warren has emerged as the favorite to secure the Democratic nomination, that hope has been dashed (Chart 4). As we noted several weeks ago, China is likely to find Warren no less vexing on trade matters than Trump.3 All this suggests that China, just like Trump, will look for ways to cool trade tensions over the coming weeks. Brexit Breakthrough? As we go to press, the prospects for a Brexit deal have brightened. Although the details have yet to be released, the proposed deal would effectively put Northern Ireland in a veritable quantum superposition where it is both in the European common market and in the U.K. at the same time. This feat will be achieved by keeping Northern Ireland within the U.K. political jurisdiction but still aligned with EU regulatory standards. Negotiations could still go awry. Despite Prime Minister Boris Johnson’s assurance that he secured “a great new deal,” the Conservative’s coalition partner, the Northern Irish Democratic Unionist Party, is still withholding its support for the accord. Labour leader Jeremy Corbyn has also rejected the deal, saying that it is even worse than Theresa May’s originally proposed pact. Regardless of what transpires over the coming days, we continue to think that a hard Brexit will be avoided. Throughout the entire Brexit ordeal, we have argued that there was insufficient political support within the British ruling class for a no-deal Brexit. That conviction has only grown as polling data has revealed that an increased share of voters would choose to stay in the EU if another referendum were held (Chart 5). We have been long the pound versus the euro since August 3, 2017. The trade has gained 6.6% over this period. Investors should stick with this position. Based on real interest rate differentials, GBP/EUR should be trading near 1.30 rather than the current level of 1.16 (Chart 6). We expect the cross to move towards its fair value as hard Brexit risks diminish further. Chart 5Brexit Angst: A Case Of Bremorse
Brexit Angst: A Case Of Bremorse
Brexit Angst: A Case Of Bremorse
Chart 6Substantial Upside In The Pound
Substantial Upside In The Pound
Substantial Upside In The Pound
Global Growth Prospects Improving Chart 7Growth Slowdown Has Been More Pronounced In The Soft Data
Growth Slowdown Has Been More Pronounced In The Soft Data
Growth Slowdown Has Been More Pronounced In The Soft Data
Chart 8Manufacturing Output Rebounds Amid The ISM Slump
Manufacturing Output Rebounds Amid The ISM Slump
Manufacturing Output Rebounds Amid The ISM Slump
A détente in the trade war and a resolution to the Brexit saga should help support global growth. The weakness in the economic data has been much more pronounced in so-called “soft” measures such as business surveys than in “hard” measures such as industrial production (Chart 7). Notably, U.S. manufacturing output has stabilized over the past three months, even as the ISM manufacturing index has swooned (Chart 8). As sentiment rebounds, the soft data should improve. Global financial conditions have eased significantly over the past five months, thanks in large part to the dovish pivot by most central banks (Chart 9). The net number of central banks cutting rates generally leads the global manufacturing PMI by 6-to-9 months (Chart 10). In addition, the Fed’s decision to start buying Treasurys again will increase dollar liquidity, thus further contributing to looser financial conditions. Chart 9Easier Financial Conditions Will Boost Global Growth
Easier Financial Conditions Will Boost Global Growth
Easier Financial Conditions Will Boost Global Growth
Chart 10The Effects Of Easing Monetary Policy Should Soon Trickle Down To The Economy
The Effects Of Easing Monetary Policy Should Soon Trickle Down To The Economy
The Effects Of Easing Monetary Policy Should Soon Trickle Down To The Economy
Stepped-up Chinese stimulus should also help jumpstart global growth. Chinese money and credit growth both came in above expectations in September. The PBoC has been cutting reserve requirements, which has helped bring down interbank rates. Further cuts to the medium-term lending facility are likely over the remainder of this year. Changes in Chinese credit growth lead global growth by about nine months (Chart 11). Chart 11Chinese Credit Should Support The Recovery In Global Growth
Chinese Credit Should Support The Recovery In Global Growth
Chinese Credit Should Support The Recovery In Global Growth
Stay Overweight Global Equities While the road to finalizing a “phase 1” trade deal in time for the APEC summit is likely to be a bumpy one, we continue to reiterate our recommendation that investors overweight global stocks relative to bonds over a 12-month horizon. We expect to upgrade EM and European equities over the coming weeks once we see a bit more evidence that global growth is bottoming out. Ultimately, the trajectory of stocks will hinge on what happens to earnings. The U.S. earnings season began this week. As of last week, analysts expected S&P 500 EPS to decline by 4.6% in Q3 relative to the same quarter last year according to data compiled by FactSet. Keep in mind, however, that EPS growth has beaten estimates by around four percentage points since 2015 (Chart 12). Thus, a reasonable bet is that U.S. earnings will be flat this quarter, clearing a low bar of expectations. Chart 12Actual EPS Has Generally Beaten Estimates
Kumbaya
Kumbaya
Chart 13Earnings And Nominal GDP Growth Tend To Move In Lock-Step
Earnings And Nominal GDP Growth Tend To Move In Lock-Step
Earnings And Nominal GDP Growth Tend To Move In Lock-Step
The fact that 83% of the 63 S&P 500 companies that have reported earnings thus far have beaten estimates – better than the historic average of 64% – supports the view that current Q3 estimates are too dour. Looking out, earning growth should pick up as nominal GDP growth accelerates (Chart 13). European and EM equities generally outperform the global benchmark when global growth is speeding up (Chart 14). This is due to the more cyclical nature of their stock markets. In addition, as a countercyclical currency, the dollar tends to weaken in a faster growth environment. A weaker dollar disproportionately benefits cyclical stocks (Chart 15). Chart 14EM And Euro Area Equities Usually Outperform When Global Growth Improves
EM And Euro Area Equities Usually Outperform When Global Growth Improves
EM And Euro Area Equities Usually Outperform When Global Growth Improves
Chart 15Cyclical Stocks Will Outperform If The Dollar Weakens
Cyclical Stocks Will Outperform If The Dollar Weakens
Cyclical Stocks Will Outperform If The Dollar Weakens
We would include financials in our definition of cyclical sectors. As global growth improves, long-term bond yields will increase at the margin. Since central banks are in no hurry to raise rates, yield curves will steepen. This will boost bank profits and share prices (Chart 16). Cyclical stocks are currently quite cheap compared to defensives (Chart 17). Likewise, non-U.S. equities are quite inexpensive compared to their U.S. peers, even if one adjusts for differences in sector composition across regions. While U.S. stocks trade at 17.5-times forward earnings, international stocks trade at a more attractive forward PE ratio of 13.7. The combination of higher earnings yields and lower interest rates abroad implies that the equity risk premium is roughly two percentage points higher outside the United States (Chart 18). Chart 16Steeper Yield Curves Will Benefit Financials
Steeper Yield Curves Will Benefit Financials
Steeper Yield Curves Will Benefit Financials
Chart 17Cyclical Stocks Are More Attractive Than Defensives
Cyclical Stocks Are More Attractive Than Defensives
Cyclical Stocks Are More Attractive Than Defensives
Chart 18The Equity Risk Premium Is Quite High, Especially Outside The U.S.
The Equity Risk Premium Is Quite High, Especially Outside The U.S.
The Equity Risk Premium Is Quite High, Especially Outside The U.S.
We expect to upgrade EM and European equities over the coming weeks once we see a bit more evidence that global growth is bottoming out. Peter Berezin, Chief Global Strategist Global Investment Strategy peterb@bcaresearch.com Footnotes 1Please see Global Investment Strategy, “Fourth Quarter 2019 Strategy Outlook: A ‘Show Me’ Market,” dated October 4, 2019. 2 “Update to IP Commission Report: The Report of the Commission on the Theft of American Intellectual Property,” The National Bureau of Asian Research, 2017. 3Please see Global Investment Strategy Weekly Report, “Elizabeth Warren And The Markets,” dated September 13, 2019. Strategy & Market Trends MacroQuant Model And Current Subjective Scores
Kumbaya
Kumbaya
Strategic Recommendations Closed Trades
Banks Earnings Deluge
Banks Earnings Deluge
Overweight (Downgrade Alert) Banks got earnings season off to a great start with heavyweight JPM (and the majority of the rest of the industry) reporting solid earnings. One of the key risks to our overweight banks call that we have been highlighting recently is the inverted yield curve infecting net interest margins (NIM), and JPM acknowledged a more “challenging interest rate backdrop” and that the economy had “slowed slightly”. Importantly, the previous drubbing in interest rates is stimulating credit demand and providing a volume offset across the board as highlighted by our in-house calculated aggregate Fed Senior Loan Officer survey indicators (middle & bottom panels). Bottom Line: Stay overweight the compellingly valued S&P banks index, but keep the index on downgrade watch courtesy of NIM and manufacturing sector related risks. The ticker symbols for the stocks in this index are: BLBG: S5BANKX – WFC, JPM, BAC, C, USB, PNC, BBT, STI, MTB, FITB, CFG, RF, KEY, HBAN, CMA, ZION, PBCT, SIVB, FRC.
Today we are also publishing a Special Report titled Chinese Auto Demand: Time For A Recovery? Highlights India is the third-largest world consumer of crude oil. Hence, fluctuations in its oil consumption is a non-negligible factor behind global oil prices. India’s petroleum demand growth is slowing cyclically due to the domestic demand slump and a dramatic drop in vehicle sales. This, combined with China’s ongoing slowdown in petroleum product demand, will have a non-trivial impact on oil prices in the next six months. From a structural perspective, India’s long-term demand growth for petroleum is decelerating as well. Feature India’s petroleum products consumption growth is slowing. Chart 1India Is The World's Third Largest Crude Oil Consumer
India Is The World's Third Largest Crude Oil Consumer
India Is The World's Third Largest Crude Oil Consumer
India is the world’s third-largest consumer of crude oil, guzzling 5% of global consumption (Chart 1). Hence, fluctuations in India’s crude oil/petroleum consumption is a non-negligible factor affecting global oil prices. India’s petroleum products consumption growth is slowing. This comes on top of China’s ongoing petroleum demand deceleration. Together, the two countries account for 19% of the world’s oil intake. Therefore, deceleration in their oil consumption growth will have a considerable impact on the outlook for global oil demand growth. A Pronounced Cyclical Oil Demand Slump Indian petroleum consumption growth has decelerated significantly on the back of slumps in Indian domestic spending and economic activity (Chart 2). Please click on this link for an in-depth analysis on the domestic demand slump in India. Chart 2Indian Petroleum Consumption Growth Has Been Dwindling
Indian Petroleum Consumption Growth Has Been Dwindling
Indian Petroleum Consumption Growth Has Been Dwindling
Specifically, vehicle purchases and industrial sectors have been hit hard. These sectors are critical for Indian petroleum consumption, since transportation demand accounts for 50% and industrial activity for around 25% of total petroleum consumption (Chart 3). Indian vehicle sales have been in freefall. Chart 3Transportation & Industry Guzzle The Most Fuel In India
bca.ems_sr_2019_10_17_001_c3
bca.ems_sr_2019_10_17_001_c3
Chart 4Indian Vehicle Sales Are In Deep Contraction
Indian Vehicle Sales Are In Deep Contraction
Indian Vehicle Sales Are In Deep Contraction
Indian vehicle sales have been in freefall. Chart 4 shows passenger car sales are shrinking at 30% and sales of two and three-wheeler units are contracting at 20% from a year ago. Moreover, commercial vehicles and tractor unit sales are falling at annual rates of 35% and 10%, respectively. Chart 5 illustrates that the number of registered vehicles is expanding at a lower rate than before – i.e., its second derivative has turned negative. This signals a further growth slowdown in gasoline and diesel consumption. We use the second derivative in this analysis because registered vehicles are a stock variable. However, we are trying to explain changes in petroleum consumption which is a flow variable. Therefore, the second derivative of a stock variable (the number of registered cars on the road) explains the first derivative of a flow variable (the growth rate of oil consumption). Looking ahead, vehicle sales will remain in the doldrums because of a lack of financing. In particular, the impulse on auto loans issued by commercial banks is negative (Chart 6). Chart 5Slowing Growth Of Vehicles On The Road = Weaker Pace Of Fuel Consumption
Slowing Growth Of Vehicles On The Road = Weaker Pace Of Fuel Consumption
Slowing Growth Of Vehicles On The Road = Weaker Pace Of Fuel Consumption
Chart 6Indian Banks: Negative Vehicle Loan Impulse
Indian Banks: Negative Vehicle Loan Impulse
Indian Banks: Negative Vehicle Loan Impulse
More worrisome is the ongoing turmoil in India’s non-bank finance sector (NBFCs), which has also significantly hit auto sales. In the past, the NBFC sector played a major role in funding Indian auto purchases. For instance, according to the ICRA, an independent rating agency in India, NBFCs have helped fund the purchases of 65% of two-wheelers, 30% of passenger cars and around 55% of commercial vehicles – both new and used. Given these non-bank finance companies are currently facing formidable funding and liquidity pressures amid rising NPLs (Chart 7), they are being forced to shrink their balance sheets. This is damaging to auto sales. Please click here for an in-depth analysis on the Indian banking and non-bank finance sectors. Chart 7Major Asset-Liability Mismatches Among Indian Non-Bank Finance Sector
Major Asset-Liability Mismatches Among Indian Non-Bank Finance Sector
Major Asset-Liability Mismatches Among Indian Non-Bank Finance Sector
Chart 8India's Capex Has Been Weak
India's Capex Has Been Weak
India's Capex Has Been Weak
Turning to the industrial sector, overall Indian capital spending has been weak. India’s real gross fixed capital formation has rolled over, the number of capex projects underway is nosediving and both capital goods imports and production are contracting by 7% and 12% on an annual basis (Chart 8). Falling industrial activity has taken a toll on the consumption growth of petroleum products with industrial applications, such as bitumen, naphtha and petroleum coke, etc. The growth rate in demand for these products is dropping — a significant development since they account for 25% of overall petroleum consumption in India.1 Bottom Line: India’s petroleum consumption growth has been slowing drastically from a cyclical perspective. And Moderating Structural Oil Demand Growth It appears there are structural factors at play that will also reduce India’s long-term demand for petroleum. On top of the cyclical demand slowdown, it appears there are structural factors at play that will also reduce India’s long-term demand for petroleum: Chart 9Impressive Efficiency Gains In India's Vehicle Fleet
Impressive Efficiency Gains In India's Vehicle Fleet
Impressive Efficiency Gains In India's Vehicle Fleet
The fuel efficiency of India’s vehicle fleet is markedly improving (Chart 9). Additionally, since 2015-16 the Indian government has been proactively pursuing new emission/fuel efficiency standards. For instance, emissions standards for new passenger vehicles will fall to 4.2 L/100 KM by 2023 down from its current level of 4.6 L/100 KM. This will lead to a 7% reduction in auto fuel consumption. While this is not a large reduction, the government has the scope to implement even stricter standards since Indian car makers are easily meeting these targets. Finally, the Indian government has been aggressively promoting electric vehicles (EVs) as an alternative to traditional autos. It has made the advancement of this sector a priority. Ownership of EVs is currently negligible in India. However, the government is pushing for EVs to make up 30% of vehicle sales by 2030. In addition, it has been providing incentives such as sales tax cuts and subsidies to the sector. Finally, Mahindra and Tata Motors are already establishing a lead in the EV industry and are developing new EV models in collaboration with foreign automakers. Bottom Line: The pace of India’s structural demand for petroleum will also be downshifting. Oil Inventory Not A Critical Factor Chart 10China: Oil Inventory Drives Oil Imports
China: Oil Inventory Drives Oil Imports
China: Oil Inventory Drives Oil Imports
Inventory accumulation and destocking can play an important role in oil price fluctuations. For example, inventory accumulation plays a key role in driving Chinese crude oil imports (Chart 10). There is a dearth of data on Indian oil inventories to make a strong inference about its de- and re-stocking cycles. However, we have the following observations: India has the capacity to store 5.33 million tons worth of strategic oil reserves - equivalent to around 10 days of its crude oil consumption. It is not clear whether or not these reserves are at full capacity. However, even if we assume they are only 50% full and the government decides to fill its reserves all at once, this would require the importation of an additional 2.67 million tons of oil, equivalent to only 1.2% of Indian crude oil imports and 0.05% of global crude oil demand. This is a negligible amount, and is unlikely to have any impact on global oil prices. Furthermore, while the Indian government is planning to expand its storage capacity by an extra 6.5 million tons, this will only take place in the next six to eight years. Thus, it will not meaningfully affect oil imports in the medium term. Chart 11India: Oil Consumption Drives Oil Imports
India: Oil Consumption Drives Oil Imports
India: Oil Consumption Drives Oil Imports
Finally, India’s crude oil imports are strongly correlated with its petroleum final consumption (Chart 11). Therefore, it is reasonable to assume that Indian consumption – not the oil inventory cycle – is relevant for crude imports, and by extension for oil prices. Bottom Line: India’s petroleum product and crude oil inventory fluctuations are too small to influence the nation’s crude imports and hence global oil prices. Investment Conclusions From a cyclical perspective, Indian final demand for crude oil has been weakening. A major re-acceleration in economic growth and hence oil demand is not imminent. We discuss the outlook for China’s auto sales in a separate report published today. Together India and China consume 19% of world oil, and therefore a deceleration in their oil consumption growth will have a non-trivial impact on the pace of global oil demand growth. Chart 12Expansion Pace Of Vehicles On The Road Has Downshifted In India & China
Expansion Pace Of Vehicles On The Road Has Downshifted In India & China
Expansion Pace Of Vehicles On The Road Has Downshifted In India & China
Our estimations for annual growth in cars on the road (excluding 2-wheelers) has dropped to 5.8% in India and 10.5% in China (Chart 12). This entails a slower pace of oil demand growth than in the past. Besides, if one rightly assumes petroleum consumption per car is declining for structural reasons due to technological advancements by car manufacturers and enforcement of stricter efficiency standards by governments, oil consumption growth will be considerably slower going forward relative to the past 20 years. Together India and China consume 19% of world oil, and therefore a deceleration in their oil consumption growth will have a non-trivial impact on the pace of global oil demand growth. This presents a major risk for crude prices in the next 6 months or so. Beyond the cyclical horizon, the long-term demand outlook for oil is also downbeat. Please note that this is the view of BCA’s Emerging Markets Strategy team, and differs from that of BCA’s house view, which is bullish on oil. Chart 13India’s Relative Equities Performance Benefits From Lower Oil Prices
India's Relative Equities Performance Benefits From Lower Oil Prices
India's Relative Equities Performance Benefits From Lower Oil Prices
In turn, low oil prices are positive for the relative performance of Indian stocks versus the EM equity benchmark (Chart 13). This was among the primary reasons why we upgraded the allocation to this bourse within an EM equity portfolio to neutral from underweight on September 26, 2019. In absolute terms, the outlook for Indian share prices remains downbeat, as discussed in the same report. Finally, to express our negative view on oil prices, we are reiterating our short oil and copper / long gold position recommended on July 11, 2019. Industrial commodities such as copper and oil will continue to underperform gold prices in the medium term (the next six months). Ayman Kawtharani, Editor/Strategist ayman@bcaresearch.com Footnotes 1 Diesel consumption will also be impacted. While the latter is mostly consumed by the transportation sector in India, diesel does have some industrial applications as well. Equities Recommendations Currencies, Credit And Fixed-Income Recommendations
Highlights A recovery in Chinese auto sales is not imminent. Car sales will likely stage only a rate-of-change improvement, moving from deep to mild contraction or stagnation over the next three-to-six months. Low-speed electric vehicles are a cheap substitute for regular low-end cars. Their production requires fewer inputs and parts compared to cars. Hence, their rising penetration will be negative for economic activity at the margin. Auto ownership will continue to rise in China in the years to come. However, this does not necessitate rising car sales. In fact, auto ownership can increase with car sales contracting in each consecutive year. This scenario represents a major risk to auto stock prices. Feature Chart 1Chinese Auto Sales: An Extended Downturn
Chinese Auto Sales: An Extended Downturn
Chinese Auto Sales: An Extended Downturn
Chinese automobile sales have been deep under water for 15 consecutive months. The magnitude of the contraction has been even worse than the one that occurred in 2008-‘09. Annualized sales1 have declined from a peak of nearly 30 million units in June 2018 to 26 million this September (Chart 1). To put this 4-million-unit decline into perspective, only about 5 million units of automobiles were produced in Germany last year. Given the already long and deep contraction, does this mean Chinese auto sales and production are about to stage an imminent recovery? Although a revival sometime next year is plausible, we are not positive in the near term. Car sales will stage a rate-of-change improvement only, moving from deep to mild contraction or stagnation (i.e. zero growth) the next three to six months (Chart 1, bottom panel). Gauging The Demand Outlook Chart 2Marginal Propensity To Spend Is Falling
Marginal Propensity To Spend Is Falling
Marginal Propensity To Spend Is Falling
Reluctance to purchase a car and curtailed financing are the causes of the deep auto sales contraction in China. The factors that have weighed on consumers’ willingness to purchase cars remain intact. First, our indicator for household marginal propensity to spend continues to fall, indicating no immediate signs of a turnaround (Chart 2). Cyclically, decelerating economic activity is weighing on income expectations, prompting consumers to delay their discretionary spending. Besides, the growth rate of disposable income per capita is at the lower end of its historical range and is falling in real (inflation-adjusted) terms (Chart 3). In addition, Chinese households are more leveraged now than their U.S. counterparts (Chart 4). Their debt levels have reached over 120% of annual disposable income. Chart 3Real Disposable Income Growth Is Weakening
Real Disposable Income Growth Is Weakening
Real Disposable Income Growth Is Weakening
Chart 4Chinese Households Are Increasingly Indebted
Chinese Households Are Increasingly Indebted
Chinese Households Are Increasingly Indebted
Meanwhile, the U.S.-China confrontation continues to foster uncertainty among consumers and businesses in the Middle Kingdom. Although some sort of agreement was reached last week, the future of longer-term U.S.-China relations remains highly uncertain. Hence, the potential “phase-one” trade agreement is unlikely to shift Chinese consumers’ and businesses’ overall cautious sentiment. These factors will continue to weigh on consumers’ purchasing behavior, especially on big-ticket items like automobiles. Reluctance to purchase a car and curtailed financing are the causes of the deep auto sales contraction in China. Second, Chinese auto financing penetration rate – measured as the proportion of autos bought using borrowed funds – has risen from 20% in 2014 to about 48%2 last year. This remains well below the 70%-plus penetration rate in major western countries (the U.S., Germany and France), but is not far from the 50% rate in Japan. The rapid increase in the use of auto financing has facilitated auto sales in China over the past several years. Financing for auto purchases has been provided by banks via loans and credit cards, dealer/manufacturer loans and peer-to-peer lending (P2P). While banks contribute about 40% of auto financing and auto dealers/manufacturers account for about 30%, the peer-to-peer platform has become the third major source of auto loans in recent years. Chart 5Limited Auto Financing From Peer-To-Peer Platforms
Limited Auto Financing From Peer-To-Peer Platforms
Limited Auto Financing From Peer-To-Peer Platforms
However, since early last year, bankruptcies and closures of P2P platforms have significantly reduced available auto financing. P2P financing continues to shrink, further depressing loans for auto purchases (Chart 5). Third, there is an ongoing structural decline in consumers’ willingness to purchase cars due to greater traffic congestion, limited parking and improved public transportation. In addition, greater use of ride-sharing and car-sharing services, which the government is aiming to promote, will also continue to reduce the need to buy a car. Concerning government incentives for auto buyers, auto sales have failed to recover, so far this year, despite policy support and significant auto price cuts (Box 1). Although the government recently loosened some restrictive auto sales policies in certain cities,3 the scale was much smaller than what was done earlier this year. As in any market, production decisions are driven by sales, not inventories. Box 1 Policy Support And Auto Price Cut During January-September 2019 Since late January, Chinese authorities have released a set of pro-auto-consumption measures aimed at spurring auto sales. These measures include the approval of 100,000 new license plates in Guangzhou province and an additional 80,000 in Shenzhen. Since May, auto dealers in China have slashed prices of their Emission Standard 5 cars in order to liquidate inventories, as 15 provinces/provincial level cities have been implementing the new emissions standards since July 1, 2019 – one year earlier than the national implementation deadline. According to the law, vehicles that do not meet the new standard will not be allowed to be sold or registered once the new standard is implemented. Another pertinent question to address is whether inventories can be used to identify a bottom in this industry. This is difficult to gauge in China, as inventories at different stages of the supply chain are currently sending conflicting signals. Manufacturers’ inventories have dropped to low levels (Chart 6). Yet, dealers’ inventories remain elevated according to the newly released inventory data for September (Chart 7). Chart 6Auto Manufacturers Inventories Are Low...
Auto Manufacturers Inventories Are Low...
Auto Manufacturers Inventories Are Low...
Chart 7...But Dealers Inventories Remain Elevated
...But Dealers Inventories Remain Elevated
...But Dealers Inventories Remain Elevated
Chart 8Auto Demand Drives Production
Auto Demand Drives Production
Auto Demand Drives Production
As in any market, production decisions are driven by sales, not inventories. The chain reaction always starts from demand: rising sales lead to rising production. Producers do not typically ramp up output when sales are falling, even if inventories are low (Chart 8). Without a strong and durable rise in demand, manufacturers will not significantly increase their inventories. In short, low car inventories among manufacturers could lead to a short-term rise in output. A sustainable and lasting recovery in production, however, is contingent on a cyclical revival in auto sales. Bottom Line: A cyclical recovery in auto sales is not imminent in the next three-to-six months. A Threat From A Cheap Substitute In many small cities (from Tier 3 to Tier 6 cities), towns and villages where auto buyers are more sensitive to prices, consumers are opting to purchase low-speed electric vehicles (LSEVs) – a cheap substitute for regular autos. Last year, LSEV makers sold about 1.5 million units in China, accounting for about 6% of passenger vehicle sales for the year. In comparison, even with massive government subsidies, total new energy vehicle (NEV, mainly including pure electric vehicles and plug-in hybrids) sales only reached 1.2 million units in 2018, 20% lower than LSEV sales. In many small cities, towns and villages consumers are opting to purchase low-speed electric vehicles (LSEVs) – a cheap substitute for regular autos. LSEVs are small, short-range electric vehicles (three- or four-wheeled cars) with top driving speeds below 80km per hour and with a similar look to regular cars.4 They have much lower technical and safety standards: LSEVs are not considered automobiles by the country’s motor vehicle management system. Consequently, official auto production and sales data released by authorities do not include LSEV figures. Chart 9Significant Output Expansion In Low-Speed Electric Vehicles
Significant Output Expansion In Low-Speed Electric Vehicles
Significant Output Expansion In Low-Speed Electric Vehicles
Technically, these vehicles are within some sort of grey area of Chinese regulations, but that has not stopped the industry's remarkable growth. Shandong province accounts for about 40% of the country’s LSEV output. The dramatic LSEV production expansion in the province gives a glimpse into the booming LSEV industry in China (Chart 9). Last year’s LSEV production drop was due to the government’s tightening of LSEV output policies and greater competition from small-size pure electric vehicles, which benefited from government subsidies. Both factors have diminished this year due to policy changes and the termination of subsidies for the small-size pure electric vehicle. Looking forward, consumers will continue purchasing LSEVs as a substitute for lower-end cars. They will have negative effect on low-end car sales, especially when household budgets tighten. Table 1 lays out the main differences between an LSEV and a lower-end passenger car. Clearly, the most attractive feature of an LSEV is its price, which can be as cheap as 10,000 RMB (less than US$2,000) with a big proportion of LSEVs ranging from 20,000 RMB to 30,000 RMB. In comparison, prices of lower-end passenger vehicles in general range from 50,000RMB to 80,000 RMB, more expensive than LSEVs. As nearly half of Chinese households already own an automobile, the potential of future auto sales clearly lies in lower-income households. However, the 2018 NBS household survey showed the annual household disposable income for the lowest 60% percentile rural households was lower than the low-end price of regular auto – 50,000 RMB (US$ 7,050) (Chart 10). In comparison, a much cheaper LSEV will be affordable for them. Given that they are inferior goods, LSEVs could become even more attractive at times of weak disposable income growth. In addition to cheap prices, Box 2 reveals other attractive features that will make LSEVs the most convenient and affordable form of transportation for many potential auto buyers. This will also help promote the popularity of the LSEVs in small cities and rural areas. Table 1The Comparison Between LSEVs And Lower-End Passenger Cars
Chinese Auto Demand: Time For A Recovery?
Chinese Auto Demand: Time For A Recovery?
Chart 10Low-Speed Electric Vehicles: Affordable For Lower-Income Households
Chinese Auto Demand: Time For A Recovery?
Chinese Auto Demand: Time For A Recovery?
Further, this year’s regulatory changes are also favorable for the LSEV industry (Box 3). This marked a clear policy reversal from last year when the government executed a crackdown on LSEV production and issued a policy prohibiting new capacity of LSEVs. Box 2 The Non-Price Reasons For The Increasing Popularity Of The LSEVs The LSEV is more convenient as it is easy to drive and to park because of its small size. The drive range of 100 km per charge of the battery is sufficient for a person who only uses it to go to work or pick up the kids from school. It is particularly useful in small cities and rural areas where the public transportation network is poor. The speed of 40-60 km per hour is also fast enough to drive in small cities and rural area where there are not much road traffic and the roads are often designed for low driving speed. LSEVs also have the benefit of being able to charge from home electrical outlets, eliminating the need to use public charging/fueling infrastructure. Box 3 Policy On LSEV Industry: More Favorable In 2019 Than In 2018 In March, the Ministry of Industry and Information Technology announced that by 2021 the national standards of the “Technical Conditions of Four-Wheel Low-Speed Electric Vehicles” would be established. This will eventually bring the LSEV market under the government’s supervision while giving LSEV makers two years to improve their technology. This will help improve the quality and safety measures of LSEVs. In May and June, over 20 cities started to issue car plates for LSEVs and approved of the LSEVs right to be on the road. This signals that the government is aiming to regulate the LSEV sector in a positive way, rather than simply banning production. Bottom Line: Cheap LSEVs will be a low-cost substitute for regular low-end cars. Their production requires fewer inputs and parts compared to cars. Hence, their rising penetration will be negative for economic activity at the margin. What About NEV Demand? New Electric Vehicle (NEV) sales were a bright spot among all categories of auto sales in China last year, with year-on-year growth of 62%. However, NEV sales growth has decelerated considerably this year as the government began cutting subsidies (Chart 11). NEV sales will remain under pressure. Table 2 shows the timeline of China’s NEV subsidy exit plan, which was released in late March. The subsidy is set to be phased out by 2021. Chart 11New Electric Vehicle Sales Growth Will Slow But Remain Positive
New Electric Vehicle Sales Growth Will Slow But Remain Positive
New Electric Vehicle Sales Growth Will Slow But Remain Positive
Table 2The China’s New Electric Vehicle Subsidy Exit Plan
Chinese Auto Demand: Time For A Recovery?
Chinese Auto Demand: Time For A Recovery?
In comparison to last year, there will be no subsidy at all for pure electric vehicles (PEVs) with recharge mileage of 250 kilometers and lower. This will make it more difficult for mini-PEVs to compete with LSEVs with respect to price. For PEVs with recharge mileage of 250 kilometers and above, the subsidy has also been cut significantly. However, we still expect NEV demand growth to remain positive. The government will continue to maintain zero sales tax on NEVs until the end of 2020. This gives it a major advantage over non-NEV vehicles, which carry the 10% sales tax. In addition, NEVs are exempt from license restrictions on car sales and time or area restrictions on on-road autos, in cities where such policies apply. This is an attractive privilege for car buyers to consider. Current NEVs that can achieve recharge mileage of 300-450 kilometers, sell at a price of RMB 100,000 to RMB 150,000 per unit. They are both affordable and appealing for upper-middle-income and high-income urban households who prefer either green options or energy cost savings. The recharge mileage is sufficient for most daily use, and prices are in line with prices of traditional gasoline or diesel cars. If and as auto sales fail to stage a notable recovery in the next several months, Chinese auto stock prices will likely break down. Bottom Line: With the gradual phasing out of subsidies, the period of exponential NEV sales growth is over. Nevertheless, NEV demand growth will likely remain positive. Investment Implications Chart 12Chinese Auto Stock Prices Could Break Down
Chinese Auto Stock Prices Could Break Down
Chinese Auto Stock Prices Could Break Down
There are three pertinent investment implications to consider. First, Chinese auto stock prices in the domestic A-share market have dropped by 60% from their 2017 highs, and have lately been moving sideways (Chart 12). Notably, these listed automakers’ per-share earnings have plunged, and the companies have cut dividends by more than the drop in their share prices (Chart 13). As a result, their trailing P/E ratio has risen and the dividend yield has dropped (Chart 14). This implies that investors are looking through the current sales contraction and expecting an imminent recovery. Chart 13A Major Contraction In Corporate Earnings And Dividends
A Major Contraction In Corporate Earnings And Dividends
A Major Contraction In Corporate Earnings And Dividends
Chart 14Rising Trailing P/E And Falling Dividend Yield
Rising Trailing P/E And Falling Dividend Yield
Rising Trailing P/E And Falling Dividend Yield
If and as auto sales fail to stage a notable recovery in the next several months, these share prices will likely break down. Second, petroleum demand growth from the transportation sector will be decelerating in China over the coming years. Rising NEV sales as a share of total auto sales, substituting autos for LSEVs and a slower pace of growth in the number of vehicles on roads imply diminishing demand for gasoline in the coming years (Chart 15). Today BCA’s Emerging Markets Strategy service is also publishing a Special Report discussing India’s demand for oil. The report argues for slowing growth in Indian oil demand. Combined, China and India make up 19% of the world’s oil consumption (slightly lower than the 21% accounted for by the U.S.), and weaker demand growth in these economies is negative for oil prices. Third, investors should differentiate between a long-term economic view and investment strategy. We do not disagree with the economic viewpoint that auto ownership will rise in China in the years to come. But this will happen even if auto sales decline on an annual basis over the next 10 years. Chart 16 illustrates this point: if annual auto sales drop by 2% during each consecutive year over the next decade, and the scrap rate is around 3%, car ownership, defined as the share of households owning one car, will continue to rise from the current 50% level, reaching 80% by 2030. Chart 15Falling Growth In Existing Vehicles Entails Slower Growth In Gasoline Demand
Falling Growth In Existing Vehicles Entails Slower Growth In Gasoline Demand
Falling Growth In Existing Vehicles Entails Slower Growth In Gasoline Demand
Chart 16Stimulation: Car Ownership Can Rise With Shrinking Auto Sales
Stimulation: Car Ownership Can Rise With Shrinking Auto Sales
Stimulation: Car Ownership Can Rise With Shrinking Auto Sales
Nevertheless, such a scenario – a 2% annual drop in car sales in each consecutive year over the next decade - is bearish for automakers’ share prices. Any stock price is very sensitive to long-term growth expectations for corporate earnings.5 A 2% recurring annual drop in car sales will be disastrous for auto stock valuations. This is a case when the long-term economic view on rising prosperity and car ownership in China stands in contrast with a negative investment outcome for the auto sector and its shareholders. Ellen JingYuan He, Associate Vice President ellenj@bcaresearch.com Footnotes 1 Sales of total automobiles, including passenger vehicles and commercial vehicles. 2 From Chinese Banking Association Report on June 18, 2019. https://www.china-cba.net/Index/show/catid/14/id/26688.html 3 Guangzhou further added 10,000 car plates open to the public while Guiyang eliminated cap on new-vehicle sales. 4 https://www.wsj.com/video/big-in-china-tiny-electric-cars/CF7E986A-7C70-4EE3-8F7B-441621F10C94.html 5 The reason is that both interest rates and earnings long-term growth rate are present in the denominator of any cash flow discount model (Stock Price = Expected Dividends / (Interest rate – Earnings long-term growth rate)). Hence, they have the potential to affect share prices exponentially while dividends/profits are present in the numerator so their impact on equity prices is linear.