Sectors

Gold's Rise Is Stretched
Gold's Rise Is Stretched
Neutral Global gold stocks have gone parabolic over the past four months and are in desperate need of a breather (top panel). Simultaneously, were President Mario Draghi to re-commence QE in the form of sovereign and corporate bond purchases as market participants expect, this would likely exert upward pressure on global interest rates including the U.S. (bottom panel), especially given the one-sided positioning in the respective global risk free assets. The implication is that the shiny metal and global gold miners would suffer a setback as real yields would rise. As a reminder, gold bullion yields nothing and gold mining equities next to nothing, thus when competing safe haven assets at the margin start yielding higher, investors flee gold and gold miners and flock to risk free assets. Bottom Line: Downgrade the global gond mining index to neutral and move to the sidelines. Please see Monday’s Weekly Report for additional details.
Remain Cyclically Overweight, But Remove from High-Conviction Overweight List Our 10% stop on the S&P software high-conviction call got triggered and we are obeying it, booking gains and removing this index from the high-conviction overweight list. As a reminder, we are still overweight the S&P software index on a cyclical basis since November 2017, with a trailing stop at a the 27% relative return mark that has yet to get hit (bottom panel). Software stocks have offered bulletproof returns for investors as they are mostly insulated from direct impacts of the U.S./China trade war. In addition, these secular growth stocks are also perceived as immune to a growth slowdown and the drubbing in interest rates since the November 2018 peak in the 10-year Treasury yield has been more than reflected in high-flying multiples. Now that interest rates are trying to bottom, investors have been quick to rein in some of their enthusiasm on the largest tech subsector. We still believe that artificial intelligence, augmented reality, SaaS and the push to the cloud have staying power and are not fads, however from a risk management perspective we are compelled to act and protect profits for our portfolio.
Software Is No Longer A High-Conviction Buy
Software Is No Longer A High-Conviction Buy
Bottom Line: Crystalize 10% gains in S&P software index and remove it from the high-conviction overweight list. We are still cyclically overweight the S&P software index and remain prepared to book profits at the 27% relative return mark and downgrade this key tech subgroup to neutral. Such a downgrade will push the S&P tech sector to an underweight stance and also give our portfolio a defensive over cyclical tilt. Stay tuned.
Highlights Chart 1Waiting For A Manufacturing Rebound
Waiting For A Manufacturing Rebound
Waiting For A Manufacturing Rebound
The 2015/16 roadmap is holding. As in that period, the ISM Manufacturing PMI has fallen into recessionary territory, but the Services PMI remains strong (Chart 1). As is typically the case, bond yields have taken their cue from the manufacturing index. The resilient service sector and global shift toward easier monetary policy will support an eventual rebound in manufacturing, and the Fed will continue to play its part this month with another 25 basis point rate cut. As for the Treasury market, much stronger wage growth than in 2016 will prevent the Fed from cutting rates back to zero. This means that the 10-year yield will not re-visit its 2016 trough of 1.37% (Chart 1, bottom panel). Strategically, investors should maintain a benchmark duration stance for now, but stand ready to reduce duration once the global manufacturing data stabilize. Feature Investment Grade: Overweight Chart 2Investment Grade Market Overview
Investment Grade Market Overview
Investment Grade Market Overview
Investment grade corporate bonds underperformed the duration-equivalent Treasury index by 105 basis points in August, dragging year-to-date excess returns down to +323 bps. In remarks last week, Fed Chairman Powell noted that the Fed has lowered the market’s expected path of interest rates, and that he views this easing of financial conditions as providing important support for the economy.1 The July FOMC minutes echoed this sentiment, sending a strong signal that the Fed will do everything it can to prevent a significant tightening of financial conditions. The accommodative monetary environment is extremely positive for corporate spreads. In terms of valuation, Baa-rated securities offer the most value in the investment grade corporate bond space (Chart 2). Baa spreads remain 13 bps above our cyclical target (panel 2).2 Conversely, Aa and A-rated spreads are 2 bps and 1 bp below target, respectively (panel 3). Aaa spreads are 15 bps below target (not shown). The main risk to spreads comes from the relatively poor state of corporate balance sheets. Our measure of gross leverage – total debt over pre-tax profits – was already high, and was revised even higher after the Bureau of Economic Analysis’ annual GDP revision (panel 4). But for now, likely in large part due to accommodative Fed policy, loan officers aren’t inclined to cut off the flow of credit. C&I lending standards remain in “net easing” territory (bottom panel). Table 3ACorporate Sector Relative Valuation And Recommended Allocation*
The 2019 Manufacturing Recession
The 2019 Manufacturing Recession
Table 3BCorporate Sector Risk Vs. Reward*
The 2019 Manufacturing Recession
The 2019 Manufacturing Recession
High-Yield: Overweight Chart 3High-Yield Market Overview
High-Yield Market Overview
High-Yield Market Overview
High-Yield underperformed the duration-equivalent Treasury index by 114 basis points in August, dragging year-to-date excess returns down to +551 bps. The average index option-adjusted spread widened 22 bps on the month. At 385 bps, it is well above the cycle-low of 303 bps. We see more potential for spread tightening in high-yield than in investment grade. Within investment grade, only Baa-rated spreads appear cheap. However, in high-yield, Ba-rated spreads are 49 bps above our target (Chart 3), B-rated spreads are 151 bps above our target (panel 3) and Caa-rated spreads are 398 bps cheap (not shown).3 Junk spreads also offer reasonable value relative to expected default losses. The current Moody’s baseline forecast calls for a default rate of 3.2% over the next 12 months. This translates into 207 bps of excess spread in the High-Yield index after adjusting for expected default losses (panel 4). That 207 bps of excess spread is comfortably above zero, though it is below the historical average of 250 bps. As noted on page 3, C&I lending standards have now eased for two consecutive quarters and job cut announcements are off their highs (bottom panel). Both trends are supportive of lower default expectations in the future. MBS: Neutral Chart 4MBS Market Overview
MBS Market Overview
MBS Market Overview
Mortgage-Backed Securities underperformed the duration-equivalent Treasury index by 63 basis points in August, dragging year-to-date excess returns down to -31 bps. The conventional 30-year zero-volatility spread widened 9 bps on the month, driven entirely by the option-adjusted spread (OAS). The compensation for prepayment risk (option cost) held flat at 29 bps. At 51 bps, the OAS for conventional 30-year MBS has widened back close to its average pre-crisis level (Chart 4). However, value is less attractive when we look at the nominal MBS spread, which remains near its all-time lows.4 The nominal spread has also widened less than would have been expected in recent months, considering the jump in refi activity (panel 2). The mixed valuation picture means we are not yet inclined to augment MBS exposure. However, we are equally disinclined to downgrade MBS, given our view that Treasury yields are close to a trough. An increase in Treasury yields would cause refi activity to slow, putting downward pressure on MBS spreads. All in all, we expect the next big move in the MBS/Treasury basis will be a tightening, as global growth improves and mortgage rates rise. However, valuation is not sufficiently attractive to warrant more than a neutral allocation. Government-Related: Underweight Chart 5Government-Related Market Overview
Government-Related Market Overview
Government-Related Market Overview
The Government-Related index underperformed the duration-equivalent Treasury index by 12 basis points in August, dragging year-to-date excess returns down to +152 bps. Sovereign debt underperformed duration-equivalent Treasuries by 45 bps on the month, dragging year-to-date excess returns down to +442 bps. Local Authorities underperformed the Treasury benchmark by 31 bps, dragging year-to-date excess returns down to +212 bps. Meanwhile, Foreign Agencies underperformed by 11 bps, dragging year-to-date excess returns down to +141 bps. Domestic Agencies outperformed by 13 bps in August, bringing year-to-date excess returns up to +44 bps. Supranationals outperformed by 3 bps, bringing year-to-date excess returns up to +39 bps. Sovereign debt remains very expensive relative to equivalently rated U.S. corporate credit (Chart 5). While the sector would benefit if the Fed’s dovish pivot eventually results in a weaker dollar, U.S. corporate bonds would still outperform in that scenario given the more attractive starting point for spreads. We continue to recommend an underweight allocation to Sovereigns. Unlike the debt of most other countries, Mexican sovereign bonds continue to trade cheap relative to U.S. corporates (bottom panel). Investors should favor Mexican sovereigns within an otherwise underweight allocation to the sector as a whole. Municipal Bonds: Neutral Chart 6Municipal Market Overview
Municipal Market Overview
Municipal Market Overview
Municipal bonds underperformed the duration-equivalent Treasury index by 104 basis points in August, dragging year-to-date excess returns down to -46 bps (before adjusting for the tax advantage). The average Aaa-rated Municipal / Treasury (M/T) yield ratio rose 9% in August, and currently sits at 85% (Chart 6). The ratio is close to one standard deviation below its post-crisis mean, but slightly above the 81% average that prevailed in the late stages of the previous cycle, between mid-2006 and mid-2007. We shifted our recommended stance on municipal bonds from overweight to neutral near the end of July.5 The reason for the downgrade was that the sector had become extremely expensive. Yield ratios have risen somewhat since then, but not yet by enough for us to re-initiate an overweight recommendation. We also continue to observe that the best value in the municipal bond space is found at the long-end of the Aaa curve. 2-year and 5-year M/T yield ratios remain below average pre-crisis levels, while yield ratios beyond the 10-year maturity point are above. 20-year and 30-year Aaa M/T yield ratios, in particular, are the most attractive (panel 2). Fundamentally, state & local government balance sheets remain in decent shape and a material increase in ratings downgrades is unlikely any time soon (bottom panel). Our recent shift to a more cautious stance was driven purely by valuation and not a concern for municipal bond credit quality. A further cheapening in the coming months would cause us to re-initiate an overweight stance. Treasury Curve: Maintain A Barbell Curve Positioning Chart 7Treasury Yield Curve Overview
Treasury Yield Curve Overview
Treasury Yield Curve Overview
The Treasury curve bull-flattened dramatically in August, as the global manufacturing recession continued to pull yields down. At present, the 2/10 Treasury slope is just above the zero line at 2 bps, 11 bps flatter than at the end of July. The 5/30 slope is currently 60 bps, 9 bps flatter than at the end of July. Our 12-month Fed Funds Discounter is currently -98 bps (Chart 7). This means that the market is priced for almost four more 25 basis point rate cuts during the next year. While we have shifted to a tactically neutral duration stance because of uncertainty surrounding the timing of the next move higher in yields, four rate cuts on a 12-month horizon seems excessive given the underlying strength of the U.S. economy. For this reason, we are inclined to maintain a barbelled position across the Treasury curve, and also to stay short the February 2020 fed funds futures contract. The February 2020 contract is priced for three rate cuts over the next four FOMC meetings. One of those rate cuts will occur this month, but if the global manufacturing data recover, further cuts may not be needed. A short position in this contract continues to make sense. On the Treasury curve, our butterfly spread models continue to show that barbells look cheap relative to bullets (see Appendix B). Further, the 5-year and 7-year yields will rise the most when the market prices-in a more hawkish path for the policy rate. Investors should favor the long-end and short-end of the curve, while avoiding the belly (5-year and 7-year). TIPS: Overweight Chart 8Inflation Compensation
Inflation Compensation
Inflation Compensation
TIPS underperformed the duration-equivalent nominal Treasury index by 174 basis points in August, dragging year-to-date excess returns down to -104 bps. The 10-year TIPS breakeven inflation rate fell 21 bps on the month and currently sits at 1.55% (Chart 8). The 5-year/5-year forward TIPS breakeven inflation rate also fell 21 bps in August. It currently sits at 1.74%. As we have noted in recent research, FOMC members are monitoring long-dated inflation expectations and are committed to keeping policy easy enough to “re-anchor” them at levels consistent with the Fed’s 2% target.6 Eventually, this will support a return of long-dated TIPS breakeven inflation rates (both 10-year and 5-year/5-year forward) to our 2.3% - 2.5% target range. However, for breakevens to move higher, investors also need to see evidence that inflation will be sustained near 2%. On that note, recent trends are encouraging. Through July, trimmed mean PCE is running at 2.22% on a trailing 6-month basis (annualized) and at 1.99% on a trailing 12-month basis (bottom panel). As a result, the 10-year TIPS breakeven inflation rate looks very low relative to the reading from our Adaptive Expectations model, a model based on several different measures of inflation (panel 4).7 Supportive Fed policy and rising inflation should support wider TIPS breakevens in the coming months, remain overweight. ABS: Underweight Chart 9ABS Market Overview
ABS Market Overview
ABS Market Overview
Asset-Backed Securities outperformed the duration-equivalent Treasury index by 15 basis points in August, bringing year-to-date excess returns up to +74 bps. The index option-adjusted spread for Aaa-rated ABS tightened 4 bps on the month. It currently sits at 28 bps, below its minimum pre-crisis level of 34 bps (Chart 9). ABS also appear unattractive on a risk/reward basis, as both Aaa-rated auto loans and credit cards have moved into the “Avoid” quadrant of our Excess Return Bond Map (see Appendix C). The Map uses each bond sector’s spread, duration and volatility to calculate the likelihood of earning or losing 100 bps of excess return versus Treasuries. At present, the Map shows that ABS offer poor expected return for their level of risk. In addition to poor valuation, the ABS sector’s credit fundamentals are shifting in a negative direction. Household interest payments continue to trend up, suggesting a higher delinquency rate in the future (panel 3). Meanwhile, senior loan officers continue to tighten lending standards for both credit cards and auto loans. Tighter lending standards usually coincide with rising delinquencies (bottom panel). All in all, the combination of poor value and deteriorating credit quality leads us to recommend an underweight allocation to consumer ABS. Non-Agency CMBS: Neutral Chart 10CMBS Market Overview
CMBS Market Overview
CMBS Market Overview
Non-Agency Commercial Mortgage-Backed Securities underperformed the duration-equivalent Treasury index by 16 basis points in August, dragging year-to-date excess returns down to +218 bps. The index option-adjusted spread for non-agency Aaa-rated CMBS widened 6 bps on the month. It currently sits at 69 bps, below average pre-crisis levels but above levels seen in 2018 (Chart 10). The macro outlook for commercial real estate is somewhat unfavorable, with lenders tightening loan standards (panel 4) amidst falling demand (bottom panel). Commercial real estate prices have accelerated of late, but are still not keeping pace with CMBS spreads (panel 3). Despite the poor fundamental picture, our Excess Return Bond Map shows that CMBS offer a reasonably attractive risk/reward trade-off compared to other bond sectors (see Appendix C). Agency CMBS: Overweight Agency CMBS underperformed the duration-equivalent Treasury index by 31 basis points in August, dragging year-to-date excess returns down to +88 bps. The index option-adjusted spread widened 7 bps on the month and currently sits at 56 bps. The Excess Return Bond Map in Appendix C shows that Agency CMBS offer high potential return compared to other low-risk spread products. Appendix A - The Golden Rule Of Bond Investing We follow a two-step process to formulate recommendations for bond portfolio duration. First, we determine the change in the federal funds rate that is priced into the yield curve for the next 12 months. Second, we decide – based on our assessments of the economy and Fed policy – whether the change in the fed funds rate will exceed or fall short of what is priced into the curve. Most of the time, a correct answer to this question leads to the appropriate duration call. We call this framework the Golden Rule Of Bond Investing, and we demonstrated its effectiveness in the U.S. Bond Strategy Special Report, “The Golden Rule Of Bond Investing”, dated July 24, 2018, available at usbs.bcaresearch.com. Chart 11 illustrates the Golden Rule’s track record by showing that the Bloomberg Barclays Treasury Master Index tends to outperform cash when rate hikes fall short of 12-month expectations, and vice-versa. Chart 11The Golden Rule's Track Record
The Golden Rule's Track Record
The Golden Rule's Track Record
At present, the market is priced for 98 basis points of cuts during the next 12 months. We anticipate fewer rate cuts over that time horizon, and therefore anticipate that below-benchmark portfolio duration positions will profit. We can also use our Golden Rule framework to make 12-month total return and excess return forecasts for the Bloomberg Barclays Treasury index under different scenarios for the fed funds rate. Excess returns are relative to the Bloomberg Barclays Cash index. To forecast total returns we first calculate the 12-month fed funds rate surprise in each scenario by comparing the assumed change in the fed funds rate to the current value of our 12-month discounter. This rate hike surprise is then mapped to an expected change in the Treasury index yield using a regression based on the historical relationship between those two variables. Finally, we apply the expected change in index yield to the current characteristics (yield, duration and convexity) of the Treasury index to estimate total returns on a 12-month horizon. The below tables present those results, along with 95% confidence intervals. Excess returns are calculated by subtracting assumed cash returns in each scenario from our total return projections.
The 2019 Manufacturing Recession
The 2019 Manufacturing Recession
The 2019 Manufacturing Recession
The 2019 Manufacturing Recession
Appendix B - Butterfly Strategy Valuation The following tables present the current read-outs from our butterfly spread models. We use these models to identify opportunities to take duration-neutral positions across the Treasury curve. The following two Special Reports explain the models in more detail: U.S. Bond Strategy Special Report, “Bullets, Barbells And Butterflies”, dated July 25, 2017, available at usbs.bcaresearch.com U.S. Bond Strategy Special Report, “More Bullets, Barbells And Butterflies”, dated May 15, 2018, available at usbs.bcaresearch.com Table 4 shows the raw residuals from each model. A positive value indicates that the bullet is cheap relative to the duration-matched barbell. A negative value indicates that the barbell is cheap relative to the bullet. Table 4Butterfly Strategy Valuation: Raw Residuals In Basis Points (As of September 6, 2019)
The 2019 Manufacturing Recession
The 2019 Manufacturing Recession
Table 5 scales the raw residuals in Table 4 by their historical means and standard deviations. This facilitates comparison between the different butterfly spreads. Table 5Butterfly Strategy Valuation: Standardized Residuals (As of September 6, 2019)
The 2019 Manufacturing Recession
The 2019 Manufacturing Recession
Table 6 flips the models on their heads. It shows the change in the slope between the two barbell maturities that must be realized during the next six months to make returns between the bullet and barbell equal. For example, a reading of +49 bps in the 5 over 2/10 cell means that we would only expect the 5-year to outperform the 2/10 if the 2/10 slope steepens by more than 49 bps during the next six months. Otherwise, we would expect the 2/10 barbell to outperform the 5-year bullet. Table 6Discounted Slope Change During Next 6 Months (BPs)
The 2019 Manufacturing Recession
The 2019 Manufacturing Recession
Appendix C - Excess Return Bond Map The Excess Return Bond Map is used to assess the relative risk/reward trade-off between different sectors of the U.S. fixed income market. The Map employs volatility-adjusted breakeven spread analysis to show how likely it is that a given sector will earn/lose money during the subsequent 12 months. The Map does not incorporate any macroeconomic view. The horizontal axis of the Map shows the number of days of average spread widening required for each sector to lose 100 bps versus a position in duration-matched Treasuries. Sectors plotting further to the left require more days of average spread widening and are therefore less likely to see losses. The vertical axis shows the number of days of average spread tightening required for each sector to earn 100 bps in excess of duration-matched Treasuries. Sectors plotting further toward the top require fewer days of spread tightening and are therefore more likely to earn 100 bps of excess return. Chart 12Excess Return Bond Map (As Of September 6, 2019)
The 2019 Manufacturing Recession
The 2019 Manufacturing Recession
Ryan Swift, U.S. Bond Strategist rswift@bcaresearch.com Jeremie Peloso, Research Analyst jeremiep@bcaresearch.com Footnotes 1 https://www.cnbc.com/2019/09/06/watch-fed-chairman-jerome-powells-qa-in-zurich-live.html 2 For more details on how we arrive at our spread targets please see U.S. Bond Strategy Weekly Report, “The Value In Corporate Bonds”, dated February 19, 2019, available at usbs.bcaresearch.com 3 For more details on how we arrive at our spread targets please see U.S. Bond Strategy Weekly Report, “The Value In Corporate Bonds”, dated February 19, 2019, available at usbs.bcaresearch.com 4 The nominal spread is simply the difference between MBS index yield and the duration-matched Treasury yield. No adjustment is made for prepayment risk. 5 Please see U.S. Bond Strategy Weekly Report, “A Message To The TIPS Market”, dated July 23, 2019, available at usbs.bcaresearch.com 6 Please see U.S. Bond Strategy Weekly Report, “A Message To The TIPS Market”, dated July 23, 2019, available at usbs.bcaresearch.com 7 For further details on our Adaptive Expectations Model please see U.S. Bond Strategy Weekly Report, “Adaptive Expectations In The TIPS Market”, dated November 20, 2018, available at usbs.bcaresearch.com Fixed Income Sector Performance Recommended Portfolio Specification Corporate Sector Relative Valuation And Recommended Allocation
The outlook for U.S. exports of materials is darkening. An appreciating U.S. dollar deflates commodity prices and also clips basic materials companies’ exports prospects. How? It renders materials related exports uncompetitive in international markets…
Heightened economic and trade policy uncertainty has claimed the S&P materials sector as one of its victims. Given that our Geopolitical Strategy service’s base case remains that there will be no meaningful Sino-American trade deal by the U.S. November…
Highlights Portfolio Strategy The contracting manufacturing sector that rekindled recession fears, the harsh reality of the Sino-American trade war weighing on profits, downbeat business confidence and mushrooming capex slowdown signals all warn that investors should tread carefully in the historically difficult equity market months of September and October. It no longer pays to be overweight gold mining equities as sentiment is stretched, the restarting of global QE will likely reverse or at least halt the drubbing in global yields and the U.S. dollar inverse correlation should reassert itself and weigh on global gold miners. EM and China ills, deflating global producer pricing power, export blues and souring financial statement metrics underscore that materials stocks have ample downside. Recent Changes Trim the Global Gold Mining index to neutral, today. Downgrade the S&P Materials sector to underweight, today. Table 1
Extend And Pretend?
Extend And Pretend?
Feature Equities broke out of their trading range last week, but in order for this short-covering rally to become durable, and for volatility to subside, either global growth needs to turn the corner and alleviate recession fears or the trade war needs to de-escalate materially. On the recession front Central Banks (CBs) are doing their utmost to reflate their respective economies, but the early stages of looser monetary policy have been insufficient to change the global growth trajectory. With regard to the trade war, markets cheered the news that talks between the U.S. and China will resume in September and October. The dates for talks are conveniently chosen to follow the September FOMC meeting and the October 1 70th anniversary of the People's Republic of China. The latter date implies that Washington is considering delaying the October 1 tariff hike – and it could imply that Washington does not anticipate any violent suppression of Hong Kong protesters by that time. However, the harsh reality is that the two sides are just “kicking the can down the road”. The longer the Sino-American trade war takes to conclude, the more likely it will serve as a catalyst for a repricing of risk significantly lower (top panel, Chart 1). A technical correction may be necessary to force Trump to reduce the trade pressure significantly. Even if the October 1 tariff hike is postponed it will remain a source of uncertainty ahead of the final tariff tranche slated for December 15. The bond market may offer some clues as to the extent that the escalating trade war will eventually get reflected into stocks (bottom panel, Chart 1). The equity transmission mechanism is through the earnings avenue. Simply put, rising trade uncertainty deals a blow to global trade that boosts the U.S. dollar which in turn makes U.S. exports uncompetitive in global markets, deflates the commodity complex and with a lag weighs on SPX earnings. Chart 1Tracking Trade Uncertainty
Tracking Trade Uncertainty
Tracking Trade Uncertainty
Speaking of the economically hypersensitive manufacturing sector, last week’s ISM release made for grim reading, further fueling recession fears (the New York Fed now pegs the recession probability just shy of 38% by next August). Not only did the overall survey fall below the boom/bust line (middle panel, Chart 2), but also new orders collapsed. In fact, the drubbing in new orders is worrying and it signals that the economy is going to get worse before it gets better (top panel, Chart 2). Tack on the simultaneous rise in inventories, and the sinking new orders-to-inventories ratio (not shown) warns of additional manufacturing ills in the coming months. Importantly, export orders suffered the steepest losses plunging to 43.3. The last three times that this trade-sensitive survey subcomponent was in such a steep freefall were in 1998, 2001 and 2008, when the SPX suffered peak-to-trough losses of 20%, 49% and 57%, respectively. In fact, since the history of the data, ISM manufacturing export orders have never been lower with the exception of the GFC (Chart 3). Such a retrenchment will either mark the bottom for equities or is a harbinger of a steep equity market correction. We side with the latter as the odds of President Trump striking a real trade deal (including tech) with China any time soon are low. Chart 2Like Night Follows Day
Like Night Follows Day
Like Night Follows Day
Similar to the ISM manufacturing/non-manufacturing divergence (bottom panel, Chart 2), business confidence is trailing consumer conference by a wide mark. Historically this flaring chasm has been synonymous with a sizable loss of momentum in the broad equity market (Chart 4). One plausible explanation is that as business animal spirits suffer a setback, CEOs are quick to prune/postpone capex plans and, at the margin, corporations retrench and short-circuit the capex upcycle. Chart 3Export Carnage
Export Carnage
Export Carnage
Chart 4Mind The Gap
Mind The Gap
Mind The Gap
Circling back to last week’s capex update, national accounts corroborate the financial statement data deceleration, and in some cases contraction, in capital outlays (Chart 5). As a reminder our thesis is that the EPS-to-capex virtuous upcycle is morphing into a vicious down cycle.1 This week, we downgrade a deep cyclical sector by taking profits in a niche subgroup that has served as a reliable portfolio hedge. Crucially, tech investment, that comprises almost 30% of total investment according to national accounts, is decelerating, R&D and other intellectual property investment have also hooked down, non-residential structures are on the verge of contraction, and industrial, transportation and other equipment –that have the largest weight in U.S. capex – are also quickly losing steam (Chart 6). Chart 5Capex Blues
Capex Blues
Capex Blues
Chart 6All Capex Segments…
All Capex Segments…
All Capex Segments…
In more detail, Charts 7 & 8 further break down capital outlays in the respective categories and reveal that worrisomely the investment spending slowdown is broad based. Chart 7…Have Rolled Over…
…Have Rolled Over…
…Have Rolled Over…
Chart 8…Except For One
…Except For One
…Except For One
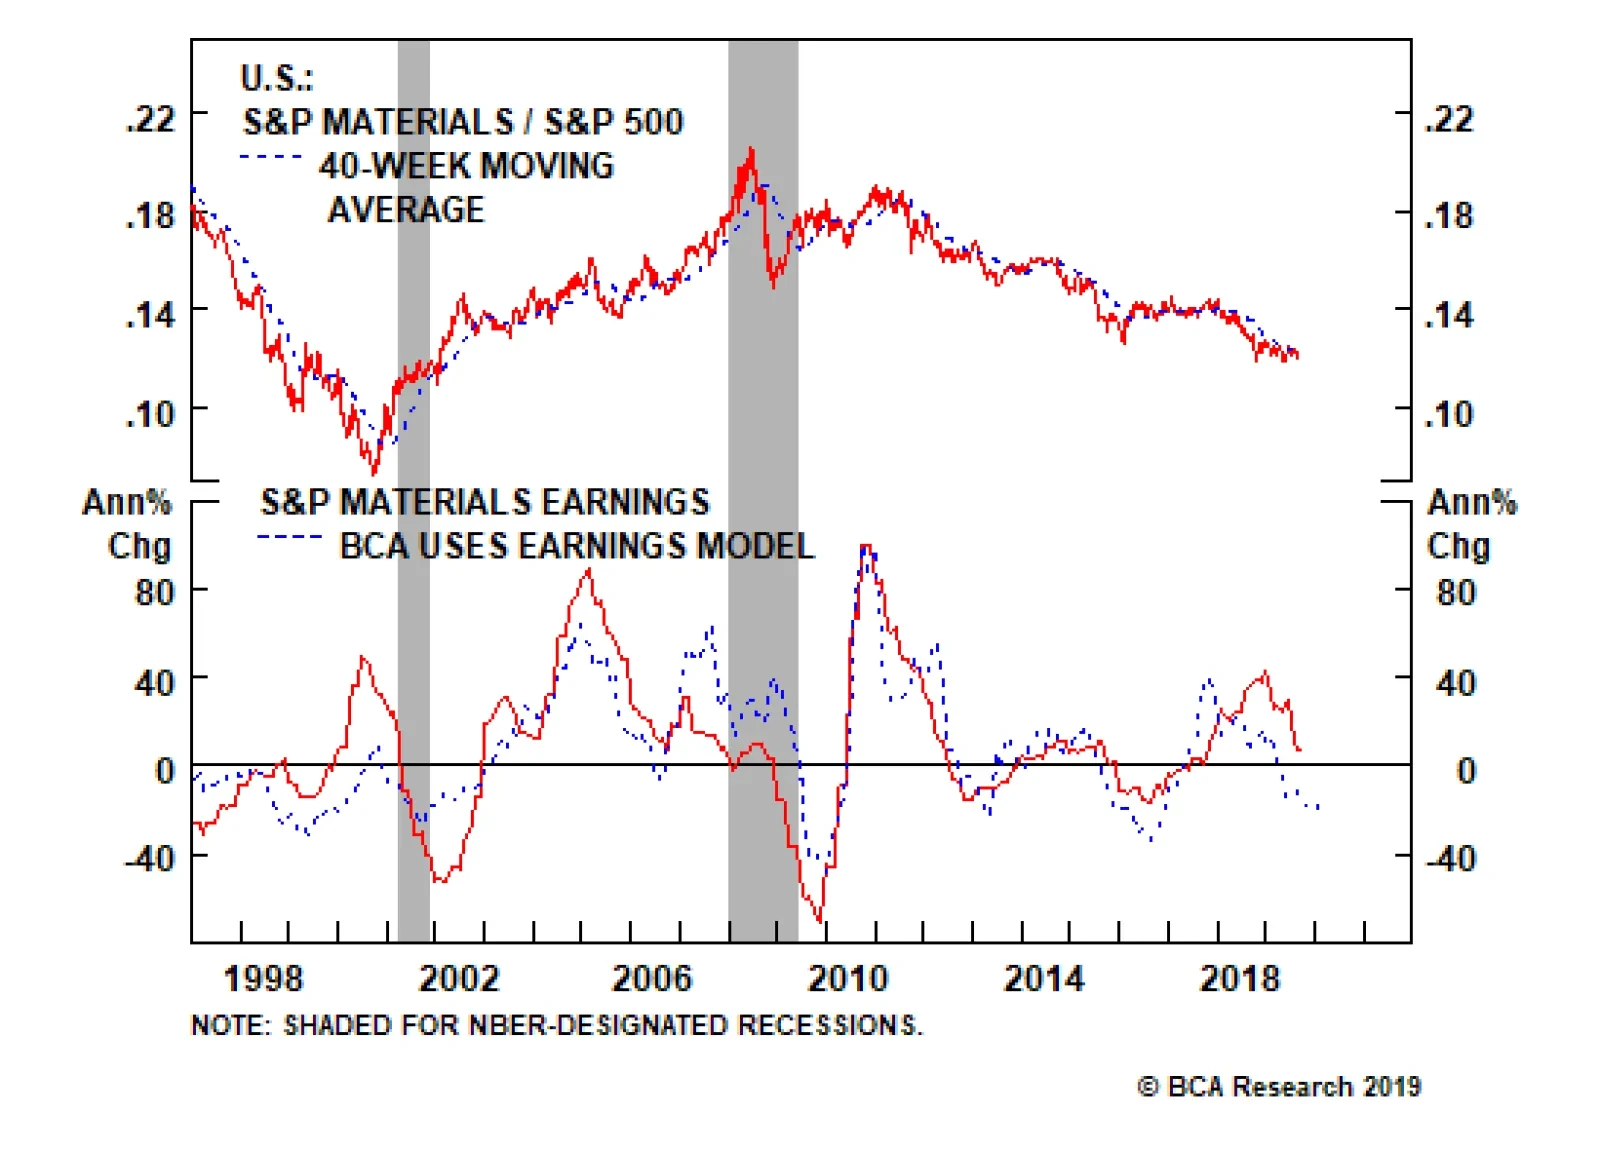
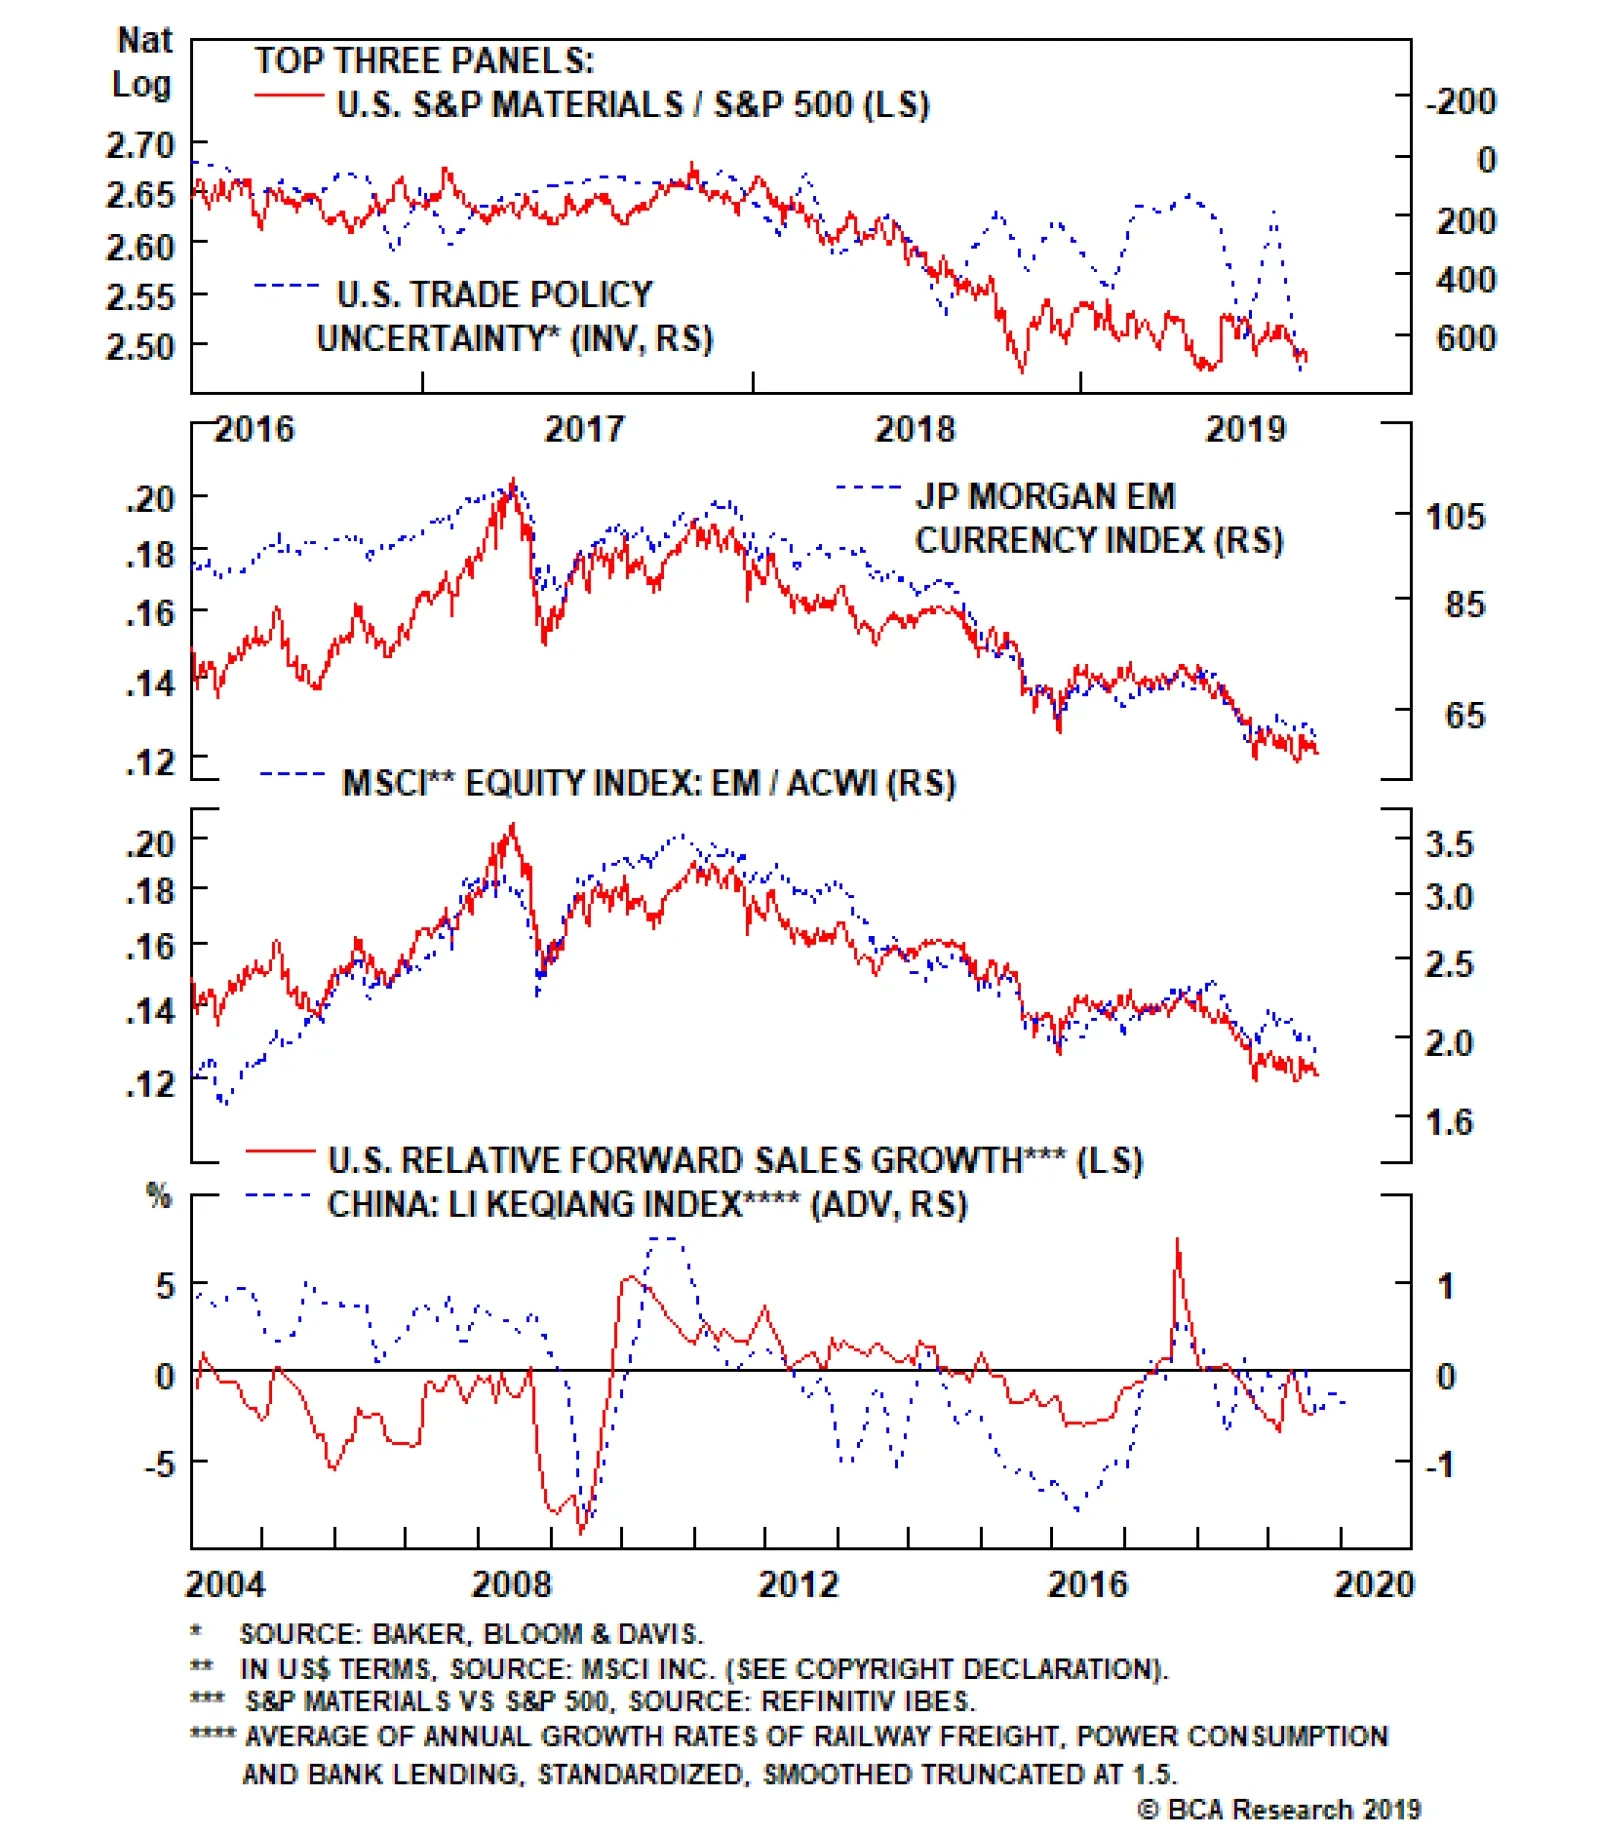
Adding it all up, the contracting manufacturing sector that rekindled recession fears, the harsh reality of the Sino-American trade war weighing on profits, downbeat business confidence and mushrooming capex slowdown signals all warn that investors should tread carefully in the historically difficult equity market months of September and October. As a reminder, this is U.S. Equity Strategy service’s view and it contrasts with BCA’s sanguine equity market house view. This week, we downgrade a deep cyclical sector by taking profits in a niche subgroup that has served as a reliable portfolio hedge. Downgrade Materials To Underweight… Heightened economic and trade policy uncertainty has claimed the S&P materials sector as one of its victims (Chart 9). Given that our Geopolitical Strategy service’s base case remains that there will be no Sino-American trade deal by the U.S. November 2020 election, there is more downside for materials stocks and we are downgrading this niche deep cyclical sector to a below benchmark allocation.2 Beyond the U.S./China trade war inflicted wounds that materials stocks have to nurse, there are four major headwinds that they will also have to contend with in the coming months. Chart 9Trade Uncertainty Sinking Materials
Trade Uncertainty Sinking Materials
Trade Uncertainty Sinking Materials
First, the emerging markets (EM) in general and China in particular are in a prolonged soft patch that predates the Sino-American trade war. EM stocks and EM currencies are both deflating at an accelerating pace warning that relative share prices will suffer the same fate (Chart 10). Nothing epitomizes the infrastructure spending/capex cycle more than China’s insatiable appetite for commodities and the news on that front remains dire. The Li Keqiang index continues to emit a distress signal and that is negative for materials top line growth (bottom panel, Chart 10). Second, global inflation is in hibernation and select EM producer price inflation growth series are on the verge of contraction or already outright contracting. Chinese raw materials wholesale prices are in the deflation zone and warn that U.S. materials sector profits will underwhelm (Chart 11). Chart 10Bearish EM…
Bearish EM…
Bearish EM…
Chart 11…And China Backdrops
…And China Backdrops
…And China Backdrops
Base metal prices are a real time indicator of the wellness of the S&P materials sector. Currently, base metals are deflating both on the back of a firming U.S. dollar and contracting global manufacturing. Such a commodity price backdrop is dampening prospects for a profit-led materials sector relative share price recovery (top & middle panels, Chart 12). Third, the materials exports outlook is darkening. Apart from the deflating effect the appreciating U.S. dollar has on commodities it also clips basic materials companies’ exports prospects. How? It renders materials related exports uncompetitive in international markets leading to market share losses. Netting it all out, EM and China ills, deflating global producer pricing power, export blues and souring financial statement metrics underscore that materials stocks have ample downside. Chart 12Weak Pricing Power And Declining Exports
Weak Pricing Power And Declining Exports
Weak Pricing Power And Declining Exports
In addition, the latest ISM export order subcomponent plunged to multi-year lows reflecting trade war pessimism and falling global end-demand. The implication is that the export relief valve is closed for materials equities (bottom panel, Chart 12). Finally, materials sector financial statement metrics are moving in the wrong direction. Net debt-to-EBITDA is rising anew and interest coverage has likely peaked for the cycle at a time when free cash flow generation has ground to a halt (Chart 13). U.S. Equity Strategy’s S&P materials sector profit growth model encapsulates all these moving parts and warns that a severe profit contraction phase looms (Chart 14). Chart 13Financial Statement Red Flags
Financial Statement Red Flags
Financial Statement Red Flags
Chart 14Model Says Sell
Model Says Sell
Model Says Sell
Netting it all out, EM and China ills, deflating global producer pricing power, export blues and souring financial statement metrics underscore that materials stocks have ample downside. Bottom Line: The time is ripe to downgrade the S&P materials sector to underweight. …Via Trimming Gold Miners To Neutral The way we are executing this downgrade in the materials sector to an underweight stance is by trimming the global gold mining index to a benchmark allocation. Our thesis that gold stocks serve as a sound portfolio hedge remains intact and underpinned when: economic and trade policy uncertainty are on the rise (top panel, Chart 15) global CBs start cutting interest rates and in some cases doubling down on negative interest rates currency wars are overheating Nevertheless, what has changed is the price, and we deem that global gold miners that have gone parabolic are in desperate need of a breather. The top panel of Chart 16 shows that gold stocks have rallied 58% since the May 5, 2019 Trump tweet. This outsized four-month relative return is remarkable and likely almost fully reflects a very dovish Fed and melting real U.S. Treasury yields (TIPS yield shown inverted, bottom panel, Chart 15). A much needed pause for breath is required before the next leg of the relative rally resumes, and we opt to move to the sidelines. Chart 15Positive Backdrop…
Positive Backdrop…
Positive Backdrop…
Chart 16…But Reflected In Prices
…But Reflected In Prices
…But Reflected In Prices
Moreover, on the eve of the ECB’s September meeting, were President Mario Draghi to re-commence QE in the form of sovereign and corporate bond purchases as markets participants expect, counterintuitively a selloff in the bond markets would confirm that QE and its signaling is working (bottom panel, Chart 16). Ergo, this would likely exert upward pressure on global interest rates including the U.S., especially given the one-sided positioning in the respective global risk free assets. The implication is that the shiny metal and global gold miners would suffer a setback as real yields would rise further. As a reminder, gold bullion yields nothing and gold mining equities next to nothing, thus when competing safe haven assets at the margin start yielding higher, investors flee gold and gold miners and flock to risk free assets. Sentiment toward gold and global gold miners is stretched. Gold ETF holdings are at multi-year highs (second panel, Chart 17) and gold net speculative positions are at a level that has marked previous reversals. In addition, bullish consensus on gold is near 72%, a percentage last reached in 2012 (third & bottom panels, Chart 17). Similarly, relative share price momentum is also warning that global gold mining equities are currently extended (bottom panel, Chart 18). Chart 17Extreme…
Extreme…
Extreme…
Chart 18…Sentiment
…Sentiment
…Sentiment
Finally, while the bond market’s view of 100bps in Fed cuts in the next 12 months should have undermined the trade-weighted U.S. dollar, it has actually defied gravity and slingshot to fresh cycle highs. This is a net negative both for gold and gold mining equities as the underlying commodity is priced in U.S. dollars and enjoys an inverse correlation with the greenback. The implication is that the multi-decade inverse correlation will hold and will likely pull down gold and gold mining equities at least in the short-run (U.S. dollar shown inverted, Chart 19). In sum, the exponential rise in global gold miners is in need of a breather. Sentiment is stretched, the restating of global QE will likely reverse or at least halt the drubbing in global yields and the U.S. dollar inverse correlation should reassert itself and weigh on relative share prices Chart 19Gold Miners/Dollar Correlation Re-establishment Risk
Gold Miners/Dollar Correlation Re-establishment Risk
Gold Miners/Dollar Correlation Re-establishment Risk
Bottom Line: Downgrade the global gold mining index to neutral, but stay tuned. Anastasios Avgeriou, U.S. Equity Strategist anastasios@bcaresearch.com Footnotes 1 Please see U.S. Equity Strategy Weekly Report, “Capex Blues” dated September 3, 2019, available at uses.bcaresearch.com 2 Please see The Bank Credit Analyst Special Report, “Big Trouble In Greater China” dated August 29 , 2019, available at bca.bcaresearch.com Current Recommendations Current Trades Size And Style Views Stay neutral cyclicals over defensives (downgrade alert) Favor value over growth Favor large over small caps
Overweight While the latest ISM manufacturing survey made for grim reading, there is a corner of the manufacturing landscape that excels when overall manufacturing is in retreat: health care equipment (HCE) makers (second panel, ISM shown inverted). This defensive health care sub-group is firing on all cylinders. Not only is medical equipment industrial production going against the grain and climbing at a healthy clip, but also the industry’s new orders-to-inventories ratio is in its third consecutive year of a sling shot recovery. Moreover, HCE pricing power is expanding smartly at a time when our overall corporate pricing power proxy is contracting. All of this suggests that the earnings-driven vault to all-time relative performance highs has staying power.
A Healthy Start
A Healthy Start
Bottom Line: We reiterate our recent boost to an overweight stance in the S&P health care equipment index. The ticker symbols for the stocks in the index are: BLBG: S5HCEP – ABT, MDT, DHR, BDX, SYK, ISRG, BSX, BAX, EW, ZBH, IDXX, RMD, TFX, HOLX, ABMD, VAR.
Highlights The lingering global manufacturing recession and the substantial drop in U.S. bond yields have been behind the decoupling between both EM stocks and the S&P 500, and cyclical and defensive equities. Neither the most recent economic data, nor the relative performance of global cyclicals, China-related plays and high-beta markets herald a broad-based and lasting risk-on phase in global markets. On the contrary, economic and market signposts continue to indicate either further bifurcation in global markets or a risk-off period. We review some of our long-standing themes and associated recommendations. Feature Global financial markets have become bifurcated. On one hand, numerous segments of global financial markets leveraged to global growth, including EM stocks, have already sold off (Chart I-1). On the other hand, share prices of growth companies, defensive stocks and global credit markets have remained resilient. Chart I-2 shows that a similar divergence has taken place within EM asset classes: EM share prices have plummeted while EM corporate credit excess returns have not dropped much. Chart I-1Bifurcated Equity Markets
Bifurcated Equity Markets
Bifurcated Equity Markets
Chart I-2Bifurcated Markets In EM
Bifurcated Markets In EM
Bifurcated Markets In EM
How to explain this market bifurcation? Financial markets sensitive to global trade and manufacturing cycles have been mirroring worsening conditions in global trade and manufacturing. Some of the affected segments include: Global cyclical equity sectors. Emerging Asia manufacturing-related currencies (KRW, TWD and SGD) versus the U.S. dollar (Chart I-3). EM and DM commodity currencies (Chart I-4). Chart I-3Total Return (Including Carry): KRW, TWD And SGD Vs. USD
bca.ems_wr_2019_09_05_s1_c3
bca.ems_wr_2019_09_05_s1_c3
Chart I-4EM And DM Commodity Currencies
EM And DM Commodity Currencies
EM And DM Commodity Currencies
Industrial and energy commodities prices. U.S. high-beta stocks as well as U.S. small caps (Chart I-5). Chart I-5U.S. High-Beta Stocks
U.S. High-Beta Stocks
U.S. High-Beta Stocks
DM bond yields. Crucially, the current global trade and manufacturing downturns have taken place despite robust U.S. consumer spending. In fact, our theme for the past several years has been that a global business cycle downturn would occur despite ongoing strength in American household spending. The rationale has been that China and the rest of EM combined are large enough on their own to bring down global trade and manufacturing, irrespective of strength in U.S. consumer spending. At the current juncture, one wonders whether such a market bifurcation is justified. It is not irrational. The basis for decoupling between cyclical and defensive equities has been U.S. bond yields. The substantial downshift in U.S. interest rate expectations has led to a re-rating of non-cyclicals and growth company stocks. Corporate bonds have also done well, given the background of a falling risk-free rate. Will the current market bifurcation continue? Or will these segments in global financial markets recouple and in which direction? What To Watch China rather than the U.S. has been the epicenter of this slowdown, as we have argued repeatedly in the past. Hence, a major rally in global cyclical equities and EM risk assets all hinge on a recovery in the Chinese business cycle. The basis for decoupling between cyclical and defensive equities has been U.S. bond yields. The substantial downshift in U.S. interest rate expectations has led to a re-rating of non-cyclicals and growth company stocks. Even though Caixin’s PMI for China was slightly up in August, many other economic indicators remain downbeat: The latest hard economic data out of Asia suggest that global trade/manufacturing continues to contract. Korea’s total exports in August contracted by 12.5% from a year ago, and its shipments to China plunged by 20% (Chart I-6). The import sub-component of China’s manufacturing PMI is not showing signs of amelioration (Chart I-7). The mainland’s import recovery is very critical to a revival in global trade and manufacturing. Chart I-6Korean Exports: No Recovery
Korean Exports: No Recovery
Korean Exports: No Recovery
Chart I-7Chinese Imports To Remain Weak
Chinese Imports To Remain Weak
Chinese Imports To Remain Weak
Chart I-8German Manufacturing Confidence
German Manufacturing Confidence
German Manufacturing Confidence
German manufacturing IFO business expectations and current conditions both suggest that it is still early to bet on a global trade recovery (Chart I-8). Newly released August data points reveal that U.S., Taiwanese, and Swedish manufacturing new export orders continue to tumble. To gauge whether bifurcated markets will recouple and whether it will occur to the downside or the upside, investors should watch the relative performance of China-exposed markets, global cyclicals and high-beta plays – the ones that have already sold off substantially. The notion is as follows: These markets’ relative performance will likely bottom before their absolute performance recovers. If so, their relative performance will likely foretell the outlook for their absolute performance. Concerning share prices of growth companies, defensive equity sectors and credit markets, these segments are at risk because of expensive valuations and crowded investor positioning. In other words, they could sell off even if a global recession is avoided. Concerning share prices of growth companies, defensive equity sectors and credit markets, these segments are at risk because of expensive valuations and crowded investor positioning. To assess the outlook for global cyclicals and China-related plays, we are monitoring the following financial market indicators: The Risk-On/Safe-Haven currency ratio is the average of high-beta commodity currencies such as the CAD, AUD, NZD, BRL, CLP and ZAR total return (including carry) indices relative to the average of JPY and CHF total returns (including carry). This ratio is dollar-agnostic. This ratio is making a new cyclical low (Chart I-9). Hence, it presently warrants a negative view on global growth, China’s industrial sector and commodities. Global cyclical equity sectors seem to be on the edge of breaking down versus defensives (Chart I-10). This ratio does not signal ameliorating global growth conditions. Chart I-9The Risk-On/Safe-Haven Currency Ratio
bca.ems_wr_2019_09_05_s1_c9
bca.ems_wr_2019_09_05_s1_c9
Chart I-10Global Cyclicals Versus Defensives
Global Cyclicals Versus Defensives
Global Cyclicals Versus Defensives
Chart I-11U.S. High-Beta Stocks Versus S&P 500
U.S. High-Beta Stocks Versus S&P 500
U.S. High-Beta Stocks Versus S&P 500
Finally, U.S. high-beta stocks continue to underperform the S&P 500 (Chart I-11). This is consistent with overall U.S. growth deceleration. Bottom Line: Neither the most recent economic data, nor the relative performance of global cyclicals, China-related plays and high-beta markets herald a broad-based and lasting risk-on phase in global markets. On the contrary, economic and market signposts continue to foreshadow either further bifurcation in global markets or a risk-off period. Continue trading EM stocks and currencies on the short side, and underweighting EM risk assets versus DM. Our Investment Themes And Positions Some of our open positions often run for years because they reflect our long-standing themes. Our core theme has for some time been that a global trade/manufacturing recession will be generated by a growth relapse in China. To capitalize on this theme, we have been recommending a short EM stocks / long 30-year U.S. Treasurys strategy since April 2017. This recommendation has produced a 25% gain since its initiation (Chart I-12). Continue betting on lower local interest rates in emerging economies where the central bank can cut rates despite currency depreciation. To implement this theme, we have been recommending receiving swap rates in Korea and Chile for the past several years. Our reluctance to recommend an outright buy on local bonds stems from our bearish view on both currencies – the Korean won and Chilean peso. In fact, we have been shorting both the KRW and the CLP against the U.S. dollar. Chart I-13 shows that swap rates in Korea and Chile have dropped substantially since our recommendations to receive rates in these countries. More rate cuts are forthcoming in these economies, and we are maintaining these positions. Chart I-12EM Stocks Have Massively Underperformed U.S. Bonds
EM Stocks Have Massively Underperformed U.S. Bonds
EM Stocks Have Massively Underperformed U.S. Bonds
Chart I-13Continue Receiving Rates In Korea And Chile
Continue Receiving Rates In Korea And Chile
Continue Receiving Rates In Korea And Chile
We have been bearish on EM banks in general and Chinese banks in particular. We have expressed these themes in a number of ways: Short EM and Chinese / long U.S. bank stocks. Short EM banks / long EM consumer staples (Chart I-14). Within Chinese banks, we have been short Chinese medium and small banks / long large ones. All these strategies remain valid. In credit markets, we have been favoring U.S. corporate credit versus EM sovereign and corporate credit. Ability to service debt is better among U.S. debtors than EM/Chinese borrowers. We have been playing this theme in the following ways: Underweight EM sovereign and corporate credit / overweight U.S. investment-grade corporates (Chart I-15). Chart I-14Short EM Banks / Long EM Consumer Staples
Short EM Banks / Long EM Consumer Staples
Short EM Banks / Long EM Consumer Staples
Chart I-15Underweight EM Credit / Overweight U.S. Investment-Grade Corporates
Underweight EM Credit / Overweight U.S. Investment-Grade Corporates
Underweight EM Credit / Overweight U.S. Investment-Grade Corporates
Underweight Asian high-yield corporate credit / overweight emerging Asian investment-grade corporates. As a bet on a deteriorating political and business climate in Hong Kong, in our Special Report on Hong Kong SAR from June 27, we reiterated the following positions: Short Hong Kong property stocks / long Singapore equities. Arthur Budaghyan Chief Emerging Markets Strategist arthurb@bcaresearch.com Mexico: Crying Out For Policy Easing The Mexican economy is heading into a full-blown recession. Most segments of the economy are in contraction, and leading indicators point to further downside. Both manufacturing and non-manufacturing PMIs are well below 50 (Chart II-1). Monetary policy remains too restrictive: Nominal and real interest rates are both very high and plunging narrow money (M1) growth is signaling further downside in economic activity (Chart II-2). Chart II-1The Economy Is Deteriorating
The Economy Is Deteriorating
The Economy Is Deteriorating
Chart II-2Narrow Money Points To Negative Growth
Narrow Money Points To Negative Growth
Narrow Money Points To Negative Growth
An inverted yield curve signifies that the central bank is behind the curve and foreshadows growth contraction (Chart II-3). Fiscal policy has tightened as the government has remained committed to achieving a primary fiscal surplus of 1% of GDP in 2019 (Chart II-4, top panel). Consequently, nominal government expenditures have been curbed (Chart II-4, bottom panel). The government’s fiscal stimulus has not been large and has been implemented too late. Chart II-3A Message From The Inverted Yield Curve
A Message From The Inverted Yield Curve
A Message From The Inverted Yield Curve
Chart II-4Fiscal Policy Has Tightened A Lot
Fiscal Policy Has Tightened A Lot
Fiscal Policy Has Tightened A Lot
Finally, business confidence is extremely low due to uncertainty over President Andrés Manuel López Obrador’s (AMLO) policies towards the private sector. The president is attempting to revive business confidence, but it will take time. Chart II-5Mexico Versus EM: Domestic Bonds And Sovereign Credit
Mexico Versus EM: Domestic Bonds And Sovereign Credit
Mexico Versus EM: Domestic Bonds And Sovereign Credit
Our major theme for Mexico has been that both monetary and fiscal policies are very tight. Consequently, we have been recommending overweight positions in Mexican domestic bonds and sovereign credit relative to their respective EM benchmarks. (Chart II-5). Recessions are bad for share prices, but in tandem with prudent macro policies, they can be positive for fixed-income markets. Meanwhile, we have been favoring the Mexican peso relative to other EM currencies due to the fact that AMLO is not as negative for the country as was initially perceived by markets. With inflation falling and the Federal Reserve cutting rates, Banxico will ease further. Yet, it will likely cut rates slower than warranted by the economy. The longer the central bank takes to ease, the lower domestic bond yields will drop. Concerning sovereign credit, investors should remain overweight Mexico within an EM credit portfolio. Mexico’s fiscal position is healthier, and macroeconomic policies will be more prudent relative to what the market is currently pricing. We continue to believe concerns about Pemex’s financing and its impact on government debt are overblown, as we discussed in detail in our previous Special Report. In July, the government released an action plan for Pemex financing. We view this plan as marginally positive. To supplement this plan, the government can use the $14.5 billion federal budget stabilization fund to fill in financing shortfalls in the coming years. Importantly, the starting point of Mexican public debt is quite low, which will allow the government to finance Pemex in the years to come by borrowing more from markets. Recessions are bad for share prices, but in tandem with prudent macro policies, they can be positive for fixed-income markets. Lastly, our overweight recommendation in Mexican stocks has not played out. However, we are maintaining it for the following reasons: Chart II-6 illustrates that when Mexican domestic bond yields decline relative to EM ones (shown inverted on Chart II-6), Mexican share prices usually outperform their EM counterparts in common currency terms. Consistent with our view that Mexican local currency bonds will outperform their EM peers, we expect Mexican stocks to outpace the EM equity benchmark. The Mexican bourse’s relative performance against EM often swings with the relative performance of EM consumer staples versus the EM equity benchmark. This is due to the large share of consumer staples stocks in Mexico (34.5%) compared to that in the EM benchmark (7%). Consumer staples stocks are beginning to outpace the EM equity index, raising the odds of Mexican equity outperformance versus its EM peers (Chart II-7). Chart II-6Local Bond Yields And Relative Stocks: Mexico Versus EM
Local Bond Yields And Relative Stocks: Mexico Versus EM
Local Bond Yields And Relative Stocks: Mexico Versus EM
Chart II-7Consumer Staples Have A Large Weight In Mexican Bourse
Consumer Staples Have A Large Weight In Mexican Bourse
Consumer Staples Have A Large Weight In Mexican Bourse
We do not expect a major rally in this nation’s stock market given the negative growth outlook. Our bet is that Mexican share prices - having already deflated considerably - will drop less in dollar terms than the overall EM equity index. Bottom Line: We continue to recommend an overweight stance on Mexican sovereign credit, domestic bonds and equities relative to their respective EM benchmarks. The main risk to the Mexican peso stems from persisting selloff in EM currencies. Traders’ net long positions in the MXN are elevated posing non-trivial risk (Chart II-8). We have been long MXN versus ZAR but are taking profit today. This trade has generated a 9.7% gain since March 29, 2018. A plunging oil-gold ratio warrants a caution on this cross rate in the near term (Chart II-9). Chart II-8Investors Are Long MXN
Investors Are Long MXN
Investors Are Long MXN
Chart II-9Take Profits On Long MXN / Short ZAR Trade
Take Profits On Long MXN / Short ZAR Trade
Take Profits On Long MXN / Short ZAR Trade
Juan Egaña, Research Associate juane@bcaresearch.com Arthur Budaghyan Chief Emerging Markets Strategist arthurb@bcaresearch.com Footnotes Equities Recommendations Currencies, Credit And Fixed-Income Recommendations
The GAA DM Equity Country Allocation model is updated as of August 31, 2019. Currently, the model still favors Spain, Italy, Germany, the Netherlands, Switzerland, and Australia at the expense of the U.S., Japan, the U.K., France and Canada, as shown in Table 1. Table 1Model Allocation Vs. Benchmark Weights
GAA Quant Model Updates
GAA Quant Model Updates
Table 2Performance (Total Returns In USD %)
GAA Quant Model Updates
GAA Quant Model Updates
As shown in Table 2 and Chart 1, Chart 2 and Chart 3, the overall model underperformed the MSCI World benchmark by 6 bps in August, driven by 1 bp of outperformance from Level 2 model, and 6 bps of underperformance from Level 1. Since going live, the overall model has outperformed by 82 bps, with 290 bps of outperformance by Level 2 model, offset by 51 bps of underperformance from Level 1. Chart 1GAA DM Model Vs. MSCI World
GAA DM Model Vs. MSCI World
GAA DM Model Vs. MSCI World
Chart 2GAA U.S. Vs. Non U.S. Model (Level 1)
GAA U.S. Vs. Non U.S. Model (Level 1)
GAA U.S. Vs. Non U.S. Model (Level 1)
Chart 3GAA Non U.S. Model (Level 2)
GAA Non U.S. Model (Level 2)
GAA Non U.S. Model (Level 2)
Please see also the website http://gaa.bcaresearch.com/trades/allocation_performance. For more details on the models, please see Special Report, “Global Equity Allocation: Introducing The Developed Markets Country Allocation Model,” dated January 29, 2016, available at https://gaa.bcaresearch.com. Please note that the overall country and sector recommendations published in our Monthly Portfolio Update and Quarterly Portfolio Outlook use the results of these quantitative models as one input, but do not stick slavishly to them. We believe that models are a useful check, but structural changes and unquantifiable factors need to be considered too in making overall recommendations. GAA Equity Sector Selection Model Chart 4Overall Model Performance
Overall Model Performance
Overall Model Performance
The GAA Equity Sector Model (Chart 4) is updated as of August 31, 2019. The model’s relative tilts between cyclicals and defensives have changed compared to last month. The model continues to favor a mixed bag of sectors, given the current increased level of uncertainty, and continued lack of evidence that global growth is bottoming. Despite the current liquidity phase tilting the model to favor high-beta sectors, weak growth and momentum inputs offset that. The valuation component continues to remain muted across all sectors. The model is now overweight five sectors in total, two cyclical versus three defensive sectors. The overweight sectors are Consumer Discretionary, Information Technology, Consumer Staples, Healthcare and Utilities. For more details on the model, please see the Special Report “Introducing the GAA Equity Sector Selection Model,” dated July 27, 2016, as well as the Sector Selection Model section in the Special Alert “GAA Quant Model Updates,” dated March 1, 2019 available at https://gaa.bcaresearch.com. Table 3Model’s Performance (March 1, 2019 - Current)
GAA Quant Model Updates
GAA Quant Model Updates
Table 4Current Model Allocations
GAA Quant Model Updates
GAA Quant Model Updates
Xiaoli Tang, Associate Vice President xiaoliT@bcaresearch.com Amr Hanafy, Research Associate amrh@bcaresearch.com
Deciphering Sector Returns
Deciphering Sector Returns
Global equities peaked in late-January 2018 when the U.S. fiscal easing-related euphoria “positively infected” global investor sentiment. Since then, the SPX has moved laterally, closing higher by 0.52% (as of August 28, 2019 close). But, looking underneath the hood is revealing. The top panel of the chart shows the unweighted returns of the S&P 500 GICS1 sectors since January 2018. The bottom panel shows the weighted returns. Clearly the tech sector is the only pillar keeping equities afloat given the higher than 20% SPX weight they command. Within tech, software stocks have the largest weight and that juggernaut explains most of the tech sector’s returns since January 2018. One key reason why these secular growth stocks are near all-time highs (along with utilities and real estate outperformance) is the drubbing in U.S. Treasury yields, especially since the November 2018 peak. Nevertheless, there is a big risk looming: the trade war infiltrating tech stocks similar to the rest of their cyclical brethren. Already, two tech stocks (bellwether CSCO and ADSK) blamed the trade war for their soft guidance, and the longer the war lasts, the larger the list of profit warnings will get. Tack on the rising U.S. dollar, and profit expectations are at risk of disappointment, as the tech sector’s international sales exposure stands near 60%. As a reminder, we remain overweight the S&P software index, but we have increased our trailing stops in order to protect gains. Such a downgrade to neutral will also trigger the downgrade alert on the S&P tech sector and push this index to underweight from currently neutral. Bottom Line: The broad market is skating on thin ice and if the tech sector breaks down, so will the SPX. We reiterate our cautious overall equity market stance on a cyclical 3-12 month time horizon.