Sectors

Highlights While a self-fulfilling crisis of confidence that plunges the global economy into recession cannot be excluded, it is far from our base case. Provided the trade war does not spiral out of control, it is highly likely that global equities will outperform bonds over the next 12 months. The auto sector has been the main driver of the global manufacturing slowdown. As automobile output begins to recover later this year, so too will global manufacturing. Go long auto stocks. As a countercyclical currency, the U.S. dollar will weaken once global growth picks up. We expect to upgrade EM and European equities later this year along with cyclical equity sectors such as industrials, energy, and materials. Financials should also benefit from steeper yield curves. We still like gold as a long-term investment. However, the combination of higher bond yields and diminished trade tensions could cause bullion to sell off in the near term. As such, we are closing our tactical long gold trade for a gain of 20.5%. Feature “The Democrats are trying to 'will' the Economy to be bad for purposes of the 2020 Election. Very Selfish!” – @realDonaldTrump, 19 August 2019 8:26 am “The Fake News Media is doing everything they can to crash the economy because they think that will be bad for me and my re-election” – @realDonaldTrump, 15 August 2019 9:52 am Bad Juju Chart 1Spike In Google Searches For The Word Recession
A Psychological Recession?
A Psychological Recession?
President Trump’s remarks, made just a few days after the U.S. yield curve inverted, were no doubt meant to deflect attention away from the trade war, while providing cover for any economic weakness that might occur on his watch. But does the larger point still stand? Google searches for the word “recession” have spiked recently, even though underlying U.S. growth has remained robust (Chart 1). Could rising angst induce an actual recession? Theoretically, the answer is yes. A sudden drop in confidence can generate a self-fulfilling cycle where rising pessimism leads to less private-sector spending, higher unemployment, lower corporate profits, weaker stock prices, and ultimately, even deeper pessimism. Two things make such a vicious cycle more probable in the current environment. First, the value of risk assets is quite high in relation to GDP in many economies (Chart 2). This means that any pullback in equity prices or jump in credit spreads will have an outsized impact on financial conditions. Chart 2The Total Market Value Of Risk Assets Is Elevated
The Total Market Value Of Risk Assets Is Elevated
The Total Market Value Of Risk Assets Is Elevated
Chart 3Not Much Scope To Cut Rates
Not Much Scope To Cut Rates
Not Much Scope To Cut Rates
Second, policymakers are currently more constrained in their ability to react to adverse shocks, such as an intensification of the trade war, than in the past. Interest rates in Europe and Japan are already at zero or in negative territory (Chart 3). Even in the U.S., the zero-lower bound constraint – though squishier than once believed – remains a formidable obstacle. Chart 4 shows that the Federal Reserve has cut rates by over five percentage points, on average, during past recessions. It would be impossible to cut rates by that much this time around if the U.S. economy were to experience a major downturn. Chart 4The Fed Is Worried About The Zero Bound
The Fed Is Worried About The Zero Bound
The Fed Is Worried About The Zero Bound
Fiscal stimulus could help buttress growth. However, both political and economic considerations are likely to limit the policy response. While China is stimulating its economy, concerns about excessively high debt levels have caused the authorities to adopt a reactive, tentative approach. Japan is set to raise the consumption tax on October 1st. Although a variety of offsetting measures will mitigate the impact on the Japanese economy, the net effect will still be a tightening of fiscal policy. Germany has mused over launching its own Green New Deal, but so far there has been a lot more talk than action. President Trump floated the idea of cutting payroll taxes, only to abandon it once it became clear that the Democrats were unwilling to go along. On The Positive Side Despite these clear risks, we are inclined to maintain our fairly sanguine 12-to-18 month global macro view. There are a number of reasons for this: First, the weakness in global manufacturing over the past 18 months has not infected the much larger service sector (Chart 5). Even in Germany, with its large manufacturing base, the service sector PMI remains above 50, and is actually higher than it was late last year. This suggests that the latest global slowdown is more akin to the 2015-16 episode than the 2007-08 or 2000-01 downturns. Chart 5AThe Service Sector Has Softened Much Less Than Manufacturing (I)
The Service Sector Has Softened Much Less Than Manufacturing (I)
The Service Sector Has Softened Much Less Than Manufacturing (I)
Chart 5BThe Service Sector Has Softened Much Less Than Manufacturing (II)
The Service Sector Has Softened Much Less Than Manufacturing (II)
The Service Sector Has Softened Much Less Than Manufacturing (II)
Second, manufacturing activity should benefit from a turn in the inventory cycle over the remainder of the year. A slower pace of inventory accumulation shaved 90 basis points off of U.S. growth in the second quarter and is set to knock another 40 basis points from growth in the third quarter, according to the Atlanta Fed GDPNow model. Excluding inventories, U.S. GDP growth would have been 3% in Q2 and is tracking at 2.7% in Q3 – a fairly healthy pace given the weak global backdrop (Chart 6). Chart 6The U.S. Economy Is Still Holding Up Well
A Psychological Recession?
A Psychological Recession?
Outside the U.S., inventories are making a negative contribution to growth (Chart 7). In addition to the official data, this can be seen in the commentary accompanying the Markit manufacturing surveys, which suggest that many firms are liquidating inventories (Box 1). Falling inventory levels imply that sales are outstripping production, a state of affairs that cannot persist indefinitely. Third, and related to the point above, the automobile sector has been the key driver of the global manufacturing slowdown. This is in contrast to 2015-16, when the main culprit was declining energy capex. According to Wards, global vehicle production is down about 10% from year-ago levels, by far the biggest drop since the Great Recession (Chart 8). The drop in automobile production helps explain why the German economy has taken it on the chin recently. Chart 7Inventories Are Making A Negative Contribution To Growth
Inventories Are Making A Negative Contribution To Growth
Inventories Are Making A Negative Contribution To Growth
Chart 8Auto Sector: The Culprit Behind The Manufacturing Slowdown
Auto Sector: The Culprit Behind The Manufacturing Slowdown
Auto Sector: The Culprit Behind The Manufacturing Slowdown
Importantly, motor vehicle production growth has fallen more than sales growth, implying that inventory levels are coming down. Despite secular shifts in automobile ownership preferences, there is still plenty of upside to automobile usage. Per capita automobile ownership in China is only one-fifth of what it is in the United States, and one-fourth of what it is in Japan (Chart 9). This suggests that the recent drop in Chinese auto sales will be reversed. As automobile output begins to recover later this year, so too will global manufacturing. Investors should consider going long automobile makers. Chart 10 shows that the All-Country World MSCI automobiles index is trading near its lows on both a forward P/E and price-to-book basis, and sports a juicy dividend yield of nearly 4%.1 Chart 9The Automobile Ownership Rate Is Still Quite Low In China
The Automobile Ownership Rate Is Still Quite Low In China
The Automobile Ownership Rate Is Still Quite Low In China
Chart 10Auto Stocks Are A Compelling Buy
A Psychological Recession?
A Psychological Recession?
Fourth, our research has shown that globally, the neutral rate of interest is generally higher than widely believed. This means that monetary policy is currently stimulative, and will become even more accommodative as the Fed and a number of other central banks continue to cut rates. Remember that unemployment rates have been trending lower since the Great Recession and have continued falling even during the latest slowdown, implying that GDP growth has remained above trend (Chart 11). As diminished labor market slack causes inflation to rebound from today’s depressed levels, real policy rates will decline, leading to more spending through the economy. Chart 11Unemployment Rates Keep Trending Lower
Unemployment Rates Keep Trending Lower
Unemployment Rates Keep Trending Lower
The Trade War Remains The Biggest Risk The points discussed above will not matter much if the trade war spirals out of control. It is impossible to know what will happen for sure, but we can deduce the likely course of action based on the incentives that both sides face. President Trump has shown a clear tendency in recent weeks to try to de-escalate trade tensions whenever the stock market drops. This is not surprising: Despite his efforts to deflect blame for any selloff on others, he knows full well that many voters will blame him for losses in their 401(k) accounts and for slower domestic growth and rising unemployment. What about the Chinese? An increasing number of pundits have warmed up to the idea that China is more than willing to let the global economy crash if this means that Trump won’t be re-elected. If this is China’s true intention, the Chinese will resist making any deal, and could even try to escalate tensions as the U.S. election approaches. It is an intriguing thesis. However, it is not particularly plausible. U.S. goods exports to China account for 0.5% of U.S. GDP, while Chinese exports to the U.S. account for 3.4% of Chinese GDP. Total manufacturing value-added represents 29% of Chinese GDP, compared to 11% for the United States. There is no way that China could torpedo the U.S. economy without greatly hurting itself first. Any effort by China to undermine Trump’s re-election prospects would invite extreme retaliatory actions, including the invocation of the War Powers Act, which would make it onerous for U.S. companies to continue operating in China. Even if Trump loses the election, he could still wreak a lot of havoc on China during the time he has left in office. Moreover, as Matt Gertken, BCA’s Chief Geopolitical Strategist, has stressed, if Trump were to feel that he could not run for re-election on a strong economy, he would try to position himself as a “War President,” hoping that Americans rally around the flag. That would be a dangerous outcome for China. Chart 12Would China Really Be Better Off Negotiating With A Democrat As President?
Would China Really Be Better Off Negotiating With A Democrat As President?
Would China Really Be Better Off Negotiating With A Democrat As President?
In any case, it is not clear whether China would be better off with a Democrat as president. The popular betting site PredictIt currently gives Elizabeth Warren a 34% chance of winning, followed by Joe Biden with 26%, and Bernie Sanders with 15% (Chart 12). This means that two far-left candidates with protectionist leanings, who would stress environmental protection and human rights in their negotiations with China, have nearly twice as much support as the former Vice President. All this suggests that China has an incentive to de-escalate the trade war. Given that Trump also has an incentive to put the trade war on hiatus, some sort of détente between the U.S. and China, as well as between the U.S. and other players such as the EU, is more likely than not. Investment Conclusions Provided the trade war does not spiral out of control, it is very likely that global equities will outperform bonds over the next 12 months. Since it might take a few more months for the data on global growth to improve, equities will remain in a choppy range in the near term, before moving higher later this year. As we discussed last week, the equity risk premium is quite high in the U.S., and even higher abroad, where valuations are generally cheaper and interest rates are lower (Chart 13).2 Chart 13AEquity Risk Premia Remain Quite High (I)
Equity Risk Premia Remain Quite High (I)
Equity Risk Premia Remain Quite High (I)
Chart 13BEquity Risk Premia Remain Quite High (II)
Equity Risk Premia Remain Quite High (II)
Equity Risk Premia Remain Quite High (II)
The U.S. dollar is a countercyclical currency (Chart 14). If global growth picks up later this year, the greenback should begin to weaken. European and emerging market stocks have typically outperformed the global benchmark in an environment of rising global growth and a weakening dollar (Chart 15). We expect to upgrade EM and European equities – along with more cyclical sectors of the stock market such as industrials, materials, and energy – later this year. Chart 14The U.S. Dollar Is A Countercyclical Currency
The U.S. Dollar Is A Countercyclical Currency
The U.S. Dollar Is A Countercyclical Currency
Chart 15EM And Euro Area Equities Usually Outperform When Global Growth Improves
EM And Euro Area Equities Usually Outperform When Global Growth Improves
EM And Euro Area Equities Usually Outperform When Global Growth Improves
Thanks to the dovish shift by central banks around the world, government bond yields are unlikely to return to their 2018 highs anytime soon. Nevertheless, stronger economic growth should lift long-term yields at the margin, causing yield curves to steepen (Chart 16). Steeper yield curves will benefit beleaguered bank stocks. Chart 16Stronger Economic Growth Should Lift Long-Term Bond Yields, Causing Yield Curves To Steepen
Stronger Economic Growth Should Lift Long-Term Bond Yields, Causing Yield Curves To Steepen
Stronger Economic Growth Should Lift Long-Term Bond Yields, Causing Yield Curves To Steepen
Finally, a word on gold: We still like gold as a long-term investment. However, the combination of higher bond yields and diminished trade tensions could cause bullion to sell off in the near term. As such, we are closing our tactical long gold trade for a gain of 20.5%. Peter Berezin, Chief Global Strategist Global Investment Strategy peterb@bcaresearch.com Box 1 Evidence of Inventory Liquidation In The Manufacturing Sector
A Psychological Recession?
A Psychological Recession?
Footnotes 1 The top ten constituents of the MSCI ACWI Automobiles Index are Toyota (22.6%), General Motors (7.8%), Daimler (7.3%), Honda Motor (6.2%), Ford Motor (5.7%), Tesla (4.8%), Volkswagen (4.8%), BMW (3.8%), Ferrari (3.0%), Hyundai Motor (2.4%). 2 Please see Global Investment Strategy Special Report, “TINA To The Rescue?” dated August 23, 2019. Strategy & Market Trends MacroQuant Model And Current Subjective Scores
A Psychological Recession?
A Psychological Recession?
Tactical Trades Strategic Recommendations Closed Trades
Stay Checked Out Of Hotels
Stay Checked Out Of Hotels
Underweight The latest University of Michigan consumer sentiment survey made for grim reading and such souring in confidence will continue to weigh on lodging equities (second panel). As a result, we remain underweight the niche S&P hotels, resorts & cruise lines consumer discretionary subgroup. Labor-related input costs are also on fire as the sector’s wage inflation is climbing at a 3.9%/ annum pace or roughly 120 bps higher that the overall business sector employment cost index (bottom panel). Taken together, there are high odds that a profit margin squeeze will weigh on profits and on relative share prices (top panel). Bottom Line: Continue to avoid the S&P hotels, resorts & cruise lines index. Please see our most recent Weekly Report for additional details. The ticker symbols for the stocks in this index are: BLBG: S5HOTL – MAR, HLT, RCL, CCL, NCLH.
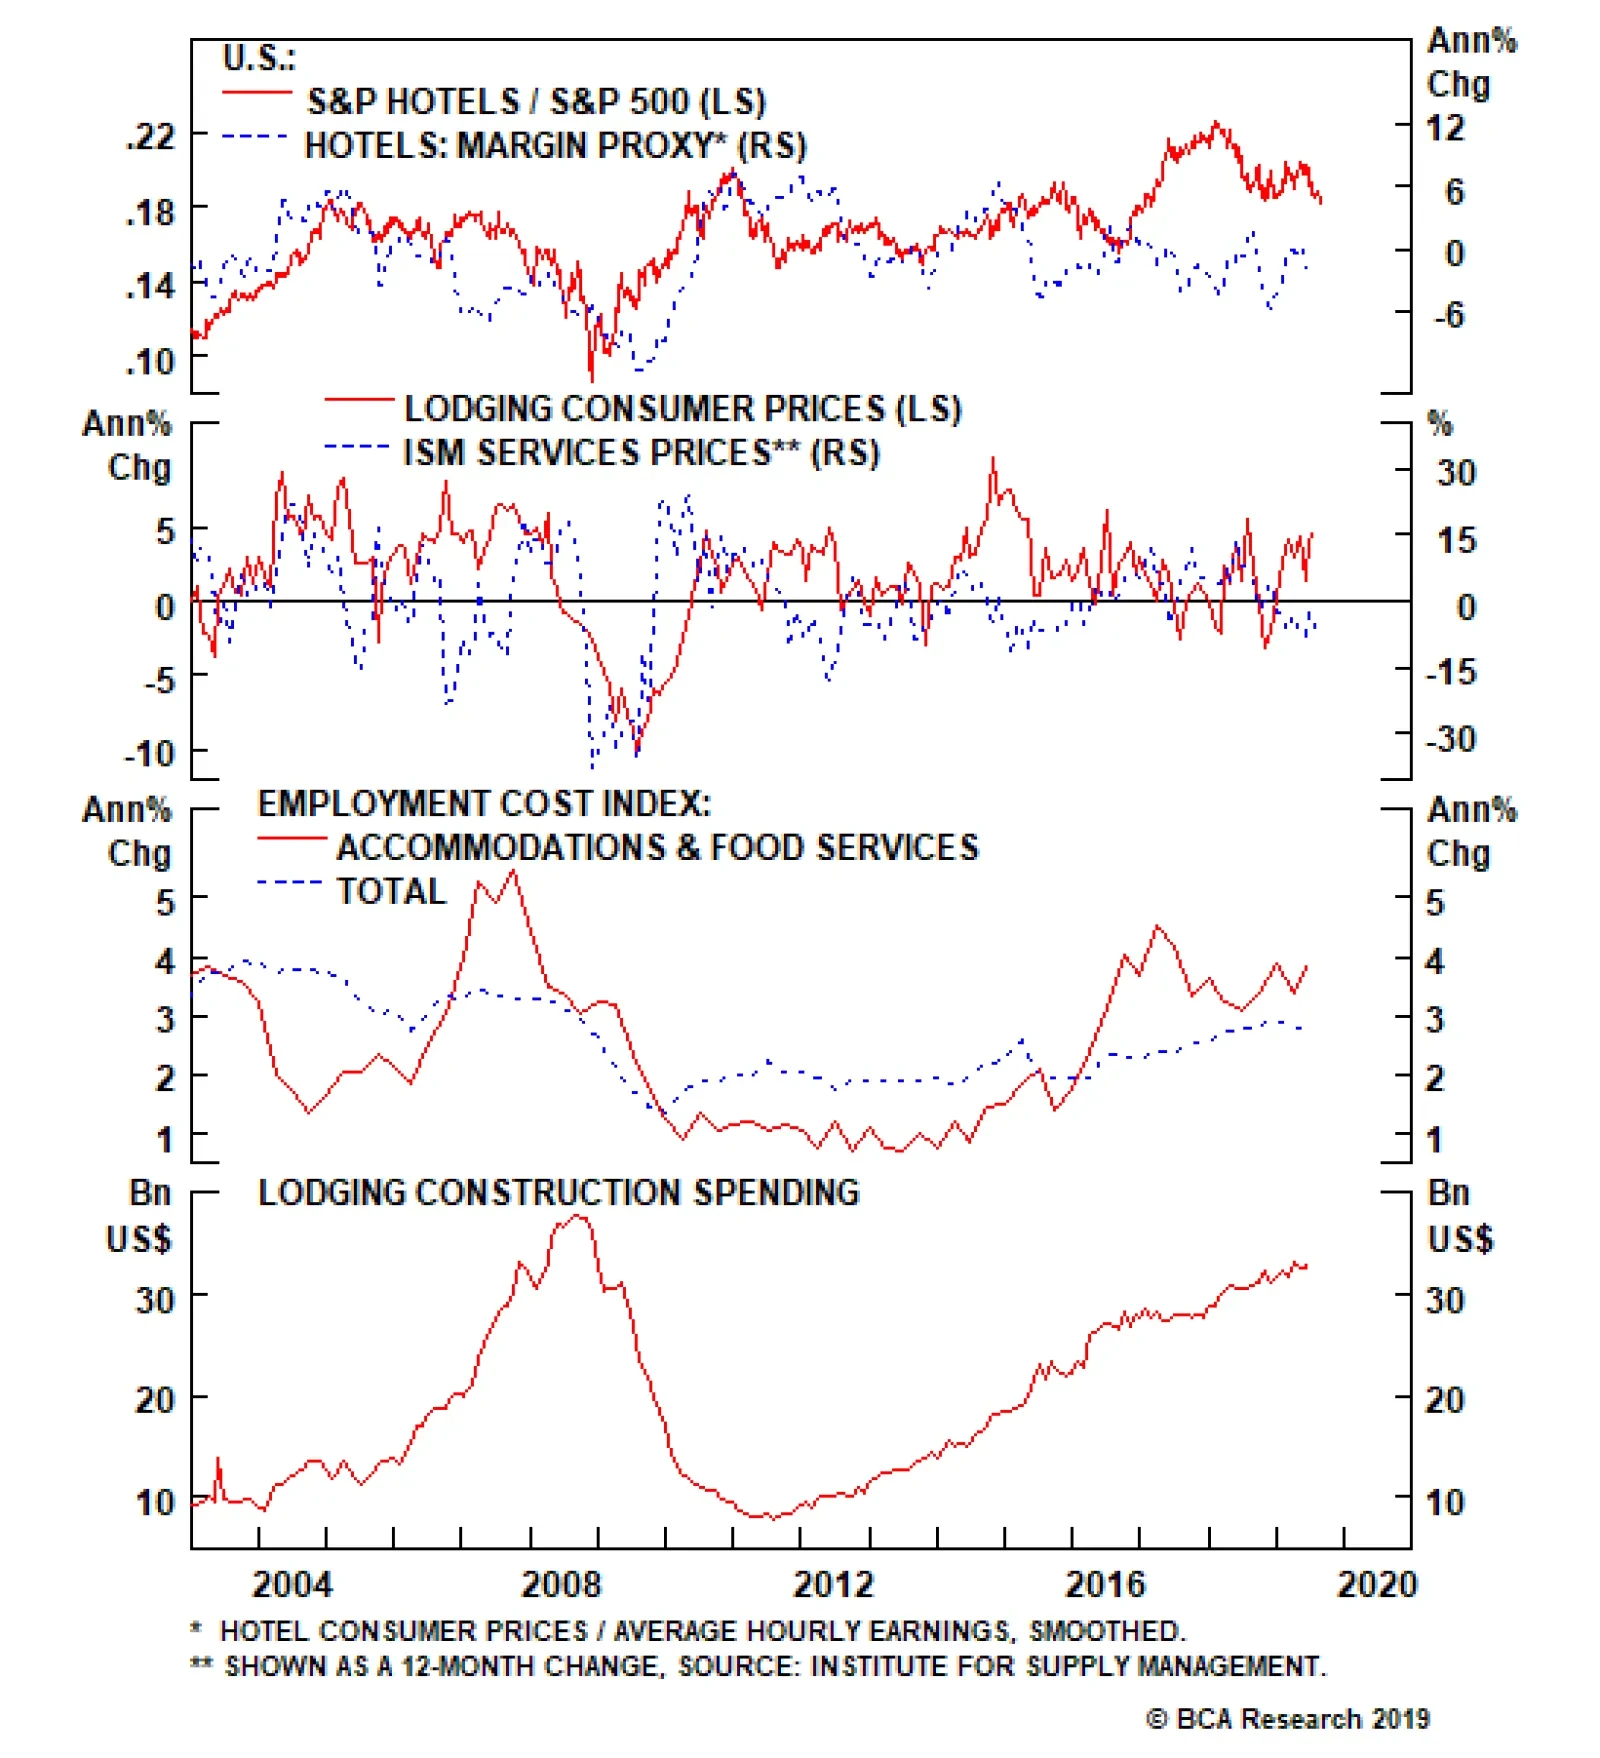
On the operating front the news is equally dour. While selling prices are expanding, the relentless construction binge will lead to a mean reversion sooner rather than later. Tack on the ongoing assault from the new sharing economy unicorns like Airbnb, and…
The latest University of Michigan consumer sentiment survey made for grim reading and such souring in confidence will continue to weigh on lodging equities. As a result, we remain underweight the niche S&P hotels, resorts & cruise lines consumer…
Highlights It will be impossible for China to undertake even mild deleveraging and simultaneously accelerate household income growth. All deposits in the banking system have been created by banks “out of thin air” and have not been engendered by household savings. Contrary to widespread beliefs, mainland households are highly leveraged. Cyclically, high equity valuations, crowded investor positioning and the delayed cyclical recovery in the Chinese economy pose downside risks to consumer stocks. Structurally, real income growth per capita is contingent on productivity growth. The latter will slow in China but remain relatively elevated. Overall, investors should consider buying Chinese consumer plays on weakness. Feature Deliberations about China’s successful rebalancing often boils down to whether one believes that consumers will be able to offset the slowdown in investment and exports and keep overall real GDP growth close to current levels. The narrative typically presumes that Chinese households are not spending enough and can boost their spending counteracting the ongoing slowdowns in capital spending as well as in exports. This conjecture is fallible. Chart I-1The Myth Of Deficient Consumer Demand In China
The Myth Of Deficient Consumer Demand In China
The Myth Of Deficient Consumer Demand In China
Consumer spending in China has in fact been booming over the past 20 years – it has been growing at a compounded annual growth rate (CAGR) of 10% in real terms since 1998 (Chart I-1, top panel). Hence, the imbalance in China has not been sluggish consumer spending. Rather, capital expenditure has been too strong for too long (Chart I-1, bottom panel). Healthy rebalancing entails a slowdown in investment spending – not an acceleration in household demand. Hence, the market relevant question is: Can the growth rate of household expenditure accelerate above 10% CAGR in real terms as capital spending and exports decelerate? Our hunch is that this is unlikely. As the authorities attempt to contain credit and investment excesses and trade war-induced relocation of manufacturers out of China gathers steam, the pertinent question is whether the slowdown in household expenditures in real terms will be mild (from the current 10% pace to 7.5-9% CAGR), medium (6-7.5%) or material (below 6%). In our opinion, the medium scenario has the highest odds of playing out. There are many positives about the vitality of Chinese consumers and we do not mean to downplay them. Nevertheless, many of these positives are well known, and the objective of our report is to reveal misconceptions about this segment. Deleveraging And Consumers If and when deleveraging does transpire in China, the household income growth rate will decelerate, resulting in weaker spending growth. It will be impossible for the mainland economy to undertake even mild deleveraging and simultaneously accelerate household income growth. Chart I-2Capital Spending Is Much More Important Than Exports
Capital Spending Is Much More Important Than Exports
Capital Spending Is Much More Important Than Exports
Our focus for this report is on a slowdown in credit and capital spending rather than exports. The basis is that the latter in general, and shipments to the U.S. in particular, have a much smaller impact than investment expenditures (Chart I-2). In turn, capital spending is mostly financed by credit. It is crucial to understand the significance of credit in driving national and household income growth in China since 2008. Currently, 2.5 yuan of new credit is needed to generate one yuan of GDP growth. This certifies that the mainland economy has become addicted to credit. As we have argued in depth in past reports, commercial banks do not intermediate savings into credit, but rather create new money/credit “out of thin air” when they lend to or buy securities from non-banks. This entails that output and income growth would have been much weaker had banks not provided credit equal to RMB 19 trillion over the past 12 months. For instance, a company affiliated with the provincial government has borrowed money from banks to build three bridges over the past 10 years, accumulating a lot of debt in the process. Ostensibly, operating these bridges does not generate enough cash flow to service its debt – a common occurrence in China. With the three bridges completed, the company would then apply for a new loan to build a fourth bridge. Should banks lend additional money to construct it? Notwithstanding this hypothetical company’s low creditworthiness, if banks provide additional financing, the credit bubble will become larger, and the issue of overcapacity will intensify. On the other hand, household income and spending growth will remain robust. If banks do not finance the construction of the fourth bridge, labor income growth in the province – employees of this company and its suppliers – will slump. Thus, if for whatever reason banks are unable or unwilling to extend as much in new credit as last year, output and income growth in this province will decelerate, all else equal. Given credit has been playing an enormous role in driving China’s economic growth over the past 10 years, it will be almost impossible to slow down credit without a downshift in household income growth. This example and analysis is not meant to suggest that bank credit origination is the sole growth driver in China. Theoretically, GDP can expand even with bank credit/money contracting. According to the quantity theory of money: Nominal GDP = Money Supply x Velocity of Money This means nominal GDP can grow even when the supply of money/credit is shrinking. For this to happen, the velocity of money should rise faster than the pace of decline in the supply of money/credit. From a practical perspective, this requires enterprises and consumers to increase the turnover (velocity) of their bank deposits and cash on hand (money supply). We have deliberated in past reports that the velocity of money and the savings rate are inversely related: A rising velocity of money entails a declining savings rate, and vice versa. Going back to our example of bridge construction, the relevant question is: Will companies and households in that province increase their spending (i.e., reduce their savings rate) if banks do not finance the construction of the fourth bridge? The realistic answer is not likely. If the fourth bridge does not receive financing, weaker income growth in that province – due to employment redundancies among construction companies and their suppliers – would lead to slower spending growth. Faced with slowing demand growth, other enterprises and households would likely turn cautious and increase their savings rates – i.e., reduce the velocity of money supply. In short, reduced credit origination will mostly likely generate slower household income growth and, consequently, spending. Chart I-3China: No Deleveraging So Far
China: No Deleveraging So Far
China: No Deleveraging So Far
Broadly speaking, household income growth has not yet downshifted because deleveraging in China has not started. Chart I-3 illustrates that aggregate domestic credit – including public sector, enterprises and households – continues to grow above 10% and well above nominal GDP growth. In fact, credit growth has exceeded nominal GDP growth since 2008. This is local currency credit and does not include foreign currency debt, but the latter is small at 14.5% of GDP (or about US$ 2 trillion). To us, deleveraging implies credit growth that is no greater than nominal GDP growth – i.e., a flat or declining credit-to-GDP ratio for at least several years. If China is serious about deleveraging and curbing its money/credit bubble, the pace of credit expansion should decline to or below nominal GDP growth – which is presently 8%. If and when this occurs it will dampen household income and spending growth. Bottom Line: Chinese household income and spending will inevitably slow if money/credit growth slumps, given the Chinese economy’s excessive reliance on new credit origination over the past 10 years. Do Households Have A Savings Or Debt Glut? What about households’ enormous savings in China? Why wouldn’t households reduce their savings and boost spending? When referring to household savings, most allude to bank deposits. But in conventional economic theory – and according to the way household savings are statistically calculated at a national level – savings actually have no relation to bank deposits. Chart I-4No Empirical Evidence That Deposits = Savings
No Empirical Evidence That Deposits = Savings
No Empirical Evidence That Deposits = Savings
Chart I-4 illustrates that in China, the annual change in household deposits is not equal to household savings (Chart I-4, top panel). Similarly, the annual rise in all deposits (based on central bank data) is vastly different from annual national savings (as defined by conventional macroeconomics and calculated by the National Bureau of Statistics) (Chart I-4, bottom panel). Bank deposits are a monetary concept that we will refer to as “money savings.” Deposits are created by banks “out of thin air,” as illustrated in our past reports.Meanwhile, the term “savings” in conventional macroeconomics denotes goods and services that are produced but not consumed, which is a real economic (not monetary) variable. Not surprisingly, there is no relationship between these “real savings” and “money savings,” as illustrated in Chart I-4. To illustrate that household “savings” (as defined by conventional macroeconomics) are not related to money supply/deposits, let us go back to the example of the company building bridges in China. When the company wire transfers a salary of RMB 1,000 to an employee, the amount of money supply in the banking system does not change. Suppose this employee decides to save 100% of her income this month. Will the supply of money increase or decrease? The answer is that it will not change: the deposit will remain at her bank account. Alternatively, if she decides to spend all RMB 1,000 (100% of her income), the supply of money also will not change – deposits will be transferred to other banks where her suppliers have their accounts. If she cashes out her deposit and puts it under her mattress, the amount of bank deposits will decline, but cash in circulation will rise by the same amount. Provided money supply is equal to the sum of all bank deposits and cash in circulation, the amount of money supply will not change. The only way the supply of money will decline is if she pays down her loan to a bank. Conversely, the supply of money only rises when banks originate loans or buy assets from non-banks. In short, saving/not spending does not alter the amount of money supply. Rather, broad money supply is equal to the cumulative net money creation “out of thin air” primarily by commercial banks and less so by the central bank over the course of their history. This has nothing to do with household and national “savings.” The latter stand for goods and services produced but not consumed. We have discussed what “savings” mean in conventional economics in past reports. Chart I-5Chinese Households Are More Leveraged Than U.S. Ones
Chinese Households Are More Leveraged Than U.S. Ones
Chinese Households Are More Leveraged Than U.S. Ones
Critically, Chinese households presently carry more debt as a share of their disposable income than American households (Chart I-5). This chart compares household debt to disposable income using official data from both China and the U.S. In the case of China, we add Peer-to-Peer (P2P) credit to consumer credit data published by the People’s Bank of China to calculate household debt. The argument by many commentators that consumers in China are not highly leveraged is grounded on the comparison of their debt to GDP. However, in all countries, household debt is assessed versus disposable income – not GDP. The income available to households to service their debt is their disposable income – not GDP. It is correct that Chinese households’ assets have surged in the past two decades as they have purchased significant amounts of real estate, and property prices have skyrocketed. A survey by China Economic Trend Institute holds that property accounts for 66% of household assets in China. To assess creditworthiness, investors should not rely on debtors’ asset values. If debtors are en masse forced to sell their assets to service debt, equity prices would tumble well beforehand. Rather, creditworthiness should be assessed based on recurring cash flow (income) available to debtors to service their debt. One should not be surprised as to why real estate prices are very high in China. Money and credit have been surging – have grown four-fold – over the past 10 years (Chart I-6) and are still expanding at close to a 10% pace. In particular, household debt is still growing at a whopping 15.5% annually (Chart I-7). If and as money/credit growth downshifts, property prices will deflate. Chart I-6Helicopter Money In China
Helicopter Money In China
Helicopter Money In China
Chart I-7Household Credit Is Expanding Twice As Fast As Income Growth
Household Credit Is Expanding Twice As Fast As Income Growth
Household Credit Is Expanding Twice As Fast As Income Growth
Importantly, housing affordability is low and households’ ability to service their mortgages is troubling. Chart I-8 exhibits the nationwide house price-to-income ratio for China and the U.S. In the Middle Kingdom, it is currently about 7.2, while in the U.S. the ratio has never been above 4. It only approached 4 at the peak of the housing bubble in 2006. Chart I-8House Prices Are Very Expensive In China
House Prices Are Very Expensive In China
House Prices Are Very Expensive In China
Chart I-
In turn, Table I-1 illustrates mortgage interest-only payments as a share of household disposable income. The national average is 25.5%. These are very high ratios, suggesting an average new home buyer will have to allocate about a quarter of her or his household income just to pay the interest on a mortgage. These averages do not divulge enormous variations among households. High-income and rich households probably do not have much debt, and debt sustainability is not an issue for them. This also implies that there are many low-income households for whom the interest payments on mortgages absorb more than 25% of their disposable income. Bottom Line: All deposits in the banking system have been created by banks “out of thin air” and have not been engendered by household savings. Contrary to widespread beliefs, mainland households have a lot of debt, and the latter is still expanding faster than nominal disposable income growth (Chart I-7 above). Positives And The Cyclical Outlook This section lists some positives for household incomes and spending, while also highlighting inherent risks: In the long run, per-capita real income growth in any country is equal to productivity growth. Productivity in China is still booming, justifying high real income growth. The question is whether such buoyant productivity growth can be sustained at a high level to justify robust real-income per-capita growth. Typically, easy money breeds complacency, misallocation of capital and ultimately lower productivity growth. Can China sustain productivity growth of 6% to assure a similar growth rate in real income per capita if the nation continues to experience easy money and a misallocation of capital? Forecasting productivity is not easy; only time will tell. Chart I-9Nominal Household Income, Wages And Salaries
Nominal Household Income, Wages And Salaries
Nominal Household Income, Wages And Salaries
Per capita aggregate income as well as both wages and salaries are still expanding briskly – by about 8.5% in nominal terms from a year ago (Chart I-9). This is a formidable growth rate and entails vigorous spending power. The cyclical and long-term concern is whether the current rate of income growth is sustainable. So far there has been few redundancies, despite the fact that corporate revenue and profits have slumped. There is anecdotal evidence that the authorities are actively discouraging dismissals among both state-owned and private enterprises. If layoffs are avoided in this cycle, it will imply that the full pain of the slowdown is absorbed by shareholders. As a result, wages and salaries will rise as a share of GDP, causing a profit margin squeeze for companies. Will private shareholders be willing to invest in the future? Over the past year, authorities have targeted the stimulus at consumers by cutting personal income taxes. However, this has not boosted consumption: First, the individual taxpayers’ base was very small; only one quarter of total employment (or 16% of the population) was paying personal income taxes before the most recent cut. Second, personal income tax savings have amounted to less than 2% of disposable income. Finally, the savings from tax cuts are unevenly distributed across households. High-income families will probably get higher tax savings than lower-income ones, whereas the propensity to spend is higher for the latter than the former. Household deposit expansion has accelerated at the expense of enterprises (Chart I-10). This confirms that companies have not slowed the payments to employees (wage bill). Consequently, households have firepower which can be unleashed at any time. However, there are presently no signs of a growing appetite to spend. Quite the contrary, our proxy for household marginal propensity to spend is falling (Chart I-11). Chart I-10Households Are Hoarding Money, Not Spending
Households Are Hoarding Money, Not Spending
Households Are Hoarding Money, Not Spending
Chart I-11Household Marginal Propensity To Spend Is Still Falling
Household Marginal Propensity To Spend Is Still Falling
Household Marginal Propensity To Spend Is Still Falling
Non-discretionary consumer spending has remained very robust. In contrast, discretionary spending has been extremely weak and shows no signs of recovery (Chart I-12). Finally, the impulses of non-government credit, broad money and household credit are weak (Chart I-13). Without these improving substantially and households’ marginal propensity to spend rising, it is difficult to expect a meaningful recovery in consumption. Chart I-12Discretionary Spending Is Sluggish
Discretionary Spending Is Sluggish
Discretionary Spending Is Sluggish
Chart I-13Credit/Money Impulses Are Much Weaker Than In Previous Stimulus
Credit/Money Impulses Are Much Weaker Than In Previous Stimulus
Credit/Money Impulses Are Much Weaker Than In Previous Stimulus
Bottom Line: A cyclical recovery in consumer spending hinges on another round of major credit and fiscal stimulus as well as improvement in households’ willingness to spend. Structurally, real income growth is contingent on China’s ability to sustain high productivity growth. Investment Implications If and as capital spending and exports growth slow further, the pace of expansion in consumer expenditure will also moderate. In such a scenario, overall economic growth in China will inevitably downshift. Structurally, Chinese consumer spending will slow from the torrid pace of 10% CAGR of the past 10 years to around 6-7.5% CAGR in real terms. This is a formidable growth rate, and warrants a bullish stance on the consumer sector. We identified Chinese consumers as a major investment theme for the current decade in our 2010 report titled How To Play EM This Decade? 1 In that report, we recommended selling commodities and sectors exposed to Chinese construction and instead favoring consumer plays, especially in the health care and tech sectors. This structural theme has played out well and has further to go. Chinese household spending on health care, education and other high-value services will rise as income per capita expands, albeit at a slower rate than before. Chart I-14 demonstrates that Chinese imports of medical and pharmaceutical products are surging, even though overall imports are currently contracting. Domestically, profit margins are expanding within the medical and pharmaceuticals industries but stagnating for the overall industrial sector (Chart I-15). Chart I-14Surging Demand For Medical Products/Goods
Surging Demand For Medical Products/Goods
Surging Demand For Medical Products/Goods
Chart I-15Continue Favoring Companies In Health Care/Medical Space
Continue Favoring Companies In Health Care/Medical Space
Continue Favoring Companies In Health Care/Medical Space
All that said, a bullish growth story does not always translate into strong equity returns. Charts I-16A and I-16B reveal that share prices of Chinese investible consumer sub-sectors have had mixed performance. With the exception of Alibaba and Tencent, a few of consumer equity sub-sectors have generated strong equity returns. Chart I-16AChinese Consumer Stocks: Mixed Performance
Chinese Consumer Stocks: Mixed Performance
Chinese Consumer Stocks: Mixed Performance
Chart I-16BChinese Consumer Stocks: Mixed Performance
Chinese Consumer Stocks: Mixed Performance
Chinese Consumer Stocks: Mixed Performance
Such poor equity performance given strong headline consumption growth has often been due to bottom-up problems such as profit margins squeeze, overexpansion, over-indebtedness, equity dilution, quality of management and other issues.
Chart I-
Apart from company specific risks, investors should also consider valuations. Buying good companies in great industries at very high equity multiples will probably produce meager returns. Table I-2 shows the trailing P/E ratio for various consumer sub-sectors. The majority of them trade at a trailing P/E ratio of above 20 and in some cases above 30. Besides, China’s consumer story has been well known for some time, and many portfolios are overweight China consumer plays. Consequently, investor positioning adds to near-term risks. Cyclically, high equity valuations, crowded investor positioning and the delayed cyclical recovery in the Chinese economy pose downside risks to consumer stocks as well. However, such a selloff will create conditions for selectively investing in reasonably valued high quality companies. Arthur Budaghyan Chief Emerging Markets Strategist arthurb@bcaresearch.com Lin Xiang, Research Analyst linx@bcaresearch.com Footnotes 1 Please see Emerging Markets Strategy Special Report, “How To Play Emerging Market Growth In The Coming Decade”, dated June 10, 2010, available at ems.bcaresearch.com Equities Recommendations Currencies, Credit And Fixed-Income Recommendations
Away from the Sino-U.S. trade-war headlines – and the remarkable commodity price volatility they produce – apparent steel consumption in China is up 9.5% y/y in the first seven months of this year. This is being spurred by fiscal stimulus directed at infrastructure and construction spending, which remains strong relative to year-ago levels (Chart of the Week).1 Demand for copper normally drafts in the wake of China’s steel demand, and picks up when steel-intensive capital projects are being wired for use. In less uncertain times, getting long copper would make sense.2 Chart of the WeekFiscal Stimulus Boosts China Steel Consumption
Fiscal Stimulus Boosts China Steel Consumption
Fiscal Stimulus Boosts China Steel Consumption
We are holding off getting long for now, given the policy uncertainty – particularly in re trade policy – that dominates commodity markets, none moreso than steel and base metals. While the odds of a resolution to the trade war might be edging up from our 40% expectation, moving them closer to those of a coin toss does not justify taking the risk.3 Highlights Energy: Overweight. Retaliatory tariffs on $75 billion of U.S. imports, including crude oil, into China, provoked an additional 5% duty by President Trump on ~ $550 billion of goods shipped to the U.S. by China. This will lift the total tariff on $250 billion of U.S. imports from China to 30%, and on another $300 billion to 15%, starting Oct. 1 and Sept. 1. Following the imposition of Chinese tariffs, China Petroleum & Chemical Corp, or Sinopec, petitioned Beijing for waivers on U.S. crude imports. Base Metals: Neutral. Included in the latest Chinese tit-for-tat tariff retaliations is a 5% tariff increase on copper scrap imports from the U.S., which takes the duty to 30%; the re-imposition of 25% tariffs on U.S. auto imports, and a 5% tariff on auto parts. The latter tariffs go into effect December 15, according to Fastmarkets MB. Precious Metals: Neutral. We are getting long platinum at tonight’s close, but with a tight stop of -10%, given highly volatile – and uncertain – trading markets. In addition to following the wake of safe-haven demand for gold, a physical deficit for platinum is possible.4 Markets have been well supported technically – bouncing off long-term support of ~ $785/oz dating to the depths of the Global Financial Crisis in 2008 – 09. Ags/Softs: Underweight. The USDA reported 57% of the U.S. corn crop is in good or excellent condition this week, vs. 68% a year ago. The Department also reported 55% of the soybean crop was in good or excellent shape vs. 66% last year at this time. Feature Iron ore price surged more than 38.1% y/y, while steel prices rallied in 1Q19 off their year-end 2018 lows, helped by the Central Committee fiscal stimulus directed at infrastructure and construction, which hit the market after the collapse of Vale’s Brumadinho dam in January (Chart 2). The combination of the fatal dam disaster and fiscal stimulus in China lifted prices for iron ore and steel sharply.5 Chart 2Iron Ore and Steel Rally Leaves Copper Behind
Iron Ore and Steel Rally Leaves Copper Behind
Iron Ore and Steel Rally Leaves Copper Behind
Chart 3China's Construction, Real Estate Investment Spur Higher Steel Demand
China's Construction, Real Estate Investment Spur Higher Steel Demand
China's Construction, Real Estate Investment Spur Higher Steel Demand
While policymakers guide domestic markets to expect reduced stimulus for the real-estate sector, we continue to expect copper demand to pick up in the short term. Our modeling indicates strong steel consumption presages higher copper consumption, especially when construction’s contribution is high (Chart 3). This is because the projects accounting for that consumption typically are fitted out with electrical wiring six months or so after the structures built with all that steel are made ready for residential or commercial use (Chart 4).6 This should support copper prices as we go through 2H19, although a slowdown in steel’s apparent consumption in 1Q19 followed by a rebound in April could make for a bumpy ride. CPC Central Committee guidance is stressing the need to get stimulus to the “real economy, such as privately-owned manufacturers and high-tech firms, which are the engines of long-term growth.”7 Still, while policymakers guide domestic markets to expect reduced stimulus for the real-estate sector, we continue to expect copper demand to pick up in the short term, as completed construction and infrastructure and projects in the pipeline from past stimulus are made ready for use.8 Chart 4Higher Steel Demand Normally Presages Higher Copper Demand
Higher Steel Demand Normally Presages Higher Copper Demand
Higher Steel Demand Normally Presages Higher Copper Demand
Copper Puzzle: Why Was It Left Behind? Part of the explanation for copper’s lackluster relative performance likely is USD-related: A strong dollar will reduce demand. Prices for iron ore and steel have come back to earth, following their impressive rallies this year. However, as Chart 2 illustrates, copper prices languished, and retreated to $2.50/lb on the COMEX. This, despite a contraction of physical copper concentrates supply, which kept copper treatment and refining charges (TC/RC) close to record lows, and inventories tight globally (Chart 5).9 Part of the explanation for copper’s lackluster relative performance likely is USD-related: A strong dollar will reduce demand (Chart 6).10 Our House view continues to expect the U.S. Fed to deliver a 25bp rate cut at its mid-September meeting. This could be followed by additional easing if Sino-U.S. trade tensions persist or get worse. Our House view expects Fed easing and a recovery in EM GDP growth will weaken the USD later this year. As iron ore shipments pick up from Brazil and Australia, we would expect pressure on those prices as the additional supply arrives at Chinese docks, and residential construction wanes (Chart 7). This should, in relative terms, mean copper outperforms iron ore, all else equal, since copper supplies and inventories are contracting. And, as construction spending moderates and winter restrictions on steel mills go into effect, we would expect copper to outperform steel. Chart 5Global Copper Inventories Remain Tight
Global Copper Inventories Remain Tight
Global Copper Inventories Remain Tight
Chart 6Strong USD Restrains Base Metal Demand
Strong USD Restrains Base Metal Demand
Strong USD Restrains Base Metal Demand
Chart 7China's Iron Ore Imports Remain Strong
China's Iron Ore Imports Remain Strong
China's Iron Ore Imports Remain Strong
Lastly, we would note from a technical perspective that copper has been – and remains – oversold (Chart 8). This could reflect the fact that, among base metals, it has the deepest liquidity, so that when hedgers or speculators are looking for a way to hedge trade-war risk vis-à-vis China – or to simply take a view on EM GDP prospects – copper is the preferred vehicle. It still is too early to wade into buying based on technicals, and, historically, copper has dipped further into oversold territory than where it now sits. But continued excursions into oversold territory will get our attention, and incline us to revisit our bullish bias. Chart 8Technically, Copper's Oversold
Technically, Copper's Oversold
Technically, Copper's Oversold
Trade War Deadweight The foregoing analysis suggests copper is due to rally. That is our expectation, at any rate. But uncertainty re the Sino-U.S. trade war and other exogenous policy issues – chiefly increasing recession risks arising from higher tariffs on Chinese imports to the U.S., a possible oil-price spike driven by military action in the Persian Gulf, and a disorderly Brexit – forces us to stand aside. Back in May, the N.Y. Fed conducted an analysis of U.S. President Donald Trump’s increase in tariff rates on $200 billion of Chinese imports from 10% to 25%.11 The N.Y. Fed estimated this increase in the tariff rates on that $200 billion would cost the average American household $831/yr, owing to a sharp increase in the deadweight loss arising from the increase. The deadweight loss estimated by the bank arising from tariff increase on the $200 billion of goods subject to the duty went from $132/household/year to $620/household/year. This means the total cost of the tariffs on the $200 billion of goods went from $414/household/year to $831/household/year. The N.Y. Fed notes: Economic theory tells us that deadweight losses tend to rise more than proportionally as tariffs rise because importers are induced to shift to ever more expensive sources of supply as the tariffs rise. Very high tariff rates can thereby cause tariff revenue to fall as buyers of imports stop purchasing imports from a targeted country and seek out imports from (less efficient) producers in other countries. The deadweight loss that comes from importers being forced to buy tariffed goods from higher-cost suppliers is, in other words, highly non-linear. This latest round of tariff increases is being levied on $550 billion of imports come September 1 and October 1. According to the Urban-Brookings Tax Policy Center, a Washington-based research joint-venture between the Urban Institute and the Brookings Institute, U.S. middle-class households earning $50k to $85k, received an average income tax cut of about $800 last year following passage of the 2017 Tax Cuts and Jobs Act (TCJA), which was signed in to law by President Trump December 22, 2017.12 Further increasing tariffs, as proposed, means the after-tax income of average U.S. households will contract, as the total cost of tariffs overwhelms the value of TCJA tax cuts for middle-income households, if they are imposed as scheduled. China's economy is struggling under the strain of the trade war, as it overlaps with President Xi’s reform and deleveraging campaign of 2017-18. While these campaigns have been postponed, the lingering effects are weighing on growth. In addition, banks and corporations appear to be backing away from taking on new risks. The state’s reflationary measures, including a big boost to local government spending, have so far been merely sufficient for domestic stability.12 Bottom Line: Fundamentals and technicals align to support copper prices. However, given the uncertainty surrounding the evolution of the Sino-U.S. trade war we are staying on the sidelines, and avoiding putting on a long position at present. Rising tariffs by the U.S. and China increases the risk of recession in both countries. Robert P. Ryan, Chief Commodity & Energy Strategist rryan@bcaresearch.com Footnotes 1 In Copper Will Benefit Most From Chinese Stimulus, published April 25, 2019, we noted China would deploy $300 billion (~ 2 trillion RMB) to support policymakers’ GDP growth targets this year. See also the June 2019 issue of Resources and Energy Quarterly, published by the Australian Government’s Department of Industry, Innovation and Science, particularly Section 3 beginning on p. 22. 2 We are referring to Knightian uncertainty here, a distinction developed by economist Frank Knight in his 1921 book "Risk, Uncertainty and Profit". Uncertainty in Knight’s sense refers to a risk that is “not susceptible to measurement,” per the MIT.edu reference above. This differs from the “risk” we routinely consider in this publication, which can be measured via implied volatilities in options markets. A pdf of the book can be downloaded at the St. Louis Fed’s FRASER website. 3 These odds were calculated by BCA Research’s Geopolitical Strategy group. For a discussion, please see our article entitled Expanded Sino – U.S. Trade War Could Be Bullish For Base Metals, published May 9, 2019. It is available at ces.bcaresearch.com. 4 This is not a certainty. In its PGM Market Report for May 2019, Johnson Matthey, the platinum-group metals refiner, forecast a slight physical platinum deficit this year of ~ 4MT, while Metals Focus expects a 20MT surplus. 5 The Australian Government DIIS report footnoted above (fn 1) states, “Production growth in China was driven by stimulatory government spending, which focused on higher infrastructure investment and boosting construction activity.” This is consistent with our framework for analyzing Chinese bulks (iron ore and steel) and base metals markets: Steel production and consumption are directed by the Communist Party of China (CPC) Central Committee, which motivates us to treat China’s steel market as a unified vertically integrated industry. Chinese steel production, accounts for ~ 50% of the global total. Its strong showing this year pushed world steel production up ~ 5% y/y in the first five months of this year, according to the DIIS. 6 In our modeling of copper prices, we lag steel apparent consumption by six months. 7 Please see Property sector cooling to help real economy funding, published by China Daily on August 1, 2019. 8 BCA Research’s China Investment Strategy noted, “The July Politburo statement signaled a greater willingness to stimulate the economy; as a result, we are penciling in a slightly more optimistic scenario on forthcoming credit growth through the remainder of the year, by adding 300 billion yuan of debt-to-bond swaps and 800 billion yuan of extra infrastructure spending to our baseline estimate for the rest of 2019. However, this would only add a credit impulse equivalent of 1 percentage point of nominal GDP and would only marginally reduce the probability of an earnings recession to 40%.” Please see Don’t Bottom-Fish Chinese Assets (Yet), published August 14, 2019. It is available at cis.bcaresearch.com. 9 The International Copper Study Group reported world mine production fell ~ 1% in the January – May 2019 period to ~ 8.3mm MT. Global refined copper production also was down ~ 1% to 9.8mm MT, while refined copper usage was down less than 1% over the same period. China’s refined usage – ~ 50% of world demand – was up 3.5%. 10 Our modeling indicates a 1% y/y increase in the broad trade-weighted USD translates into a 0.7% y/y decrease in the price of copper. Iron ore also is affected by USD levels, but price formation in this market is dominated by the overwhelming influence of Chinese demand on the seaborne iron-ore market, which accounts for close to 70% of global demand. For steel, China accounts for slightly more than half of global supply and demand, which somewhat insulates it from USD effects. 11 Please see New China Tariffs Increase Costs to U.S. Households, published by the N.Y. Fed May 23, 2019. 12 Please see Big Trouble In Greater China, a Special Report published by BCA Research's Geopolitical and China Investment strategies August 23, 2019. It is available at gps.bcaresearch.com. Investment Views and Themes Recommendations Strategic Recommendations Tactical Trades TRADE RECOMMENDATION PERFORMANCE IN 2019 Q2
Image
Commodity Prices and Plays Reference Table Trades Closed in 2019 Summary of Closed Trades
Image
Dear Client, We will not be publishing a report next week as we take an end-of-summer break. Our next report will be published on Tuesday, September 10th. Best regards, Robert Robis Highlights Canadian Corporates: The small but growing Canadian corporate bond market has delivered performance comparable to other developed market credit over the past decade, with less duration risk and higher average credit quality compared to the larger U.S. corporate debt market. Returns: Our new regression model for Canadian corporate bond excess returns is calling for modest positive gains for Canadian corporate debt over the next year. Corporate Health: Canadian companies’ financial health remains a positive for corporate bond returns on a cyclical basis, but high leverage and mediocre profitability are longer-term concerns. Allocation: We recommend overweight allocations into Canadian investment grade corporates, versus both Canadian government bonds and U.S. investment grade corporates. Amid elevated global policy uncertainty, favor the moderate spread volatility and attractive valuation in Canadian corporates. Feature Canadian corporate bonds do not get much attention from global fixed income investors due to the relatively small size of the market. Yet Canadian corporates have delivered returns in line with their global peers over the past decade, delivering an average excess return over Canadian government bonds (hedged into U.S. dollars) of 2.8% (Chart of the Week).
Chart 1
Looking ahead, Canadian corporates may present an opportunity for diversification in what is becoming an increasingly challenging environment for corporate bond investors, offering relatively higher yields and better credit quality with an economy that has held up well relative to the current weakening trend in global growth. In this Special Report, we outline the contours of the Canadian corporate bond market, assess the macroeconomic factors driving Canadian corporate bond returns, and survey the current overall financial health of Canadian companies. We also take a high-level look at the state of Canadian corporate debt at the sector level, while offering our recommendations on which ones to favor over the next 6-12 months. A Brief Overview
Chart 2
The bulk of outstanding Canadian corporate debt is rated investment grade (IG), but this represents only 5% of the global IG market (Chart 2), using the Bloomberg Barclays Global Corporates Index as a proxy.1 However, the total market capitalization of Canadian corporate bonds is 30% of Canadian GDP – a ratio as large as seen in other major developed countries like the U.S., U.K. and Switzerland (Chart 3). Like those other markets, Canadian companies have taken advantage of historically low borrowing rates and increased demand for income-generating assets to add leverage to their balance sheets.
Chart 3
On the demand side, Canadian corporates have traditionally been more of an institutional investment product, although domestic retail investor interest has picked up in recent years (mostly through mutual funds and exchange traded funds). The buy-and-hold nature of those local institutional investors reduces liquidity, particularly in comparison to the more widely-traded debt of Canadian federal and provincial governments. Yet according to a September 2018 Bank of Canada (BoC) report, domestic investor concerns over a perceived deterioration of Canadian corporate bond market liquidity appeared overstated.2 The report concluded that corporate bond market liquidity had generally been improving since 2010, with only short-lived bouts of illiquidity around events such as the 2011 European Debt Crisis and the 2014/15 collapse in oil prices. That medium-term improvement in liquidity was especially concentrated in high-grade corporate debt and bonds issued by banks, although the BoC concluded that liquidity and trading activity in low-grade and non-bank bonds have generally been stable. Issuance is dominated by financials, utilities, and energy companies. Unsurprisingly, the defensive utilities sector, which has high borrowing requirements, has been the top-performing industry group in 2019 (total return of +14% year-to-date) against a backdrop of falling bond yields and increased investor nervousness about future global growth (Chart 4). Yet all Canadian corporate bonds have generally performed well, with the overall Bloomberg Barclays Canadian Corporate Index delivering a total return of +8.2% so far in 2019, compared to 11.4% for Canadian equities and 5.6% for Canadian government bonds.
Chart 4
Canadian corporate credit spreads have been remarkably stable since the 2008 Global Financial Crisis. The overall index option-adjusted spread (OAS) has stayed in a range between 100-200bps, while both total and excess (duration-matched versus government debt) returns exhibiting fairly low volatility since 2008 (Chart 5). Canadian corporate credit spreads have been remarkably stable since the 2008 Global Financial Crisis. The overall index option-adjusted spread (OAS) has stayed in a range between 100-200bps, while both total and excess (duration-matched versus government debt) returns exhibiting fairly low volatility since 2008 The duration of the benchmark Canadian IG corporate index is now 6.4 years, well below the equivalent level for U.S IG (7.9 years) even though it has steadily increased over the past decade. Over that same period, the average credit quality has deteriorated, with 40% of the Canadian corporate index now rated BBB (Chart 6). This is below the BBB share seen in the U.S. (50%) and euro area (52%), though, making Canadian IG relatively less exposed to potential downgrades to junk bond status. Chart 5Low Volatility Of Spreads & Returns Since 2008
Low Volatility Of Spreads & Returns Since 2008
Low Volatility Of Spreads & Returns Since 2008
Chart 6Lower Share Of BBBs Compared To The U.S. & Europe
Lower Share Of BBBs Compared To The U.S. & Europe
Lower Share Of BBBs Compared To The U.S. & Europe
Bottom Line: The small but growing Canadian corporate bond market has delivered performance comparable to other developed market credit over the past decade, with less duration risk and higher average credit quality compared to the large U.S. corporate debt market. A Fundamental Model To Forecast Canadian Corporate Bond Returns In order to help forecast Canadian corporate bond performance, we have developed a factor-based regression model of Canadian IG excess returns (in local currency terms). We first determined the independent variables in the regression by compiling a list of potential drivers of bond returns which map to four factor groups: growth, inflation, financial variables, and other miscellaneous factors. After statistically testing those factors, the insignificant and unrelated ones were dropped. The final result of this analysis is shown in Table 1. Table 1Regression Details Of The Fundamental Canadian Corporate Bond Return Model
The Great White North: A Framework For Analyzing Canadian Corporate Bonds
The Great White North: A Framework For Analyzing Canadian Corporate Bonds
We concluded that five variables explain the bulk of Canadian corporate bond returns: the annual percentage change in oil prices (using the Canadian benchmark, Western Canadian Select), non-residential fixed investment growth, the M3 measure of money supply growth, the Canadian dollar trade-weighted index (CAD TWI), and the level of Canadian industrial capacity utilization. We concluded that five variables explain the bulk of Canadian corporate bond returns: the annual percentage change in oil prices (using the Canadian benchmark, Western Canadian Select), non-residential fixed investment growth, the M3 measure of money supply growth, the Canadian dollar trade-weighted index (CAD TWI), and the level of Canadian industrial capacity utilization. Chart 7A Fundamental Model Of Canadian Corporate Bond Returns
A Fundamental Model Of Canadian Corporate Bond Returns
A Fundamental Model Of Canadian Corporate Bond Returns
Looking at recent excess return history (Chart 7), it is not surprising that oil prices significantly affect returns given the importance of Canada’s energy sector to the overall Canadian economy. Moreover, growth in non-residential fixed asset investment also positively influences excess returns as faster capital spending can potentially increase the profitability of Canadian firms. In contrast, the inflation factors - money supply and capacity utilization – are detrimental to returns. Increases in both of those factors can result in higher inflation and rising bond yields as the BoC is forced to tighten monetary policy, which often results in rising risk premiums and wider corporate credit spreads (falling excess returns). Finally, the CAD TWI is (weakly) positively correlated to corporate bond excess returns. A stronger currency is a reflection of a strong domestic economy, but it also helps lower imported input costs for Canadian companies – both of which boost corporate profits and corporate bond returns. We now turn to the outlook for these factors over the next 6-12 months, which remain generally supportive for moderate positive excess returns for Canadian corporates: Oil prices: BCA’s commodity strategists expect global oil prices to increase moderately over the next year as global inventory drawdowns outpace expectations (Iran sanctions, Venezuela production collapsing and OPEC 2.0 production discipline are likely sources of supply restraint). In addition, if global growth starts to rebound from the end of this year, as we expect, oil demand will also rise. Non-residential fixed investment: According to the BoC’s most recent Business Outlook Survey of Canadian companies, investment spending plans of firms remain healthy – although that survey was taken at the end of June before the latest increase in uncertainty over global trade and economic growth.3 Moreover, relatively easy credit conditions have made it easier for firms to finance capex. Therefore, our baseline scenario is still to expect moderate growth in non-residential fixed capital investment, although risks are to the downside given the global macro uncertainties. Money supply: The most recent reading of the annual growth of Canadian M3 from June was a solid +7.5%. The BoC is expected to maintain an accommodative monetary policy stance, keeping the current policy rate on hold until the end of 2020. Therefore, money supply growth is likely to remain firm – a negative for Canadian corporate bond returns in our model, although perhaps less so than in the past since rapid money growth will not generate the same type of monetary tightening response from the BoC. Capacity utilization: The Canadian capacity utilization rate is currently at 81%, a meaningful pullback from the 84% level seen in early 2018. According to the latest BoC Monetary Policy Report, the Canadian economy is operating below potential (the output gap in Q1 was estimated to be between -1.25% to -0.25% of potential GDP) and that gap is only expected to close over the next two years. Thus, capacity utilization is not expected to have a major impact on corporate excess returns over the next 6-12 months. Canadian Dollar: The CAD TWI has shown no change over the past year, and will likely remain near current levels in the short term. Although we do not expect the BoC to cut interest rates as much as currently discounted by markets (-40bps over the next twelve months), Canadian monetary policy will still remain accommodative and will likely keep the CAD relatively soft until global manufacturing growth and trade activity stabilize and begin to revive. The CAD is likely to be a neutral factor for Canadian corporate returns over the next year. Bottom Line: Our new regression model for Canadian corporate bond excess returns is calling for modest positive gains for Canadian corporate debt over the next year. Canadian Corporate Balance Sheet Health: OK For Now, But At Risk If The Economy Weakens Chart 8The BCA Canadian Corporate Health Monitors
The BCA Canadian Corporate Health Monitors
The BCA Canadian Corporate Health Monitors
Regular readers of our work will be familiar with our Corporate Health Monitor (CHM) framework. In this approach, we combine financial ratios that are most important for corporate creditworthiness of the entire non-financial corporate sector of a given country into a summary indicator that is designed to track corporate credit spreads. We introduced a Canadian CHM in April 2018, both using top-down national accounts data and aggregated bottom-up ratios from actual company financial statements.4 The latest reading from our top-down and bottom-up Canadian CHMs suggest that the overall health of Canadian corporates is decent, with the CHMs both below the zero line (Chart 8).5 Digging into the individual ratios, however, does reveal some potential signs of future weakness. Leverage is relatively high, while profitability metrics and interest coverage ratios are at the low end of the historical range. However, in our CHM framework, how the latest data compares to the medium-term trend – rather than the absolute level of the ratios - is most relevant for corporate bond performance. On that front, the latest data points for the CHM ratios do represent modest improvements versus the levels seen in 2014 and 2015, which is why our CHMs remain in the “improving health” zone. The more cyclically-driven ratios (profit margins, return on capital, interest coverage) declined amid the sharp plunge in Canadian economic growth at the end of 2018. However, given the recent reacceleration visible in some Canadian economic data, those cyclically-driven ratios may end up showing signs of stabilization, if not improvement, once the underlying CHM data for Q2/2019 and Q3/2019 are available. Looking ahead, Canadian corporate debt would be vulnerable to spread widening (rising risk premiums) in the event of a sustained slowing of the Canadian economy, given the poor absolute levels of the CHM component ratios. With the BoC maintaining an accommodative monetary policy stance, however, and the Canadian economy likely to continue growing at a trend-like pace supported by consumer spending, we think the backdrop will remain conducive to credit spread stability in Canada over the next 6-12 months. With the BoC maintaining an accommodative monetary policy stance, however, and the Canadian economy likely to continue growing at a trend-like pace supported by consumer spending, we think the backdrop will remain conducive to credit spread stability in Canada over the next 6-12 months. Bottom Line: The financial health of Canadian companies remains a positive for corporate bond returns on a cyclical basis, but there are longer-term concerns given high leverage and mediocre profitability. Canadian Corporate Bond Sector Valuation For IG corporate sectors in the U.S., euro area and the U.K., we utilize a relative value framework to rank credit spreads within the benchmark corporate universe. We can apply that same approach to assess valuations of Canadian corporate bond sectors. In our sector relative value model, the “fair value” option-adjusted spread (OAS) for each sector within the Bloomberg Barclays Canadian IG Corporate index is estimated based on a panel regression. The explanatory variables in the regression are the modified duration, convexity and credit rating of each industry sub-sector within the index. The regression produces a set of common coefficients for all sectors that can be used to estimate a fair value OAS for each industry group as a function of its own interest rate duration, convexity and credit quality – all important drivers of corporate bond returns. The Risk-Adjusted Valuation is the difference between each sector’s current OAS and the model estimate of the sector’s fair value OAS. A positive Risk-Adjusted Valuation implies undervaluation for the sector in question, and a negative reading implies overvaluation. Table 2 shows the recommended positioning of the Canadian IG industry sectors based on our relative value model. Sectors with positive Risk-Adjusted Valuations have overweight allocations versus the benchmark, with the opposite holds true for sectors with negative valuations. Sectors with spreads that are very close to fair value (within a range of +5bps to -5bps) have only a neutral recommended weighting versus the benchmark. Table 2Canada Investment Grade Corporate Bond Aggregate: Sector Relative Valuation*
The Great White North: A Framework For Analyzing Canadian Corporate Bonds
The Great White North: A Framework For Analyzing Canadian Corporate Bonds
Chart 9 depicts the risk/reward tradeoff between the valuation metric and the riskiness of each sector as measured by its duration-times-spread (DTS). Valuation is measured along the vertical axis of the chart, while DTS is measured along the horizontal axis. Sectors with higher DTS exhibit greater excess return volatility and are thus riskier.
Chart 9
In the current environment of heightened uncertainty and slowing global growth, but with the BoC and other global central banks responding with a more dovish monetary policy stance, targeting cheap sectors that are less risky (i.e. DTS scores close to or below the average DTS of all sectors) is a prudent strategy. Those would be sectors that appear in the upper left quadrant of Chart 9, like Metals & Mining, Finance Companies and Office REITs. Chart 10Positive Support For Canadian Consumer Cyclicals
Positive Support For Canadian Consumer Cyclicals
Positive Support For Canadian Consumer Cyclicals
We also see a case for overweighting the cheap Consumer Cyclical Services sector, even with a DTS that is modestly higher than the overall index, given the continued strength in the Canadian labor market which supports consumer confidence through rising earning power (Chart 10). Recommended underweights are in the bottom right quadrant of Chart 9, with expensive valuations and high DTS scores, like Utilities: Natural Gas, Utilities: Electric, Supermarkets and Food & Beverage. Bottom Line: Favor Canadian corporate bond sectors with cheap valuations and spread volatility close to that of the overall benchmark index. Investment Conclusions Chart 11Canadian Corporates Outperformance Vs U.S. Will Continue
Canadian Corporates Outperformance Vs U.S. Will Continue
Canadian Corporates Outperformance Vs U.S. Will Continue
Canadian IG corporates now offer a potential opportunity to diversify corporate bond exposure away from the larger markets in the U.S. and Europe. The Canadian economy remains resilient despite slowing global growth, while the fundamental drivers of Canadian corporate bond returns are stabilizing or even improving. At the same time, the economic weakness abroad and heightened trade/political uncertainty will ensure that the BoC maintains an accommodative monetary stance over the next 6-12 months. That is not to say that Canadian corporates are not without risk. Canada is not a low-beta market - spreads do widen during “risk-off” periods in global financial markets. Also, underlying Canadian corporate credit fundamentals look poor on a long-term basis; Canadian private sector debt levels are high (especially for households); and the export-intensive Canadian economy is vulnerable to any incremental deceleration of global growth in particular, and the US more specifically. Yet as a relative value trade versus the much larger corporate bond market to the south, Canadian corporates are well positioned to continue their recent bout of outperformance versus U.S. equivalents over the next 6-12 months, for the following reasons (Chart 11): While markets are priced for rate cuts from both the Fed and the BoC, the starting point for monetary conditions is easier in Canada than in the U.S. given the much weaker level of the Canadian dollar compared to the U.S. dollar. There is a wide gap between the corporate credit fundamentals in Canada and the U.S. according to our top-down Corporate Health Monitors for both countries, such that Canadian balance sheets are more robust. There is a wide gap between the corporate credit fundamentals in Canada and the U.S. according to our top-down Corporate Health Monitors for both countries, such that Canadian balance sheets are more robust. Bottom Line: We recommend that domestic Canadian investors continue to stay overweight Canadian corporates versus Canadian government bonds, while keeping an overall level of spread risk close to benchmark. Global credit investors that have access to the Canadian corporate bond market should consider allocations out of U.S. investment grade corporates into Canadian equivalents. Ray Park, CFA, Research Analyst ray@bcaresearch.com Robert Robis, CFA, Chief Fixed Income Strategist rrobis@bcaresearch.com Footnotes 1 Throughout this report, we solely use data on Canadian corporate debt from the Bloomberg Barclays bond indices, which is the main index data we use in all our global bond research. Comprehensive data is also available from other providers such as FTSE Russell and S&P Global. 2 Bank of Canada September 2018 Staff Analytical Note 2018-31, “Have Liquidity and Trading Activity in the Canadian Corporate Bond Market Deteriorated?” 3 https://www.bankofcanada.ca/2019/06/business-outlook-survey-summer-2019/ 4 Please see BCA Global Fixed Income Strategy Weekly Report, “BCA Corporate Health Monitor Chartbook Update: Growth Is Papering Over The Cracks”, dated April 24, 2018, available at gfis.bcaresearch.com 5 A CHM below zero implies improving financial health, while a CHM above zero indicates deteriorating financial health. Thus, the direction of the CHM is designed to be positively correlated with corporate credit spreads.
Short Circuited
Short Circuited
Underweight BCA U.S. Equity Strategy’s electrical components & equipment (EC&E) three-factor earnings model did an excellent job in anticipating the recent breakdown in the S&P EC&E index (top & bottom panels). First, the trade-weighted dollar has broken out to fresh cyclical highs. Historically, relative share prices and the greenback are tightly inversely correlated and the current weak global growth message that the U.S. dollar is emitting is bearish for the S&P EC&E index (U.S. dollar shown inverted, second panel). This global growth soft patch is not only negative for new orders owing to deficient foreign demand, but the appreciating currency also makes EC&E exports less competitive in the global market place (U.S. dollar shown inverted, third panel). For details on the other two driver’s behind our bearish S&P EC&E index stance, please refer to our most recent Weekly Report. Bottom Line: We reiterate our underweight recommendation for the S&P EC&E index. The ticker symbols for the stocks in the index are: BLBG: S5ELCO – AME, EMR, ETN, ROK.
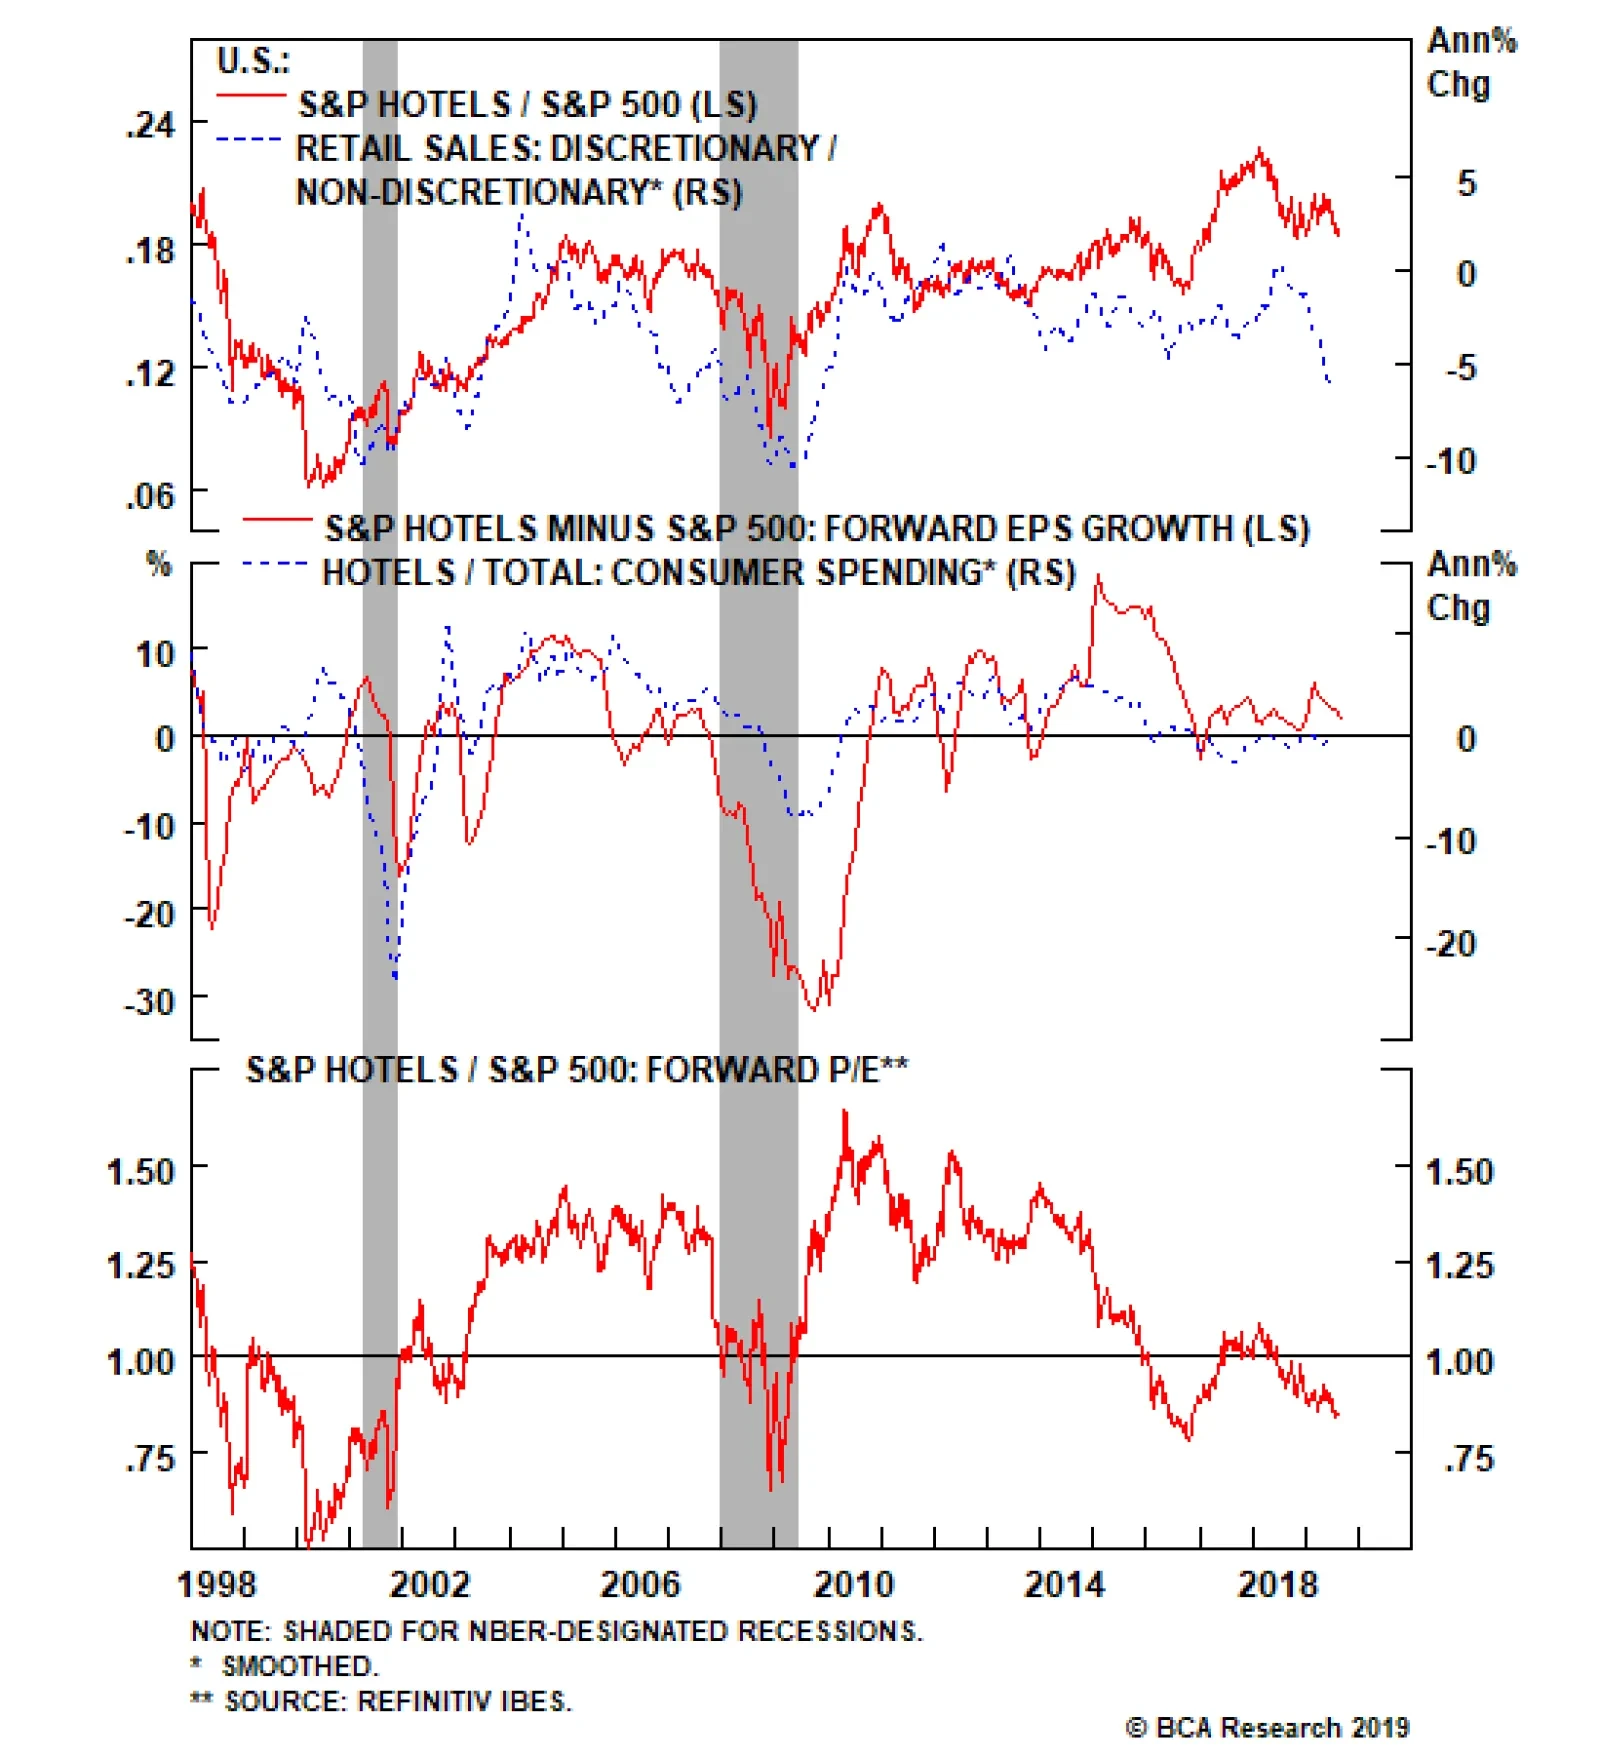
Highlights Portfolio Strategy The sustained global growth slowdown, widening junk spreads, along with the risk of a U.S. recession becoming a self-fulfilling prophecy suggest that caution is still warranted in the broad equity market on a 3-12 month time horizon. Weakening consumer sentiment, softening hotel industry operating metrics that point to a margin squeeze, anemic relative outlays on lodging and a decelerating ISM non-manufacturing index, all signal that more pain lies ahead for the S&P hotels, resorts & cruise lines index. Waning industry operating metrics, a bearish signal from our EPS growth model along with the mighty U.S. dollar warns against bottom fishing in the S&P electrical components & equipment (EC&E) index. Recent Changes There are no changes to the portfolio this week. Table 1
Elusive Growth
Elusive Growth
Feature The S&P 500 traded in an uncharacteristically tight range last week before falling apart on Friday on the back of a re-escalation in the U.S./China trade war. Worries of recession also resurfaced. Not only did the MARKIT flash manufacturing PMI break below the 50 expansion/contraction line, but it also pulled down the MARKIT flash services PMI survey that barely held above the boom/bust line. Adding insult to injury, the 10/2 yield curve slope inverted anew last week further fanning these recession fears. Worrisomely, consumer sentiment took a hit recently according to the University of Michigan survey (top panel, Chart 1). Importantly, what caught our attention was the following commentary: “The main takeaway for consumers from the first cut in interest rates in a decade was to increase apprehensions about a possible recession. Consumers concluded, following the Fed’s lead, that they may need to reduce spending in anticipation of a potential recession.” While the consumer is the last and most significant pillar standing for the U.S. economy, reflexivity may spoil the party and a recession may become a self-fulfilling prophecy. This is the message the bond market is sending and it is warning that the path of least resistance is a lot lower for stocks (bottom panel, Chart 1). Chart 1“The First Cut Is The Deepest”
“The First Cut Is The Deepest”
“The First Cut Is The Deepest”
Economists are also downgrading their U.S. real GDP growth estimates and that forecast now stands at 2.3% for the current year according to Bloomberg. While the recession alarm bells are not sounding off, these downward revisions bode ill for stocks (Chart 2) Chart 2Watch Out Down Below
Watch Out Down Below
Watch Out Down Below
Moving to another part of the fixed income market, stress is slowly building in the high yield market especially given the recent tick up in bankruptcies and the blind sides that cove-lite loans now pose to bond investors. As a reminder, the U.S. high yield option adjusted spread (OAS) troughed last September and continues to emit a distress signal for the broad equity market (junk OAS shown inverted, top panel, Chart 3). Chart 3Mind The Gaps
Mind The Gaps
Mind The Gaps
With regard to global growth, it is still missing in action, and given that Dr. Copper is on the verge of a breakdown, a global growth recovery is a Q1/2020 story at the earliest. This week we update a consumer discretionary subindex and also highlight an industrials sector subgroup. Chart 4SPX: The Next Shoe To Drop?
SPX: The Next Shoe To Drop?
SPX: The Next Shoe To Drop?
Chart 5Risk To View
Risk To View
Risk To View
Other financial market variables concur that global growth is elusive. J.P. Morgan’s EM FX index has broken down and EM equities are also hanging from a thread. The EM high yield OAS has broken out signaling that the risk off phase has yet to fully run its course (EM junk OAS shown inverted, bottom panel, Chart 4). Finally, there is a short-term risk to our cautious equity market view. Indiscriminate buying in U.S. Treasurys has now pushed the 10-year yield down almost 180bps from last November’s peak deeply in overvalued territory. While such a move is not unprecedented, buying may be exhausted and in need of at least a short-term breather (Chart 5). Netting it all out, the sustained global growth slowdown, widening junk spreads, along with the risk of a U.S. recession becoming a self-fulfilling prophecy suggest that caution is still warranted in the broad equity market on a 3-12 month time horizon. As a reminder, this is U.S. Equity Strategy’s view, which contrasts BCA’s sanguine equity market house view. This week we update a consumer discretionary subindex and also highlight an industrials sector subgroup. Empty Spaces When the consumer is worried about a possible recession as the latest survey revealed, the knee jerk reaction is to tighten the purse strings and marginally retrench. The latest University of Michigan consumer sentiment survey made for grim reading and such souring in confidence will continue to weigh on lodging equities (Chart 6). As a result, we remain underweight the niche S&P hotels, resorts & cruise lines consumer discretionary subgroup. When the consumer is worried about a possible recession as the latest survey revealed, the knee jerk reaction is to tighten the purse strings and marginally retrench. Chart 6Stay Checked Out Of Hotels
Stay Checked Out Of Hotels
Stay Checked Out Of Hotels
Already discretionary retail sales have taken the back seat and non-discretionary retail sales are in the driver’s seat. In fact, the top panel of Chart 7 shows that the relative retail sales backdrop has plunged to levels last seen during the GFC, warning that relative share prices have ample room to fall. Drilling deeper in the consumption data is instructive. Lodging outlays are decelerating and are also trailing overall PCE. The implication is that relative profits will likely underwhelm sustaining the 18-month long de-rating phase (middle & bottom panels, Chart 7). On the operating front the news is equally dour. While selling prices are expanding, the relentless construction binge will lead to a mean reversion sooner rather than later (bottom panel, Chart 8). Chart 7De-rating Phase To Gain Steam
De-rating Phase To Gain Steam
De-rating Phase To Gain Steam
Chart 8Margin Squeeze Looming
Margin Squeeze Looming
Margin Squeeze Looming
Tack on the ongoing assault from the new sharing economy unicorns like Airbnb, and industry pricing power will remain in check in coming quarters. Similarly, the ISM non-manufacturing price subcomponent is warning that a deflation scare is looming in the lodging industry (second panel, Chart 8). Not only are selling prices under attack, but also labor-related input costs are on fire. The sector’s wage inflation is climbing at a 3.9%/annum pace or roughly 120bps higher that the overall employment cost index (third panel, Chart 8). Taken together, there are high odds that a profit margin squeeze will weigh on profits and on relative share prices (top panel, Chart 8). Importantly, the overall ISM services survey best encapsulates the bearish backdrop of the S&P hotels, resorts & cruise lines index. Historically, relative share prices have been moving in tandem with the ISM non-manufacturing survey and the current message is that selling pressures on relative share prices will persist in the coming months (Chart 9). Chart 9Heed The Message From The ISM Services Survey
Heed The Message From The ISM Services Survey
Heed The Message From The ISM Services Survey
In sum, weakening consumer sentiment, softening hotel industry operating metrics that point to a margin squeeze, anemic relative outlays on lodging and a decelerating ISM non-manufacturing index signal that more pain lies ahead for the S&P hotels, resorts & cruise lines index. Bottom Line: Continue to avoid the S&P hotels, resorts & cruise lines index. The ticker symbols for the stocks in this index are: BLBG: S5HOTL – MAR, HLT, RCL, CCL, NCLH. Short Circuited The S&P EC&E index broke down recently (top panel, Chart 10) and we reiterate our underweight recommendation in this industrials sector subgroup. While it is tempting to bottom fish here especially given oversold technical and bombed out valuations (bottom panel, Chart 11), a number of the indicators we track suggest that more losses are around the corner. Chart 10Sell The Weakness
Sell The Weakness
Sell The Weakness
Chart 11Good Reasons For Valuation Discount
Good Reasons For Valuation Discount
Good Reasons For Valuation Discount
First the trade-weighted dollar has broken out to fresh cyclical highs despite the collapse in the 10-year yield. Historically, relative share prices and the greenback are tightly inversely correlated and the current weak global growth message the U.S. dollar is emitting is bearish for the S&P EC&E index (U.S. dollar shown inverted, middle panel, Chart 10). This global growth soft patch is not only negative for new orders owing to deficient foreign demand, but the appreciating currency also makes EC&E exports less competitive in the global market place (U.S. dollar shown inverted, bottom panel, Chart 10). Second, while industry new orders have been resilient, the massive inventory buildup dwarfs new order growth and warns that a deflationary liquidation phase is looming (middle panel, Chart 11). In fact, the recent drubbing in the ISM manufacturing prices paid subcomponent portends a deflationary industry phase (third panel, Chart 12). Adding it all up, waning industry operating metrics, a bearish signal from our EPS growth model along with the mighty U.S. dollar warns against bottom fishing in the S&P EC&E index. Other operating metrics are also warning that EC&E profits will underwhelm. Industry weekly hours worked have plunged and sell-side analysts have been aggressively cutting EPS estimates (bottom panel, Chart 13). On the productivity front, executives have not adjusted labor cost structures to lower running rates yet (second panel, Chart 13) and, thus, our EC&E productivity gauge (industrials production versus employment) is contracting which bodes ill for industry earnings (third panel, Chart 13). Chart 12Weak Profit Backdrop
Weak Profit Backdrop
Weak Profit Backdrop
Chart 13Deteriorating Operating Metrics
Deteriorating Operating Metrics
Deteriorating Operating Metrics
Finally, our S&P EC&E EPS growth model does an excellent job in encapsulating all these moving parts and is signaling that the path of least resistance is lower for EPS growth in the coming months (bottom panel, Chart 12). Adding it all up, waning industry operating metrics, a bearish signal from our EPS growth model along with the mighty U.S. dollar warns against bottom fishing in the S&P EC&E index. Bottom Line: Stay underweight the S&P EC&E index. BLBG: S5ELCO – AME, EMR, ETN, ROK. Anastasios Avgeriou, U.S. Equity Strategist anastasios@bcaresearch.com Current Recommendations Current Trades Size And Style Views Favor value over growth Favor large over small caps
Highlights Sovereign bond yields have cratered over the last few months, … : Over the last three months, 10-year yields in the U.S., France, Germany, Switzerland and Australia have fallen by 71, 64, 53, 54, and 67 basis points, respectively. … and the Treasury curve has experienced a significant bull flattening, … : Month-to-date total returns for the Barclays Bloomberg Long, Intermediate and 1-3-Year Treasury Indexes are 9.2%, 1.6% and 1.1%, respectively. … indicating that the bond market thinks more rate cuts are in store: The textbook interpretation of an inverted curve is that monetary policy is too tight and needs to be loosened, but technical factors have amplified the flattening pressure. Is the bond market reacting to weakening growth prospects, or uber-dovish central banks?: The answer has implications well beyond the fixed-income universe. It could mean the difference between an economic slowdown and a market melt-up. Feature BCA researchers convened last week for our monthly View Meeting, much of which was given over to the global decline in sovereign bond yields. Does their plunge owe more to weakening growth prospects or central banks’ synchronized dovish pivot? There have surely been elements of both; after all, central banks wouldn’t be so dovish if they weren’t concerned about the growth outlook. It is clear to our fixed-income strategists that the yield move has overshot the data, however, and they mainly attribute the overshoot to monetary policy. No central bank wants a stronger currency while confronting a demand deficiency aggravated by trade tensions and a global manufacturing slowdown. The New York Times Business section put the prevailing policy winds into living color in a nearly full-page, four-column graphic spotlighting the 32 central banks that have cut their policy rate so far this year.1 The pell-mell rush to cut rates is emblematic of a global scramble for competitiveness. No central bank wants its economy to be caught without a buffer while other economies are busily reinforcing theirs. The Message From The Bond Market Trade tensions are a legitimate threat to global economic growth already challenged by a downswing in the global manufacturing cycle. A recession is a possibility, but it is hardly a foregone conclusion. We agree with our fixed-income colleagues that the yield selloff has overrun the economic fundamentals. Last week’s preliminary European manufacturing PMIs suggested that manufacturing may finally be stabilizing, and there is still no evidence that the manufacturing downturn has infected the services sector (Chart 1). A recession is hardly a foregone conclusion. 10-year Treasury yields have been falling sharply since their 3.25% peak in early November, and the current leg down is the third in a series of sharp declines (Chart 2, top panel). Global sovereign yields have followed the same pattern (Chart 2, bottom panel), but the latest plunge is as much a reflection of ubiquitous easing biases as it is of new concerns about economic weakness. That may sound like a minor point, of interest only to macro specialists, but it has import for all investors. If the yield decline isn’t signaling new softness, then easier financial conditions will be free to act as a tailwind for risk assets. Chart 1Services Are Holding Up ...
Services Are Holding Up ...
Services Are Holding Up ...
Chart 2A Brief Inversion ... But Yields Are Freefalling
A Brief Inversion ... But Yields Are Freefalling
A Brief Inversion ... But Yields Are Freefalling
Neither investment-grade (Chart 3, top panel) nor high-yield corporate bond spreads evince any particular concern about the economy (Chart 3, bottom panel). Although they’ve ticked up, they remain near the bottom of their post-crisis range, and are nowhere near the levels they reached in 2011-12, during the federal budget showdown/U.S. downgrade and the flare-up of the Eurozone crisis, or in 2015-16, during the last manufacturing recession. With banks still easing lending standards for corporate and industrial borrowers (Chart 4), spreads won’t undergo a systematic widening. Borrowers do not default as long as there is a lender willing to roll over their maturing obligations, so tighter credit standards are a precondition for spread-widening cycles. Chart 3No Sign Of Stress Among Corporate Borrowers ...
No Sign Of Stress Among Corporate Borrowers ...
No Sign Of Stress Among Corporate Borrowers ...
Chart 4... And Banks Aren't Applying Any Pressure
... And Banks Aren't Applying Any Pressure
... And Banks Aren't Applying Any Pressure
The Message From The Housing Market Chart 5Lower Rates Have Yet To Impact Housing ...
Lower Rates Have Yet To Impact Housing ...
Lower Rates Have Yet To Impact Housing ...
We have been disappointed by residential investment’s muted response to the significant year-to-date decline in mortgage rates (Chart 5, bottom panel). The trajectory of starts and permits (Chart 5, top panel) hasn’t changed, new and existing home sales haven’t perked up (Chart 5, second panel), and mortgage purchase applications (Chart 5, third panel) appear not to have heard the news that rates are much lower. We thought that the swift fall in mortgage rates would promote more residential investment than it has to date. There is a difference, however, between disappointing growth and a full-on contraction. With affordability remaining high relative to history (Chart 6), and apartment rents exceeding monthly mortgage payments in several locales (Chart 7), housing demand should remain well supported. There are no excesses in the housing market in terms of inventory or oncoming supply that would make housing a source of economic or financial instability. Inventory relative to the number of households is bumping around its all-time lows (Chart 8), and cumulative household formations have easily outstripped housing starts since the crisis broke (Chart 9). Structural factors like a lack of supply geared to first-time and first-move-up buyers, and the ravenous appetite of pools of capital purchasing single-family homes for rent, are squeezing out some would-be buyers, but housing is not about to induce a recession. There are plenty of things for investors to be concerned about, but the housing market isn’t one of them. Chart 6... Though They Have Placed Homeownership In Easier Reach
... Though They Have Placed Homeownership In Easier Reach
... Though They Have Placed Homeownership In Easier Reach
Chart 7
Chart 8... Inventories Are At Record Lows, ...
... Inventories Are At Record Lows, ...
... Inventories Are At Record Lows, ...
Chart 9
The View From Broad And Wall We concede that stocks are not behaving as if all is well. Big daily swings are not a feature of healthy markets, and eight of this month’s sixteen sessions have registered moves of at least 1%. The second quarter’s 3% year-over-year earnings growth is three percentage points better than the consensus expected when earnings season kicked off, however, and despite the single-day moves, the S&P 500 has spent all but the first day of the month in a well-defined range between 2,825 and 2,945 (Chart 10). The market may be jumpy from one day to the next, but investors have not been concerned enough to engage in sustained selling.
Chart 10
The equity market’s verdict on housing is more optimistic than ours. Inspired by earnings reports, the S&P 1500 Homebuilders Index have broken out to a new 52-week high (Chart 11). Retailers were the stars of last week’s earnings releases, with Lowe’s, Nordstrom and Target posting double-digit percentage gains after reporting numbers that failed to live up to investors’ worst fears. Equities are validating the view that the U.S. consumer is alive and kicking. Chart 11Homebuilder Stocks Have Broken Out
Homebuilder Stocks Have Broken Out
Homebuilder Stocks Have Broken Out
The GDP Outlook Chart 12Capex Intentions: Elevated But Slipping
Capex Intentions: Elevated But Slipping
Capex Intentions: Elevated But Slipping
If consumers are well positioned, the U.S. economy should be, too. Consumption accounts for two-thirds of the U.S. economy, with investment and government spending equally dividing the other third. Federal expenditures amount to about 40% of government spending, and between this year’s fiscal thrust and next year’s hotly contested presidential election, D.C. can be counted upon to do its part for the economy. At the state and local level, healthy household income should support state sales and income tax receipts, while still-rising home prices will provide the property taxes to keep municipal coffers full. That leaves fixed asset investment as the economy’s Achilles heel. We are confident, as noted above, that residential investment will not decline enough to pose a problem for the economy, but corporate investment is in the crosshairs of the uncertainty surrounding the multiple trade squabbles. The NFIB survey and the regional Fed surveys indicate that capital expenditure plans are rolling over, even if they remain at a fairly high level (Chart 12). Our base case remains that investment will not fall enough to offset robust consumption and trend-level government spending, but a marked worsening in trade tensions could erode business confidence enough to drag the economy below stall speed. Busted Thesis In our mutual-fund days, we followed one rule without exception. If our thesis for owning a stock was disproved, we got rid of the stock without a backward glance. We no longer manage money, but our clients do, and we try to set a good example, especially in the inevitable instances when things go wrong. We are closing out our agency mREIT recommendation on the ground that we got the rates call underpinning it very wrong. Things went wrong with our agency mortgage REIT recommendation right from the get-go. In retrospect, we should have waited until the FOMC meeting dust settled before putting on a curve-dependent position. We are closing it out now, though, because we recommended the group in anticipation of a steeper yield curve. Given that we think it will take some time for investors to become convinced that a recession is not imminent, and given that mechanical factors may push yields even lower, we do not expect sustained curve steepening for several months. Although we only held it for four weeks, the recommendation left a mark. Through Thursday’s close, our defined subset of agency mREITs lost 11%, while the S&P 500 is down 3.1% and the Barclays High Yield Index is flat. We’re taking our medicine and moving on, but we will take another look at the group when the curve eventually does begin to steepen. Investment Implications Even if recession fears are overblown, as we and a majority of our colleagues believe, it will likely take some time for investors to overcome their concerns. That leads us to believe that equities may be unable to make new highs in the near term, and that Treasury yields have more downside risk than upside risk in the next few months, as rising convexity2 compels investors following asset-liability management strategies to seek out long-maturity bonds. The yield point may sound complex and esoteric, but our Global Fixed Income Strategy team increasingly believes it’s a key to understanding the negative-yield phenomenon and is researching the issue for an upcoming Special Report. Monetary accommodation is not a silver bullet. If the economy has already flipped from expansion to contraction, modest rate cuts parceled out at a deliberate pace will be insufficient to turn things around, and equities and spread product will suffer. If the expansion remains intact, however, rate cuts will help shore up the economy at the margin and quite possibly fuel a new phase of the bull markets in risk assets. Our money is on the latter, and we expect that this bull cycle has one more burst in it that will allow it to sprint to the finish line like the majority of its predecessors. Doug Peta, CFA Chief U.S. Investment Strategist dougp@bcaresearch.com Footnotes 1 Smialek, Jeanna and Russell, Karl, “Rates Are Falling Again. That May Be Dangerous.” New York Times, August 17, 2019, p. B1. 2 Duration measures a bond’s sensitivity to changes in interest rates. Convexity measures duration’s sensitivity to changes in interest rates, which increases as rates fall. Investors like life insurers and pension funds, who match the duration of their investment portfolios with the duration of their liabilities, are forced to increase the duration of their bond holdings at an increasing rate as interest rates fall.