Sectors

Add Shiny Metal Exposure
Add Shiny Metal Exposure
One way to benefit from the global growth soft-patch is to go long global gold miners/short S&P oil & gas E&P stocks on a tactical three-to-six month basis. Since our Monday inception three days ago, this pair trade is already up 9%. The relative moves in the underlying commodities that serve as pricing power proxies are the key drivers of this share price ratio (top panel). Given the massive currency debasement potential that has gripped Central Banks the world over, such a flush liquidity backdrop will boost the allure of the shiny metal more so than crude oil. Meanwhile, global manufacturing PMIs are foreshadowing recession and our diffusion index has plummeted to the lowest level since 2011 (diffusion shown inverted, middle panel). In the U.S. specifically there is a growth-to-liquidity handoff and the ISM manufacturing survey’s new order versus prices paid subcomponents confirms that global gold miners have the upper hand compared with E&P equities (bottom panel). Bottom Line: We initiated a tactical long global gold miners/short S&P oil & gas E&P pair trade on a three-to-six month time horizon with a stop at the -10% mark. The ticker symbols for the stocks in these indexes are: GDX:US and BLBG – S5OILP – COP, EOG, APC, PXD, CXO, FANG, HES, DVN, MRO, NBL, COG, APA, XEC, respectively. Please refer to this Monday’s Weekly Report for additional details.
Highlights Analysis on Brazil is available below. If banks in China are forced by regulators to properly recognize and provision for non-performing assets, large banks would become substantially undercapitalized while many small- and medium-sized banks (SMBs) would have little equity capital left. That would hammer their ability to finance the economy. Provided on aggregate SMBs have actually outgrown larger ones in terms of balance sheet size, the precarious state of the former’s financial health has become a matter of macro significance. The principal danger to shareholders of mainland banks is equity dilution. We reiterate our long U.S. banks/short Chinese bank shares trade, and within the latter our long large/short SMB stocks position. Feature Chinese Banks: A Value Trap Chart I-1Chinese Bank Share Prices Are On Edge
Chinese Bank Share Prices Are On Edge
Chinese Bank Share Prices Are On Edge
Banks are crucial to financing the private sector as well as all levels of government in China. Not only do banks originate a substantial share of credit, but also they account for 82% of purchases of government bonds. That is why today we revisit the fundamentals of the Chinese banking sector. Besides, their equity valuations appear very cheap, and many investors are tempted to buy their shares. Chinese banks’ financial ratios look healthy and valuations appear extremely cheap because they have not recognized and provisioned for non-performing assets. By expanding their balance sheets enormously and not provisioning for bad assets, their profits have mushroomed. Banks have retained a share of these profits, boosting their capital. Yet, their share prices have been flat over the past 10 years. Recently, investable bank stocks have been lingering around their December lows. Another gap down could be lurking around the corner (Chart I-1). We highlight their poor financial health in the section below, where we perform stress tests for both large as well as small and medium sized banks (SMB). The principal danger to shareholders is equity dilution that will continue occurring among mainland banks (Chart I-2). Our bearish view on Chinese bank stocks has not been contingent on a systematic financial crisis but on inevitable and substantial equity dilution. Investment conclusions: Absolute return investors should stay clear of Chinese bank stocks – they are the ultimate value trap. For relative value traders, we reiterate our long U.S. banks/short Chinese bank shares trade, and within the latter our long large/short SMB stocks position (Chart I-3). Chart I-2Beware Of Equity Dilution
Beware Of Equity Dilution
Beware Of Equity Dilution
Chart I-3Our Trades On Chinese Banks
Our Trades On Chinese Banks
Our Trades On Chinese Banks
Large Versus Small And Medium Banks China’s banking system consists of five large banks (Industrial and Commercial Bank of China, China Construction Bank, Bank of China, Agricultural Bank of China, and Bank of Communications) and about 3150 small- and medium-sized banks (SMBs). All five large banks are publically listed but the central government still holds about 70-80% of their equity. About 36 of the SMBs are also listed but the central authorities in Beijing have a stake in some of the medium-sized banks. Notably, the central government has no equity in any of the small banks. In recent years, SMBs have been playing a greater role in sustaining the credit boom: First, on aggregate SMBs have actually outgrown the five large banks in terms of balance sheet size. The former’s risk-weighted assets1 (RWAs) of RMB 73 trillion exceeds the RMB 65 trillion of large banks (Chart I-4). Recently, investable bank stocks have been lingering around their December lows. Another gap down could be lurking around the corner. The value of RWAs emphasizes banks’ claims on enterprises, non-bank financial institutions and households over holdings of government bonds. Hence, RWAs of banks are a more pertinent measure of non-government financing than total assets. Second, over the past 12 months large banks and SMBs have accounted for 40% and 60% of the rise in the aggregate banking system’s RWAs, respectively (Chart I-5). Therefore, further credit acceleration will be difficult to engineer if – as we discuss below – SMBs begin retrenching under regulatory pressures and amid tighter market financing in the wake of the Baoshang bank failure. Chart I-4SMBs Have Outgrown Large Ones
SMBs Have Outgrown Large Ones
SMBs Have Outgrown Large Ones
Chart I-5SMBs Have Contributed Enormously To The Credit Boom
SMBs Have Contributed Enormously To The Credit Boom
SMBs Have Contributed Enormously To The Credit Boom
Finally, there has so far been no deleveraging among SMBs. Large banks’ RWAs-to-nominal GDP ratio has been in decline since 2014, but the same ratio for SMBs has not dropped at all (Chart I-6). This chart corroborates that the credit boom between 2015 and 2017 was driven by SMBs, rather than by large banks. In fact, SMBs along with shadow banking are what primarily drove the credit boom that occurred over the past decade. This confirms the thesis that the unprecedented credit bubble has spiraled beyond the central authorities’ control. While China’s entire banking system is in poor health, SMBs are in considerably worse shape than large ones. In particular: SMBs have much more assets classified as equity and other investments than large banks (Chart I-7). Equity and other investments stands for non-standard credit assets that are typically much riskier than loans and corporate bonds. This is the principal reason why in our stress test we use higher ratios of non-performing assets for SMBs than for large banks. Chart I-6No Deleveraging Among SMBs
No Deleveraging Among SMBs
No Deleveraging Among SMBs
Chart I-7SMBs Exposure To Non-StandarD Credit Assets Is Huge
SMBs Exposure To Non-StandarD Credit Assets Is Huge
SMBs Exposure To Non-StandarD Credit Assets Is Huge
Chart I-8Large Banks Versus SMBs
Large Banks Versus SMBs
Large Banks Versus SMBs
Big banks are better capitalized than SMBs. The capital adequacy ratio among big banks is higher compared with the other banks (Chart I-8, top panel). Similarly, the ratio of non-performing loans (NPL) to total loans is considerably lower for large banks than for SMBs (Chart I-8, bottom panel). On the liquidity side, SMBs are more dependent on the wholesale funding market than their larger peers. Interbank transactions account for 10% of SMBs own liabilities. On the other hand, big banks are the main lenders in the interbank market. Bottom Line: SMBs have become more important than large ones in providing financing to companies and households. Yet these SMBs are much more vulnerable. A Stress Test We conducted separate stress tests on large banks and SMBs. Our findings are not optimistic. Some 71% of equity of SMBs will be wiped out if 14% of their RWAs turn sour (Table I-1). 43% of large banks’ equity will be impaired if 12% of their RWAs become non-performing (Table I-2).
Chart I-
Chart I-
The reason we use RWAs rather than loans is because banks have been accumulating claims on enterprises, non-bank financial institutions and households beyond their loan books. Hence, RWAs better captures all credit assets. We use a higher impairment rate for SMBs than for large banks because the former have substantially more non-standard credit assets. Typically, the quality of non-standard credit assets is inferior to those of corporate bonds or loans. We used the following assumptions in our stress tests: For large banks, we assumed non-performing assets (NPAs) ratios of 10% in the optimistic scenario, 12% (baseline), and 14% (pessimistic) (Table I-2). For SMBs, we employed NPAs ratios of 12% (optimistic), 14% (baseline), and 16% (pessimistic) (Table I-1). The magnitude and duration of China’s current credit boom has considerably surpassed that of the 1990s, when Chinese banks held over 25% of non-performing loans (Chart I-9). Therefore, our stress test assumption that the NPAs ratio will rise above 10% is reasonable. Chart I-9China's Credit Booms In Perspective
China's Credit Booms In Perspective
China's Credit Booms In Perspective
We applied a 30% recovery rate on NPAs. The recovery rate on Chinese banks’ NPLs from 2001 to 2005 was 20%. This occurred amid much stronger economic growth. Thus, an assumption of a 30% recovery rate today is realistic. Finally, we calculated overvaluations assuming the fair price-to-book value ratio for all banks is 1. How has it been possible for banks in China to continue expanding their balance sheets aggressively despite such moribund financial health? Banks can operate and expand their balance sheets with zero or even negative de facto equity capital, so long as they obtain liquidity from other banks or the central bank. This is how many Chinese SMBs have been operating in recent years. Barring institutional and regulatory constraints, banks theoretically can expand their balance sheets indefinitely by creating loans and deposits “out of thin air.” We have deliberated extensively in past reports that banks do not intermediate savings or deposits into loans and credit. Rather, they create deposits when they make a loan to or buy an asset from a non-bank entity. Loans and deposits are nothing other than accounting entries on banks’ books. It is regulators’ and shareholders’ forbearance – or lack of it – that allows banks to, or prevents banks from, expanding their balance sheets. Although Chinese authorities have been easing both monetary and fiscal policies, they have not completely abandoned their regulatory tightening efforts on banks and shadow banking, or their plans to curb leverage and speculation in the real estate market. For example, in April bank regulators released draft rules on how banks should classify all types of assets and provision for them. Over the past several years, many banks have transformed their bad loans into non-loan assets to disguise the true level of their non-performing loans (NPLs). The new regulation, if and when it is adopted and properly executed, will force banks to recognize NPAs and increase their provisions. Although Chinese authorities have been easing both monetary and fiscal policies, they have not completely abandoned their regulatory tightening efforts on banks and shadow banking, or their plans to curb leverage and speculation in the real estate market. Ultimately, this will substantially impair banks’ capital and dampen their ability to originate new credit – both in the form of making loans and buying securities. Consequently, the credit impulse will relapse and the business cycle recovery will be delayed. Bottom Line: If banks in China are forced by regulators to properly recognize and provision for NPAs, large banks would become substantially undercapitalized while many SMBs would have little equity capital left. That would hammer their ability to finance the economy. Investment Ramifications Given the increased importance of SMBs in China, the precarious state of their financial health has become a matter of macro significance. Even if regulators partially reinforce recognition of provisions for NPAs, aggregate credit growth will decelerate. A simple simulation to illustrate this point: If SMBs RWAs growth were to decelerate from 11% currently to 8%, large banks’ RWA annual growth would need to surge from 8% now to 16% for all banks’ RWA growth to accelerate from the current 9.5% to 12%. The latter is probably what is required to promote an economic recovery. Such a ramp-up in large banks’ RWAs is unlikely, given they would also be facing stricter regulatory requirements. The key point is that the positive effects of monetary and fiscal easing continue to be hampered by regulatory tightening on the credit system. The latter will delay a business cycle recovery in China. For now, although the credit plus fiscal spending impulse has picked up, economic growth has not yet revived (Chart I-10, top two panels). The reason has been a declining marginal propensity to spend among households and companies (Chart I-10, bottom two panels). We have discussed this issue at great length in past reports. Consistently, nominal industrial output, car sales and smartphone sales as well as total imports are either very weak or are in outright contraction (Chart I-11). All series in Chart I-11 and I-12 include June data. Chart I-10Stimulus Versus Marginal Propensity To Spend
Stimulus Versus Marginal Propensity To Spend
Stimulus Versus Marginal Propensity To Spend
Chart I-11Chinese Economy: No Recovery So Far
Chinese Economy: No Recovery So Far
Chinese Economy: No Recovery So Far
Chart I-12Chinese Corporate EPS: The Outlook Is Downbeat
Chinese Corporate EPS: The Outlook Is Downbeat
Chinese Corporate EPS: The Outlook Is Downbeat
Importantly, Chinese corporate per-share earnings in RMB are contracting for the MSCI investable universe and will soon be contracting for A-share companies as well (Chart I-12). We maintain our negative outlook for EM risk assets and China-plays globally due to our downbeat view on China’s credit cycle. This differs from BCA’s House View, which is positive on global/Chinese growth. Arthur Budaghyan Chief Emerging Markets Strategist arthurb@bcaresearch.com Lin Xiang, Research Analyst linx@bcaresearch.com Brazil: Buy The Rumor, Sell The News? Having surged on the back of Congress’s initial approval of the social security reform, Brazilian financial markets are attempting to break above important technical resistance levels both in absolute and relative terms (Chart II-1 and Chart II-2). If the Bovespa decisively breaks above these technical resistance lines, it would mean it is in a structural bull market. A failure to break out will lead to a sizable setback. Chart II-1Are Brazilian Equities Poised For A Breakout In Absolute Terms…
Are Markets Poised For A Breakout In Absolute Terms...
Are Markets Poised For A Breakout In Absolute Terms...
Chart II-2…And Relative Terms?
...And Relative Terms?
...And Relative Terms?
We upgraded Brazilian equity and fixed-income markets right after the first round of presidential elections on October 7, but then downgraded them in early April. In retrospect, the downgrade was a miscalculation. Presently, investor confidence in Brazil is very high, sentiment is very bullish and markets are overbought. Faced with the choice of chasing the market higher or waiting, we are opting for the latter. Pension Reform: Necessary But Not Sufficient Chart II-3Public Debt-To-GDP Ratio Will Rise Further
Public Debt-To-GDP Ratio Will Rise Further
Public Debt-To-GDP Ratio Will Rise Further
The nation’s pension bill is a very positive and much-needed step in the structural reform process. However, in its current form, it is insufficient to make public debt dynamics sustainable – i.e., halt the rise in the government debt-to-GDP ratio (Chart II-3). Table II-1 illustrates the savings from the social security reform adopted in the lower house. As estimated by the Independent Fiscal Institute, an advisory think-tank of the Senate, the reform would bring only BRL 744 billion of savings over the next decade. Is this sufficient to stabilize the public debt-to-GDP ratio?
Chart II-
One way these reforms could contain the rise in the public debt-to-GDP ratio is if the savings generated significantly exceed the primary fiscal deficits over the next several years – i.e., the government runs continuous robust primary fiscal surpluses. Yet, the pension bill falls short of achieving this goal. The estimated savings in the first four years will likely be around BRL 130 billion. This amounts to annual savings of BRL 33 billion. Chart II-4 demonstrates that savings from the reform are too small to flip the government’s (often optimistic) projected primary fiscal deficit into a surplus in the forecast period. One way these reforms could contain the rise in the public debt-to-GDP ratio is if the savings generated significantly exceed the primary fiscal deficits over the next several years. Another scenario for stabilizing the public debt-to-GDP ratio is for interest rates to drop meaningfully below nominal GDP growth. Having plummeted amid very benign global and domestic backdrops, local currency bond yields still remain about 100 basis points above current nominal GDP growth (Chart II-5). It remains to be seen whether local currency borrowing costs will drop and stay below nominal GDP in the years to come. Chart II-4Primary Fiscal Balance Will Remain Negative Despite Pension Reform
Primary Fiscal Balance Will Remain Negative Despite Pension Reform
Primary Fiscal Balance Will Remain Negative Despite Pension Reform
Chart II-5Borrowing Costs Remain Above Nominal GDP Growth
Borrowing Costs Remain Above Nominal GDP Growth
Borrowing Costs Remain Above Nominal GDP Growth
Overall, the pension reform in current form does not guarantee public debt sustainability in Brazil: It is simply insufficient to get the government to run recurring primary fiscal surpluses. Another prerequisite – nominal GDP growth exceeding local bond yields over next several years – is contingent on further reforms as well as on a substantial improvement in confidence among investors, companies and households. It Is All About Confidence The sustainability of public debt, economic growth and financial markets are interlinked, with the common thread being confidence. In a virtuous cycle, financial markets typically rally while the currency stays firm. Subdued inflation will allow the central bank to rapidly reduce interest rates. This will help boost confidence among businesses and consumers, buoying the economy. In turn, lower policy rates could sustain the stampede into domestic bonds, pushing government borrowing costs below rising nominal GDP growth. At that point, the country’s public debt dynamics will become sustainable, the risk premium will continue to fall, and the nation’s financial markets will be in a secular bull market. On the contrary, a vicious cycle is possible if there is a negative external or internal shock that prompts the Brazilian real to depreciate by more than 10%. On the contrary, a vicious cycle is possible if there is a negative external or internal shock that prompts the Brazilian real to depreciate by more than 10%. In this case, the central bank cannot slash interest rates. On the contrary, government bond yields – which are presently at record lows – could or will likely rise (Chart II-6 and Chart II-7). These events will hurt confidence and suppress nominal GDP growth below borrowing costs. This could aggravate investors’ anxiety over Brazil’s public debt, leading them to demand a higher risk premium. As a result, a vicious cycle could unfold. Chart II-6Government Bond Yields Are At Historical Lows
Government Bond Yields Are At Historical Lows
Government Bond Yields Are At Historical Lows
Chart II-7Credit Spreads Are Very Tight
Credit Spreads Are Very Tight
Credit Spreads Are Very Tight
Chart II-8Commodity Prices And The BRL: Positive Correlation
Commodity Prices And The BRL: Positive Correlation
Commodity Prices And The BRL: Positive Correlation
To be clear, we are not presently forecasting the onset of a vicious cycle. Nevertheless, given our negative view on EM risk assets and currencies, we expect a pullback in the Brazilian real and risk assets in the near term. The U.S. dollar is about to rally, as we discussed in detail in last week’s report. Commodities prices will tumble as China’s growth downshift persists. Given that the Brazilian real is a high-beta currency and is often positively correlated with commodities prices (Chart II-8), it could depreciate quite a bit. Patience is especially warranted in the case of Brazilian equities because share prices have decoupled from corporate profits and the business cycle. Stock prices have surged despite plummeting net EPS revisions and contracting profits of non-financial and non-resource companies (Chart II-9) and relapsing economic growth (Chart II-10). Clearly, the rally has been driven by expanding equity multiples due to progress on the social security reform. Chart II-9Stock Prices Are Diverging From Corporate Profits
Stock Prices Are Diverging From Corporate Profits
Stock Prices Are Diverging From Corporate Profits
Chart II-10Domestic Demand Has Stalled
Domestic Demand Has Stalled
Domestic Demand Has Stalled
Bottom Line: A lot of good news has been priced into Brazilian financial markets. For now, the risk-reward profile is not attractive: investors should wait for a better entry point. This is true for both absolute return investors and dedicated EM equity and fixed-income managers. Andrija Vesic, Research Analyst andrijav@bcaresearch.com Arthur Budaghyan Chief Emerging Markets Strategist arthurb@bcaresearch.com Footnotes 1 Risk-weighted asset is a bank's assets or off-balance sheet exposures, weighted according to risk. It is used in determining the capital requirement or Capital Adequacy Ratio (CAR) for a financial institution. Usually, different classes of assets have different risk weights associated with them. Equity Recommendations Fixed-Income, Credit And Currency Recommendations
Chart II-
Overweight
Defensive Shopping
Defensive Shopping
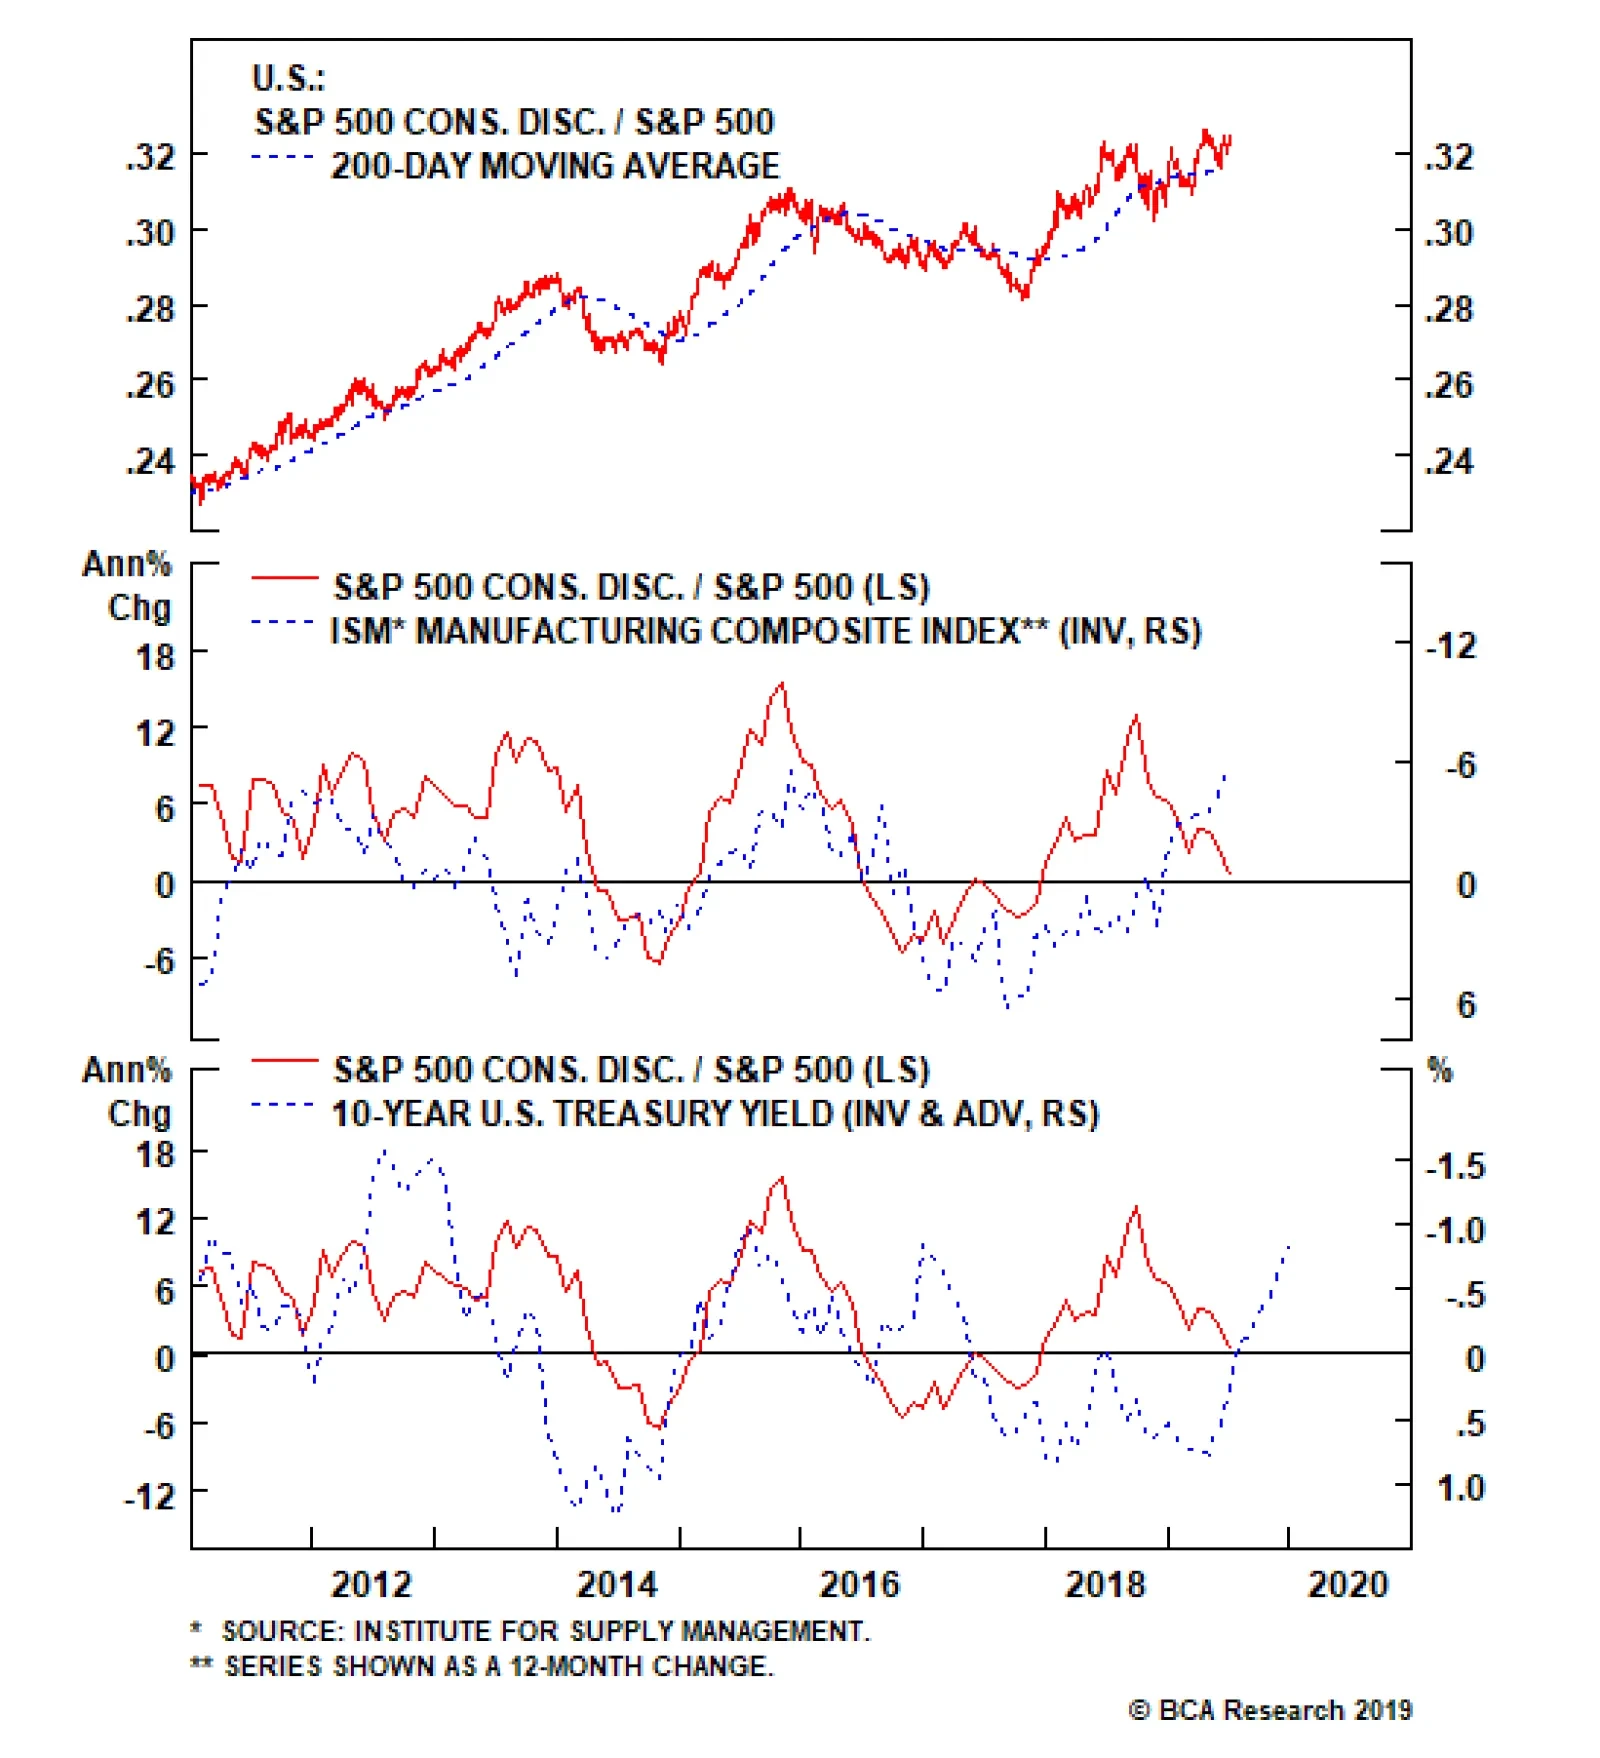
The tide has shifted and on Monday we upgraded the S&P hypermarkets index to an above benchmark allocation. While valuations are stretched, trading at a 50% premium to the overall market on a 12-month forward P/E basis (not shown), our thesis is that these Big Box retailers will grow into their pricey valuations in the coming months. The chart shows three macro variables that signal brighter times ahead for the relative share price ratio. The drubbing in the 10-year U.S. treasury yield reflects a souring macro backdrop, melting inflation and a steep fall in U.S. economic data surprises. The ISM manufacturing index that continues to decelerate and is now closing in on the boom/bust line corroborates the bond market’s grim message. Tack on the Fed’s expected four cuts in the coming 12 months, and factors are falling into place for a durable rally in relative share prices. Bottom Line: Boost the S&P hypermarkets index to overweight. Please refer to Monday’s Weekly Report for more details. The ticker symbols for the stocks in this index are: BLBG – S5HYPC – WMT, COST.
Highlights Portfolio Strategy Recession odds continue to tick higher, according to the NY Fed’s probability of recession model, at a time when global growth is waning, U.S. profit growth is contracting and the non-financial ex-tech corporate balance sheet is degrading rapidly. On a cyclical 3-12 month time horizon we remain cautious on the broad equity market. This is U.S. Equity Strategy’s view, which stands in contrast to the more sanguine equity BCA House View. The souring macro backdrop coupled with a firming industry demand outlook signal that more gains are in store for hypermarket stocks. The global growth slowdown, declining real bond yields, missing inflation, rising policy uncertainty and a favorable relative demand backdrop suggest that there is an exploitable tactical trading opportunity in a long global gold miners/short S&P oil & gas E&P pair trade. Recent Changes Upgrade the S&P hypermarkets index to overweight, today. Initiate a long global gold miners/short S&P oil & gas exploration & production (E&P) pair trade, today Table 1
Divorced From Reality
Divorced From Reality
Feature Obsession with the Fed easing continues to trump all else, with the SPX piercing through the 3,000 mark to fresh all-time highs last week. However, it is unrealistic for the Fed to do all the heavy lifting for the equity market as we have argued recently (see Chart 3 from June 24),1 at a time when profit cracks are spreading rapidly. This should be cause for some trepidation. Since the Christmas Eve lows essentially all of the 26% return in equities is explained by valuation expansion. The forward P/E has recovered from 13.5 to nearly 17.2 (Chart 1). There is limited scope for further expansion as four interest rate cuts in the coming 12 months are already priced in lofty valuations. Now profits will have to do the heavy lifting. But on the eve of earnings season, more than half of the S&P 500 GICS1 sectors are forecast to have contracted profits last quarter, and three sectors could not lift revenue versus year ago comps, according to I/B/E/S data. Looking further out, there is a plethora of indicators that we highlighted last week that suggest that a profit recession is looming.2 Our sense is that once the euphoria around the looming Fed easing cycle settles, there will be a massive clash between perception and reality (Chart 2) that will likely propagate as a surge in volatility. Chart 1Multiple Expansion Explains All Of The SPX’s Return
Multiple Expansion Explains All Of The SPX’s Return
Multiple Expansion Explains All Of The SPX’s Return
Chart 2Unsustainable Divergence
Unsustainable Divergence
Unsustainable Divergence
This addiction to low rates has come at a great cost to the non-financial corporate sector. As a reminder, this segment of the economy is where the excesses are in the current cycle as we have been highlighting in recent research.3 Using stock market related data for the non-financial ex-tech universe, net debt has increased by 70% to $4.2tn over the past five years, but cash flow has only grown 18% to $1.7tn. As a result, net debt-to-EBITDA has spiked from 1.7 to 2.5, an all-time high (Chart 3). While stocks are at all-time highs (top panel, Chart 3), the debt-saddled non-financials ex-tech universe will likely exert substantial downward pressure to these equities in the coming months (Chart 4). Chart 3Balance Sheet Degrading
Balance Sheet Degrading
Balance Sheet Degrading
Chart 4Something’s Got To Give
Something’s Got To Give
Something’s Got To Give
Moving on to the labor market, we recently noticed an interesting behavior between the unemployment rate and wage inflation since the early-1990s recession: a repulsive magnet-type property exists where like magnetic poles repel each other (middle panel, Chart 5). In other words, every time the falling unemployment rate has kissed off accelerating wage growth, a steep reversal ensued at the onset of recession during the previous three cycles. A repeat may be already taking place, as average hourly earnings (AHE) growth has been stuck in the mud since peaking in December 2018. Importantly, the AHE impulse is quickly losing steam and every time the Fed embarks on an aggressive easing cycle it typically marks the end of wage inflation (bottom panel, Chart 5). Chart 5Beware Of Repulsion
Beware Of Repulsion
Beware Of Repulsion
Chart 6Waiting For Growth
Waiting For Growth
Waiting For Growth
Meanwhile, BCA’s global manufacturing PMI diffusion index has cratered to below 40% (middle panel, Chart 6). Neither the G7 nor the EM aggregate PMIs are above the boom/bust line (top panel, Chart 6). Our breakdown of the Leading Economic Indicators into G7 and EM14 also signals that global growth is hard to come by, albeit EMs are showing some early signs of a trough (bottom panel, Chart 6). As the early-May announced increase in Chinese tariffs begin to take a toll, we doubt global growth can have a sustainable recovery for the rest of 2019, despite Chinese credit growth picking up. Now, even Japan and Korea are fighting it out and are erecting barriers to trade, dealing a further blow to these economically hyper-sensitive export-oriented economies. Netting it all out, the odds of recession by mid-2020 continue to tick higher according to the NY Fed’s model (NY Fed’s probability of recession shown inverted, top panel, Chart 5) at a time when global growth is waning, U.S. profit growth is contracting and the non-financial ex-tech corporate balance sheet is degrading rapidly. On a cyclical 3-12 month time horizon we remain cautious on the broad equity market. This is U.S. Equity Strategy’s view, which stands in contrast to the more sanguine equity BCA House View. This week we are upgrading a consumer staples subgroup to overweight and initiating an intra-commodity market neutral trade. Time To Buy The Hype The tide is shifting and we are upgrading the S&P hypermarkets index to an above benchmark allocation. While valuations are stretched, trading at a 50% premium to the overall market on a 12-month forward P/E basis (not shown), our thesis is that these Big Box retailers will grow into their pricey valuations in the coming months. The macro landscape is aligned perfectly with these defensive retailers. Consumer confidence has been falling all year long and now cracks are spreading to the labor market (confidence shown inverted, top panel, Chart 7). ADP small business payrolls declined for the second month in a row. Similarly, the NFIB survey shows that small business hiring plans are cooling (hiring plans shown inverted, middle panel, Chart 7). As a reminder, 2/3 of all new hiring typically occurs in the small and medium enterprise space. In the residential real estate market, the drop in interest rates that is now in its eighth month has yet to be felt, and house price inflation has ground to a halt. Historically, Costco membership growth has been inversely correlated with house prices (house price inflation shown inverted, bottom panel, Chart 7). Chart 7Deteriorating Macro Backdrop …
Deteriorating Macro Backdrop …
Deteriorating Macro Backdrop …
Chart 8…Is A Boon To Hypermarkets…
…Is A Boon To Hypermarkets…
…Is A Boon To Hypermarkets…
Chart 8 shows three additional macro variables that signal brighter times ahead for the relative share price ratio. The drubbing in the 10-year U.S. treasury yield reflects a souring macro backdrop, melting inflation and a steep fall in U.S. economic data surprises. The ISM manufacturing index that continues to decelerate and is now closing in on the boom/bust line corroborates the bond market’s grim message. Tack on the Fed’s expected four cuts in the coming 12 months, and factors are falling into place for a durable rally in relative share prices. This disinflationary backdrop along with the Fed’s looming easing interest rate cycle have put a solid bid under gold prices. Hypermarket equities and bullion traditionally move in lockstep, and the current message is to expect more gains in the former (top panel, Chart 9). On the trade front specifically, these Big Box retailers do source consumer goods from China, but up to now these imports have been nearly immune to the U.S./China trade dispute as prices have been deflating (import prices shown inverted, bottom panel, Chart 9). However, this does pose a risk going forward and we will be closely monitoring it for two reasons: First, because downward pressures may intensify on the greenback and second, President Trump may impose additional tariffs, both of which are negative for industry pricing power. Chart 9Profit Margins…
Profit Margins…
Profit Margins…
Chart 10…Will Likely Expand
…Will Likely Expand
…Will Likely Expand
Meanwhile, industry demand is on the rise and will likely offset the potential trade and U.S. dollar induced margin pressures. Hypermarket retail sales are climbing at a healthy clip outpacing overall retail sales (bottom panel, Chart 10). Already non-discretionary retail sales are outshining discretionary ones, which is a precursor to recession at a time when overall consumer outlays have sunk below 1% (real PCE growth shown inverted, top panel, Chart 10). The implication is that hypermarkets will continue to garner a larger slice of consumer outlays as the going gets tough. In sum, the souring macro backdrop coupled with a firming industry demand outlook signal that more gains are in store for hypermarket stocks. Bottom Line: Boost the S&P hypermarkets index to overweight. The ticker symbols for the stocks in this index are: BLBG – S5HYPC – WMT, COST. Initiate A Long Global Gold Miners/Short S&P Oil & Gas E&P Pair Trade One way to benefit from the global growth soft-patch and looming global liquidity injection is to go long global gold miners/short S&P oil & gas E&P stocks on a tactical three-to-six month basis. While this market neutral and intra-commodity pair trade has already enjoyed an impressive run, there is more upside owing to a favorable macro backdrop. The key determinant of this share price ratio is the relative move in the underlying commodities that serve as pricing power proxies (top panel, Chart 11). Given the massive currency debasement potential that has gripped Central Banks the world over, such a flush liquidity backdrop will boost the allure of the shiny metal more so than crude oil. Global manufacturing PMIs are foreshadowing recession and our diffusion index has plummeted to the lowest level since 2011 (diffusion shown inverted, middle panel, Chart 11). In the U.S. specifically there is a growth-to-liquidity handoff and the ISM manufacturing survey’s new order versus prices paid subcomponents confirms that global gold miners have the upper hand compared with E&P equities (bottom panel, Chart 11). Chart 11Global Soft-Patch…
Global Soft-Patch…
Global Soft-Patch…
Chart 12…Disinflation…
…Disinflation…
…Disinflation…
As a result of this growth scare that can easily morph into recession especially if the U.S./China trade war continues into next year, inflation is nowhere to be found. Unit labor costs are slumping (top panel, Chart 12), the NY Fed’s Underlying Inflation Gauge has rolled over decisively (not shown),4 and the GDP deflator is slipping (middle panel, Chart 12). Parts of the yield curve first inverted in early-December and the 10-year/fed funds rate slope is still inverted, signaling that gold miners will continue to outperform oil producers (yield curve shown on inverted scale, bottom panel, Chart 13). The near 100bps dive in real interest rates since late-December ties everything together and is a boon to bullion (and gold producers) that yields nothing (TIPS yield shown inverted, top panel, Chart 13). Meanwhile, bond volatility has spiked of late and the bottom panel of Chart 14 shows that historically the MOVE index has been joined at the hip with relative share prices. Chart 13…Melting Real Yields And…
…Melting Real Yields And…
…Melting Real Yields And…
Chart 14…The Spike In Bond Vol, All Favor Gold Miners Over Oil Producers
…The Spike In Bond Vol, All Favor Gold Miners Over Oil Producers
…The Spike In Bond Vol, All Favor Gold Miners Over Oil Producers
On the relative demand front, we peer over to China to take a pulse of the marginal moves in these commodity markets. China (and Russia) has been aggressively shifting their currency reserves into gold, and bullion holdings are rising both in volume terms and as a percentage of total FX reserves. In marked contrast, oil demand is feeble and Chinese apparent diesel consumption that is closely correlated with infrastructure and manufacturing activity has tumbled. Taken together, the message is to expect additional gain in relative share prices (middle & bottom panels, Chart 15). Adding it all up, the global growth slowdown, declining real bond yields, missing inflation, rising policy uncertainty and a favorable relative demand backdrop suggest that there is an exploitable tactical trading opportunity in a long global gold miners/short S&P oil & gas E&P pair trade. Bottom Line: Initiate a tactical long global gold miners/short S&P oil & gas E&P pair trade on a three-to-six month time horizon with a stop at the -10% mark. The ticker symbols for the stocks in these indexes are: GDX:US and BLBG – S5OILP – COP, EOG, APC, PXD, CXO, FANG, HES, DVN, MRO, NBL, COG, APA, XEC, respectively. Chart 15Upbeat Relative Demand Backdrop
Upbeat Relative Demand Backdrop
Upbeat Relative Demand Backdrop
Anastasios Avgeriou, U.S. Equity Strategist anastasios@bcaresearch.com Footnotes 1 Please see BCA U.S. Equity Strategy Weekly Report, “Cracks Forming” dated June 24, 2019, available at uses.bcaresearch.com. 2 Please see BCA U.S. Equity Strategy Weekly Report, “Beware Profit Recession” dated July 8, 2019, available at uses.bcaresearch.com. 3 Please see BCA U.S. Equity Strategy Weekly Report, “A Recession Thought Experiment” dated June 10, 2019, available at uses.bcaresearch.com. 4 https://www.newyorkfed.org/research/policy/underlying-inflation-gauge Current Recommendations Size And Style Views Favor value over growth Favor large over small caps
Stalling Transports Will Weigh On The S&P 500
Stalling Transports Will Weigh On The S&P 500
Internal equity dynamics are sending a powerful signal for the broad equity market. Not only are defensives outshining cyclicals and mega caps trouncing small and micro caps, but also transports are warning that the broad equity market is skating on thin ice (top panel). Importantly, drilling deeper into the highly cyclical trucking industry is instructive. Heavy-duty trucks new orders have plunged (middle panel). While this is likely a consequence of the U.S./China trade war that commenced in the spring of 2018, there are also elements of domestic demand ills that have pushed “class 8 trucks” orders to the lowest point since the late-2015/early-2016 manufacturing recession. In addition, the American Trucking Association’s trucking tonnage index has fallen recently and is contracting at an accelerating pace on a six-month rate of change basis (third panel). Bottom Line: We heed the signal from the highly sensitive transportation sector and remain cautious on the broad equity market.
Fade Semi Equipment Strength
Fade Semi Equipment Strength
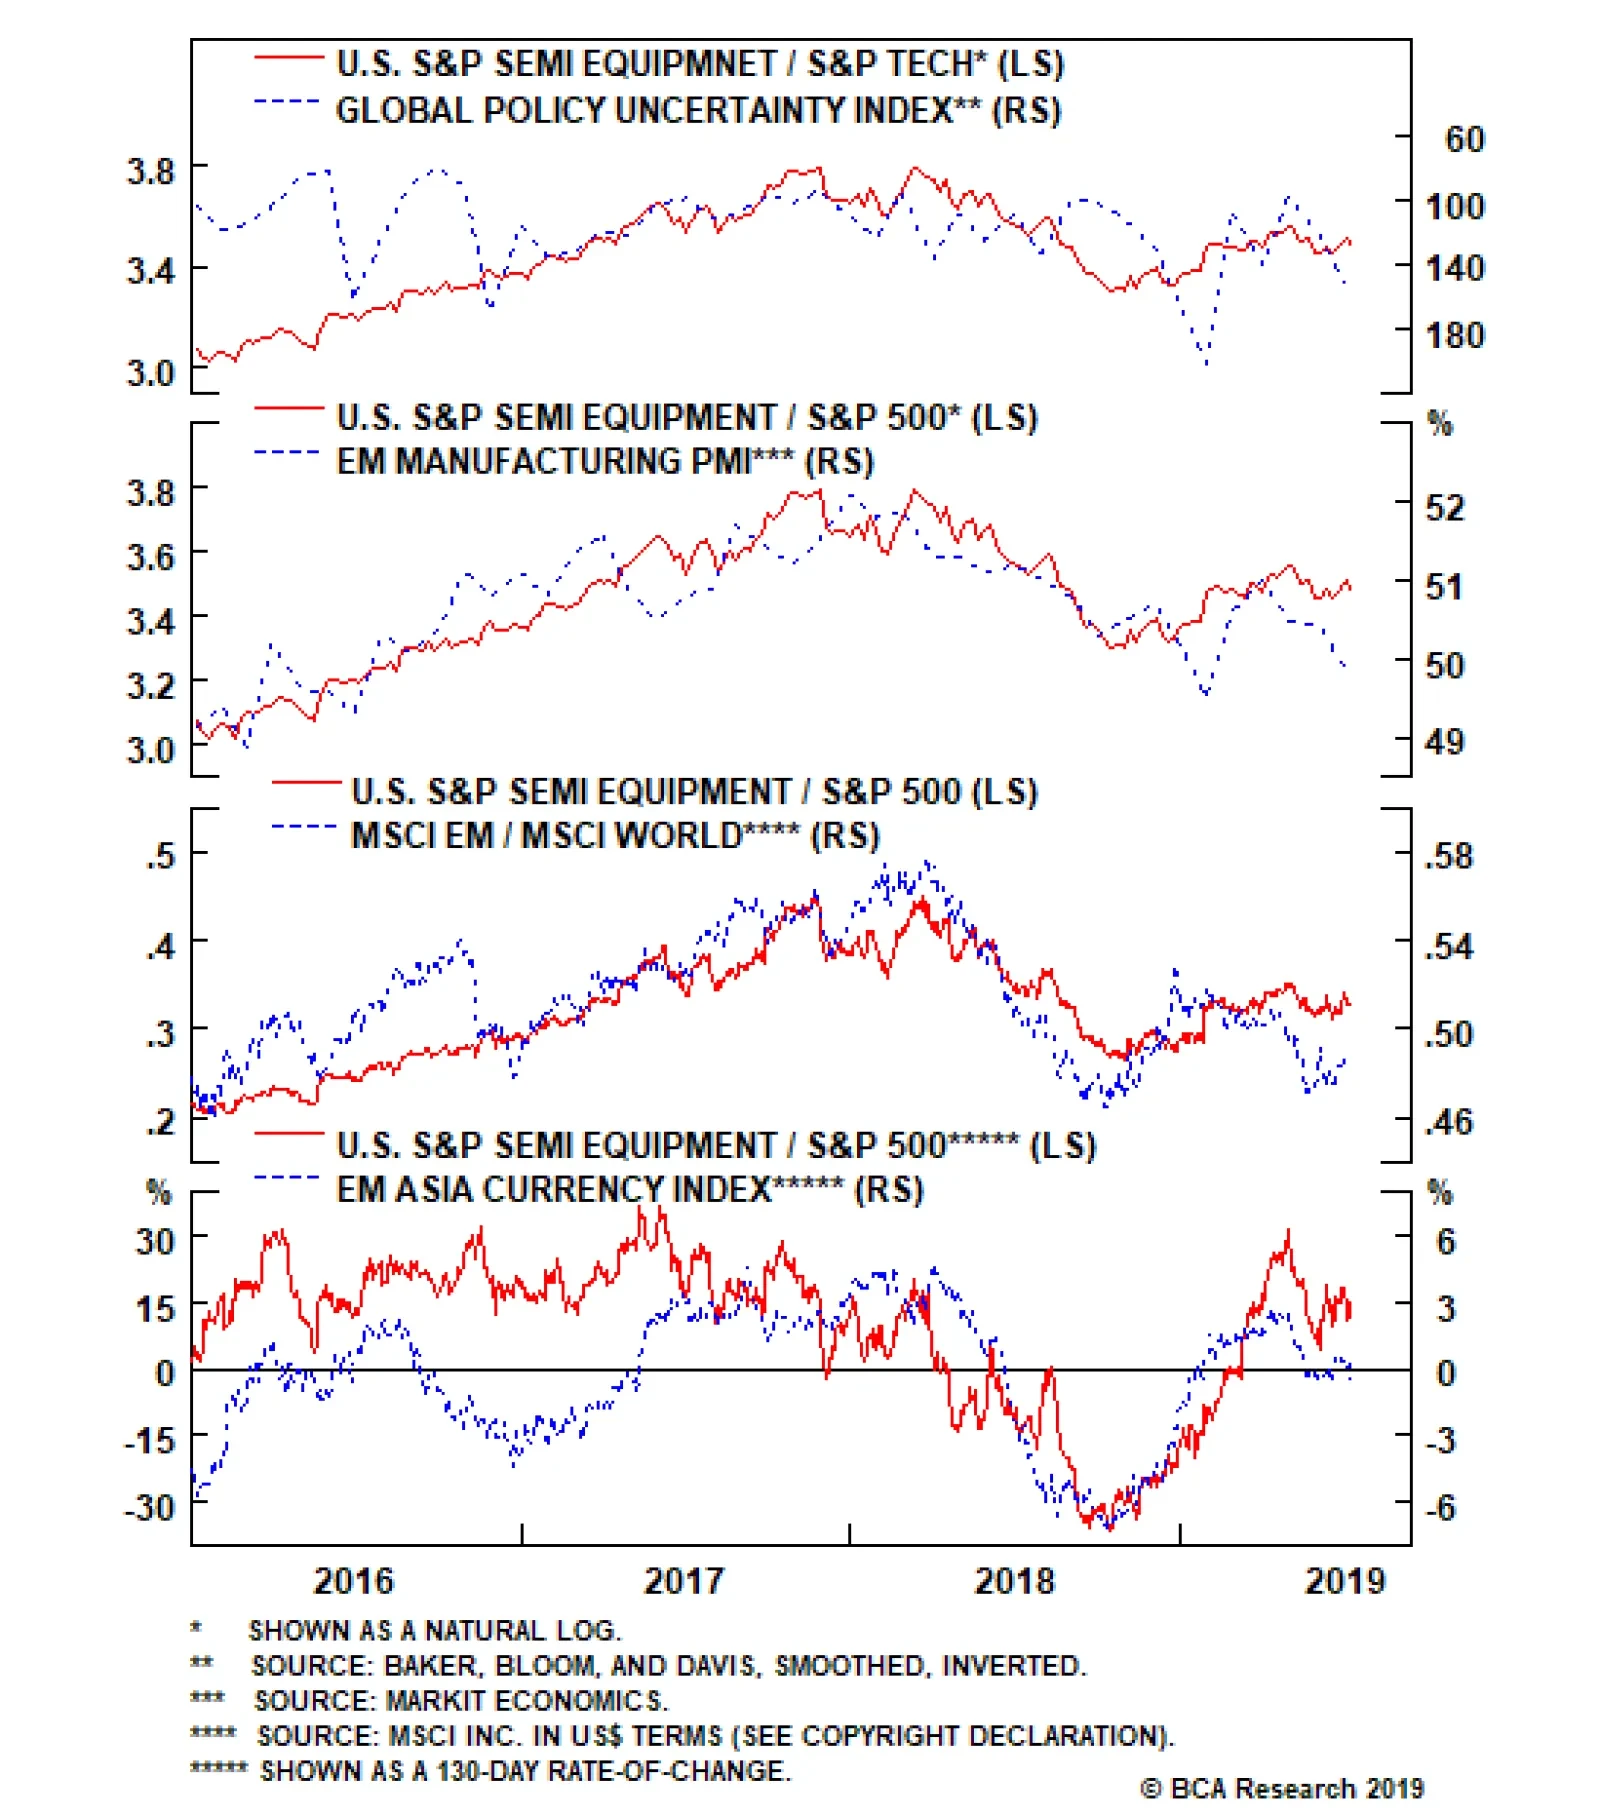
Underweight A tactical trading opportunity has re-emerged in semi equipment stocks. This week we recommended trimming the S&P semi equipment index to underweight on a three-to-six month time horizon, but with a tight stop at the -7% relative return mark. Semi equipment stocks are capital intensive and require precision manufacturing, which makes their sales cycle a carbon copy of the broad manufacturing cycle. The middle panel of the chart shows this tight positive correlation with the ISM manufacturing index and sends a grim message for semi equipment manufacturers. With regard to industry operating metrics, the news is equally glum. Global semi cycles typically last four-to-five quarters and we only just passed the half way mark. Thus, there is more downside to industry sales momentum and we would lean against recent analyst relative revenue euphoria (bottom panel). Bottom Line: Downgrade the S&P semiconductor equipment index to underweight on a tactical – three-to-six month horizon – basis, but set a tight stop at the -7% relative return mark. For additional details please refer to this Monday’s Weekly Report. The ticker symbols for the stocks in this index are: BLBG – S5SEEQ – AMAT, LRCX, KLAC.
Highlights The onset of a down-oscillation in growth strongly suggests a rotation out of the growth-sensitive Industrials and Materials into the relatively defensive Healthcare sector. But if the sharpest move in bond yields has already happened, it also suggests that Banks might hold up versus other cyclical sectors. New recommendation 1: Overweight Banks versus Industrials. New recommendation 2: Overweight Eurostoxx50 versus Nikkei225. Remain overweight Eurostoxx50 versus Shanghai Composite and neutral versus the S&P500. Feature Chart of the WeekEuro Stoxx 50 Vs. Nikkei 225 = Global Banks In Euros Vs. Global Industrials In Yen
Euro Stoxx 50 Vs. Nikkei 225 = Global Banks In Euros Vs. Global Industrials In Yen
Euro Stoxx 50 Vs. Nikkei 225 = Global Banks In Euros Vs. Global Industrials In Yen
Several decades ago, English football’s top division was a showcase for the top English and British footballers. But not anymore. This year, the top six footballers in the English Premier League hail from Argentina, the Netherlands, Belgium, Senegal, Portugal, plus a token Englishman. Nowadays, if you want to see English or British footballers you have to go to the lower divisions.1 The English Premier League provides a powerful analogy for the FTSE100. Many of the top companies in this blue-chip index have their origins and main businesses outside the U.K. The names say it all: Royal Dutch, Hong Kong and Shanghai Banking Corporation, British American Tobacco, and so on. Just like in football, if you want stock market exposure to the U.K, you now have to go to the lower divisions: the FTSE250 or the FTSE Small Cap. A view on an economy does not necessarily translate into the same view on its mainstream stock market. The leading companies in the FTSE100 are multinationals, whose sales and profits have a minimal exposure to the economic fortunes of the U.K. This leads to a result which causes investors a great deal of cognitive dissonance: a view on an economy does not necessarily translate into the same view on its mainstream stock market. Picking Stock Markets The Right Way Royal Dutch is neither a Dutch company nor a U.K. company, it is a global company. And the same is true for the vast majority of companies in the FTSE100 and all other major indexes such as the Eurostoxx50, Nikkei225, and S&P500. However, Royal Dutch is most definitely an oil and gas company which moves in lockstep with the global energy sector. Hence, by far the most important performance differentiator for any mainstream equity index is the sector fingerprint that distinguishes the equity index from its peers. Each major stock market has a distinguishing ‘long’ sector in which it contains up to a quarter of its total market capitalisation, as well as a distinguishing ‘short’ sector in which it has a significant under-representation. The combination of this long sector and short sector gives each equity index its distinguishing fingerprint (Table 1):
Chart I-
FTSE100 = long energy, short technology. Eurostoxx50 = long banks, short technology. Nikkei225 = long industrials, short banks and energy. S&P500 = long technology, short materials. MSCI Emerging Markets = long technology, short healthcare. Another important factor is the currency. Royal Dutch receives its revenues and incurs its costs in multiple major currencies, such as euros and dollars. In other words, Royal Dutch’s global business is currency neutral. But the Royal Dutch stock price is quoted in London in pounds. Hence, if the pound strengthens, the company’s multi-currency profits will decline in pound terms, weighing on the stock price. Conversely, if the pound weakens, it will lift the Royal Dutch stock price. This means that the domestic economy can impact its stock market through the currency channel. Albeit it is a counterintuitive relationship: a strong economy via a strong currency hinders the stock market; a weak economy via a weak currency helps the stock market. Be Careful With Valuation Comparisons Chart of the Week to Chart I-7 should prove beyond doubt that the sector plus currency effect is all that you need to get right to allocate between these four major regions. The charts show all the permutations of relative performances taken from the S&P500, Eurostoxx50, Nikkei225 and FTSE100 over the last decade. Chart I-2FTSE 100 Vs. S&P 500 = Global Energy In Pounds Vs. Global Technology In Dollars
FTSE 100 Vs. S&P 500 = Global Energy In Pounds Vs. Global Technology In Dollars
FTSE 100 Vs. S&P 500 = Global Energy In Pounds Vs. Global Technology In Dollars
Chart I-3FTSE 100 Vs. Nikkei 225 = Global Energy In Pounds Vs. Global Industrials In Yen
FTSE 100 Vs. Nikkei 225 = Global Energy In Pounds Vs. Global Industrials In Yen
FTSE 100 Vs. Nikkei 225 = Global Energy In Pounds Vs. Global Industrials In Yen
Chart I-4FTSE 100 Vs. Euro Stoxx 50 = Global Energy In Pounds Vs. Global Banks In Euros
FTSE 100 Vs. Euro Stoxx 50 = Global Energy In Pounds Vs. Global Banks In Euros
FTSE 100 Vs. Euro Stoxx 50 = Global Energy In Pounds Vs. Global Banks In Euros
Chart I-5Euro Stoxx 50 Vs. S&P 500 = Global Banks In Euros Vs. Global Technology In Dollars
Euro Stoxx 50 Vs. S&P 500 = Global Banks In Euros Vs. Global Technology In Dollars
Euro Stoxx 50 Vs. S&P 500 = Global Banks In Euros Vs. Global Technology In Dollars
Chart I-6Euro Stoxx 600 Vs. MSCI Emerging Markets = Global Healthcare In Euros Vs. Global Technology In Dollars
Euro Stoxx 600 Vs. MSCI Emerging Markets = Global Healthcare In Euros Vs. Global Technology In Dollars
Euro Stoxx 600 Vs. MSCI Emerging Markets = Global Healthcare In Euros Vs. Global Technology In Dollars
Chart I-7S&P500 Vs. Nikkei225 = Global Tech In Dollars Vs. Global Industrials ##br##In Yen
S&P500 Vs. Nikkei225 = Global Tech In Dollars Vs. Global Industrials In Yen
S&P500 Vs. Nikkei225 = Global Tech In Dollars Vs. Global Industrials In Yen
One important implication of sectors and currencies driving stock market allocation is that the head-to-head comparison of stock market valuations is meaningless. Two sectors with vastly different structural growth prospects – say, energy and technology – must necessarily trade on vastly different valuations. So the sector with the lower valuation is not necessarily the better-valued sector. By extension, the stock market with the lower valuation because of its sector fingerprint is not necessarily the better-valued stock market. Likewise, if investors anticipate the pound to ultimately strengthen – because they see that the pound is structurally cheap today – they might downgrade Royal Dutch’s multi-currency profit growth expectations in pound terms and trade the stock at an apparent discount. But allowing for the anticipated decline in other currencies versus the pound there is no discount. It follows that any multinational listed in Europe will give a false impression of cheapness if investors see European currencies as structurally undervalued. Another implication is that simple ‘value’ indexes may not actually offer value. In reality, they comprise a collection of sectors on the lowest head-to-head valuations which, to repeat, does not necessarily make them better-valued. The sector plus currency effect is all that you need to allocate between equity markets. Some people suggest comparing a valuation with its own history, and assessing how many ‘standard deviations’ it is above or below its norm. Unfortunately, the concept of a standard deviation is meaningful only if the underlying series is ‘stationary’ – meaning, it has no step changes through time. But sector valuations are ‘non-stationary’: they do undergo major step changes when they enter a vastly different economic climate. For example, the structural outlook for bank profits undergoes a step change when a credit boom ends. Therefore, comparing a bank valuation after a credit boom with the valuation during the credit boom is like comparing an apple with an orange! The Current Message Last week, we pointed out that current activity indicators are losing momentum, or outright rolling over. The reason being that “both the interest rate impulse and short-term credit impulses are now on the cusp of down-oscillations, which will bear on economies and financial markets in the second half of the year.” This week’s profit warning from BASF supports this analysis. To be clear, this is not a binary issue about recession or no recession. This is just a common or garden down-oscillation in European (and global) growth which tends to happen every 18 months or so with remarkable regularity. Nevertheless, the down-oscillation has a major bearing on sector allocation (Chart I-8) and, therefore, a major bearing on regional equity allocation. Chart I-8Switch Out Of Growth-Sensitives Into Healthcare
Switch Out Of Growth-Sensitives Into Healthcare
Switch Out Of Growth-Sensitives Into Healthcare
Based on the major equity index ‘sector fingerprints’ we need to rank the attractiveness of six major global sectors: Materials, Energy, Industrials, Banks, Healthcare, and Technology. In the first half of the year, Industrials outperformed while Banks underperformed. Why? Because Industrials were following the up-oscillation in growth whereas Banks were tracking the bond yield down, as the flattening (or inverting) yield curve ate into their margins. Now, the onset of a down-oscillation in growth strongly suggests a rotation out of the growth-sensitive Industrials and Materials into the relatively defensive Healthcare sector (Chart I-8). But if the sharpest move in bond yields has already happened, it also suggests that Banks might hold up versus other cyclical sectors (Chart I-9 and Chart I-10). Meanwhile, for Energy and Technology we do not hold a high-conviction view. Hence, our ranking of the sectors is as follows: Chart I-9Banks Have Tracked The Bond Yield ##br##Down...
Banks Have Tracked The Bond Yield Down...
Banks Have Tracked The Bond Yield Down...
Chart I-10...But If The Sharpest Move In Yields Is Over, Banks Can Outperform Other Cyclicals
...But If The Sharpest Move In Yields Is Over, Banks Can Outperform Other Cyclicals
...But If The Sharpest Move In Yields Is Over, Banks Can Outperform Other Cyclicals
Healthcare Banks Energy and Technology Industrials and Materials On the basis of this ranking, and the major equity index sector fingerprints we are making two new recommendations. Overweight Banks versus Industrials. Overweight Eurostoxx50 versus Nikkei225. For completeness, remain overweight Eurostoxx50 versus Shanghai Composite and neutral versus the S&P500. A New Look To Our Recommendations Finally, from this week onwards we are changing the way we show our investment recommendations. Trades will refer to an investment horizon of 3 months or less, and these will mostly fall within the Fractal Trading System. Cyclical Recommendations will refer to an investment horizon usually between 3 months and a year, and will be sub-divided into asset allocation, equities, and bonds, rates and currencies. Structural Recommendations will refer to an investment horizon longer than a year, and will also be sub-divided into asset allocation, equities, and bonds, rates and currencies. We are changing the way we show our investment recommendations. We have also taken the opportunity to close long-standing stale positions. We hope you find the new look more user-friendly. Next week we will be publishing a jointly written round table discussion in which we debate and explore the interesting view differences within BCA. Absent a major development in the markets, this will replace the normal weekly report. Fractal Trading System* This week we note that the strong rally in the Australian stock market has reached a 65-day fractal dimension which has signalled previous countertrend reversals especially in relative terms. Accordingly, this week’s recommended trade is short ASX 200 vs. FTSE100. The profit target is 2% with a symmetrical stop-loss. In other trades, we are pleased to report that short euro area industrials vs. market achieved its profit target and is now closed. This leaves five open positions. For any investment, excessive trend following and groupthink can reach a natural point of instability, at which point the established trend is highly likely to break down with or without an external catalyst. An early warning sign is the investment’s fractal dimension approaching its natural lower bound. Encouragingly, this trigger has consistently identified countertrend moves of various magnitudes across all asset classes. Chart I-11
ASX 200 VS. FTSE100
ASX 200 VS. FTSE100
The post-June 9, 2016 fractal trading model rules are: When the fractal dimension approaches the lower limit after an investment has been in an established trend it is a potential trigger for a liquidity-triggered trend reversal. Therefore, open a countertrend position. The profit target is a one-third reversal of the preceding 13-week move. Apply a symmetrical stop-loss. Close the position at the profit target or stop-loss. Otherwise close the position after 13 weeks. Use the position size multiple to control risk. The position size will be smaller for more risky positions. * For more details please see the European Investment Strategy Special Report “Fractals, Liquidity & A Trading Model,” dated December 11, 2014, available at eis.bcaresearch.com. Dhaval Joshi, Chief European Investment Strategist dhaval@bcaresearch.com Footnotes 1 The top six players are based on the six nominations for the 2019 PFA Footballer of the Year: Sergio Aguero (Argentina), Virgil Van Dijk (Netherlands), Eden Hazard (Belgium), Sadio Mane (Senegal), Bernardo Silva (Portugal), and Raheem Sterling (England). Virgil Van Dijk was the winner. Fractal Trading System Cyclical Recommendations Structural Recommendations Closed Fractal Trades Trades Closed Trades Asset Performance Currency & Bond Equity Sector Country Equity Indicators Bond Yields Chart II-1Indicators To Watch - Bond Yields
Indicators To Watch - Bond Yields
Indicators To Watch - Bond Yields
Chart II-2Indicators To Watch - Bond Yields
Indicators To Watch - Bond Yields
Indicators To Watch - Bond Yields
Chart II-3Indicators To Watch - Bond Yields
Indicators To Watch - Bond Yields
Indicators To Watch - Bond Yields
Chart II-4Indicators To Watch - Bond Yields
Indicators To Watch - Bond Yields
Indicators To Watch - Bond Yields
Interest Rate Chart II-5Indicators To Watch - Interest Rate Expectations
Indicators To Watch - Interest Rate Expectations
Indicators To Watch - Interest Rate Expectations
Chart II-6Indicators To Watch - Interest Rate Expectations
Indicators To Watch - Interest Rate Expectations
Indicators To Watch - Interest Rate Expectations
Chart II-7Indicators To Watch - Interest Rate Expectations
Indicators To Watch - Interest Rate Expectations
Indicators To Watch - Interest Rate Expectations
Chart II-8Indicators To Watch - Interest Rate Expectations
Indicators To Watch - Interest Rate Expectations
Indicators To Watch - Interest Rate Expectations
Home Improvement Retailers Regaining Their Footing
Home Improvement Retailers Regaining Their Footing
Neutral This week we upgraded the S&P home improvement retail (HIR) index to a benchmark allocation and removed it from our high-conviction underweight list for a small relative loss. Similar to the parent Consumer Discretionary GICS1 sector, HIR stocks are inversely correlated with interest rates (fed funds rate discounter shown inverted, middle panel), given the close residential real estate market links they enjoy. Now that the bond market forecasts that the Fed will cut rates four times by next July, home improvement retailers should be cheering this news. Moreover, home improvement retailers have been flexing their pricing power muscles recently and this represents another boost to their top line growth prospects (bottom panel). Bottom Line: Lift the S&P HIR index to neutral and remove from the high-conviction underweight list. For additional details, on why it no longer pays to be underweight the S&P HIR index, please see this Monday’s Weekly Report. The ticker symbols for the stocks in this index are: BLBG – S5HOMI – HD, LOW.
Consumer discretionary stocks have marked time over the past year. But, now that the Fed is ready to ease monetary policy, it will no longer pay to be bearish. This early-cyclical sector is the prime beneficiary from lower interest rates. Thus, we are putting…
A tactical trading opportunity has re-emerged, and today our U.S. Equity Strategy team recommends trimming the S&P semi equipment index to underweight on a three-to-six month time horizon, but with a tight stop at the -7% relative return mark. Semi…