Sectors

Highlights Portfolio Strategy Rising lumber prices, melting interest rates and profit-augmenting industry productivity gains all signal that it no longer pays to be bearish the S&P home improvement retail (HIR) index. Poor revenue growth prospects, the ongoing global manufacturing contraction and downbeat financial variables all indicate that high-beta semi equipment stocks have ample downside. Recent Changes Downgrade the S&P semi equipment index to underweight on a tactical three-to-six month time horizon, today. Upgrade the S&P home improvement retail index to neutral and remove from the high-conviction underweight list, today. Put the S&P consumer discretionary sector on upgrade alert and remove from the high-conviction underweight list, today. Table 1
Beware Profit Recession
Beware Profit Recession
Feature July 10 marks the two year anniversary of our seminal “SPX 3,000?” report.1 We were very early both compared with the sell and buy side (to our knowledge the great Byron Wien is the only other strategist that had such a target) and as a reminder, at the time, the S&P 500 was trading near 2,400. A number of BCA peers and BCA clients alike confronted our über bullishness with disbelief, but our 3,000 target – based on our dividend discount model, an EPS and multiple sensitivity analysis and an equilibrium equity risk premium analysis – proved a prescient call. Throughout this period (we had actually been bullish since Brexit, when our profit growth models hooked up) we maintained our cyclical bullishness and never wavered (top panel, Chart 1). Now that SPX futures hit our 2019 target, we want to remain ahead of the curve, as Stan Druckenmiller once mused: “…you have to visualize the situation 18 months from now, and whatever that is, that's where the price will be, not where it is today”. Chart 1Rally Running On Fumes
Rally Running On Fumes
Rally Running On Fumes
In early June we shaved our 2021 EPS to $140 and our end-2020 SPX target fell to a range of 1,890-2,310. We posited that the easy gains in equities were behind us and we are not willing to play 100-200 points to the upside for a potential 1,000 point drawdown, owing to a souring macro backdrop (five key reasons underpin our cautious broad equity market stance that we outline in our recent webcast). On the eve of earnings season, investors have been obsessing with the “Fed put”, but neglecting the looming profit recession (bottom panel, Chart 1). Moreover, while markets cheered the trade truce following the recent G20 meeting, odds are high that manufacturing will remain in the doldrums as the tariff rate on $200bn of Chinese imports went up from 10% to 25% on May 10, and no tariff rollback was agreed. As a result, highly-cyclical global trade and manufacturing will likely continue to weigh on the economy for the remainder of the year. A simple liquidity indicator points to profit growth trouble into early-2020, which stands in marked contract with sell-side analysts who anticipate 10% EPS growth. Chart 2 shows the gulf gap between industrial production and broad money growth. Since 1960, this liquidity indicator has been an excellent leading indicator of SPX profit momentum and the current message is to expect a sustained deceleration in the latter. Chart 2Earnings…
Earnings…
Earnings…
BCA U.S. Equity Strategy’s four-factor macro S&P 500 profit growth model corroborates this signal and warns that a profit contraction is nearing (Chart 3). Chart 3…Trouble…
…Trouble…
…Trouble…
Following up from last week, Goldman Sachs’ U.S. Current Activity Indicator is also flashing red for SPX profit growth. Similarly, our corporate pricing power gauge is sinking steadily and underscores that a profit recession is a high probability outcome (Chart 4). Meanwhile, a longtime friend that I call “the smartest man in California” brought a slight variation of Chart 5 to my attention recently and highlighted that: “Historically, periods of falling manufacturing PMI result in larger negative earnings growth surprises as market forecasters rarely anticipate the breadth and depth of slowdowns. Profit growth trends are set to weaken further in the coming six months. Without profit growth, equity markets lack the necessary ‘oxygen’ for a durable high-quality rally, and until there is an upturn in growth momentum, rallies should be faded.” Chart 4…Proliferating
…Proliferating
…Proliferating
Chart 5Expect Downward…
Expect Downward…
Expect Downward…
Even net EPS revisions have taken a turn for the worse and are probing recent lows (Chart 6). Drilling beneath the surface is revealing. Trade-exposed sectors bear the brunt of the EPS downgrades. Tech (60% foreign sales exposure), materials, industrials, and energy are deeply in negative territory (Chart 7). On the flip side, defensive sectors are offsetting some of the cyclical sectors' weakness with health care, real estate, utilities and consumer staples hovering close to zero (Chart 8). Chart 6…Profit Surprises
…Profit Surprises
…Profit Surprises
Chart 7Net Earnings Revisions…
Net Earnings Revisions…
Net Earnings Revisions…
Chart 8…Sectorial Breakdown
…Sectorial Breakdown
…Sectorial Breakdown
With regard to the contribution to profit growth for calendar 2019, the divergences have widened significantly since our last update in early-April, with the financials sector solely holding the broad market’s profit fate in its hands. In more detail, Chart 9 shows that financials are responsible for 79% of the overall anticipated profit growth, up from 45% in early-April, whereas technology, energy and materials each have a negative profit growth contribution north of 30%.
Chart 9
Table 2 puts all these figures in perspective, and also updates the sector market capitalization and profit weights. Table 2S&P 500 Earnings Analysis
Beware Profit Recession
Beware Profit Recession
In sum, the SPX profit growth backdrop remains anemic and absent a pickup in growth momentum the risk/reward tradeoff is skewed to the down side. On a cyclical 3-12 month time horizon we remain cautious on the broad equity market. This is U.S. Equity Strategy’s view, which stands in contrast to the more sanguine equity BCA House View. This week we are making a subsurface change in an early-cyclical subgroup, and trimming a highly cyclical tech subindex. Put Consumer Discretionary Stocks On Upgrade Alert, And… Consumer discretionary stocks have marked time over the past year. But, now that the Fed is ready to ease monetary policy it will no longer pay to be bearish (Chart 10). This early-cyclical sector benefits the most from lower interest rates, and vice versa. Thus, we are putting this sector on our upgrade watch list and removing it from our high-conviction underweight list. We anticipate to execute this upgrade in coming weeks via boosting the S&P internet retail index to overweight. This subgroup is already on upgrade alert. Before triggering these upgrades, however, today we recommend a subsurface consumer discretionary move. Chart 10Lower Interest Rate Beneficiary
Lower Interest Rate Beneficiary
Lower Interest Rate Beneficiary
…Lift The Home Improvement Retailers To Neutral We are compelled to upgrade the S&P HIR index to a benchmark allocation and remove it from our high-conviction underweight list for a small relative loss. Similar to the parent GICS1 sector, HIR stocks are inversely correlated with interest rates (fed funds rate discounter shown inverted, middle panel, Chart 11), given the close residential real estate market links they enjoy (top panel, Chart 12). Now that the bond market forecasts that the Fed will cut rates four times by next July, home improvement retailers should be cheering this news. Chart 11Two Profit Boosters
Two Profit Boosters
Two Profit Boosters
Chart 12Resilient Pricing Power
Resilient Pricing Power
Resilient Pricing Power
Jumping lumber prices should be a boon to HIR same-store sales. Recent steep production curtailments in lumber yards have been a tonic to prices that have rebounded $100/tbf in a little over a month. Keep in mind, that building materials & construction supplies stores make a set margin on lumber sales and thus higher selling prices translate straight into higher profits; the opposite is also true (bottom panel, Chart 11). Home improvement retailers have been flexing their pricing power muscles recently and this represents another boost to their top line growth prospects (middle panel, Chart 12). While the recent tariff rate increase related input cost inflation has yet to hit the industry’s bottom line, it remains to be seen if HIR margins will take a hit or retailers will pass it on through further price hikes. Importantly, industry labor restraint is a welcome offset and has been a profit booster as measured by our expanding productivity gauge (bottom panel, Chart 12). Our HIR model captures all these positive forces and has likely put in a durable trough recently, signaling that a brightening backdrop looms for the S&P HIR index (Chart 13). Chart 13Model Says It No Longer Pays To Be Bearish
Model Says It No Longer Pays To Be Bearish
Model Says It No Longer Pays To Be Bearish
But prior to getting carried away up the bullish lane, these Big Box retailers have to contend with some key headwinds, and prevent us from boosting exposure to an above benchmark allocation. Residential fixed investment has been contracting for five consecutive quarters and remains a far cry from the 2006 peak as a share of output (Chart 14). Similarly, existing home sales, a key HIR demand driver, have softened recently at a time when home inventories have jumped (inventories shown inverted, top panel, Chart 15). Chart 14But, Some Headwinds…
But, Some Headwinds…
But, Some Headwinds…
Chart 15…Persist
…Persist
…Persist
As a result, remodeling activity has taken a backseat, at the margin, weighing on industry same-store sales growth (bottom panel, Chart 15). Home owners have avoided dipping into their currently rebuilt home equity to undertake renovation projects. Until the reflationary wave of lower mortgage rates rekindles single family home sales and thus remodeling activity, only a neutral weighting is warranted in the S&P HIR index. All of this has led to a sustained deterioration in HIR operating metrics with the sales-to-inventories ratio contracting at an accelerating pace. The implication is that before long, home improvement retailers may have to resort to margin-denting price concessions to clear the inventory overhang (middle panel, Chart 15). Netting it all out, rising lumber prices, melting interest rates and profit-augmenting industry productivity gains all signal that it no longer pays to be bearish the S&P HIR index. Bottom Line: Lift the S&P HIR index to neutral and remove from the high-conviction underweight list for a relative loss of 5.9% since inception. The ticker symbols for the stocks in this index are: BLBG – S5HOMI – HD, LOW. Downgrade Semi Equipment To Underweight While the post G-20 trade related entente should have boosted semi equipment stocks that garner a large slice of their revenues in China, relative share prices are below Friday’s June 28 close. A tactical trading opportunity has re-emerged, and today we recommend trimming the S&P semi equipment index to underweight on a three-to-six month time horizon, but with a tight stop at the -7% relative return mark. But before proceeding with our analysis, a brief recap of the recent history of our moves in this hyper-cyclical tech sub-index is in order. In late-November 2017 we recommended a high-conviction underweight position in the S&P semi equipment index at the height of the bitcoin fever.2 In mid-December 2018 we swung for the fences and upgraded this niche semi index to overweight as the street had finally capitulated and became extremely bearish on semi equipment stocks.3 Finally in early-March 2019 we booked handsome profits in this trade and moved to the sidelines (vertical lines denote recommendation changes, Chart 16).4 Semi equipment stocks are capital intensive, require precision manufacturing and their sales cycle is a carbon copy of the broad manufacturing cycle. The middle panel of Chart 17 shows this tight positive correlation with the ISM manufacturing index and sends a grim message for semi equipment manufacturers. Chart 16Time To Fade Semi Equipment Stocks
Time To Fade Semi Equipment Stocks
Time To Fade Semi Equipment Stocks
Chart 17Chip Equipment Equities Follow The Manufacturing Cycle
Chip Equipment Equities Follow The Manufacturing Cycle
Chip Equipment Equities Follow The Manufacturing Cycle
Global trade and manufacturing continue to contract and, specifically, the EM manufacturing PMI is below the 50 boom/bust line (second panel, Chart 18). Tack on elevated policy uncertainty, and the implication is that investors should sell semi equipment stock strength (top panel, Chart 18). Growth-sensitive financial variables also signal a challenging backdrop for relative share prices. Not only are emerging market stocks trailing their global peers year-to-date, but EM Asian currencies are also exerting downward pull on the relative share price ratio (third & bottom panels, Chart 18). Finally, with regard to industry operating metrics, the news is equally glum. Global semi cycles typically last four-to-five quarters and we only just passed the half way mark. Thus, there is more downside to industry sales momentum and we would lean against recent analyst relative revenue euphoria (middle panel, Chart 19). Asian DRAM prices are deflating, and this semi equipment industry pricing power proxy emits a similarly weak signal for top line growth (bottom panel, Chart 19). Chart 18Financial Variables Say Sell
Financial Variables Say Sell
Financial Variables Say Sell
Chart 19Lean Against Recovering Top Line Growth Estimates
Lean Against Recovering Top Line Growth Estimates
Lean Against Recovering Top Line Growth Estimates
Summing it all up, poor revenue growth prospects, the ongoing global manufacturing contraction and downbeat financial variables all indicate that semi equipment stocks have ample downside. Bottom Line: Downgrade the S&P semiconductor equipment index to underweight on a tactical basis (three-to-six month horizon), but set a tight stop at the -7% relative return mark. The ticker symbols for the stocks in this index are: BLBG – S5SEEQ– AMAT, LRCX, KLAC. Anastasios Avgeriou, U.S. Equity Strategist anastasios@bcaresearch.com Footnotes: 1 Please see BCA U.S. Equity Strategy Report, “SPX 3,000?” dated July 10, 2017, available at uses.bcaresearch.com. 2 Please see BCA U.S. Equity Strategy Weekly Report, “2018 High-Conviction Calls” dated November 27, 2017, available at uses.bcaresearch.com. 3 Please see BCA U.S. Equity Strategy Weekly Report, “Signal Vs. Noise” dated December 17, 2018, available at uses.bcaresearch.com. 4 Please see BCA U.S. Equity Strategy Weekly Report, “The Good, The Bad And The Ugly” dated March 4, 2019, available at uses.bcaresearch.com. Current Recommendations Current Trades Size And Style Views Favor value over growth Favor large over small caps
Highlights The Chinese economy slowed in May following two months of improvement, but the June PMI data suggests that the pace of decline is moderating. Still, the economy remains highly vulnerable in a full-tariff scenario. This weekend’s agreement to continue trade talks was a weaker result compared with what emerged from the G20 meeting in Argentina, and did not represent any real progress toward a final trade agreement that includes a substantial tariff rollback. Our 6-12 month investment outlook remains unchanged: Chinese stocks face potentially acute near-term risks, but are likely to outperform global stocks over the coming year as mounting economic weakness forces policymakers to overcome their reluctance to act and to ultimately stimulate as needed. Feature The Caixin PMI decline in June appears to have been preceded by the official PMI in May. No change in the latter in June is thus somewhat encouraging. Tables 1 and 2 on pages 2 and 3 highlight key developments in China’s economy and its financial markets over the past month. On the growth front, May’s activity data shows that the economy slowed following two months of improvement, which underscores that the budding, credit-driven recovery in China’s investment relevant economic activity remains in its infancy and is vulnerable to a further deterioration in external demand. The Caixin manufacturing PMI fell back below the 50 mark in June, but this appears to have simply confirmed the prior decline in the official PMI. June’s official PMI was flat on the month, which in combination with only a modest further decline in new export orders, implies that the May slowdown in activity noted above did not repeat itself in June (at least not in terms of magnitude) Table 1China Macro Data Summary
China Macro And Market Review
China Macro And Market Review
Table 2China Financial Market Performance Summary
China Macro And Market Review
China Macro And Market Review
Within financial markets, Chinese stocks actively outperformed the global benchmark over the past month as the latter rallied. The rally was in response to assurances from the PBoC about the capacity to ease further if needed, and the steadily rising odds over the course of the month that a new tariff ceasefire would be reached at the G20 meeting in Osaka. While this expectation was indeed validated, our view is that the agreement to continue talks was a weaker result compared with what emerged from the G20 meeting in Argentina, and did not represent any real progress toward a final trade agreement that includes a substantial tariff rollback. As such, our 6-12 month investment outlook remains unchanged: Chinese stocks face potentially acute near-term risks, but are likely to outperform global stocks over the coming year as mounting economic weakness forces policymakers to overcome their reluctance to act and to ultimately stimulate as needed. In reference to Tables 1 and 2, we provide below several detailed observations concerning developments in China’s macro and financial market data: Chart 1A Sharp Decline In Electricity Production
A Sharp Decline In Electricity Production
A Sharp Decline In Electricity Production
China’s economy slowed in May according to the Bloomberg Li Keqiang index, after having picked up for two months in a row. While both electricity production and rail cargo volume fell in May, the former fell sharply, almost into negative territory (Chart 1). This underscores that the budding, credit-driven recovery in China’s investment relevant economic activity remains in its infancy, and that economic activity is set to deteriorate meaningfully in a full-tariff scenario. Our LKI leading indicator rose modestly in May, with all six components showing an improvement. Still, the uptrend in the indicator is slight, and is being held back by the money supply components, particularly the growth in M2. Much stronger money & credit growth will be required if Chinese economic activity relapses and no deal to end U.S. import tariffs has occurred, but policymakers are likely to be reactive rather than proactive in this regard. The picture painted by China’s housing data continues to be a story of weak housing demand arrayed against seemingly strong housing construction and stable growth in house prices. However, we noted in a May 9 joint Special Report with our Emerging Market Strategy service that the strength observed in floor space started over the past year reflected a funding strategy by cash-strapped real estate developers.1 Launching new projects aggressively last year – i.e., more property starts – allowed real estate developers to pre-sell property units in order to raise cash in a tight credit environment. On the demand side, the annual change in the PBOC’s pledged supplementary lending injection has strongly predicted floor space sold over the past four years; it remains deeply in negative territory and our measure declined in May for the 8th month in a row. Given that housing construction cannot sustainably decouple from housing demand, we expect floor space started to slow meaningfully over the coming several months absent a major pickup in housing sales. Chart 2The Flat Official PMI In June Is Somewhat Encouraging
The Flat Official PMI In June Is Somewhat Encouraging
The Flat Official PMI In June Is Somewhat Encouraging
The Caixin manufacturing PMI fell back below the 50 mark in June, but this appears to have simply confirmed the prior decline in the official PMI (Chart 2). The official PMI was flat in June with only a modest further decline in new export orders, which implies that the May slowdown in activity noted above did not repeat itself in June, at least not in terms of magnitude. Chinese stocks have rallied 8-9% over the past month in U.S. dollar terms, outpacing the EM and global equity benchmarks. The rally initially followed comments from Governor Yi Gang that the PBoC had “tremendous” room to ease monetary policy if needed, and was sustained by expectations later in the month of a second tariff truce emerging from the G20 meeting in Osaka. For China-exposed investors, the issue is not whether Chinese policymakers have the capacity to support China’s economy, but rather the willingness to ease materially. From our perspective, the renewal of trade talks with the U.S. does not represent material progress towards the ultimate removal of tariffs. But the existence of talks is likely to give Chinese authorities a reason (for now) to avoid aggressively stimulating the economy, meaning that our 6-12 month investment outlook remains unchanged. Chart 3The BAT Stocks Will Outperform China If Chinese Stocks Outperform Global
The BAT Stocks Will Outperform China If Chinese Stocks Outperform Global
The BAT Stocks Will Outperform China If Chinese Stocks Outperform Global
The significant outperformance of the investable consumer discretionary has been the most meaningful equity sector development over the past month. We have noted in past reports that changes last December to the global industry classification standard (GICS) mean that trends in investable consumer discretionary are now largely driven by Alibaba’s stock price, and Chart 3 highlights that the BAT stocks (Baidu, Alibaba, and Tencent) have indeed risen relative to the overall investable index. We noted in last month’s macro & market review that investors appeared to be wrongly conflating the risks facing Huawei (U.S. supply chain reliance) with those facing the BATs (the outlook for Chinese consumer spending), and the outperformance of the latter over the past month, as expectations mounted of another tariff truce emerging from the G20, would appear to validate this view. This implies that the outlook for the relative performance of the BATs versus the Chinese equity benchmark is likely to be the same as that of Chinese stocks versus the global benchmark: near-term risk, but likely to outperform over a 6-12 month time horizon. Chinese interbank rates fell over the past month, in response to an injection of liquidity by the PBoC following the collapse and takeover of Baoshang bank. The event marked the first takeover of a commercial bank in China since 1998, and has been described by authorities as an isolated event that was caused, in part, by the illegal use of bank funds. Market participants have clearly been concerned that Baoshang is not an isolated event; China’s 3-month interbank repo rate rose nearly 60bps from early-April to mid-June, and the PBoC’s response was intended to help prevent a significant tightening in credit conditions for China’s smaller lenders. While bad debt concerns have clearly impacted the interbank market over the past several weeks, there has been little impact on China’s onshore corporate bond market (Chart 4). Spreads on bonds rated AA+ did rise meaningfully in June, but have since nearly returned to late-May levels. We continue to recommend an overweight stance towards Chinese onshore corporate bonds, on the basis that market participants are pricing in a much higher default rate than we expect over the coming 6-12 months. The risk to Hong Kong is not the stability of the peg, but the impact of higher interest rates on an extremely leveraged economy. Chart 4The Onshore Corporate Bond Market Is Not Concerned By The Baoshang Takeover
The Onshore Corporate Bond Market Is Not Concerned By The Baoshang Takeover
The Onshore Corporate Bond Market Is Not Concerned By The Baoshang Takeover
Chart 5HKD Strength Reflects More Than Just Falling U.S. Rate Expectations
HKD Strength Reflects More Than Just Falling U.S. Rate Expectations
HKD Strength Reflects More Than Just Falling U.S. Rate Expectations
The Hong Kong dollar has strengthened significantly over the past month, with USD-HKD having retreated to the midpoint of its band. This has occurred in part because of declining U.S. interest rate expectations, but also because of a sharp rise in 3-month HIBOR versus the base rate (Chart 5). The strengthening in HIBOR seems linked to the anti-extradition bill protests, implying that HKD has strengthened due to anti-capital flight measures by the HKMA. We see no major risk to the currency peg at the moment, but discussed the negative implications of higher interest rates in Hong Kong on the region’s property market and share prices in last week’s joint report with our Emerging Market Strategy service.2 Jonathan LaBerge, CFA, Vice President Special Reports jonathanl@bcaresearch.com Footnotes 1 Please see Emerging Markets Strategy and China Investment Strategy Special Report, “China’s Property Market: Making Sense Of Divergences”, dated May 9, 2019, available at cis.bcaresearch.com. 2 Please see Emerging Markets Strategy and China Investment Strategy Special Report, “Hong Kong’s Currency Peg: Truths And Misconceptions”, dated June 27, 2019, available at cis.bcaresearch.com. Cyclical Investment Stance Equity Sector Recommendations
Overweight, High-Conviction We reiterate our high-conviction overweight call on the BCA Defense Index as three key demand drivers remain upbeat and will continue to underpin relative industry profitability. First, the global arms race is alive and well and any governments seeking to augment their defense capabilities have to solicit the U.S. defense manufacturers. U.S. defense spending is rising at a healthy clip representing the major source of revenue growth for the industry (top panel). Second, there is a space race going on with China and India working on manned missions to the moon, but recently President Trump signaled that he would like to beat both of these countries to the moon and in outer space. The defense industry also benefits when global space related demand is on the rise. Finally, cyber security remains a global threat and governments are serious about fighting it off decisively given the sensitivity of the data that cyber criminals are after. While defense stocks are not pure-play software outfits combating cyber criminals, recent industry tuck-in acquisitions include such software companies in order for defense contractors to offer one-stop shop solutions to governments. Bottom Line: The BCA Defense Index remains a secular overweight and a high-conviction overweight. Please see our most recent Weekly Report for more details. The ticker symbols for the stocks in the BCA Defense Index are: LLL, LMT, NOC, GD and RTN.
Bulletproof Defense Stocks
Bulletproof Defense Stocks

Cyber security remains a global threat and governments are serious about fighting it off decisively given the sensitivity of the data sought by cyber criminals. While defense stocks are not pure-play software outfits combating cyber criminals, recent industry…
Irrespective of the outcome of this deal, our U.S. Equity Strategy team remains overweight the pure-play BCA Defense Index on a structural basis and also reiterates its high-conviction overweight bet for this industry. Three key pillars will sustain the…
Highlights Corporate Spreads: The Fed’s dovish pivot prolongs the period of time before the yield curve inverts, thus extending the window for corporate bond outperformance. Investors should remain overweight corporate bonds, with a preference for securities rated Baa and below, where spreads remain wide relative to our fair value estimates. Yield Curve: Investors should barbell their U.S. bond portfolios, favoring long-maturity (> 10 years) and short-maturity (< 2 years) securities while avoiding the 5-year and 7-year notes. This positioning will boost average portfolio yield and will benefit from any future hawkish re-assessment of Fed policy. MBS: Lower mortgage rates have led to a jump in mortgage refinancings and wider MBS spreads. However, MBS spreads remain quite low compared to history. Maintain a neutral allocation to MBS in U.S. bond portfolios. Feature Last December, we laid out our key fixed income themes for 2019 in a Special Report.1 In that report we also introduced a framework for splitting the economic cycle into three phases based on the slope of the yield curve. Specifically, we use the 3-year/10-year Treasury slope to divide each cycle into the following three phases:2 Phase 1 runs from the end of the last recession until the 3/10 slope flattens to below 50 bps. Phase 2 encompasses the period when the 3/10 slope is between 0 bps and 50 bps. Phase 3 begins after the 3/10 slope inverts and ends at the start of the next recession. Clearly, as is illustrated in Chart 1, we are smack dab in the middle of a Phase 2 environment. This has implications for how we should think about positioning a U.S. bond portfolio. Chart 1Firmly In Phase 2
Firmly In Phase 2
Firmly In Phase 2
What Makes The Middle Phase Awkward? Table 1 shows annualized excess returns for Treasuries and corporate bonds (both investment grade and high-yield) in each phase of every cycle stretching back to the mid-1970s. Treasury excess returns are calculated relative to cash, as a proxy for the returns from taking duration risk. Corporate excess returns are relative to a duration-matched position in Treasury securities. Table 1Bond Performance In Different Yield Curve Regimes
The Long Awkward Middle Phase
The Long Awkward Middle Phase
A look at Table 1 reveals why we call Phase 2 the “awkward” middle phase of the cycle. The excess returns earned from taking both duration and corporate spread risk tend to be underwhelming. On duration, we observe that in three of the four complete cycles in our sample, Treasury excess returns are lowest in Phase 2. This lines up well with intuition. The flatter yield curve means that Treasuries offer a lower term premium in Phase 2 than in Phase 1. Meanwhile, Phase 3 periods tend to coincide with rapid Fed rate cuts, and thus large capital gains. Phase 2 periods, in contrast, often contain Fed tightening cycles. On corporate credit, we observe that excess returns tend to be lower in Phase 2 than in Phase 1, but are usually still positive. Returns tend not to turn consistently negative until after the 3/10 slope inverts and we enter Phase 3. Overall, if we know nothing other than that we are in Phase 2 of the cycle, our results suggest that we should take less duration risk in our portfolio than in Phases 1 or 3. Overall, if we know nothing other than that we are in Phase 2 of the cycle, our results suggest that we should take less duration risk in our portfolio than in Phases 1 or 3. The results also suggest that we should prefer corporate credit over Treasuries, though to a lesser extent than in Phase 1. What Makes The Middle Phase Long? In last December’s Special Report, we argued that the U.S. economy would remain in a Phase 2 environment for a long time, at least until late 2019. Our reasoning was that, in the absence of inflationary pressures, the Fed would be reluctant to tighten policy enough to invert the 3/10 curve. The Fed’s recent dovish pivot, and the resultant steepening of the curve (see Chart 1), only prolongs the current Phase 2 environment. We now think it will be well into 2020, and possibly later, before the 3/10 slope inverts and the economy enters Phase 3. One obvious investment implication of an extended Phase 2 environment is that we should remain overweight corporate bonds relative to duration-matched Treasuries. However, we also need to consider valuation before drawing too firm of a conclusion. Charts 2A and 2B show spreads for each corporate credit tier, encompassing both investment grade and high-yield, along with our spread targets. The spread targets are the median levels observed in prior Phase 2 environments, adjusted for changes in the average duration of the bond indexes over time.3 The charts reveal that Aaa-rated bonds already look expensive, while Aa and A-rated bonds are close to fairly valued. Baa-rated bonds are 13 bps cheap relative to our target, while the high-yield credit tiers offer significantly more value. Chart 2AInvestment Grade Spread Targets
Investment Grade Spread Targets
Investment Grade Spread Targets
Chart 2BHigh-Yield Spread Targets
High-Yield Spread Targets
High-Yield Spread Targets
As discussed in last week’s report, the Fed’s dovish pivot will cause corporate spreads to tighten in the near-term, but it will take longer before Treasury yields respond by moving higher.4 For Treasury yields to move higher, investors must first become convinced that the Fed’s reflationary efforts are translating into stronger global economic growth. Ultimately, we expect this will occur in the second half of this year and Treasury yields will be higher 12 months from now, as the Fed will fail to deliver the 92 bps of rate cuts that are currently priced. The flat yield curve means that the yield give-up is small, and we expect global growth to improve in the second half of the year. Bottom Line: The Fed’s dovish pivot prolongs the period of time before the yield curve inverts, thus extending the window for corporate bond outperformance. Investors should remain overweight corporate bonds, with a preference for securities rated Baa and below, where spreads remain wide relative to our fair value estimates. Investors should also keep portfolio duration low. The flat yield curve means that the yield give-up is small, and we expect global growth to improve in the second half of the year. Barbell Your Portfolio Chart 3Barbell Your Portfolio
Barbell Your Portfolio
Barbell Your Portfolio
For those unwilling or unable to deviate portfolio duration significantly from benchmark, there is another way to bet on the Fed delivering fewer cuts than are currently priced into the market. Investors can run a barbelled portfolio, favoring short-maturity (< 2 years) and long-maturity (> 10 years) securities, while avoiding the belly (5-year/7-year) of the curve. This sort of positioning has a few advantages. First, since the financial crisis, the yield curve has tended to steepen out to the 5-year/7-year point and flatten beyond that point whenever our 12-month Fed Funds Discounter rises (Chart 3). Conversely, whenever the market prices in more cuts/fewer hikes and our discounter falls, the yield curve has flattened out to the 5-year/7-year maturity point and steepened beyond that point. This correlation has been very consistent during the past few years, and continued to hold during the most recent decline in rate expectations. Notice that the 5-year yield has fallen by more than either the 2-year or 10-year yields since our Discounter's early-November peak (Table 2). Table 2The Belly Of The Curve Is Most Sensitive To Rate Expectations
The Long Awkward Middle Phase
The Long Awkward Middle Phase
The upshot is that, if rate expectations rise during the next 12 months, as we expect, the 5-year and 7-year notes will endure the most damage. The second reason why a barbelled portfolio makes sense is that valuation is very attractive. Chart 4 shows that the 5-year yield is below the yield on a duration-matched 2/10 barbell. It also shows that this 2/5/10 butterfly spread is very low relative to our model’s fair value.5 Chart 42/10 Barbell Is Attractive Versus 5-Year Bullet
2/10 Barbell Is Attractive Versus 5-Year Bullet
2/10 Barbell Is Attractive Versus 5-Year Bullet
We run similar fair value models for every possible bullet/barbell combination along the yield curve, and barbells appear universally cheap (see Appendix). Bottom Line: Investors should barbell their U.S. bond portfolios, favoring long-maturity (> 10 years) and short-maturity (< 2 years) securities while avoiding the 5-year and 7-year notes. This positioning will boost average portfolio yield and will benefit from any future hawkish re-assessment of Fed policy. MBS & Housing: The Implications Of Lower Mortgage Rates Alongside bond yields, mortgage rates have fallen sharply during the past few months, a trend that has important implications for both MBS spreads and future housing data. We consider the outlook for both. MBS Spreads Lower mortgage rates encourage homeowners to refinance their loans, and any increase in refinancing activity puts upward pressure on MBS spreads. Not surprisingly, as mortgage rates have declined we have seen a jump in the MBA Refinance Index and a widening of nominal MBS spreads (Chart 5). Chart 5MBS Spreads Still Historically Tight
MBS Spreads Still Historically Tight
MBS Spreads Still Historically Tight
While spreads have widened somewhat, they remain low compared to history (Chart 5, top panel). As such, we do not see a compelling buying opportunity in MBS. This is especially true relative to corporate credit where spreads are more attractive. Chart 6Limited Upside For Refis
Limited Upside For Refis
Limited Upside For Refis
With the mortgage rate now below 4%, our rough calculation suggests that approximately 44% of the Bloomberg Barclays Conventional 30-year MBS index is refinanceable. A regression of the MBA Refi Index versus the refinanceable share suggests a fair value of 2014 for the Refi Index, slightly above its actual level of 1950 (Chart 6). We also calculate that a further drop in the mortgage rate to below 3.5%, where it troughed in mid-2016, would increase the refinanceable share to 77%. Our regression translates this 77% share to a level of 3309 on the Refi Index. It should be noted that when the refinanceable share rose to 77% in 2016, the MBA Refi Index peaked at 2870. This means that our simple regression analysis probably overstates the surge in refis that would occur if mortgage rates fell another 50 bps. In addition, we think it’s unlikely that mortgage rates will actually fall back to 3.5%, as they did in 2016, and as such, we are hesitant to position for further MBS spread widening. The improvement in housing actitivty is not uniform across all indicators. We recommend maintaining a neutral allocation to MBS for now. If mortgage rates drop and spreads widen further in the near-term, then a buying opportunity may present itself. Housing Activity Chart 7Housing Activity: A Mixed Picture
Housing Activity: A Mixed Picture
Housing Activity: A Mixed Picture
The drop in mortgage rates will also have a significant impact on housing activity data. This is important because, as we have demonstrated in prior reports, housing activity data – particularly single-family housing starts and new homes sales – are reliable indicators of U.S. recessions and interest rates.6 By all measures, housing activity weakened significantly as mortgage rates surged in 2018. But it has improved somewhat now that mortgage rates have declined. However, the improvement is not uniform across all indicators (Chart 7): New home sales jumped sharply early this year, then fell back more recently. The current trend is neutral, with the latest monthly print very close to the 12-month moving average (Chart 7, top panel). Housing starts and permits are both trending below their respective 12-month moving averages, though by less than in 2018 (Chart 7, panel 2 & 3). Existing home sales have popped, and are now exerting upward pressure on the 12-month average (Chart 7, panel 4). Likewise for mortgage purchase applications (Chart 7, panel 5). Homebuilders also report that lower mortgage rates have led to a jump in sales activity (Chart 7, bottom panel). With mortgage rates still low, the tentative rebound in housing activity data should continue in the coming months. Looking further out, we see significantly more upside in single-family housing starts and new home sales as builders shift construction toward lower-priced properties. The Bifurcated Housing Market Beyond the large swings in mortgage rates, another trend has significantly influenced housing activity in recent years. For the past few years, homebuilders have focused their attention on higher priced homes, and that segment of the market now looks oversupplied. Data from the American Enterprise Institute Housing Center show that the recent deceleration in home prices has been driven by falling prices for the most expensive homes. Homes in the lowest price tier have seen prices accelerate (Chart 8).7 The divergence is also evident in the supply data. New home inventories are roughly consistent with average historical levels, while existing home inventories are incredibly low (Chart 9). In fact, new home inventories now represent 6.4 months of demand while existing home inventories represent 4.3 months of demand (Chart 9, panel 3). Such a wide divergence is historically rare. Chart 8An Oversupply Of High ##br##Priced Homes...
An Oversupply Of High Priced Homes...
An Oversupply Of High Priced Homes...
Chart 9...And An Undersupply Of Low Priced Homes
...And An Undersupply Of Low Priced Homes
...And An Undersupply Of Low Priced Homes
The divergence between an oversupply of new homes and an undersupply of existing homes is a result of new construction having focused on higher priced homes in recent years. The median price for a new home used to be only slightly above the median price for an existing home, but the difference shot up to above 75k during the past few years (Chart 9, bottom panel). More recently, the price differential between new and existing homes has started to fall, as builders are starting to recognize that the greater growth opportunity lies at the low-end of the market where demand is strong relative to supply. As this supply-side adjustment plays out, it will provide an additional boost to new homes sales and housing starts going forward. Appendix The following tables present the current read-outs from our butterfly spread models. We use these models to identify opportunities to take duration-neutral positions across the Treasury curve. The following two Special Reports explain the models in more detail: U.S. Bond Strategy Special Report, “Bullets, Barbells And Butterflies”, dated July 25, 2017, available at usbs.bcaresearch.com U.S. Bond Strategy Special Report, “More Bullets, Barbells And Butterflies”, dated May 15, 2018, available at usbs.bcaresearch.com Table 3 shows the raw residuals from each model. A positive value indicates that the bullet is cheap relative to the duration-matched barbell. A negative value indicates that the barbell is cheap relative to the bullet. Table 3Butterfly Strategy Valuation: Raw Residuals In Basis Points (As of June 27, 2019)
The Long Awkward Middle Phase
The Long Awkward Middle Phase
Table 4 scales the raw residuals in Table 3 by their historical means and standard deviations. This facilitates comparison between the different butterfly spreads. Table 4Butterfly Strategy Valuation: Standardized Residuals (As of June 27 2019)
The Long Awkward Middle Phase
The Long Awkward Middle Phase
Ryan Swift, U.S. Bond Strategist rswift@bcaresearch.com Footnotes 1 Please see U.S. Bond Strategy Special Report, “2019 Key Views: Implications For U.S. Fixed Income”, dated December 11, 2018, available at usbs.bcaresearch.com 2 We use the 3/10 Treasury slope in place of the more commonly referenced 2/10 slope because it is a close proxy that provides an additional 14 years of historical data. 3 For more details on how we arrive at our spread targets please see U.S. Bond Strategy Weekly Report, “The Value In Corporate Bonds”, dated February 19, 2019, available at usbs.bcaresearch.com 4 Please see U.S. Bond Strategy / Global Fixed Income Strategy Weekly Report, “The Fed’s Got Your Back”, dated June 25, 2019, available at usbs.bcaresearch.com 5 For more details on our yield curve models please see U.S. Bond Strategy Special Report, “Bullets, Barbells And Butterflies”, dated July 25, 2017, available at usbs.bcaresearch.com 6 Please see U.S. Bond Strategy Weekly Report, “More Than One Reason To Own Steepeners”, dated September 25, 2018, available at usbs.bcaresearch.com 7 Low-tier homes are those in the bottom 40% of the price distribution in each metro area. High-tier homes are those that are both in the top 20% of the price distribution and exceed the GSE loan limit by more than 25%. For further details: http://www.aei.org/wp-content/uploads/2019/06/HPA_market_conditions_report_June_2019.pdf Fixed Income Sector Performance Recommended Portfolio Specification
GAA DM Equity Country Allocation Model Update The GAA DM Equity Country Allocation model is updated as of June 28, 2019. The quant model has upgraded Sweden to the second largest overweight (from a slight underweight) mainly due to sharp improvement in the liquidity indicator. This is financed by reductions in the overweight of Germany, Italy and the downgrade of Switzerland to a slight underweight (from overweight), as shown in Table 1. Table 1Model Allocation Vs. Benchmark Weights
GAA Quant Model Updates
GAA Quant Model Updates
As shown in Table 2 and Charts 1, 2 and 3, the overall model outperformed the MSCI world benchmark by 39 bps in June, largely driven by 104 bps of outperformance from Level 2 model, offset by 10 bps of underperformance from Level 1. Directionally, six out of the 12 choices generated positive alpha. The largest contributions to the outperformance in June came from the overweight in Italy and the underweight in Japan. Since going live, the overall model has outperformed by 238 bps, with 511 bps of outperformance by the Level 2 model, offset by 2 bps of underperformance from Level 1. Table 2Performance (Total Returns In USD %)
GAA Quant Model Updates
GAA Quant Model Updates
Chart 1GAA DM Model Vs. MSCI World
GAA DM Model Vs. MSCI World
GAA DM Model Vs. MSCI World
Chart 2GAA U.S. Vs. Non U.S. Model (Level 1)
GAA U.S. Vs. Non U.S. Model (Level 1)
GAA U.S. Vs. Non U.S. Model (Level 1)
Chart 3GAA Non U.S. Model (Level 2)
GAA Non U.S. Model (Level 2)
GAA Non U.S. Model (Level 2)
Please see also the website http://gaa.bcaresearch.com/trades/allocation_performance. For more details on the models, please see Special Report, “Global Equity Allocation: Introducing The Developed Markets Country Allocation Model,” dated January 29, 2016, available at https://gaa.bcaresearch.com. Please note that the overall country and sector recommendations published in our Monthly Portfolio Update and Quarterly Portfolio Outlook use the results of these quantitative models as one input, but do not stick slavishly to them. We believe that models are a useful check, but structural changes and unquantifiable factors need to be considered too in making overall recommendations. GAA Equity Sector Selection Model Chart 4Overall Model Performance
Overall Model Performance
Overall Model Performance
The GAA Equity Sector Model (Chart 4) is updated as of June 28, 2019. The model’s relative tilts between cyclicals and defensives have changed compared to last month. The model increased its cyclical exposure by overweighting Materials on the backdrop of improvement in its momentum component. The model is therefore overweight two cyclical and two defensive sectors – Industrials, Materials, Consumer Staples and Utilities. The valuation component remains muted across all sectors. The growth component continues to favor defensive sectors so far, as an improvement in global growth hard data has not yet materialized. For more details on the model, please see the Special Report “Introducing the GAA Equity Sector Selection Model,” dated July 27, 2016, as well as the Sector Selection Model section in the Special Alert “GAA Quant Model Updates,” dated March 1, 2019 available at https://gaa.bcaresearch.com. Table 3Model’s Performance (March 1, 2019 - Current)
GAA Quant Model Updates
GAA Quant Model Updates
Table 4Current Model Allocations
GAA Quant Model Updates
GAA Quant Model Updates
Xiaoli Tang, Associate Vice President xiaoliT@bcaresearch.com Amr Hanafy, Research Associate amrh@bcaresearch.com
Highlights Portfolio Strategy Business sector selling price inflation is sinking like a stone following the bond market’s melting inflation expectations, at a time when wage inflation continues to expand smartly. There are good odds that profit margins have already peaked for the cycle, and we reiterate our cyclically cautious overall equity market view. The souring global macro backdrop, rising policy uncertainty, melting real yields and a stampede into bonds all signal that it still pays to hold global gold miners as a portfolio hedge. Three key defense manufacturers’ demand drivers – global rearmament, a space race and cyber security – remain upbeat and will continue to underpin relative industry profitability. Recent Changes There are no changes to the portfolio this week. Table 1
Waiting For Godot
Waiting For Godot
Feature The SPX fell from all-time highs last week on the eve of the G20 Trump-Xi meeting, the outcome of which will dominate trading this week. The “three hopes” rally, as we have coined it predicated upon a U.S./China trade deal, Chinese massive reflation and a fresh Fed easing cycle, is at risk of disappointment as all the good news is likely already priced into stocks. Stocks may suffer a buy the rumor sell the news setback as they did back in early-December right after the Argentina G20 meeting. Following up from last week’s charts 3-6 that generated higher-than-usual responses from clients, we were encouraged to broaden out these eighteen indicators and try to include some positive ones as it appeared that we may be cherry picking the data.1 Put differently, there must be some economic data series that would offset the grim U.S. macro backdrop we painted and likely aid the Fed in its looming easing cycle. This week we update our corporate pricing power table, highlight a safe haven materials subgroup, and an industrials bulletproof subindex. With regard to the 2018 stock market related fiscal easing boost, neither corporate tax rates would drop further in 2019 nor would buybacks hit the $1tn mark this year. Already, the Standard & Poor’s reported preliminary data that showed buybacks contracted sequentially by 7.7% in Q1/2019 (top panel, Chart 1).2 Retail sales and personal consumption expenditures (PCE) are indeed expanding, however retail sales have decelerated lately (top & second panels, Chart 2). In contrast, consumer sentiment and consumer confidence are contracting on a year-over-year (yoy) basis and the U.S. leading economic indicator is steeply decelerating near 2%/annum from almost 7% at the beginning of the year (middle, fourth & bottom panels, Chart 2). Chart 1Buybacks Are Decelerating
Buybacks Are Decelerating
Buybacks Are Decelerating
Chart 2Retail Sales And PCE Are Expanding
Retail Sales And PCE Are Expanding
Retail Sales And PCE Are Expanding
The mortgage application purchase index is gaining momentum courtesy of the 125bps drop in interest rates over the past eight months. But, equity market internals suggest that some of these applications may not convert into home sales: relative homebuilders share price momentum is contracting (Chart 3). As a reminder we recently monetized relative gains of 10% in the S&P homebuilding index, since inception.3 Sticking with housing, new median single family home prices remain 10% below their 2017 zenith, and the Case-Shiller 20-city index growth rate hit the zero line recently on a month-over-month basis. New home sales are in contraction territory (Chart 4). Chart 3Are Cracks Forming…
Are Cracks Forming…
Are Cracks Forming…
Chart 4…In The Housing Market?
…In The Housing Market?
…In The Housing Market?
On the labor front, while the unemployment rate and unemployment insurance claims are both at generationally low levels, it will be extremely difficult for either of these labor market series to fall significantly from current levels. In contrast, there are rising odds that the deteriorating credit quality backdrop will soon infect the labor market (top & second panels, Chart 5). Already, “jobs are hard to get” confirming that the unemployment rate cannot fall much further from current levels (middle panel, Chart 5). Not only is credit quality deteriorating at the margin, but also loan growth is decelerating with our credit impulse diffusion indicator falling below the boom/bust line (fourth & bottom panels, Chart 5). U.S. manufacturing, the most cyclical part of the U.S. economy, is under intense pressure. The U.S./China trade tussle is the culprit. Industrial production and capacity utilization petered out last year in September and November, respectively (top & second panels, Chart 6). Chart 5Could The Labor Market Sour Next?
Could The Labor Market Sour Next?
Could The Labor Market Sour Next?
Chart 6Manufacturing Has No…
Manufacturing Has No…
Manufacturing Has No…
Chart 7…Pulse
…Pulse
…Pulse
Durable goods orders are not showing any signs of a turnaround with overall orders flirting with the zero line and core orders contracting (third panel, Chart 6). Total business sales-to-inventories are stuck in the contraction zone (bottom panel, Chart 6). Manufacturing survey data series are all in a synchronous meltdown. Seven regional Fed manufacturing surveys are all sinking (Chart 7). Such broad-based weakness bodes ill for the upcoming ISM manufacturing survey print (we went to print on Friday after the market close, and as a reminder we observed Canada Day yesterday). The ISM manufacturing new orders-to-inventories ratio sits right at one, warning that more profit trouble looms for the SPX (bottom panel, Chart 1). Keep in mind that typically the ISM manufacturing survey pulls down the ISM services one, as the former represents the most cyclical parts of the U.S. economy. Both are currently contracting on a yoy basis (Chart 8). Adding it all up, the negative economic data clearly dominate and only a handful of data series remain standing. The final tally on these indicators is fifteen negative and five positive (Chart 9). We are still awaiting a turn in the majority of the data to confirm the economy is on a solid footing. Chart 8ISM Services Survey Is Contracting
ISM Services Survey Is Contracting
ISM Services Survey Is Contracting
Chart 9
Chart 10Heed The Message From The GS Current Activity Indicator
Heed The Message From The GS Current Activity Indicator
Heed The Message From The GS Current Activity Indicator
Goldman Sachs’ Current Activity Indicator (GSCAI, a first principal component of 37 weekly and monthly data series) does an excellent job in capturing all these forces. Currently, the GSCAI is steeply decelerating, warning that SPX profit growth will surprise to the downside in coming quarters (top panel, Chart 10). Thus, we reiterate that a cyclically (3-12 month horizon) cautious equity market stance is still warranted. This is U.S. Equity Strategy’s view, which stands in contrast to the sanguine equity BCA House View. This week we update our corporate pricing power table, highlight a safe haven materials subgroup, and an industrials bulletproof subindex. Corporate Pricing Power Update U.S. Equity Strategy’s corporate sector pricing power proxy has sunk further since our last update three months ago, and is now deflating 1.1%/annum. Chart 11 shows that the last time the business sector was mired in deflation was during the 2015/16 manufacturing recession. Chart 11Profit Margin Trouble To Persist
Profit Margin Trouble To Persist
Profit Margin Trouble To Persist
However, the big difference between now and 2015/16 is that wages are currently expanding at a healthy clip, warning that the corporate sector margin squeeze will not abate any time soon. Granted, unit labor costs are indeed contracting on the back of a surge in productivity, and may thus provide a partial offset. SPX margins have been contracting for two consecutive quarters and sell-side analysts forecast that they will contract for another two. Our margin proxy corroborates this grim sell-side profit margin expectation, and similar to the 2015/2016 episode is firing a margin squeeze warning shot (bottom panel, Chart 11). Digging beneath the surface, our corporate pricing power proxy is revealing. As a reminder, we calculate industry group pricing power from the relevant CPI, PPI, PCE and commodity growth rates for each of the 60 industry groups we track. Table 2 also highlights shorter term pricing power trends and each industry's spread to overall inflation. Two thirds of the industries we cover are lifting selling prices, but only a quarter are raising prices at a faster clip than overall inflation. On a selling price inflation trend basis, 81% of the industries we cover are either flat or in a downtrend (Table 2). Table 2Industry Group Pricing Power
Waiting For Godot
Waiting For Godot
There is only one commodity-related industry in the top ten, a sea change from our late-March update when the commodity complex dominated the top ranks occupying six spots (Table 2). Interestingly, industrials have a healthy showing in the top sixteen spots with five entries. On the flip side, energy-related industries continue to populate the bottom of the ranks as WTI crude oil is still deflating from the October 2018 peak. In sum, business sector selling price inflation is sinking like a stone following the bond market’s melting inflation expectations, at a time when wage inflation continues to expand smartly. There are good odds that profit margins have already peaked for the cycle, and we reiterate our cyclically cautious overall equity market view. In sum, business sector selling price inflation is sinking like a stone following the bond market’s melting inflation expectations, at a time when wage inflation continues to expand smartly. There are good odds that profit margins have already peaked for the cycle, and we reiterate our cyclically cautious overall equity market view. Glittering Gold On March 4th, 2019 we reiterated our view that it still made sense to hold an above benchmark allocation to gold equities as a portfolio hedge.4 While our overweight position is in the red since inception, it has recouped 15% versus the broad market since our early-March update, and more gains are in store in the coming months. When global growth is in retreat investors bid up the price of the safe-haven shiny metal which in turn pulls global gold miners higher. The opposite is also true. Chart 12 shows this inverse relationship gold mining equities have with global growth. In more detail, relative share prices move inversely with the global manufacturing PMI (PMI shown inverted, Chart 12). Chart 12Gold Miners Benefit From…
Gold Miners Benefit From…
Gold Miners Benefit From…
Currently, economists, tracked by Bloomberg, have been aggressively decreasing their estimates for 2019 global real GDP growth, down 50bps year-to-date to 3.3% (bottom panel, Chart 13). Similarly, the global ZEW economic sentiment survey has collapsed to levels last hit during the great recession (top panel, Chart 14). Chart 13…Global Growth…
…Global Growth…
…Global Growth…
Chart 14…Slowdown
…Slowdown
…Slowdown
Tack on the sustained increase in global policy uncertainty with trade wars, Iranian sanctions, Brexit and Italian politics to name a few, and global gold miners are in the pole position (top panel, Chart 13). As a result, global equity risk premia have come out of hibernation and signal that the gold mining rally has more legs (middle panel, Chart 14). This souring global macro backdrop has dealt a blow to global real yields that are melting. Given that gold equities sport a low dividend yield, they are primary beneficiaries of this disinflationary global economic backdrop (real yield shown inverted, middle panel, Chart 13). Chart 15Negative Yielding Bonds Boost Global Gold Miners
Negative Yielding Bonds Boost Global Gold Miners
Negative Yielding Bonds Boost Global Gold Miners
Meanwhile, investors have been piling into global bonds and currently negative yielding bonds have surpassed the $13tn mark. Such a stampede into negative yielding bonds has been a boon to global gold mining stocks (Chart 15). This investor risk aversion is also evident in the total return stock-to-bond (S/B) ratio: bonds have been outperforming equities since late-September 2018. Since the early 1990s, relative share prices have been moving in the opposite direction of the S/B ratio, and the current message is to expect more gains in the former (S/B ratio shown inverted, Chart 16). Chart 16When Bonds Outperform Stocks, Buy Gold Miners
When Bonds Outperform Stocks, Buy Gold Miners
When Bonds Outperform Stocks, Buy Gold Miners
Chart 17A Tad Overbought, But Still Cheap
A Tad Overbought, But Still Cheap
A Tad Overbought, But Still Cheap
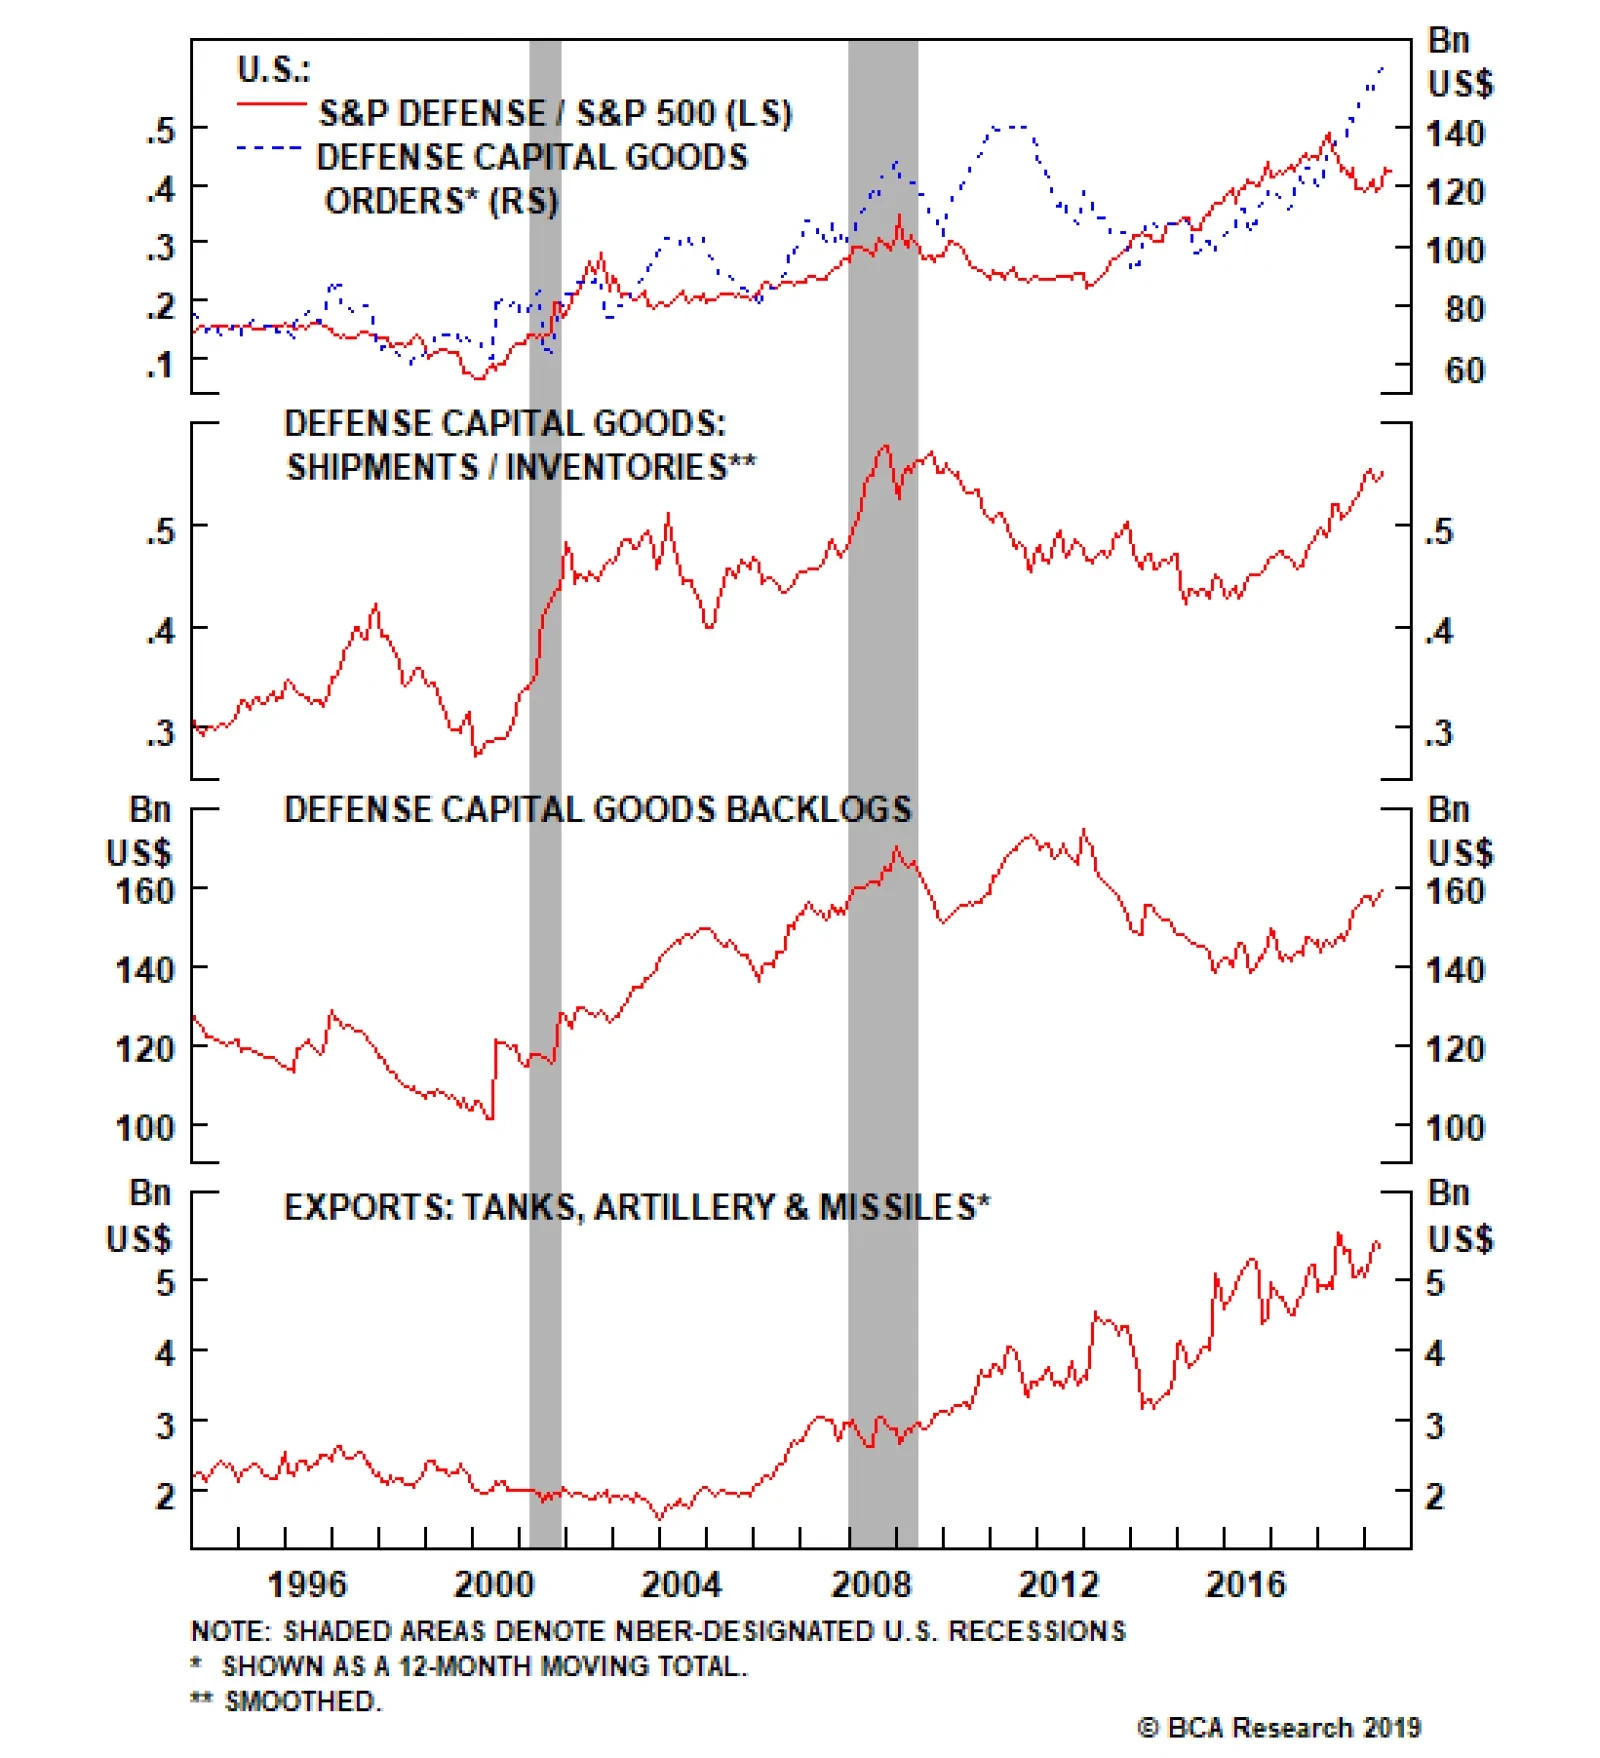
Meanwhile, the Fed is about to embark on an easing cycle courtesy of a softening economic backdrop and any insurance interest rate cuts will likely put a further dent in the dollar. The upshot is that gold is priced in U.S. dollars similar to the broad commodity complex and tends to rise in price when the greenback depreciates and vice versa. A lower trade-weighted dollar will also boost relative share prices (U.S. dollar shown inverted, bottom panel, Chart 14). Finally, while relative share prices are slightly overbought, relative valuations remain in the neutral zone (Chart 17). In sum, the souring global macro backdrop, rising policy uncertainty, melting real yields and a stampede into bonds all signal that it still pays to hold global gold miners as a portfolio hedge. Bottom Line: We remain overweight the global gold mining index. The ticker symbol for the global gold mining exchange traded fund is: GDX: US. Defense Delivers Recent M&A news in the aerospace & defense sector with UTX bidding for RTN was initially cheered by investors, but President Trump signaled that such a deal would decrease competition in the sector and U.S. regulators would block it. Irrespective of the outcome of this deal, we remain overweight the pure-play BCA Defense Index on a structural basis and also reiterate its high-conviction overweight status. Three key pillars will sustain the upbeat sales and profit backdrop for defense stocks. In sum, the souring global macro backdrop, rising policy uncertainty, melting real yields and a stampede into bonds all signal that it still pays to hold global gold miners as a portfolio hedge. First, the global arms race is alive and well and any governments seeking to augment their defense capabilities have to solicit the U.S. defense manufacturers. U.S. defense spending is rising at a healthy clip representing the major source of revenue growth for the industry (Chart 18). Defense capital goods orders have taken off and backlogs are at the highest level since 2012. The industry’s shipments-to-inventories ratio is also probing decade highs and weapons exports are near all-time highs (Chart 19). Chart 18Defense Spending Remains Upbeat
Defense Spending Remains Upbeat
Defense Spending Remains Upbeat
Chart 19Healthy Operating Metrics
Healthy Operating Metrics
Healthy Operating Metrics
Second, there is a space race going on with China and India working on manned missions to the moon, but recently President Trump signaled that he would like to beat both of these countries to the moon and in outer space. The defense industry also benefits when global space related demand is on the rise. Finally, cyber security remains a global threat and governments are serious about fighting it off decisively given the sensitivity of the data that cyber criminals are after. While defense stocks are not pure-play software outfits combating cyber criminals, recent industry tuck in acquisitions include such software companies in order for defense contractors to offer one-stop shop solutions to governments. Netting it all up, three key defense manufacturers’ demand drivers – global rearmament, a space race and cyber security – remain upbeat and will continue to underpin relative industry profitability. With regard to the financial health of the sector, balance sheets are pristine with net debt-to-EBITDA registering below the broad non-financial equity market and below 2x. Interest coverage is sky high at over 10x, again trumping the broad market. On the return on equity (ROE) front, defense stocks have the upper hand trading at an all-time high ROE of 39% or more than twice the broad market ROE (Chart 20). Looking at the valuation backdrop, relative valuations have corrected recently and defense equities no longer command a premium versus the overall market on both an EV/EBITDA and P/E basis (second & bottom panels, Chart 21). Chart 20Excellent Financial Standing
Excellent Financial Standing
Excellent Financial Standing
Chart 21Valuations Have Corrected
Valuations Have Corrected
Valuations Have Corrected
Netting it all up, three key defense manufacturers’ demand drivers – global rearmament, a space race and cyber security – remain upbeat and will continue to underpin relative industry profitability. Bottom Line: The BCA Defense Index remains a secular overweight and a high-conviction overweight. The ticker symbols for the stocks in the BCA Defense Index are: LLL, LMT, NOC, GD and RTN. Anastasios Avgeriou, U.S. Equity Strategist anastasios@bcaresearch.com Footnotes 1 Please see BCA U.S. Equity Strategy Weekly Report, “Cracks Forming” dated June 24, 2019, available at uses.bcaresearch.com. 2 https://us.spindices.com/documents/index-news-and-announcements/2019062… 3 Please see BCA U.S. Equity Strategy Insight Report, “Locking In Homebuilder Gains” dated May 22, 2019, available at uses.bcaresearch.com. 4 Please see BCA U.S. Equity Strategy Report, “The Good, The Bad And The Ugly,” dated March 4, 2019, available at uses.bcaresearch.com. Current Recommendations Current Trades Size And Style Views Favor value over growth Favor large over small caps
Banks Are Not Participating
Banks Are Not Participating
In the context of de-risking our portfolio, this past Monday we added the S&P banks index on our downgrade watch list. The Fed’s signal of a cut in the upcoming July meeting has steepened the yield curve. While the yield curve has put in higher lows in the past eight months, relative bank performance has been facing stiff resistance and has failed to follow the yield curve’s lead (top panel). With regard to credit demand, the latest Fed Senior Loan Officer survey remained subdued confirming the anemic reading from our Economic Impulse Indicator (a second derivative gauge of six parts of the U.S. economy, bottom panel). Worrisomely, not only is the overall U.S. credit impulse contracting, but also U.S. Equity Strategy’s bank credit diffusion index is collapsing (middle panel). Such broad breadth of loan growth deterioration warns that bank earnings are at risk of underwhelming still optimistic sell-side analysts’ expectations (not shown). Bottom Line: We remain overweight the S&P banks index, but have put it on downgrade alert and are looking for an opportunity to downgrade to neutral. For additional details please refer to this Monday’s Weekly Report. The ticker symbols for the stocks in this index are: BLBG: S5BANKX – WFC, JPM, BaAC, C, USB, PNC, BBT, STI, MTB, FITB, CFG, RF, KEY, HBAN, CMA, ZION, PBCT, SIVB, FRC.
Highlights Like in any currency board, Hong Kong dollar money supply is not fully backed by foreign currency (FX) reserves. Yet, the Hong Kong authorities have large FX reserves to defend the currency peg for now. Regardless, mounting capital outflows and the ensuing currency defense will lead to higher interest rates. Contrary to Hong Kong, Singapore has a flexible exchange rate regime and will begin easing monetary policy soon. Interest rates in Singapore will drop relative to Hong Kong. We are therefore reiterating our short Hong Kong / long Singaporean property stocks strategy. Feature The recent popular protests in Hong Kong against the extradition bill will likely mark a regime shift – not only in the territory’s socio-political dynamics but also in its financial outlook. It seems the local authorities are still considering an adoption of the extradition bill. For now, the bill has been suspended, but it has not been withdrawn outright. In light of elevated political uncertainty over the one-country, two-systems model, it is reasonable to assume that capital outflows from Hong Kong will rise in the coming year or so. In light of elevated political uncertainty over the one-country, two-systems model, it is reasonable to assume that capital outflows from Hong Kong will rise in the coming year or so. The question therefore becomes whether or not the Hong Kong Monetary Authority (HKMA) has sufficient foreign currency (FX) reserves to defend the Hong Kong dollar’s peg. Even though Hong Kong's broad money supply is not fully backed by FX reserves, we see no major risk to the currency peg at the moment. That said, mounting capital outflows will necessitate higher interest rates, as least relative to U.S. ones, to defend the peg. This is negative for Hong Kong’s property market and share prices. Are Hong Kong Dollars Fully Backed By FX Reserves? Hong Kong operates a linked-exchange rate system, which stipulates that its monetary base must be fully backed by FX reserves. The monetary base includes (Table I-1): The balance of the clearing accounts of banks kept with the HKMA (called the Aggregate Balance, which represents commercial banks’ excess reserves). Exchange Fund bills and notes – securities issued by the Exchange Fund to manage excess reserves/liquidity in the interbank market. Certificates of Indebtedness which are equivalent to currency in circulation. These certificates are held by note-issuing banks in exchange for their FX deposits at the Exchange Fund. The Exchange Fund is a balance sheet vehicle of the HKMA. Government-issued coins in circulation.
Chart I-
Presently, Hong Kong’s FX reserves-to-monetary base ratio is 2.2 (Chart I-1on page 1). This ratio is well above the stipulated currency board rule of one: a unit of monetary base can be issued only when it is backed by an equivalent foreign currency asset. Chart I-1HK: FX Coverage Of Monetary Base Is Well Above 1
HK: FX Coverage Of Monetary Base Is Well Above 1
HK: FX Coverage Of Monetary Base Is Well Above 1
The reason the ratio is currently more than double where it technically should be is because the HKMA’s foreign exchange reserves also include the fiscal authorities’ foreign currency deposits at the Exchange Fund. Hence, the large pool of fiscal assets converted into foreign currency and sitting in the Exchange Fund has pushed the monetary base’s coverage ratio above two. As of December 31, 2018, the Exchange Fund’s foreign currency assets consisted of HK$743 billion of its own foreign currency reserves (net FX reserves), HK$1.17 trillion of the fiscal authorities’ foreign currency deposits, and HK$485 billion of foreign currency deposits by money issuing commercial banks (Table I-1). However, broad money supply in Hong Kong is not fully backed by foreign currency reserves (Chart I-2). At 0.45, this coverage ratio entails that each HK dollar of broad money supply is backed by 0.45 USD foreign currency reserves within the Exchange Fund. Broad money supply includes currency in circulation, demand, savings and time deposits, and negotiable certificates of deposits (NCDs) issued by licensed banks. Chart I-2HK: FX Coverage Of HK Dollars Is Only 0.45
HK: FX Coverage Of HK Dollars Is Only 0.45
HK: FX Coverage Of HK Dollars Is Only 0.45
Crucially, broad money supply does not include commercial banks’ reserves at the central bank in any economy, including Hong Kong. The pertinent measure of any exchange rate backing is the ratio of FX reserves to broad money supply (all local currency deposits plus cash in circulation). The motive is that households and companies can use not only cash in circulation but also their deposits to acquire foreign currency. With the ratio standing at 0.45, the Hong Kong monetary authorities do not have sufficient amounts of U.S. dollars to guarantee the exchange of each unit of local currency (cash in circulation and all deposits) into U.S. dollars in the event of a full-blown flight out of HK dollars. It is essential to clarify that the monetary authorities in Hong Kong have not deviated from the original framework of the currency board. This exchange rate mechanism was devised in 1983 in such a way that only the monetary base – not broad money supply – was supposed to be backed by foreign currency. In short, any currency board entails that only the monetary base – not broad money supply - is backed by FX reserves. Hong Kong is not an exception. Nevertheless, there is widespread perception in the financial community and among economists that all Hong Kong dollars are backed by foreign currency reserves, which is incorrect. Like in any banking system, when commercial banks in Hong Kong grant loans or buy assets from non-banks, they create local currency deposits “out of thin air.” These deposits are not backed by foreign currency, and commercial banks that create these deposits are not obliged to deposit FX reserves at the Exchange Fund. The credit boom in Hong Kong has accelerated since 2009 (Chart I-3, top panel). Consistently, since that time, the amount of local currency deposits has mushroomed – these deposits are not backed by foreign currency (Chart I-3, bottom panel). Chart I-3Banks' Loans And Deposit Growth Go Hand-In-Hand
Banks' Loans And Deposit Growth Go Hand-In-Hand
Banks' Loans And Deposit Growth Go Hand-In-Hand
On the whole, the currency board system in Hong Kong and elsewhere cannot guarantee full convertibility of broad money supply (all types of deposits). Therefore, these currency regimes are ultimately based on confidence. If and when confidence in the exchange rate plummets and economic agents rush to exchange a large share of their local currency cash in circulation and deposits into foreign currency, the monetary authorities’ FX reserves will not be sufficient. That said, there is presently no basis to argue that close to 45% of Hong Kong broad money supply (cash and coins in circulation and deposits of all types) is poised to panic-flood the currency market. Hence, we do not foresee a de-pegging of the HKD exchange rate for now. The currency will continue to trade within its HKD/USD 7.75-7.85 band. Bottom Line: Like in any currency board, the Hong Kong dollars are not fully backed by its FX reserves. However, the Hong Kong authorities have large FX reserves to defend the currency peg for some time. Liquidity Strains? According to the Impossible Trinity thesis, in an economy with an open capital account, the monetary authorities can control either interest rates or the exchange rate, but not both simultaneously. Provided Hong Kong has both an open capital account and a fixed exchange rate, the monetary authorities have little control over interest rates. Balance-of-payment (BoP) dynamics determine whether the HKMA has to buy or sell foreign currency to preserve the exchange rate peg. When the BoP is in surplus, the HKMA accumulates FX reserves, and vice versa. The odds are rising that Hong Kong will begin experiencing capital outflows due to heightening political uncertainty over the one-country, two-systems model. Consistently, the BoP will swing from recurring surpluses to deficits and the HKMA will have to finance them by selling FX reserves (Chart I-4). By doing so, the monetary authorities will drain banks’ excess reserves, thereby tightening interbank liquidity. Chart I-4Balance Of Payments And FX Reserves
Balance Of Payments And FX Reserves
Balance Of Payments And FX Reserves
Chart I-5Falling Excess Reserves = Higher Interbank Rates
Falling Excess Reserves = Higher Interbank Rates
Falling Excess Reserves = Higher Interbank Rates
Notably, the HKMA’s FX reserves have plateaued, commercial banks’ excess reserves (the Aggregate Balance at the HKMA) have shrunk and money market rates have risen since 2016 (Chart I-5). Importantly, the latter has continued, even as U.S. interest rates have dropped over the past six months (Chart I-5, bottom panel). These dynamics are set to continue. To defend the HKD’s fixed exchange rate, interest rates in Hong Kong should rise and stay above those in the U.S. This will be the equivalent of pricing in a risk premium in Hong Kong rates due to higher political uncertainty in domestic politics as well as the ongoing U.S.-China trade confrontation. To defend the HKD’s fixed exchange rate, interest rates in Hong Kong should rise and stay above those in the U.S. On a positive note, the HKMA has ample room to mitigate liquidity strains resulting from FX interventions. In years when the BoP was in surplus, to prevent HKD appreciation the authorities purchased substantial amounts of U.S. dollars. As a result, the aggregate balance/excess reserves swelled, and Exchange Fund bills and notes were issued to absorb excess reserves (Chart I-6). Chart I-6HK Authorities Have Large Liquidity Firepower
HK Authorities Have Large Liquidity Firepower
HK Authorities Have Large Liquidity Firepower
Going forward, with capital outflows causing tightening liquidity, the HKMA can redeem its own bills and notes to replenish the Aggregate Balance. This will ease interbank liquidity and preclude interest rates from shooting up dramatically. The HKMA’s liquidity firepower is sizable: the amount of Exchange Fund bills and notes is more than HK$1 trillion. This compares with aggregate balance (excess reserves) of HK$55 billion. Hence, potential interbank liquidity is HK$1.1 trillion (the Aggregate Balance plus the Exchange Fund’s bills and notes) (Chart I-6, top panel). There is no way to guesstimate potential capital outflows from Hong Kong. Hence, it is difficult to know what the equilibrium level of the interest rate spread over U.S. rates will be. The market will be re-balancing continuously, and the interest rate differential will fluctuate – i.e., it will be a moving target that ensures the fixed value of the currency. Bottom Line: Odds are that market-based interest rates in Hong Kong have to rise and stay above the U.S. ones for now. Heading Into Recession? With non-financial private sector debt close to 300% of GDP (Chart I-7) and property/construction and financial services sectors accounting for a large share of the economy, the Hong Kong economy is extremely sensitive to interest rates. Chart I-7Hong Kong: Leverage And Debt Servicing
Hong Kong: Leverage And Debt Servicing
Hong Kong: Leverage And Debt Servicing
Chart I-8HK Economy Is In A Cyclical Downtrend
HK Economy Is In A Cyclical Downtrend
HK Economy Is In A Cyclical Downtrend
Economic conditions have already been worsening, and any further rise in interest rates will escalate the economic downtrend: Private credit growth has decelerated and is probably heading into contraction (Chart I-8, top panel). The property market is one of the most expensive in the world. Property transactions have plunged and real estate prices will likely deflate (Chart I-8, middle panels). China’s weakening economy and subsiding Hong Kong business and investor confidence will hurt domestic demand. Retail sales volumes are already contracting (Chart I-8, bottom panel). Investment Implications The interest rate differential between Hong Kong and the U.S. has recently become positive after two and a half years of lingering below zero (Chart I-9). Odds are that it will remain positive at least over the next couple years. Therefore, even if U.S. interest rates decline further, Hong Kong rates will not. This has major investment ramifications: Hong Kong stocks will likely underperform U.S. and EM equity benchmarks, as its interest rate differential with the U.S. stays on the positive side and widens further (Chart I-10). Chart I-9HK Interest Rate Spread Over U.S. Will Rise And Stay Positive
HK Interest Rate Spread Over U.S. Will Rise And Stay Positive
HK Interest Rate Spread Over U.S. Will Rise And Stay Positive
Chart I-10Higher HK Interest Rates Herald HK Equity Underperformance
Higher HK Interest Rates Herald HK Equity Underperformance
Higher HK Interest Rates Herald HK Equity Underperformance
The MSCI Hong Kong stock index is composed of financials (36% of market cap) and property stocks (26% of market cap). Therefore, domestic stocks are very sensitive to interest rates. Hong Kong companies are also very exposed to mainland growth. A recovery in the latter is not yet imminent. As a market neutral trade, we are reiterating our short Hong Kong property / long Singapore property stocks strategy. Chart I-11Favor Singapore Stocks Versus Hong Kong Ones
Favor Singapore Stocks Versus Hong Kong Ones
Favor Singapore Stocks Versus Hong Kong Ones
All of this leads us to maintain our underweight stance on Hong Kong domestic stocks versus U.S. and EM equity indexes (Chart I-10). As a market neutral trade, we are reiterating our short Hong Kong property / long Singapore property stocks strategy. Hong Kong interest rates will rise above Singapore’s, leading to the former’s equity underperformance versus the latter across property, banks and probably the overall stock index (Chart I-11). For a more detailed discussion of Singapore, please see below. Arthur Budaghyan Chief Emerging Markets Strategist arthurb@bcaresearch.com Lin Xiang, Research Analyst linx@bcaresearch.com Singapore: Monetary Easing Is Imminent Singapore’s stock market is at risk of selling off in absolute terms. However, the monetary authorities (MAS) will soon commence policy easing. This will differentiate Singapore from Hong Kong. While both Singapore and Hong Kong suffer from property and credit excesses and are facing a cyclical downtrend, the former – unlike the latter – can and will lower interest rates and allow its currency to depreciate to reflate the system. As a result, we are reiterating our short Hong Kong / long Singaporean property stocks strategy. Cyclical Headwinds Persist While both Singapore and Hong Kong suffer from property and credit excesses and are facing a cyclical downtrend, the former – unlike the latter – can and will lower interest rates and allow its currency to depreciate to reflate the system. Singapore’s cyclical growth outlook is worsening: Chart II-1 shows that the narrow money impulse is in deep contraction and the private domestic banks loans impulse is dipping into negative territory anew. The property sector – which is an important driver of Singapore’s economy – is depressed. Residential units sold has dipped, the high-end condominium market is virtually frozen and housing mortgage growth has stalled. These create formidable risks for Singapore’s real estate stocks’ absolute performance (Chart II-2). The latter account for 15% of the Singaporean stock market. Chart II-1Singapore: Money / Credit Impulses
Singapore: Money / Credit Impulses
Singapore: Money / Credit Impulses
Chart II-2Singapore: Real Estate Stocks Are At Risk
Singapore: Real Estate Stocks Are At Risk
Singapore: Real Estate Stocks Are At Risk
Meanwhile, there has been no signs of improvement in both domestic demand and exports. The top panel of Chart II-3 shows that the marginal propensity to spend among both consumers and non-financial businesses is diminishing. Specifically, the impulse for overall consumer loans is negative, while retail sales are contracting (Chart II-3, bottom panel). As for the business sector, it is also slowing down. Manufacturing PMI and new orders are in a contraction zone (Chart II-4). Chart II-3Private Consumption Is Weakening
Private Consumption Is Weakening
Private Consumption Is Weakening
Chart II-4Business Sector Is Hit Hard
Business Sector is Hit Hard
Business Sector is Hit Hard
Finally, corporate profitability of listed non-financial and non-property firms has massively deteriorated in the last decade. Chart II-5 illustrates that both return on assets (ROA) and return-on-equity (ROE) have been in a downward trend and have lately plunged. Shrinking profit margins have been the result of escalating unit labor costs (Chart II-6). In other words, productivity gains among listed non-financial companies have lagged behind wage increases. Chart II-5Corporate Profitability Is At 20-Year Low
Corporate Profitability Is At 20-Year Low
Corporate Profitability Is At 20-Year Low
Chart II-6Rising Unit Labor Costs = Shrinking Profit Margins
Rising Unit Labor Costs = Shrinking Profit Margins
Rising Unit Labor Costs = Shrinking Profit Margins
Monetary Policy Will Be Relaxed Chart II-7The Central Bank Has Been Withdrawing Liquidity
The Central Bank Has Been Withdrawing Liquidity
The Central Bank Has Been Withdrawing Liquidity
The Monetary Authority of Singapore (MAS) conducts monetary policy by controlling the currency and by default allowing domestic interest rates to find their own equilibrium. Currently, the MAS’s monetary policy setting is restrictive – i.e. it is aiming to gradually appreciate the trade-weighted Singaporean dollar by withdrawing excess reserve from the banking system (Chart II-7, top panel). This in turn, is causing commercial banks to bid interbank rates higher (Chart II-7, bottom panel). Nevertheless, with the domestic growth deceleration intensifying and the private sector highly leveraged, the MAS will soon opt for policy easing. It will guide the trade-weighted exchange rate lower by injecting liquidity into the banking system and lowering interest rates. Bottom Line: The Singaporean economy needs lower rates and the MAS is not constrained by the currency peg as the HKMA is. Consequently, interest rates in Singapore will decline both in absolute terms and relative to Hong Kong ones. Investment Conclusion The cyclical downturn will deepen and Singapore share prices will drop in absolute U.S. dollar terms. Relative to the EM or the Asian benchmarks, we continue to recommend a neutral position on overall Singaporean equities for now. Importantly, Singapore is better positioned than Hong Kong because the former’s monetary authorities can lower interest rates and allow the currency to depreciate. Hong Kong monetary authorities cannot tolerate lower interest rates due to their peg to the U.S. dollar and budding capital outflows. Interest rates in Singapore will drop relative to Hong Kong. We are therefore reiterating our short Hong Kong / long Singaporean property stocks strategy (Chart I-11 on page 10). Ayman Kawtharani, Editor/Strategist ayman@bcaresearch.com Footnotes Fixed-Income, Credit And Currency Recommendations
Image
Image
Equity Recommendations