Sectors
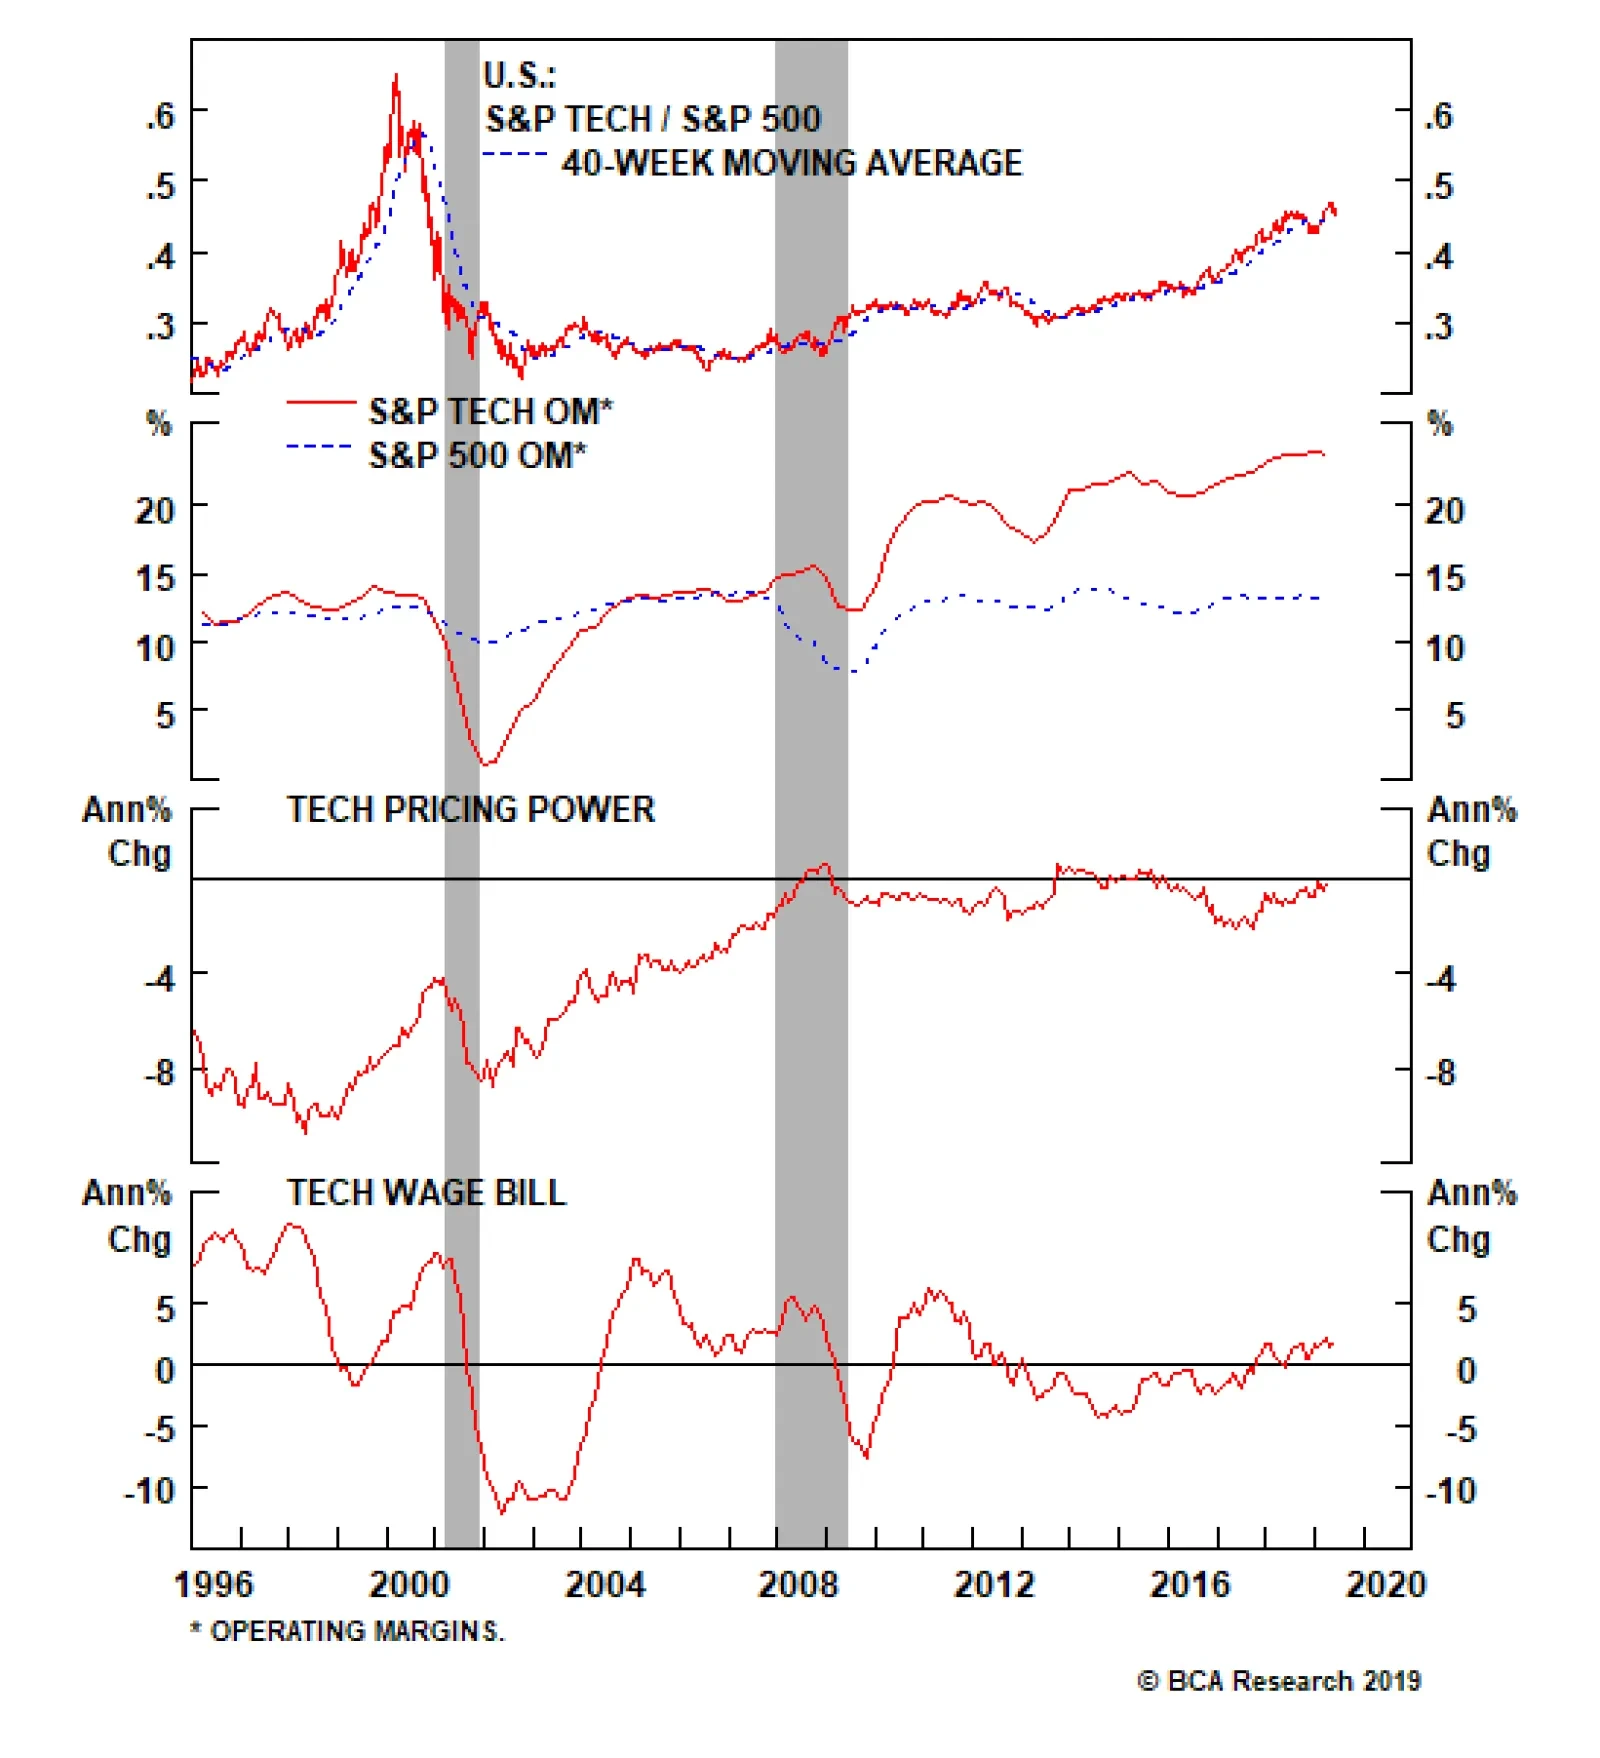
Delving deeper into operating metrics, we encounter some profit margin trouble for tech stocks. Not only do industry selling prices continue to deflate, but also our tech sector wage bill gauge is picking up steam. Taken together, all-time high profit margins…
The reason for this is that President Trump’s hawkish trade talk and actions since May 5 warn that tech revenues (60% export exposure) and profits will likely remain under intense downward pressure. The way we will execute this tech sector downgrade to…

Highlights Portfolio Strategy The risk/reward tradeoff remains squarely to the downside and we are turning cyclically (3-12 month horizon) cautious on the prospects of the broad equity market. The Presidential cycle, UBER’s IPO, the SPX hitting all-time highs following the initial December 2018 yield curve inversion, and two additional yield curve inversions signal that this time is no different and a recession is likely upon us in the coming 18 months. The re-escalation of the U.S./China trade tussle along with the risk of an antitrust investigation into Apple, waning capital outlays, softening exports and deteriorating operating conditions warn that it does not pay to be overweight the S&P tech hardware storage & peripherals (THS&P) index. Our tech EPS model is flashing red on the back of sinking capex and an appreciating U.S. dollar, deteriorating operating metrics signal that tech margins are under attack and exports are also in a freefall, suggesting that the time is ripe to put the tech sector on downgrade alert. Recent Changes Downgrade the S&P THS&P index to neutral, today. Put the S&P tech sector on downgrade alert. Table 1
A Recession Thought Experiment
A Recession Thought Experiment
Feature The SPX appeared to crack early in the week, but dovish Fed President statements saved the day and stocks recovered smartly to end the week on a high note. Our tactically (0-3 month) cautious equity market stance has served us well and has run its course. We are currently leaning toward a cyclically (3-12 month) cautious stance as a slew of our cyclical indicators have rolled over decisively. At the current juncture the big call to make is on the longevity of the business cycle. Crudely put, can the Fed engineer a soft landing or is the looming easing cycle a precursor of recession (Chart 1)? We side with the latter. Chart 1What’s The Opposite Of Bond Vigilantes?
What’s The Opposite Of Bond Vigilantes?
What’s The Opposite Of Bond Vigilantes?
This is U.S. Equity Strategy service’s view. BCA’s house view remains constructive on a cyclical 3-12 month time horizon. As a reminder, the ongoing expansion is officially the longest on record and BCA’s house view also calls for recession in late-2020/early-2021. Stan Druckenmiller once famously said “…you have to visualize the situation 18 months from now, and whatever that is, that's where the price will be, not where it is today." Thus, if BCA’s recession view is accurate then we need to start preparing the portfolio for a recessionary outcome. This week we conduct a simple thought experiment on where and why the SPX will be headed as the economy flirts with recession. But first, we rely on the message from our indicators to guide us in determining if the cycle is nearing an end. Last December parts of the yield curve slope inverted (Chart 2) and our simple insight was that the market almost always peaks following the yield curve inversion and we remained bullish on the prospects of the broad equity market and called for fresh all-time highs based on the results of our research.1 On May 1, 2019 we got confirmation as the SPX vaulted to new all-time highs, so that box is now checked. Chart 2The Yield Curve...
The Yield Curve...
The Yield Curve...
Beyond the traditional yield curve inversion that forecasts that the Fed’s next move will be a cut and eventually the cycle ends, other yield curve type indicators have inverted and also foreshadow the end of the business cycle. Charts 3A & 3B show that the unemployment gap and another labor market yield curve type indicator have both inverted signaling that the business cycle is long in the tooth. Chart 3A...Is Always Right...
...Is Always Right...
...Is Always Right...
Chart 3B...In Predicting Fed Cuts
...In Predicting Fed Cuts
...In Predicting Fed Cuts
This time is no different and the business cycle will end. Why? Because the Fed has likely raised interest rates (as we first posited on November 19, 2018 and again on December 3, 2018) by enough to trigger a default cycle in the most indebted segment of the U.S. economy where the excesses are most prominent in the current expansion: the non-financial business sector (Chart 4A). Chart 4AMind The Corporate Debt Excesses
Mind The Corporate Debt Excesses
Mind The Corporate Debt Excesses
Chart 4BDefault Cycle Looming
Default Cycle Looming
Default Cycle Looming
Already, junk bond market spreads are widening and the yield curve is predicting that a default cycle is around the corner (yield curve shown on inverted scale, bottom panel, Chart 4B). Another interesting indicator is the Presidential cycle. Chart 5 updates our work from last year showing years 2 & 3 of 17 Presidential cycles dating back to 1950. In the summer of year 3 the SPX typically peaks. Finally, the anecdote of the biggest unicorn, UBER, ipoing on May 10, 2019 also likely marks the ending of the cycle. Therefore if recession looms in the coming 18 months what is the typical magnitude of the SPX EPS drawdown and what multiple do investors pay for trough earnings? Chart 5Presidential Cycle Says Sell
Presidential Cycle Says Sell
Presidential Cycle Says Sell
While the two most recent recessionary earnings contractions have been severe, we are conservative in estimating a garden variety recession causing a 20% EPS fall. S&P 500 2018 EPS ended near $162/share. This year $167/share is likely and we are now revising down our forecast for next year to $175/share from $181/share previously. A conservative 20% drawdown sets us back to $140/share in 2021. Dating back to the late 1970s when our IBES dataset on the forward P/E multiple commences, the trough forward P/E multiple during recessions averages out to 10x (Chart 6). Remaining on a conservative path we will use 13.5x, or the recent December 2018 trough multiple as our worst case multiple and a sideways move to 16.5x as the most optimistic case. This implies an SPX ending value of between 1890 and 2310 will be reached some time in 2020, with the former resetting the equity market back near the 2016 BREXIT lows. Chart 6Trough Recession Multiple Averages 10x
Trough Recession Multiple Averages 10x
Trough Recession Multiple Averages 10x
As a result, we are not willing to play a 100-200 point advance for a potential 1000 point drawdown, the risk/reward tradeoff is to the downside. Can and has the Fed previously engineered soft landings that have caused big relief rallies in the equity market? Six times since the 1960s: once in each of the mid-1960s, early-1970s, mid-1970s, mid-1980s and mid-1990s and once in 1998 (top panel, Chart 7). Chart 7Six Mid-cycle Easing Attempts
Six Mid-cycle Easing Attempts
Six Mid-cycle Easing Attempts
Three easing cycles were not forecast by a yield curve inversion, but the mid-1960s, the mid-1990s and in 1998 the yield curve cautioned investors that an easing cycle was looming (bottom panel, Chart 7). Specifically in 1998 the Fed only acted after the equity market fell by 20%. Another interesting observation is that ex-post five of these six iterations were truly mid cycle, one was very late cycle, but none took place in year 11 of an expansion as is currently the case. We are in uncharted territory. Chart 8 shows the mean profile of the S&P 500 six months prior to and one year post the initial Fed cut. Our assumption is that a cut in July may materialize, thus the vertical line in Chart 8 denotes t=0, which is in sync with the bond market that is pricing a greater than 75% chance of this occurrence. The subsequent market rallies were significant. Our insight from this research is that we already had the explosive rally as Chart 8 depicts, owing to the Fed’s completed pivot, with the stock market rallying from the 2018 Christmas Eve lows to the May 1, 2019 all-time highs by 26%. But, the jury is still out. The biggest risk to our call is indeed a continued rally in the S&P 500 on easy money. A way to mitigate this risk of missing out on a rally is by going long SPX LEAPS Calls once a greater than 10% correction takes root. Chart 8Is The Rally Already Behind Us?
Is The Rally Already Behind Us?
Is The Rally Already Behind Us?
Keep in mind, that for the Fed to act and cut rates, stocks will likely have to breach the 2650 level, a point where a reflexive fall will further shake investor’s confidence in profit growth. In other words, the bond market is screaming that Fed cuts are looming, but it also means that stocks have ample room to fall before the Fed cuts rates, i.e. a riot point will force the Fed’s hand. Another big risk to this call is a swift positive resolution on the U.S./China trade dispute, and/or an unprecedented easing from the Chinese authorities which will put us offside as a euphoric rise will definitely ensue. Again SPX LEAPS Calls are an excellent way to position for such an outcome. Netting it all out, the risk/reward tradeoff remains squarely to the downside and we are turning cyclically (3-12 month horizon) cautious on the prospects of the broad equity market. The Presidential cycle, UBER’s IPO, the SPX hitting all-time highs following the initial December 2018 yield curve inversion, and two additional yield curve inversions signal that this time is no different and a recession is likely upon us in the coming 18 months. Thus, this week we are further de-risking the portfolio by downgrading a tech subindex to neutral, setting a tighter stop on a different long term tech subsector holding that has been the cornerstone of the equity bull market, and putting the overall tech sector on downgrade watch. Downgrade Tech Hardware Storage & Peripherals To Neutral In the context of further de-risking the portfolio we are downgrading the S&P tech hardware storage & peripherals index to a benchmark allocation and booking a small loss of 1.0% in relative terms since inception. Four reasons underpin our downgrade of this index that comprises almost 1/5 of the S&P tech market cap. First, index heavyweight Apple has 20% foreign sales exposure to the Greater China region. While we doubt the Chinese will directly retaliate to the U.S. restriction on Huawei by directly targeting Apple, it is still a risk. Moreover, recent news of the FTC and the DOJ targeting GOOGL and FB pose a risk to Apple, especially given its App Store dominance. Any negative news on either front would take a bite out of the sector’s profits. Second, capex has taken a bit hit. Chart 9 shows industry investment is almost nil and capex intentions from regional Fed surveys and from CEO confidence surveys signal more pain down the line. Third, the S&P THS&P index’s internationally sourced revenues are near the 60% mark, and computer exports are also flirting with the zero line. Worryingly, deflating EM Asian currencies are sapping consumer purchasing power and are weighing on industry exports (third panel, Chart 10). Chart 9Capex Blues
Capex Blues
Capex Blues
Chart 10Exports...
Exports...
Exports...
Similarly, global trade volumes have sunk into contractionary territory and to a level last seen during the Great Recession (not shown). With regard to export expectations the recently updated IFO World Economic Survey still points toward sustained global export ails (second panel, Chart 10). More specifically, tech laden Korean and Taiwanese exports are outright contracting at an accelerating pace and so are Chinese exports. Tack on the negative signal from the respective EM Asian stock market indices and the implication is that more profit pain looms for the S&P THS&P index (Chart 11). Finally, on the domestic front, new orders-to-inventories (NOI) have not only ground to a halt from the overall manufacturing sector, but also computer and electronic product NOI are not contracting on a short-term rate of change basis (bottom panel, Chart 10). Tracking domestic consumer outlays on computer and peripheral equipment reveals that they too have steeply decelerated from the cyclical peak reached in early 2018, painting a softening picture for industry sales growth prospects (Chart 12). Chart 11...Under Pressure
...Under Pressure
...Under Pressure
Chart 12Soft Sales Backdrop
Soft Sales Backdrop
Soft Sales Backdrop
The re-escalation of the U.S./China trade tussle along with the risk of an antitrust investigation into Apple, waning capital outlays, softening exports and deteriorating operating conditions warn that it does not pay to be overweight the S&P THS&P index. Nevertheless, before getting too bearish there is a silver lining. This index has a net debt/EBITDA of 0.5x versus the non-financial broad market of 2x. On the valuation front this tech subindex trades at 28% discount to the non-financial broad market on an EV/EBITDA basis suggesting that most of bad news is already reflected in bombed out valuations (Chart 13). The re-escalation of the U.S./China trade tussle along with the risk of an antitrust investigation into Apple, waning capital outlays, softening exports and deteriorating operating conditions warn that it does not pay to be overweight the S&P THS&P index. Bottom Line: Downgrade the S&P THS&P index to neutral for a modest relative loss of 1.0% since inception. The ticker symbols for the stocks in this index are: BLBG: S5CMPE – AAPL, HPQ, HPE, NTAP, STX, WDC, XRX. Chart 13But B/S Remains Pristine
But B/S Remains Pristine
But B/S Remains Pristine
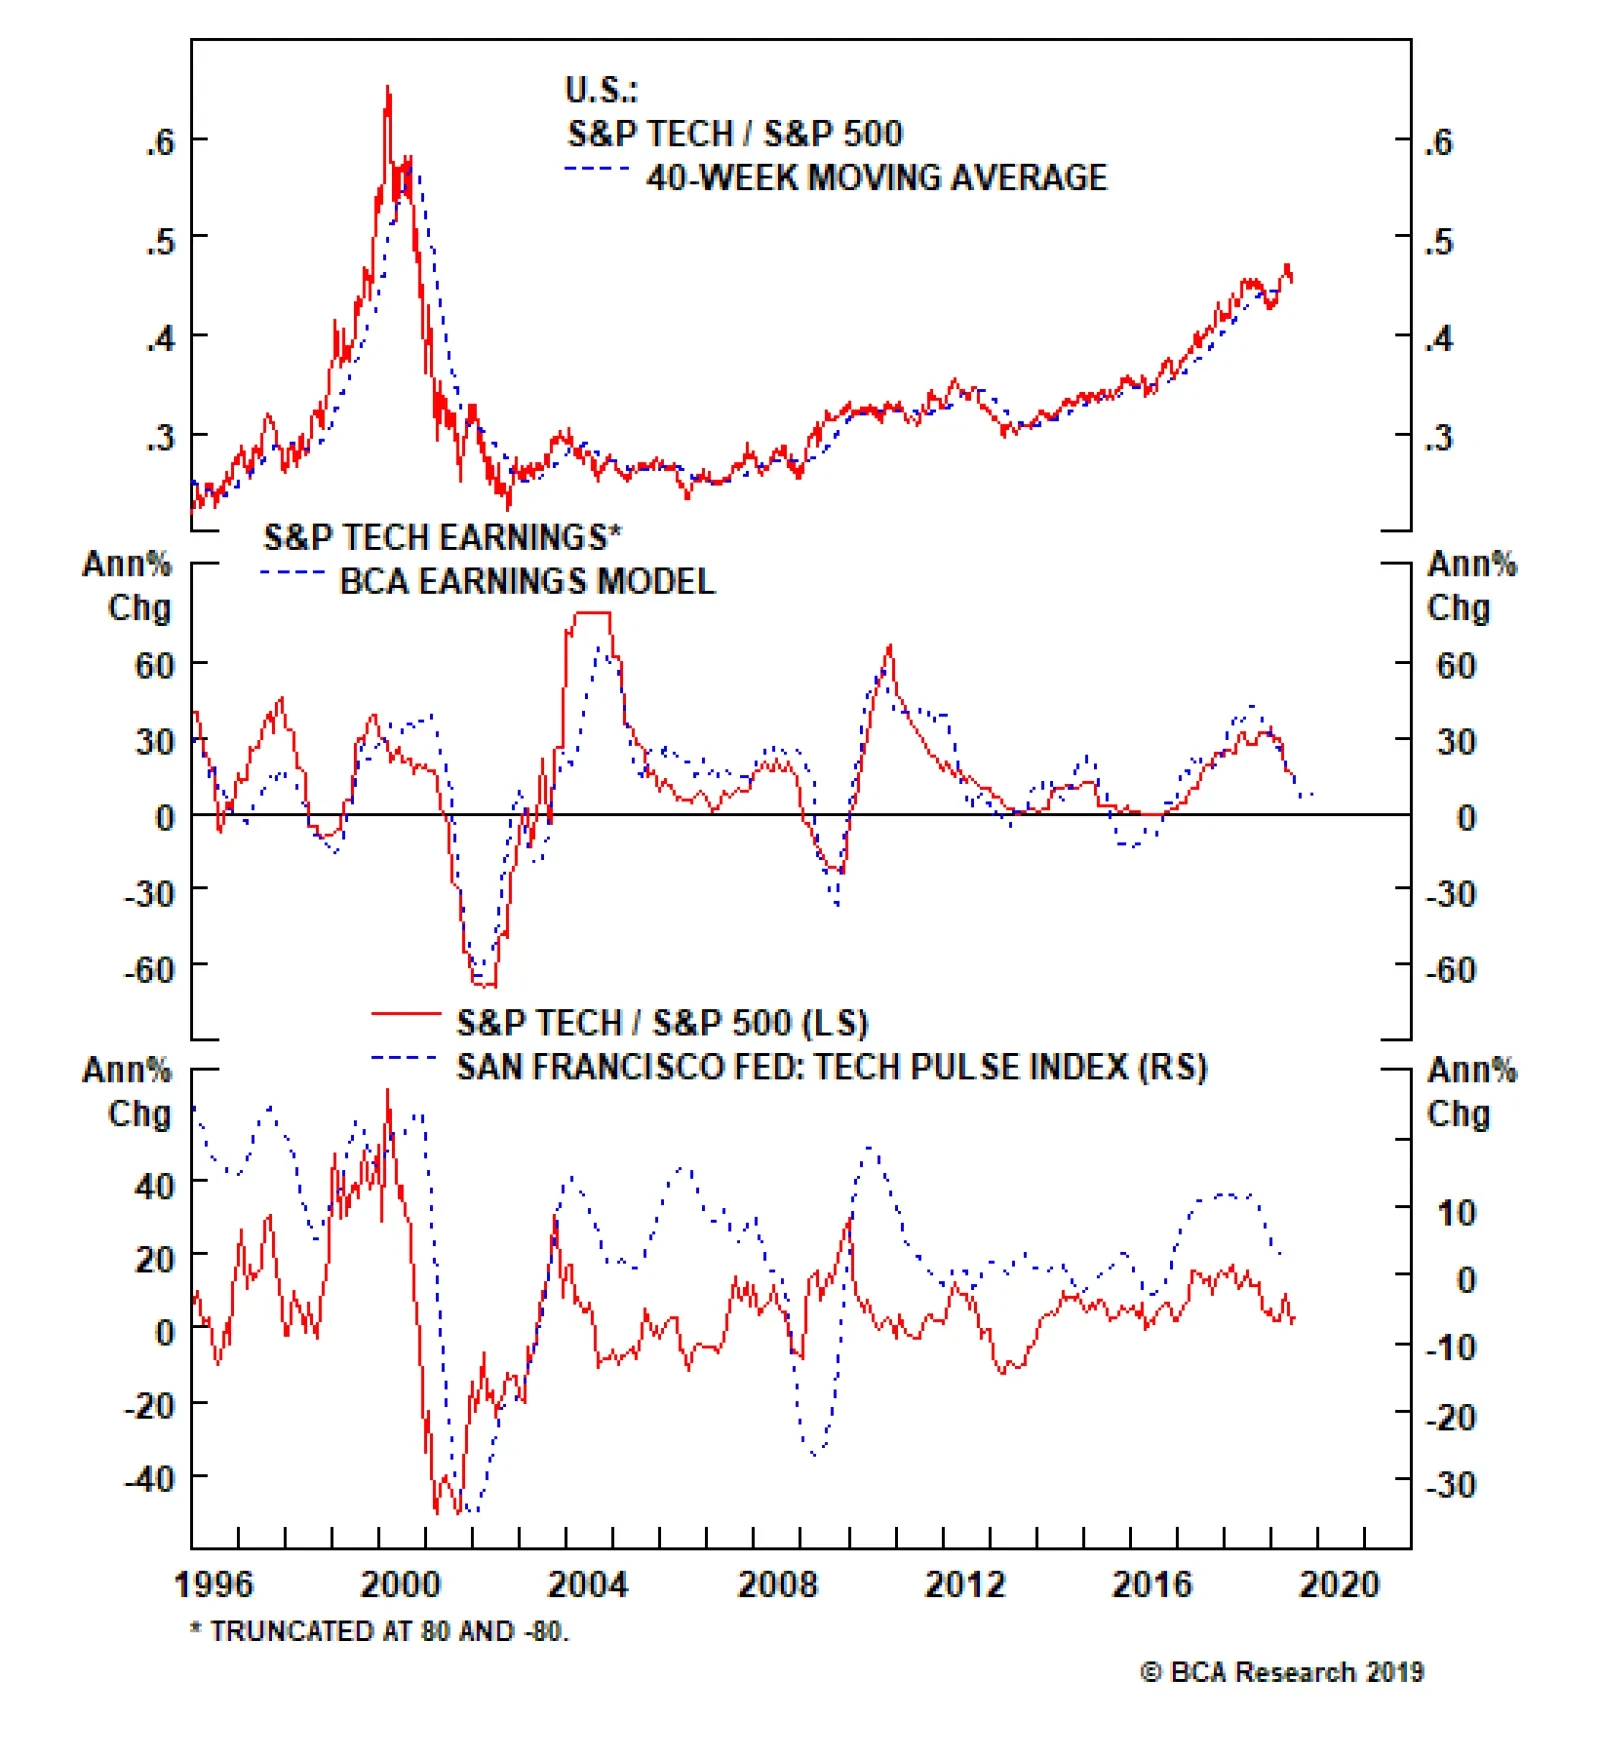
Put Tech On Downgrade Alert We are compelled to put the S&P tech sector on our downgrade watch list as President Trump’s hawkish trade talk and actions since May 5 warn that tech revenues (60% export exposure) and profits will likely remain under intense downward pressure. The way we will execute this tech sector downgrade to underweight will be via the S&P software index, the sector’s largest market cap weight. A downgrade to neutral in the S&P software index would push our S&P tech sector weight to a below benchmark allocation. Thus, we are initiating a stop near the 10% relative return mark on the S&P software high-conviction overweight call since the December 3, 2018 inception and also lift the stop to 27% from 17% relative return on the cyclical overweight we have on the S&P software index since the November 27, 2017 inception. Any near term stock market pullback will likely trigger these stops and push the tech sector to an underweight position. Stay tuned. With regard to the overall tech sector, our EPS model is on the verge of contraction on the back of sinking capex and a firming U.S. dollar (middle panel, Chart 14). In more detail, tech capex has recaptured market share swinging from below 6% to above 13% in the past decade and now has likely hit a wall similar to the late 1990s peak (second panel, Chart 15). On a rate of change basis tech capital outlays have all peaked and national data corroborate the message from stock market reported data (bottom panel, Chart 15). Chart 14Grim EPS Model Signal
Grim EPS Model Signal
Grim EPS Model Signal
Chart 15Exhausted Capex?
Exhausted Capex?
Exhausted Capex?
The San Francisco Fed’s Tech Pulse Index (comprising coincident indicators of activity in the U.S. information technology sector) is also closing in on the expansion/contraction line warning that tech stocks are in for a rough ride (bottom panel, Chart 14). Delving deeper into operating metrics, we encounter some profit margin trouble for tech stocks. Not only do industry selling prices continue to deflate, but also our tech sector wage bill gauge is picking up steam. Taken together, all-time high profit margins – double the broad market – appear unsustainable and something has to give (Chart 16). On the export relief valve front, the sector faces twin headwinds. First the trade war re-escalation suggests that an interruption/disruption of tech supply chains is a rising risk, and the firming greenback will continue to weigh on P&Ls as negative translation effects will hit Q2, Q3 and likely Q4 profits (Chart 17). Chart 16Margin Trouble
Margin Trouble
Margin Trouble
Chart 17Rising Dollar Will Weigh On Revenues & Profits
Rising Dollar Will Weigh On Revenues & Profits
Rising Dollar Will Weigh On Revenues & Profits
Netting it all out, our tech EPS model is flashing red on the back of sinking capex and an appreciating U.S. dollar, deteriorating operating metrics signal that tech margins are under attack and exports are also in a freefall, suggesting that the time is ripe to put the tech sector on downgrade alert. Nevertheless, there are two sizable offsets contrasting all the grim news. Tech stocks are effectively debt free with the net debt/EBITDA sitting on the zero line and valuations a far cry from the tech bubble era. Finally, the drop in interest rates via the 10-year yield and looming Fed cuts will underpin these growth stocks that thrive in a disinflationary backdrop (Chart 18). Netting it all out, our tech EPS model is flashing red on the back of sinking capex and an appreciating U.S. dollar, deteriorating operating metrics signal that tech margins are under attack and exports are also in a freefall, suggesting that the time is ripe to put the tech sector on downgrade alert. Bottom Line: We are compelled to put the tech sector on our downgrade watch list. We will execute the S&P tech sector downgrade to underweight when the S&P software index’s stops are triggered. This would push the S&P software index to neutral from currently overweight. Stay tuned. Chart 18But There Is An Offset: Melting Yields Help Growth Stocks
But There Is An Offset: Melting Yields Help Growth Stocks
But There Is An Offset: Melting Yields Help Growth Stocks
Anastasios Avgeriou, U.S. Equity Strategist anastasios@bcaresearch.com Footnotes 1 Please see BCA U.S. Equity Strategy Weekly Report, “Signal Vs. Noise” dated December 17, 2018, available at uses.bcaresearch.com. Current Recommendations Current Trades Size And Style Views Favor value over growth Favor large over small caps
Dear Client, Credit in China has expanded at an exponential pace, with the country’s debt-to-GDP ratio climbing from 143% to more than 250% over the last decade. The speed and scale of China’s debt surge dwarfs Japan and the U.S.’ respective credit binges in the 1980’s and 2000’s, each of which ultimately led to financial market meltdowns. Why should China’s experience be any different? Given that China has pursued a different economic model whereby the banking sector is largely state-sponsored and the currency is tightly managed by the central bank, the answer to this pressing question for global markets is the subject of spirited debate at BCA and within the investment community at large. Clients are already aware that my colleagues, Peter Berezin and Arthur Budaghyan, disagree on the macro and market ramifications of China’s decade-long credit boom. The aim of this report is to provide visibility on the root sources of the view divergence, not to reconcile the gaps. We hope these insights will help shape your own conviction about this important topic. Caroline Miller Global Strategy Feature Caroline: Arthur, your cautious outlook towards emerging markets in general and China’s prospects in particular stems from your belief that China’s economy is dangerously addicted to credit as a growth driver. Please explain why you dismiss the more sanguine view that China’s elevated debt burden is a function of an equally unusually high household savings rate. Arthur: It is simple: When people use the word “savings,” they typically and intuitively refer to bank deposits or securities investments; but this is incorrect. Chart 1 (Arthur)No Empirical Evidence That Deposits = 'Savings'
No Empirical Evidence That Deposits = 'Savings'
No Empirical Evidence That Deposits = 'Savings'
Money supply/deposits in the banking system have no relationship with the savings rate of a nation in general or households in particular (Chart 1). When households save, they do not change the amount of money supply and deposits. Hence, households’ decision to save neither alters liquidity in the banking system nor helps banks to originate loans. In fact, banks do not intermediate deposits into loans or savings into credit.1 The terms “savings” in economics does not denote an increase in the stock of money and deposits. The term “savings” in economics means the amount of goods and services produced but not consumed. When an economy produces a steel bar, it is registered as national “savings.” We cannot consume (say, eat or expense) a steel bar. Therefore, once a steel bar or any equipment is produced, economic statistics will count it as “savings.” Besides, the sole utilization of a steel bar is in capital goods and construction, and hence, it cannot be consumed. Once a steel bar is produced, both national savings and investment will rise. That is how the “savings” = “investment” identity is derived. Chart 2 (Arthur)Chinese Households Are More Leveraged Than U.S. Ones
Chinese Households Are More Leveraged Than U.S. Ones
Chinese Households Are More Leveraged Than U.S. Ones
It would avoid confusion and help everyone if economists were to call it “excess production” not “excess savings.” Banks do not need “excess production” – i.e., national “savings” – to create loans. Critically, the enormous amount of bank deposits in China is not due to household “savings” but is originated by banks “out of thin air.” In fact, Chinese households are now more leveraged than U.S. ones (Chart 2).
Chart 3
The surge of credit and money supply in China during the past 10 years has been due to animal spirits running wild among lenders and borrowers on the mainland, not its households’ “savings.” In short, the root of China’s credit bubble is not any different from Japan’s (in the 1980s), or the U.S.’ (in the 2000s) and so on. Peter: Yes, banks can create deposits “out of thin air,” as Arthur says. However, people must be willing to hold those deposits. The amount of deposits that households and businesses wish to hold reflects many things, including the interest rate paid on deposits and the overall wealth of the society. The interest rate is a function of savings. The more people save, the lower interest rates will be. And the lower interest rates are, the more demand for credit there will be (Chart 3). It’s like asking what determines how many apples are consumed. Is it how many apple trees farmers want to plant or how many apples people want to eat? The answer is both. Prices adjust so that supply equals demand. How about national wealth? To a large extent, wealth represents the accumulation of tangible capital – factories, plant and machinery, homes and office buildings: the sort of stuff that banks can use as collateral for lending. And what determines how much tangible capital a country possesses? The answer is past savings, of the exact sort Arthur is referring to: the excess of production over consumption. So this form of “economic” savings also plays an important indirect role in determining the level of bank deposits. Chart 4 (Peter)China: From Exporting Savings To Investing Domestically And Building Up Debt
China: From Exporting Savings To Investing Domestically And Building Up Debt
China: From Exporting Savings To Investing Domestically And Building Up Debt
I think the main problem with Arthur’s argument is that he is observing an accounting identity, which is that total bank assets (mostly loans) must equal liabilities (mostly deposits and capital) in equilibrium, without fully appreciating the economic forces – savings being one of them – that produce this equilibrium. In any case, the whole question of whether deposits create savings or savings create deposits misses the point. China’s fundamental problem is that it does not consume enough of what it produces. In the days when China had a massive current account surplus, it could export its excess savings abroad (Chart 4). It can’t do that anymore, so the government has consciously chosen to spur investment spending in order to prop up employment. Since a lot of investment spending is financed through credit, debt levels have risen. It really is just that simple. Arthur: First, neither the stock nor the flow of credit and deposits has any relevance to (1) the economic term “savings;” (2) a country’s capital stock; or (3) national wealth, contrary to what Peter claims. China’s broad money supply (M2) now stands at 190 trillion yuan, equivalent to US$28 trillion (Chart 5, top panel). It is equal to the size of broad money supply in the U.S. and the euro area combined (US$14 trillion each). Yet, China’s nominal GDP is only two-thirds the size of the U.S. Does the level of China’s wealth and capital stock justify it having broad money supply (US$28 trillion) equivalent to the U.S. and the euro area combined? Chart 5 (Arthur)“Helicopter” Money In China
“Helicopter” Money In China
“Helicopter” Money In China
Second, are Chinese households and companies willing to hold all RMB deposits that banks have created “out of thin air”? The answer: not really. Without capital controls, a notable portion of these deposits would have rushed into the foreign exchange markets and caused currency depreciation. Another sign of growing reluctance to hold the yuan is that households have been swapping their RMB deposits for real assets (property) at astronomical valuations. There is a bubble in China but people are looking for reasons to justify why it is different this time. Caroline: OK, let’s get away from the term “savings,” and agree that China continues to generate a chronic surplus of production of goods and services relative to consumption, and that how China chooses to intermediate that surplus is the most market-relevant issue. Arthur, you have used the terms “money bubble” and “helicopter money” in relation to China. This implies that banks are unconstrained in their ability to make loans. Just because savings don’t equal deposits, and banks can create deposits when they make loans doesn’t mean there is no relationship between the flow of credit and the stock of deposits. Arthur: Money supply and deposits expand only when banks originate a loan or buy an asset from a non-bank. In short, both credit and money/deposits are created by commercial banks “out of thin air.” This is true for any country.2 Consider a loan transaction by a German commercial bank. When it grants a €100 loan to a borrower, two accounting entries occur on its balance sheet. On the assets side, the amount of loans, and therefore total assets, increases by €100. Simultaneously, on the liabilities side, this accounting entry creates €100 of new deposits “out of thin air” (Figure 1). Hence, new purchasing power of €100 has been created via a simple accounting entry, which otherwise would not exist.
Chart
Critically, no one needed to save for this loan and money to be originated. The bank does not transfer someone else’s deposits to the borrower; it creates a new deposit when it lends. Banks also create deposits/money “out of thin air” when they buy securities from non-banks. In China, fiscal stimulus is largely financed by commercial banks – banks purchase more than 80% of government-issued bonds. This also leads to money creation. In short, when banks originate too much credit – as they have in China – they generate a money bubble. The money bubble is the mirror image of a credit bubble. Chinese banks have created 141 trillion yuan (US$21 trillion) of new money since 2009, compared with $8.25 trillion created in the U.S., euro area, and Japan combined over the same period (Chart 5, bottom panel). This is why I refer to it as “helicopter” money. Caroline: If banks need capital and liquidity to make loans, and deposits are one potential source of funds, don't these capital and liquidity constraints drive banks’ willingness and ability to lend, creating a link between the two variables? Arthur: Let me explain how mainland banks were able to circumvent those regulatory lending constraints. In 2009, they expanded their credit assets by about 30%. Even though a non-trivial portion of those loans were not paid back, banks did not recognize NPLs and instead booked large profits. By retaining a portion of those earnings, they boosted their equity, say, by 20%. As a result, the next year they were able to expand their credit assets by another 20% and so on. If banks lend and do not recognize bad loans, they can increase their equity and continue lending. With respect to liquidity, deposits are not liquidity for banks; excess reserves at the central bank are true liquidity for them. The reason why banks need to attract deposits is not to appropriate the deposits themselves, but to gain access to the excess reserves that come with them. When a person shifts her deposit from Bank A to Bank B, the former transfers a similar amount of excess reserves (liquidity) to the latter. When expanding their credit assets aggressively, banks can: (1) create more loans per one unit of excess reserves/liquidity, i.e., expand the money multiplier; and (2) borrow excess reserves/liquidity from the central bank or other banks. Chinese banks have used both channels to expand their balance sheets over the past 10 years (Chart 6). Chart 6 (Arthur)Broad Money Can Expand Without Growing Banks' Excess Reserves At The Central Bank
Broad Money Can Expand Without Growing Banks' Excess Reserves At The Central Bank
Broad Money Can Expand Without Growing Banks' Excess Reserves At The Central Bank
Crucially, commercial banks create deposits, but they cannot create excess reserves (liquidity).3 The latter are issued only by central banks “out of thin air.” So, neither deposits nor excess reserves have any relevance to household or national “savings.” Caroline: Peter, Arthur argues that Chinese credit policy has been unconstrained by the traditional metrics of capital adequacy that prevail in capitalist, free-market economies. In other words, there is no connection between the availability of funds to lend via deposits in the banking system, and the pace of credit creation. Rather, the central bank has controlled the terms and volume of lending via regulation and fiat reserve provisioning. You’ve argued that credit creation has served the greater good of propping up employment via investment spending. Moreover, you posit that countries with a surplus of production over consumption will invariably experience high levels of credit creation. Our colleague, Martin Barnes, has analyzed national savings rates (as a proxy for over-production) relative to debt-GDP ratios in other countries. The relationship doesn’t look that strong elsewhere (Chart 7). Please elaborate on why you see credit growth as an inevitable policy response to the dearth of aggregate demand we observe in China?
Chart 7
Peter: I would not say that countries with a surplus of production over consumption will invariably experience high levels of credit creation. For example, if most business investment is financed through retained earnings, you can have a lot of investment with little new debt. Debt can also result from activities not directly linked to the intermediation of savings. For instance, if you take out a mortgage to buy some land, your consumption and savings need not change, even though debt will be created. I think Arthur and I agree on this point. Thus, I am not saying that debt is always and everywhere the result of savings. I am simply pushing back against Arthur’s extremist position that debt never has anything to do with savings. Caroline: So what determines the level of debt in an economy in your view, Peter? Peter: In general, debt levels will rise if there are large imbalances between income and spending within society and/or if there are significant differences in the mix of assets people wish to hold. Think about the U.S. in the pre-financial crisis period. First, there was a surge in income inequality beginning in the early 1980s. For all intents and purposes, rich households with excess savings ended up lending their surplus income to poor households struggling to pay their bills. Overall savings did not rise, but debt levels still increased. That’s one reason why Martin’s chart doesn’t show a strong correlation between the aggregate savings rate and debt-to-GDP. Sometimes you need to look beneath the aggregate numbers to see the savings intermediation taking place. Unlike in the U.S., even poor Chinese households are net savers (Chart 8). Thus, the aggregate savings rate in China is very high4 (Chart 9). Much of these savings are funnelled to finance investment in the corporate and public sectors. This fuels debt growth.
Chart 8
Chart 9 (Peter)Chinese Households Have More Savings Than The U.S., Europe And Japan Combined
Chinese Household Savings Are More Than The U.S., Europe And Japan Combined
Chinese Household Savings Are More Than The U.S., Europe And Japan Combined
The second thing that happened in the U.S. starting in 2000 was a massive housing boom. If you bought a second home with credit, you ended up with one more asset (the house) but one more liability (the mortgage). The person who sold you the home ended up losing one asset (the house) but gaining another asset (a bigger bank deposit). The net result was both higher debt and higher bank deposits. Lending to finance asset purchases has also been a big source of debt growth in China, as it was in the U.S. before the crisis. The U.S. mortgage boom ended in tears, and so the question that we should be asking is whether the Chinese debt boom will end the same way. Arthur: We agreed not to use the term “savings,” yet Peter again refers to “savings” being funnelled into credit. As I explained above, banks do not funnel “savings” (i.e., “excess production”) into credit. China, Japan, and Germany have high “savings” rates because they produce a lot of steel, chemicals, autos, and machinery that literally cannot be consumed and, thus, are recorded as “savings.” The U.S. produces too many services that are consumed/expensed and, hence, not recorded as “savings.” That is why the U.S. has a lower “savings” rate. Chart 10 (Arthur)The Myth Of Deficient Demand In China
The Myth Of Deficient Demand In China
The Myth Of Deficient Demand In China
Economic textbook discussions on “savings” and “investment” are relevant for a barter economy where banks do not exist. When this framework is applied to modern economies with banks, it generates a lot of confusion.5 Caroline: OK, so Peter argues that an imbalance between spending and income CAN be a marker for high debt levels. Arthur, please explain why you see no relationship between China’s chronic shortfall in demand and authorities’ explicit decision to support growth via credit creation. Arthur: First, China does not have deficient demand – consumer spending and capital expenditures have been growing at 10% and 9.4%, respectively, in real terms annually compounded for the past 10 years (Chart 10). The mainland economy has been suffering from excess production, not a lack of demand. China has invested a lot (Chart 11) and ended up with too much capacity to produce steel, cement, chemicals and other materials as well as machinery and industrial goods. So, China has an excess production of goods relative to firms’ and households’ underlying demand. In a market economy, these producers would become non-profitable, halt their investments, and shut down some capacity. Chart 11 (Arthur)China Has Been Over-Investing On An Unprecedented Scale
China Has Been Over-Investing On An Unprecedented Scale
China Has Been Over-Investing On An Unprecedented Scale
In China, to keep the producers of these unwanted goods operating, the government has allowed and encouraged banks to originate loans creating new purchasing power literally “out of thin air” to purchase these goods. This has created a credit/money bubble. In a socialist system, banks do not ask debtors to repay loans and government officials are heavily involved in resource and capital allocation. China’s credit system and a growing chunk of its economy have been operating like a typical socialist system. Socialism leads to lower productivity growth for well-known reasons. With labor force growth set to turn negative, productivity is going to be the sole source of China’s potential growth rate. If the nation continues expanding this money/credit bubble to prop up zombie enterprises, its potential growth rate will fall considerably. As the potential growth rate drops, recurring stimulus will create nominal but not real growth. In short, the outcome will be stagflation. Caroline: The theoretical macro frameworks that you have both outlined make for interesting thought experiments, and spirited intellectual debate. However, investors are most concerned about the sustainability of China’s explosive credit growth, implications for the country’s growth rate, and the return on invested capital. Arthur, given your perspective on how Chinese credit policy has been designed and implemented, please outline the contours of how and when you see the music stopping, and the debt mountain crumbling. Arthur: Not every credit bubble will burst like the U.S. one did in 2008. For example, in the case of the Japanese credit bubble, there was no acute crisis. The bubble deflated gradually for about 20 years. In the cases of the U.S. (2008), Japan (1990), the euro area (2008-2014), Spain (2008-2014) and every other credit bubble, a common adjustment was a contraction in bank loans in nominal terms (Chart 12). Chart 12 (Arthur)All Credit Booms Have Been Followed By Contracting Bank Loans (I)
All Credit Booms Have Been Followed By Contracting Bank Loans
All Credit Booms Have Been Followed By Contracting Bank Loans
Chart 12 (Arthur)All Credit Booms Have Been Followed By Contracting Bank Loans (II)
All Credit Booms Have Been Followed By Contracting Bank Loans
All Credit Booms Have Been Followed By Contracting Bank Loans
Why do banks stop lending? The reason is that banks’ shareholders absorb the largest losses from credit booms. Given that banks are levered at least 20-to-1 at the peak of a typical credit boom, every $1 of non-performing loans leads to a $20 drop in their equity value. Bank shareholders halt the flow of credit to protect their wealth. Chart 13 (Arthur)China: Deleveraging Has Not Yet Begun
China: Deleveraging Has Not Yet Begun
China: Deleveraging Has Not Yet Begun
Chart 14
In fact, credit in China is still growing at a double-digit rate, above nominal GDP growth (Chart 13). Hence, aggregate deleveraging in China has not yet begun. If banks do not curtail credit origination, the music will not stop. However, uninterrupted credit growth happens only in a socialist system where banks subsidize the economy at the expense of their shareholders. But even then, there is no free lunch. Credit origination by banks also expands the money supply as discussed above. An expanding money bubble will heighten devaluation pressure on the yuan in the long run. The enormous amount of money supply/deposits – the money bubble – in China is like “the sword of Damocles” hanging over the nation’s currency. Chinese households and businesses are becoming reluctant to hold this ballooning supply of local currency. Continuous “helicopter” money will only increase their desire to diversify their RMB deposits into foreign currencies and assets. Yet, there is an insufficient supply of foreign currency to accommodate this conversion. The nation’s current account surplus has almost vanished while the central bank carries US$3 trillion in foreign exchange reserve representing only 11% of the yuan deposits and cash in circulation (Chart 14). It is inconceivable that China can open its capital account in the foreseeable future. “Helicopter” money also discourages innovation and breeds capital misallocation, which reduces productivity growth. A combination of slowing productivity growth, and thus potential GDP, and strong money growth ultimately lead to stagflation – the dynamics endemic to socialist systems. Peter: Arthur’s answer implicitly assumes that private investment would increase if the government removed credit/fiscal stimulus. But where is the evidence for that? We had just established that the Chinese economy suffers from a lack of aggregate demand. Public-sector spending, to the extent that it increases employment and incomes, crowds in private-sector investment rather than crowding it out. Ask yourself what would have happened if China didn’t build that “bridge to nowhere.” Would those displaced construction workers have found more productive work elsewhere or would they have remained idle? The answer is almost certainly the latter. After all, the reason the Chinese government built the bridge in the first place was to increase employment in an economy that habitually struggles to consume enough of what is produces. Arthur talks about the “misallocation” of resources. But doesn’t an unemployed worker also represent a misallocation of resources? In my view, it certainly does – and one that is much more threatening to social stability than an underutilized bridge or road. If you understand the point above, you will also understand why Arthur’s comparison between Chinese banks and say, U.S. banks is misplaced. The Chinese government is the main shareholder in Chinese banks. The government cares more about social stability than anything else. There is no way it would let credit growth plunge. Moreover, as the main shareholder, the government has a strong incentive to raise the share price of Chinese banks. After all, it is difficult to have a reserve currency that rivals the U.S. dollar, as China aspires to have, if your largest banks trade like penny stocks. My guess is that the Chinese government will shut down a few small banks to “show” that it is concerned about moral hazard, but then turn around and allow the larger banks to sell their troubled loans to state-owned asset management companies on very favourable terms (similar to what happened in the early 2000s). Once investors get wind that this is about to happen, Chinese bank shares will rally like crazy. Caroline: Isn’t shuffling debt from one sector of the economy to another akin to a shell game? Wouldn’t rampant debt growth eventually cause investors to lose confidence in the currency? Peter: China has a problem with the composition of its debt, not with its total value. Debt is a problem when the borrower can’t or won’t repay the loan. Chart 15 (Peter)China Is On Course To Lose More Than 400 Million Workers
China On Course To Lose More Than 400 Million Workers
China On Course To Lose More Than 400 Million Workers
I completely agree that there is too much shadow bank lending in China. There is also too much borrowing by state-owned enterprises. Ideally, the Chinese government would move all this quasi-public spending onto its own balance sheet. It would significantly raise social spending to discourage precautionary household savings. It would also adopt generous pro-natal policies — free childcare, education, government paid parental leave, and the like. The fact that the Chinese working-age population is set to shrink by 400 million by the end of the century is a huge problem (Chart 15). If the central government borrowed and spent more, state-owned companies and local governments would not have to borrow or spend as much. Banks could then increase their holding of high-quality central government bonds. Debt sustainability is only a problem if the interest rate the government faces exceeds the growth rate of the economy.6 That is manifestly not the case in China (Chart 16). And why are interest rates so low in relation to growth? Because Chinese households save so much! We simply can’t ignore the role of savings in the discussion. Chart 16 (Peter)China: High Levels Of Household Savings Have Kept Interest Rates Below The Growth Rate Of The Economy
China: High Levels Of Household Savings Have Kept Interest Rates Below The Growth Rate Of The Economy
China: High Levels Of Household Savings Have Kept Interest Rates Below The Growth Rate Of The Economy
As far as the currency is concerned, if debt growth rose so much that the economy overheated and inflation soared, then yes, the yuan would plunge. But that’s not what we are talking about here. We are talking about bringing debt growth to a level that generates just enough demand to achieve something resembling full employment. No one is calling for raising debt growth beyond that point. Curbing debt growth in a demand-deficient economy, as Arthur seems to be recommending, would cause unemployment to rise. Investors would then bet that the Chinese government would try to boost net exports by engineering a currency devaluation. Capital outflows would intensify. Far from creating the conditions for a weaker yuan, fiscal/credit stimulus obviates the need for a currency depreciation. Caroline: Peter, even if we accept your argument that the counterfactual of curbing credit growth in a demand-deficient economy would be a more deflationary outcome than sustaining the government-sponsored credit growth engine, how is building bridges to nowhere a positive sum for investors? Even if this strategy maintains social stability in the interests of the CCP’s regime preservation, won’t investors eventually recoil at the retreat to socialism that Arthur outlines, reducing the appeal of holding the yuan, even if, as you both seem to agree, no apocalyptic debt crisis is at hand? In other words, isn’t two times nothing still nothing? Peter: First of all, many of these infrastructure projects may turn out to be quite useful down the road, pardon the pun. Per capita vehicle ownership in China is only one one-fifth of what it is in the United States, and one-fourth of what it is in Japan (Chart 17). A sparsely used expressway today may be a clogged one tomorrow. Chart 17 (Peter)The Automobile Ownership Rate Is Still Quite Low In China
The Automobile Ownership Rate Is Still Quite Low In China
The Automobile Ownership Rate Is Still Quite Low In China
Would China really be better off if it had fewer infrastructure projects and more big screen TVs? An economy where people are always buying stuff they don’t need, with money they don’t have, to impress people they don’t like, is hardly a recipe for success. I am not sure what these references to socialism are supposed to accomplish. You want to see a real retreat to socialism? Try creating millions of unemployed workers with no jobs and no hope. All sorts of pundits decried Franklin Roosevelt’s New Deal as creeping socialism. The truth is that the New Deal took the wind out of the sails of the fledgling U.S. communist movement at the time. Arthur: I believe that Peter is confusing the structural and cyclical needs for stimulus. When an economy is in a recession – banks are shrinking their balance sheets and property prices are deflating – the authorities must undertake fiscal and credit stimulus. Chart 18 (Arthur)What Will Productivity Growth Look Like If Public Officials Allocate 55%-60% Of GDP?
What Will Productivity Growth Look Like If Public Officials Allocate 55%-60% Of GDP?
What Will Productivity Growth Look Like If Public Officials Allocate 55%-60% Of GDP?
Credit and fiscal stimulus made sense in China in early 2009 when growth plunged. However, over the past 10 years, we have witnessed credit and property market booms of gigantic proportions. Does this economy warrant continuous stimulus? What will productivity growth look like if government bureaucrats continuously allocate 55-60% of GDP each year (Chart 18)? Caroline: Arthur and Peter, you can both argue with one another about the semantic economic definition of the term ‘savings’, the implications of chronic excess production (relative to consumption), and the root drivers of credit growth in China long past the expiry of every BCA client’s investment horizon. Clients benefit from understanding your distinct perspectives only to the extent that they inform your outlook for markets. Will each of you now please outline how you see high levels of credit in China’s economy impacting the following over a cyclical (6-12 month) and structural (3-5 year) horizon: Global growth Commodity prices China-geared financial assets Peter: Regardless of what one thinks about the root causes of China’s high debt levels, it seems certain to me that the Chinese are going to pick up the pace of credit/fiscal stimulus over the next six months in response to slowing growth and trade war uncertainties. If anything, the incentive to open the credit spigots this time around is greater than in the past because the Chinese government wants to have a fast-growing economy to gain leverage over trade negotiations with the U.S. Chart 19 (Peter)Stronger Chinese Credit Growth Bodes Well For Commodity Prices
Stronger Chinese Credit Growth Bodes Well For Commodity Prices
Stronger Chinese Credit Growth Bodes Well For Commodity Prices
Chart 20 (Peter)The Dollar Is A Countercyclical Currency
The Dollar Is A Countercyclical Currency
The Dollar Is A Countercyclical Currency
Stronger Chinese growth will boost growth in the rest of the world. Commodity prices will rise (Chart 19). As a counter-cyclical currency, the U.S. dollar will likely peak over the next month or so and then weaken in the back half of 2019 and into 2020 (Chart 20). The combination of stronger Chinese growth, higher commodity prices, and a weaker dollar will be manna from heaven for emerging markets. If a trade truce between China and the U.S. is reached, investors should move quickly to overweight EM equities. European stocks should also benefit. Looking further out, China’s economy will slow in absolute terms. In relative terms, however, Chinese growth will remain near the top of the global rankings. China has one of the most educated workforces in the world (Chart 21). Assuming that output-per-hour reaches South Korean levels by the middle of the century, Chinese real GDP would need to expand by about 6% per year over the next decade (Chart 22). That’s a lot of growth – growth that will eventually help China outgrow its debt burden.
Chart 21
Chart 22 (Peter)China Has More Catching Up To Do
China Has More Catching Up To Do
China Has More Catching Up To Do
Keep in mind that credit growth of 1% when the debt-to-GDP ratio is 300% yields 3% of GDP in credit stimulus, compared with only 1% of stimulus when the debt-to-GDP ratio is 100%. That does not mean that more debt is intrinsically a good thing, but it does mean that China will eventually be able to slow debt growth even if excess savings remains a problem. Structurally, Chinese and EM equities will likely outperform their developed market peers over a 3-to-5 year horizon. The P/E ratio for EM stocks is currently 4.7 percentage points below that of developed markets, which is below its long-term average (Chart 23). While EM EPS growth has lagged DM earnings growth over the past eight years, the long-term trend still favors EM (Chart 24). EM currencies will appreciate over this period, with the RMB leading the way. Chart 23 (Peter)EM Stocks: Valuations Are Attractive
EM Stocks: Valuations Are Attractive
EM Stocks: Valuations Are Attractive
Chart 24 (Peter)Earnings Growth In EM Has Outpaced That Of DM Over The Long Haul
Earnings Growth In EM Has Outpaced That Of DM Over The Long Haul
Earnings Growth In EM Has Outpaced That Of DM Over The Long Haul
Arthur: China is facing a historic choice between two scenarios. Medium- and long-term macro outcomes will impact markets differently in each case. Table 1 shows my cyclical and structural investment recommendations for each scenario. Table 1 (Arthur)Arthur’s Recommended Investment Strategy For China-Geared Financial Assets
China’s Credit Cycle: A Spirited Debate
China’s Credit Cycle: A Spirited Debate
Allowing Markets to Play A Bigger Role = Lower credit growth (deleveraging), corporate restructuring, and weaker growth (Chart 25). This is bearish for growth and financial markets in the medium term but it will make Chinese stocks and the currency structural (long-term) buys. Credit/Money Boom Persists (Socialist Put) = Secular Stagnation, Inflation and Currency Depreciation: The structural outlook is downbeat but there are mini-cycles that investors could play (Chart 26). Cyclically, China-geared financial assets still remain at risk. However, lower asset prices and more stimulus in China could put a floor under asset prices later this year. Timing these mini-cycles is critical. A buy-and-hold strategy for Chinese assets will not be appropriate in this scenario. In short, capitalism is bad but socialism is worse. I hope China will pursue the first path.
Chart 25
Chart 26
Caroline: Thank you both for clarifying your perspectives. Over a multi-year horizon, markets will render the ultimate judgement on whether China’s credit boom has represented a reckless misallocation of capital, or a rational policy response to an imbalance between domestic spending and income. In the meantime, we will monitor the complexion of Chinese stimulus and evidence of its global growth multiplier effect over the coming weeks and months. These will be the key variables to watch as we determine when and at what level to upgrade BCA’s cyclical outlook for China-geared assets. Can’t wait for that debate. Footnotes 1 For a detailed discussion of these issues, please see Emerging Markets Strategy Special Reports, “Misconceptions About China's Credit Excesses,” dated October 26, 2016 and “The True Meaning Of China's Great 'Savings' Wall,” dated December 20, 2017. 2 For a detailed discussion of these issues, please see Emerging Markets Strategy Special Reports, “Misconceptions About China's Credit Excesses,” dated October 26, 2016 and “The True Meaning Of China's Great 'Savings' Wall,” dated December 20, 2017. 3 For a detailed discussion of these issues, please see Emerging Markets Strategy Special Report, “China's Money Creation Redux And The RMB,” dated November 23, 2016. 4 For a discussion on the reasons behind China’s high savings rate, please see Global Investment Strategy Weekly Report, “China’s Savings Problem,” dated January 25, 2019. 5 For a detailed discussion of these issues, please see Emerging Markets Strategy Special Report, “Is Investment Constrained By Savings? Tales Of China And Brazil,” dated March 22, 2018. 6 For a detailed discussion of these issues, please see Global Investment Strategy Weekly Report, “Is There Really Too Much Government Debt In The World?” dated February 22, 2019 and “Chinese Debt: A Contrarian View,” dated April 19, 2019.
Dear Client, Credit in China has expanded at an exponential pace, with the country’s debt-to-GDP ratio climbing from 143% to more than 250% over the last decade. The speed and scale of China’s debt surge dwarfs Japan and the U.S.’ respective credit binges in the 1980’s and 2000’s, each of which ultimately led to financial market meltdowns. Why should China’s experience be any different? Given that China has pursued a different economic model whereby the banking sector is largely state-sponsored and the currency is tightly managed by the central bank, the answer to this pressing question for global markets is the subject of spirited debate at BCA and within the investment community at large. Clients are already aware that my colleagues, Peter Berezin and Arthur Budaghyan, disagree on the macro and market ramifications of China’s decade-long credit boom. The aim of this report is to provide visibility on the root sources of the view divergence, not to reconcile the gaps. We hope these insights will help shape your own conviction about this important topic. Caroline Miller Global Strategy Feature Caroline: Arthur, your cautious outlook towards emerging markets in general and China’s prospects in particular stems from your belief that China’s economy is dangerously addicted to credit as a growth driver. Please explain why you dismiss the more sanguine view that China’s elevated debt burden is a function of an equally unusually high household savings rate. Arthur: It is simple: When people use the word “savings,” they typically and intuitively refer to bank deposits or securities investments; but this is incorrect. Chart 1 (Arthur)No Empirical Evidence That Deposits = 'Savings'
No Empirical Evidence That Deposits = 'Savings'
No Empirical Evidence That Deposits = 'Savings'
Money supply/deposits in the banking system have no relationship with the savings rate of a nation in general or households in particular (Chart 1). When households save, they do not change the amount of money supply and deposits. Hence, households’ decision to save neither alters liquidity in the banking system nor helps banks to originate loans. In fact, banks do not intermediate deposits into loans or savings into credit.1 The terms “savings” in economics does not denote an increase in the stock of money and deposits. The term “savings” in economics means the amount of goods and services produced but not consumed. When an economy produces a steel bar, it is registered as national “savings.” We cannot consume (say, eat or expense) a steel bar. Therefore, once a steel bar or any equipment is produced, economic statistics will count it as “savings.” Besides, the sole utilization of a steel bar is in capital goods and construction, and hence, it cannot be consumed. Once a steel bar is produced, both national savings and investment will rise. That is how the “savings” = “investment” identity is derived. Chart 2 (Arthur)Chinese Households Are More Leveraged Than U.S. Ones
Chinese Households Are More Leveraged Than U.S. Ones
Chinese Households Are More Leveraged Than U.S. Ones
It would avoid confusion and help everyone if economists were to call it “excess production” not “excess savings.” Banks do not need “excess production” – i.e., national “savings” – to create loans. Critically, the enormous amount of bank deposits in China is not due to household “savings” but is originated by banks “out of thin air.” In fact, Chinese households are now more leveraged than U.S. ones (Chart 2).
Chart 3
The surge of credit and money supply in China during the past 10 years has been due to animal spirits running wild among lenders and borrowers on the mainland, not its households’ “savings.” In short, the root of China’s credit bubble is not any different from Japan’s (in the 1980s), or the U.S.’ (in the 2000s) and so on. Peter: Yes, banks can create deposits “out of thin air,” as Arthur says. However, people must be willing to hold those deposits. The amount of deposits that households and businesses wish to hold reflects many things, including the interest rate paid on deposits and the overall wealth of the society. The interest rate is a function of savings. The more people save, the lower interest rates will be. And the lower interest rates are, the more demand for credit there will be (Chart 3). It’s like asking what determines how many apples are consumed. Is it how many apple trees farmers want to plant or how many apples people want to eat? The answer is both. Prices adjust so that supply equals demand. How about national wealth? To a large extent, wealth represents the accumulation of tangible capital – factories, plant and machinery, homes and office buildings: the sort of stuff that banks can use as collateral for lending. And what determines how much tangible capital a country possesses? The answer is past savings, of the exact sort Arthur is referring to: the excess of production over consumption. So this form of “economic” savings also plays an important indirect role in determining the level of bank deposits. Chart 4 (Peter)China: From Exporting Savings To Investing Domestically And Building Up Debt
China: From Exporting Savings To Investing Domestically And Building Up Debt
China: From Exporting Savings To Investing Domestically And Building Up Debt
I think the main problem with Arthur’s argument is that he is observing an accounting identity, which is that total bank assets (mostly loans) must equal liabilities (mostly deposits and capital) in equilibrium, without fully appreciating the economic forces – savings being one of them – that produce this equilibrium. In any case, the whole question of whether deposits create savings or savings create deposits misses the point. China’s fundamental problem is that it does not consume enough of what it produces. In the days when China had a massive current account surplus, it could export its excess savings abroad (Chart 4). It can’t do that anymore, so the government has consciously chosen to spur investment spending in order to prop up employment. Since a lot of investment spending is financed through credit, debt levels have risen. It really is just that simple. Arthur: First, neither the stock nor the flow of credit and deposits has any relevance to (1) the economic term “savings;” (2) a country’s capital stock; or (3) national wealth, contrary to what Peter claims. China’s broad money supply (M2) now stands at 190 trillion yuan, equivalent to US$28 trillion (Chart 5, top panel). It is equal to the size of broad money supply in the U.S. and the euro area combined (US$14 trillion each). Yet, China’s nominal GDP is only two-thirds the size of the U.S. Does the level of China’s wealth and capital stock justify it having broad money supply (US$28 trillion) equivalent to the U.S. and the euro area combined? Chart 5 (Arthur)“Helicopter” Money In China
“Helicopter” Money In China
“Helicopter” Money In China
Second, are Chinese households and companies willing to hold all RMB deposits that banks have created “out of thin air”? The answer: not really. Without capital controls, a notable portion of these deposits would have rushed into the foreign exchange markets and caused currency depreciation. Another sign of growing reluctance to hold the yuan is that households have been swapping their RMB deposits for real assets (property) at astronomical valuations. There is a bubble in China but people are looking for reasons to justify why it is different this time. Caroline: OK, let’s get away from the term “savings,” and agree that China continues to generate a chronic surplus of production of goods and services relative to consumption, and that how China chooses to intermediate that surplus is the most market-relevant issue. Arthur, you have used the terms “money bubble” and “helicopter money” in relation to China. This implies that banks are unconstrained in their ability to make loans. Just because savings don’t equal deposits, and banks can create deposits when they make loans doesn’t mean there is no relationship between the flow of credit and the stock of deposits. Arthur: Money supply and deposits expand only when banks originate a loan or buy an asset from a non-bank. In short, both credit and money/deposits are created by commercial banks “out of thin air.” This is true for any country.2 Consider a loan transaction by a German commercial bank. When it grants a €100 loan to a borrower, two accounting entries occur on its balance sheet. On the assets side, the amount of loans, and therefore total assets, increases by €100. Simultaneously, on the liabilities side, this accounting entry creates €100 of new deposits “out of thin air” (Figure 1). Hence, new purchasing power of €100 has been created via a simple accounting entry, which otherwise would not exist.
Chart
Critically, no one needed to save for this loan and money to be originated. The bank does not transfer someone else’s deposits to the borrower; it creates a new deposit when it lends. Banks also create deposits/money “out of thin air” when they buy securities from non-banks. In China, fiscal stimulus is largely financed by commercial banks – banks purchase more than 80% of government-issued bonds. This also leads to money creation. In short, when banks originate too much credit – as they have in China – they generate a money bubble. The money bubble is the mirror image of a credit bubble. Chinese banks have created 141 trillion yuan (US$21 trillion) of new money since 2009, compared with $8.25 trillion created in the U.S., euro area, and Japan combined over the same period (Chart 5, bottom panel). This is why I refer to it as “helicopter” money. Caroline: If banks need capital and liquidity to make loans, and deposits are one potential source of funds, don't these capital and liquidity constraints drive banks’ willingness and ability to lend, creating a link between the two variables? Arthur: Let me explain how mainland banks were able to circumvent those regulatory lending constraints. In 2009, they expanded their credit assets by about 30%. Even though a non-trivial portion of those loans were not paid back, banks did not recognize NPLs and instead booked large profits. By retaining a portion of those earnings, they boosted their equity, say, by 20%. As a result, the next year they were able to expand their credit assets by another 20% and so on. If banks lend and do not recognize bad loans, they can increase their equity and continue lending. With respect to liquidity, deposits are not liquidity for banks; excess reserves at the central bank are true liquidity for them. The reason why banks need to attract deposits is not to appropriate the deposits themselves, but to gain access to the excess reserves that come with them. When a person shifts her deposit from Bank A to Bank B, the former transfers a similar amount of excess reserves (liquidity) to the latter. When expanding their credit assets aggressively, banks can: (1) create more loans per one unit of excess reserves/liquidity, i.e., expand the money multiplier; and (2) borrow excess reserves/liquidity from the central bank or other banks. Chinese banks have used both channels to expand their balance sheets over the past 10 years (Chart 6). Chart 6 (Arthur)Broad Money Can Expand Without Growing Banks' Excess Reserves At The Central Bank
Broad Money Can Expand Without Growing Banks' Excess Reserves At The Central Bank
Broad Money Can Expand Without Growing Banks' Excess Reserves At The Central Bank
Crucially, commercial banks create deposits, but they cannot create excess reserves (liquidity).3 The latter are issued only by central banks “out of thin air.” So, neither deposits nor excess reserves have any relevance to household or national “savings.” Caroline: Peter, Arthur argues that Chinese credit policy has been unconstrained by the traditional metrics of capital adequacy that prevail in capitalist, free-market economies. In other words, there is no connection between the availability of funds to lend via deposits in the banking system, and the pace of credit creation. Rather, the central bank has controlled the terms and volume of lending via regulation and fiat reserve provisioning. You’ve argued that credit creation has served the greater good of propping up employment via investment spending. Moreover, you posit that countries with a surplus of production over consumption will invariably experience high levels of credit creation. Our colleague, Martin Barnes, has analyzed national savings rates (as a proxy for over-production) relative to debt-GDP ratios in other countries. The relationship doesn’t look that strong elsewhere (Chart 7). Please elaborate on why you see credit growth as an inevitable policy response to the dearth of aggregate demand we observe in China?
Chart 7
Peter: I would not say that countries with a surplus of production over consumption will invariably experience high levels of credit creation. For example, if most business investment is financed through retained earnings, you can have a lot of investment with little new debt. Debt can also result from activities not directly linked to the intermediation of savings. For instance, if you take out a mortgage to buy some land, your consumption and savings need not change, even though debt will be created. I think Arthur and I agree on this point. Thus, I am not saying that debt is always and everywhere the result of savings. I am simply pushing back against Arthur’s extremist position that debt never has anything to do with savings. Caroline: So what determines the level of debt in an economy in your view, Peter? Peter: In general, debt levels will rise if there are large imbalances between income and spending within society and/or if there are significant differences in the mix of assets people wish to hold. Think about the U.S. in the pre-financial crisis period. First, there was a surge in income inequality beginning in the early 1980s. For all intents and purposes, rich households with excess savings ended up lending their surplus income to poor households struggling to pay their bills. Overall savings did not rise, but debt levels still increased. That’s one reason why Martin’s chart doesn’t show a strong correlation between the aggregate savings rate and debt-to-GDP. Sometimes you need to look beneath the aggregate numbers to see the savings intermediation taking place. Unlike in the U.S., even poor Chinese households are net savers (Chart 8). Thus, the aggregate savings rate in China is very high4 (Chart 9). Much of these savings are funnelled to finance investment in the corporate and public sectors. This fuels debt growth.
Chart 8
Chart 9 (Peter)Chinese Households Have More Savings Than The U.S., Europe And Japan Combined
Chinese Household Savings Are More Than The U.S., Europe And Japan Combined
Chinese Household Savings Are More Than The U.S., Europe And Japan Combined
The second thing that happened in the U.S. starting in 2000 was a massive housing boom. If you bought a second home with credit, you ended up with one more asset (the house) but one more liability (the mortgage). The person who sold you the home ended up losing one asset (the house) but gaining another asset (a bigger bank deposit). The net result was both higher debt and higher bank deposits. Lending to finance asset purchases has also been a big source of debt growth in China, as it was in the U.S. before the crisis. The U.S. mortgage boom ended in tears, and so the question that we should be asking is whether the Chinese debt boom will end the same way. Arthur: We agreed not to use the term “savings,” yet Peter again refers to “savings” being funnelled into credit. As I explained above, banks do not funnel “savings” (i.e., “excess production”) into credit. China, Japan, and Germany have high “savings” rates because they produce a lot of steel, chemicals, autos, and machinery that literally cannot be consumed and, thus, are recorded as “savings.” The U.S. produces too many services that are consumed/expensed and, hence, not recorded as “savings.” That is why the U.S. has a lower “savings” rate. Chart 10 (Arthur)The Myth Of Deficient Demand In China
The Myth Of Deficient Demand In China
The Myth Of Deficient Demand In China
Economic textbook discussions on “savings” and “investment” are relevant for a barter economy where banks do not exist. When this framework is applied to modern economies with banks, it generates a lot of confusion.5 Caroline: OK, so Peter argues that an imbalance between spending and income CAN be a marker for high debt levels. Arthur, please explain why you see no relationship between China’s chronic shortfall in demand and authorities’ explicit decision to support growth via credit creation. Arthur: First, China does not have deficient demand – consumer spending and capital expenditures have been growing at 10% and 9.4%, respectively, in real terms annually compounded for the past 10 years (Chart 10). The mainland economy has been suffering from excess production, not a lack of demand. China has invested a lot (Chart 11) and ended up with too much capacity to produce steel, cement, chemicals and other materials as well as machinery and industrial goods. So, China has an excess production of goods relative to firms’ and households’ underlying demand. In a market economy, these producers would become non-profitable, halt their investments, and shut down some capacity. Chart 11 (Arthur)China Has Been Over-Investing On An Unprecedented Scale
China Has Been Over-Investing On An Unprecedented Scale
China Has Been Over-Investing On An Unprecedented Scale
In China, to keep the producers of these unwanted goods operating, the government has allowed and encouraged banks to originate loans creating new purchasing power literally “out of thin air” to purchase these goods. This has created a credit/money bubble. In a socialist system, banks do not ask debtors to repay loans and government officials are heavily involved in resource and capital allocation. China’s credit system and a growing chunk of its economy have been operating like a typical socialist system. Socialism leads to lower productivity growth for well-known reasons. With labor force growth set to turn negative, productivity is going to be the sole source of China’s potential growth rate. If the nation continues expanding this money/credit bubble to prop up zombie enterprises, its potential growth rate will fall considerably. As the potential growth rate drops, recurring stimulus will create nominal but not real growth. In short, the outcome will be stagflation. Caroline: The theoretical macro frameworks that you have both outlined make for interesting thought experiments, and spirited intellectual debate. However, investors are most concerned about the sustainability of China’s explosive credit growth, implications for the country’s growth rate, and the return on invested capital. Arthur, given your perspective on how Chinese credit policy has been designed and implemented, please outline the contours of how and when you see the music stopping, and the debt mountain crumbling. Arthur: Not every credit bubble will burst like the U.S. one did in 2008. For example, in the case of the Japanese credit bubble, there was no acute crisis. The bubble deflated gradually for about 20 years. In the cases of the U.S. (2008), Japan (1990), the euro area (2008-2014), Spain (2008-2014) and every other credit bubble, a common adjustment was a contraction in bank loans in nominal terms (Chart 12). Chart 12 (Arthur)All Credit Booms Have Been Followed By Contracting Bank Loans (I)
All Credit Booms Have Been Followed By Contracting Bank Loans
All Credit Booms Have Been Followed By Contracting Bank Loans
Chart 12 (Arthur)All Credit Booms Have Been Followed By Contracting Bank Loans (II)
All Credit Booms Have Been Followed By Contracting Bank Loans
All Credit Booms Have Been Followed By Contracting Bank Loans
Why do banks stop lending? The reason is that banks’ shareholders absorb the largest losses from credit booms. Given that banks are levered at least 20-to-1 at the peak of a typical credit boom, every $1 of non-performing loans leads to a $20 drop in their equity value. Bank shareholders halt the flow of credit to protect their wealth. Chart 13 (Arthur)China: Deleveraging Has Not Yet Begun
China: Deleveraging Has Not Yet Begun
China: Deleveraging Has Not Yet Begun
Chart 14
In fact, credit in China is still growing at a double-digit rate, above nominal GDP growth (Chart 13). Hence, aggregate deleveraging in China has not yet begun. If banks do not curtail credit origination, the music will not stop. However, uninterrupted credit growth happens only in a socialist system where banks subsidize the economy at the expense of their shareholders. But even then, there is no free lunch. Credit origination by banks also expands the money supply as discussed above. An expanding money bubble will heighten devaluation pressure on the yuan in the long run. The enormous amount of money supply/deposits – the money bubble – in China is like “the sword of Damocles” hanging over the nation’s currency. Chinese households and businesses are becoming reluctant to hold this ballooning supply of local currency. Continuous “helicopter” money will only increase their desire to diversify their RMB deposits into foreign currencies and assets. Yet, there is an insufficient supply of foreign currency to accommodate this conversion. The nation’s current account surplus has almost vanished while the central bank carries US$3 trillion in foreign exchange reserve representing only 11% of the yuan deposits and cash in circulation (Chart 14). It is inconceivable that China can open its capital account in the foreseeable future. “Helicopter” money also discourages innovation and breeds capital misallocation, which reduces productivity growth. A combination of slowing productivity growth, and thus potential GDP, and strong money growth ultimately lead to stagflation – the dynamics endemic to socialist systems. Peter: Arthur’s answer implicitly assumes that private investment would increase if the government removed credit/fiscal stimulus. But where is the evidence for that? We had just established that the Chinese economy suffers from a lack of aggregate demand. Public-sector spending, to the extent that it increases employment and incomes, crowds in private-sector investment rather than crowding it out. Ask yourself what would have happened if China didn’t build that “bridge to nowhere.” Would those displaced construction workers have found more productive work elsewhere or would they have remained idle? The answer is almost certainly the latter. After all, the reason the Chinese government built the bridge in the first place was to increase employment in an economy that habitually struggles to consume enough of what is produces. Arthur talks about the “misallocation” of resources. But doesn’t an unemployed worker also represent a misallocation of resources? In my view, it certainly does – and one that is much more threatening to social stability than an underutilized bridge or road. If you understand the point above, you will also understand why Arthur’s comparison between Chinese banks and say, U.S. banks is misplaced. The Chinese government is the main shareholder in Chinese banks. The government cares more about social stability than anything else. There is no way it would let credit growth plunge. Moreover, as the main shareholder, the government has a strong incentive to raise the share price of Chinese banks. After all, it is difficult to have a reserve currency that rivals the U.S. dollar, as China aspires to have, if your largest banks trade like penny stocks. My guess is that the Chinese government will shut down a few small banks to “show” that it is concerned about moral hazard, but then turn around and allow the larger banks to sell their troubled loans to state-owned asset management companies on very favourable terms (similar to what happened in the early 2000s). Once investors get wind that this is about to happen, Chinese bank shares will rally like crazy. Caroline: Isn’t shuffling debt from one sector of the economy to another akin to a shell game? Wouldn’t rampant debt growth eventually cause investors to lose confidence in the currency? Peter: China has a problem with the composition of its debt, not with its total value. Debt is a problem when the borrower can’t or won’t repay the loan. Chart 15 (Peter)China Is On Course To Lose More Than 400 Million Workers
China On Course To Lose More Than 400 Million Workers
China On Course To Lose More Than 400 Million Workers
I completely agree that there is too much shadow bank lending in China. There is also too much borrowing by state-owned enterprises. Ideally, the Chinese government would move all this quasi-public spending onto its own balance sheet. It would significantly raise social spending to discourage precautionary household savings. It would also adopt generous pro-natal policies — free childcare, education, government paid parental leave, and the like. The fact that the Chinese working-age population is set to shrink by 400 million by the end of the century is a huge problem (Chart 15). If the central government borrowed and spent more, state-owned companies and local governments would not have to borrow or spend as much. Banks could then increase their holding of high-quality central government bonds. Debt sustainability is only a problem if the interest rate the government faces exceeds the growth rate of the economy.6 That is manifestly not the case in China (Chart 16). And why are interest rates so low in relation to growth? Because Chinese households save so much! We simply can’t ignore the role of savings in the discussion. Chart 16 (Peter)China: High Levels Of Household Savings Have Kept Interest Rates Below The Growth Rate Of The Economy
China: High Levels Of Household Savings Have Kept Interest Rates Below The Growth Rate Of The Economy
China: High Levels Of Household Savings Have Kept Interest Rates Below The Growth Rate Of The Economy
As far as the currency is concerned, if debt growth rose so much that the economy overheated and inflation soared, then yes, the yuan would plunge. But that’s not what we are talking about here. We are talking about bringing debt growth to a level that generates just enough demand to achieve something resembling full employment. No one is calling for raising debt growth beyond that point. Curbing debt growth in a demand-deficient economy, as Arthur seems to be recommending, would cause unemployment to rise. Investors would then bet that the Chinese government would try to boost net exports by engineering a currency devaluation. Capital outflows would intensify. Far from creating the conditions for a weaker yuan, fiscal/credit stimulus obviates the need for a currency depreciation. Caroline: Peter, even if we accept your argument that the counterfactual of curbing credit growth in a demand-deficient economy would be a more deflationary outcome than sustaining the government-sponsored credit growth engine, how is building bridges to nowhere a positive sum for investors? Even if this strategy maintains social stability in the interests of the CCP’s regime preservation, won’t investors eventually recoil at the retreat to socialism that Arthur outlines, reducing the appeal of holding the yuan, even if, as you both seem to agree, no apocalyptic debt crisis is at hand? In other words, isn’t two times nothing still nothing? Peter: First of all, many of these infrastructure projects may turn out to be quite useful down the road, pardon the pun. Per capita vehicle ownership in China is only one one-fifth of what it is in the United States, and one-fourth of what it is in Japan (Chart 17). A sparsely used expressway today may be a clogged one tomorrow. Chart 17 (Peter)The Automobile Ownership Rate Is Still Quite Low In China
The Automobile Ownership Rate Is Still Quite Low In China
The Automobile Ownership Rate Is Still Quite Low In China
Would China really be better off if it had fewer infrastructure projects and more big screen TVs? An economy where people are always buying stuff they don’t need, with money they don’t have, to impress people they don’t like, is hardly a recipe for success. I am not sure what these references to socialism are supposed to accomplish. You want to see a real retreat to socialism? Try creating millions of unemployed workers with no jobs and no hope. All sorts of pundits decried Franklin Roosevelt’s New Deal as creeping socialism. The truth is that the New Deal took the wind out of the sails of the fledgling U.S. communist movement at the time. Arthur: I believe that Peter is confusing the structural and cyclical needs for stimulus. When an economy is in a recession – banks are shrinking their balance sheets and property prices are deflating – the authorities must undertake fiscal and credit stimulus. Chart 18 (Arthur)What Will Productivity Growth Look Like If Public Officials Allocate 55%-60% Of GDP?
What Will Productivity Growth Look Like If Public Officials Allocate 55%-60% Of GDP?
What Will Productivity Growth Look Like If Public Officials Allocate 55%-60% Of GDP?
Credit and fiscal stimulus made sense in China in early 2009 when growth plunged. However, over the past 10 years, we have witnessed credit and property market booms of gigantic proportions. Does this economy warrant continuous stimulus? What will productivity growth look like if government bureaucrats continuously allocate 55-60% of GDP each year (Chart 18)? Caroline: Arthur and Peter, you can both argue with one another about the semantic economic definition of the term ‘savings’, the implications of chronic excess production (relative to consumption), and the root drivers of credit growth in China long past the expiry of every BCA client’s investment horizon. Clients benefit from understanding your distinct perspectives only to the extent that they inform your outlook for markets. Will each of you now please outline how you see high levels of credit in China’s economy impacting the following over a cyclical (6-12 month) and structural (3-5 year) horizon: Global growth Commodity prices China-geared financial assets Peter: Regardless of what one thinks about the root causes of China’s high debt levels, it seems certain to me that the Chinese are going to pick up the pace of credit/fiscal stimulus over the next six months in response to slowing growth and trade war uncertainties. If anything, the incentive to open the credit spigots this time around is greater than in the past because the Chinese government wants to have a fast-growing economy to gain leverage over trade negotiations with the U.S. Chart 19 (Peter)Stronger Chinese Credit Growth Bodes Well For Commodity Prices
Stronger Chinese Credit Growth Bodes Well For Commodity Prices
Stronger Chinese Credit Growth Bodes Well For Commodity Prices
Chart 20 (Peter)The Dollar Is A Countercyclical Currency
The Dollar Is A Countercyclical Currency
The Dollar Is A Countercyclical Currency
Stronger Chinese growth will boost growth in the rest of the world. Commodity prices will rise (Chart 19). As a counter-cyclical currency, the U.S. dollar will likely peak over the next month or so and then weaken in the back half of 2019 and into 2020 (Chart 20). The combination of stronger Chinese growth, higher commodity prices, and a weaker dollar will be manna from heaven for emerging markets. If a trade truce between China and the U.S. is reached, investors should move quickly to overweight EM equities. European stocks should also benefit. Looking further out, China’s economy will slow in absolute terms. In relative terms, however, Chinese growth will remain near the top of the global rankings. China has one of the most educated workforces in the world (Chart 21). Assuming that output-per-hour reaches South Korean levels by the middle of the century, Chinese real GDP would need to expand by about 6% per year over the next decade (Chart 22). That’s a lot of growth – growth that will eventually help China outgrow its debt burden.
Chart 21
Chart 22 (Peter)China Has More Catching Up To Do
China Has More Catching Up To Do
China Has More Catching Up To Do
Keep in mind that credit growth of 1% when the debt-to-GDP ratio is 300% yields 3% of GDP in credit stimulus, compared with only 1% of stimulus when the debt-to-GDP ratio is 100%. That does not mean that more debt is intrinsically a good thing, but it does mean that China will eventually be able to slow debt growth even if excess savings remains a problem. Structurally, Chinese and EM equities will likely outperform their developed market peers over a 3-to-5 year horizon. The P/E ratio for EM stocks is currently 4.7 percentage points below that of developed markets, which is below its long-term average (Chart 23). While EM EPS growth has lagged DM earnings growth over the past eight years, the long-term trend still favors EM (Chart 24). EM currencies will appreciate over this period, with the RMB leading the way. Chart 23 (Peter)EM Stocks: Valuations Are Attractive
EM Stocks: Valuations Are Attractive
EM Stocks: Valuations Are Attractive
Chart 24 (Peter)Earnings Growth In EM Has Outpaced That Of DM Over The Long Haul
Earnings Growth In EM Has Outpaced That Of DM Over The Long Haul
Earnings Growth In EM Has Outpaced That Of DM Over The Long Haul
Arthur: China is facing a historic choice between two scenarios. Medium- and long-term macro outcomes will impact markets differently in each case. Table 1 shows my cyclical and structural investment recommendations for each scenario. Table 1 (Arthur)Arthur’s Recommended Investment Strategy For China-Geared Financial Assets
China’s Credit Cycle: A Spirited Debate
China’s Credit Cycle: A Spirited Debate
Allowing Markets to Play A Bigger Role = Lower credit growth (deleveraging), corporate restructuring, and weaker growth (Chart 25). This is bearish for growth and financial markets in the medium term but it will make Chinese stocks and the currency structural (long-term) buys. Credit/Money Boom Persists (Socialist Put) = Secular Stagnation, Inflation and Currency Depreciation: The structural outlook is downbeat but there are mini-cycles that investors could play (Chart 26). Cyclically, China-geared financial assets still remain at risk. However, lower asset prices and more stimulus in China could put a floor under asset prices later this year. Timing these mini-cycles is critical. A buy-and-hold strategy for Chinese assets will not be appropriate in this scenario. In short, capitalism is bad but socialism is worse. I hope China will pursue the first path.
Chart 25
Chart 26
Caroline: Thank you both for clarifying your perspectives. Over a multi-year horizon, markets will render the ultimate judgement on whether China’s credit boom has represented a reckless misallocation of capital, or a rational policy response to an imbalance between domestic spending and income. In the meantime, we will monitor the complexion of Chinese stimulus and evidence of its global growth multiplier effect over the coming weeks and months. These will be the key variables to watch as we determine when and at what level to upgrade BCA’s cyclical outlook for China-geared assets. Can’t wait for that debate. Footnotes 1 For a detailed discussion of these issues, please see Emerging Markets Strategy Special Reports, “Misconceptions About China's Credit Excesses,” dated October 26, 2016 and “The True Meaning Of China's Great 'Savings' Wall,” dated December 20, 2017. 2 For a detailed discussion of these issues, please see Emerging Markets Strategy Special Reports, “Misconceptions About China's Credit Excesses,” dated October 26, 2016 and “The True Meaning Of China's Great 'Savings' Wall,” dated December 20, 2017. 3 For a detailed discussion of these issues, please see Emerging Markets Strategy Special Report, “China's Money Creation Redux And The RMB,” dated November 23, 2016. 4 For a discussion on the reasons behind China’s high savings rate, please see Global Investment Strategy Weekly Report, “China’s Savings Problem,” dated January 25, 2019. 5 For a detailed discussion of these issues, please see Emerging Markets Strategy Special Report, “Is Investment Constrained By Savings? Tales Of China And Brazil,” dated March 22, 2018. 6 For a detailed discussion of these issues, please see Global Investment Strategy Weekly Report, “Is There Really Too Much Government Debt In The World?” dated February 22, 2019 and “Chinese Debt: A Contrarian View,” dated April 19, 2019. Strategy & Market Trends MacroQuant Model And Current Subjective Scores
Image
Tactical Trades Strategic Recommendations Closed Trades
Overweight As a follow up to yesterday’s Insight Report where we highlighted our sanguine view on the S&P health care equipment index, a structural EM macroeconomic trend further reiterates our constructive view on the U.S. health care equipment providers. Aging population, one of the major factors that has been driving the explosion of health care spending in DM for the past 20 years, is now rapidly impacting EM. According to the UN, the share of the population aged 65 and older in EM countries will rise from roughly 7% this year to 16% by 2060, while population growth slows to below the replacement rate (see chart). Meanwhile, IMF data shows that EM health care spending is approximately 5% of GDP, whereas it stands in excess of 14% in DM. U.S. health care equipment providers are the first in line to benefit from the upcoming increase in health care spending in EM. Indeed, U.S. companies are often the only source of equipment for hospitals/clinics globally given their status of technological leaders. Bottom Line: Long-term EM demographic trends as well as the short-term “fear selling” discussed in Monday’s Special Report create an exploitable trading opportunity in the S&P health care equipment index. The ticker symbols for the stocks in the S&P health care equipment index are: BLBG: S5HCEP – ABT, MDT, DHR, BDX, SYK, ISRG, BSX, BAX, EW, ZBH, IDXX, RMD, TFX, HOLX, ABMD, VAR.
Chart 1
Overweight This past Monday we co-authored a Special Report with our sister Geopolitical Strategy service gauging the odds of “Medicare For All” becoming law. Our analysis showed that the odds of universal health care legislation being enacted in the U.S. by 2022 are about 10%-15%. As a result, we were compelled to boost the S&P health care index to overweight as fear selling created an exploitable trading opportunity in this defensive sector. We are executing this upgrade by lifting the S&P health care equipment index to overweight (as a reminder we have been overweight the S&P managed health care index since April 15, 2019). This move is not contingent upon earnings outperformance. Rather, it is a combination of overwrought investors creating a buying opportunity, along with health care’s historic outperformance at the end of the business cycle. Our prior research shows that health care stocks have been the top performer in the last equity market surge to take place between the peak of the ISM manufacturing composite index and the beginning of the subsequent recession (see chart). Bottom Line: Lift the S&P health care equipment index to overweight. This move also lifts the overall health care index to an above benchmark allocation. Please see this Monday’s Special Report for additional details.
Health Care Is A Resilient Late Cycle Performer
Health Care Is A Resilient Late Cycle Performer
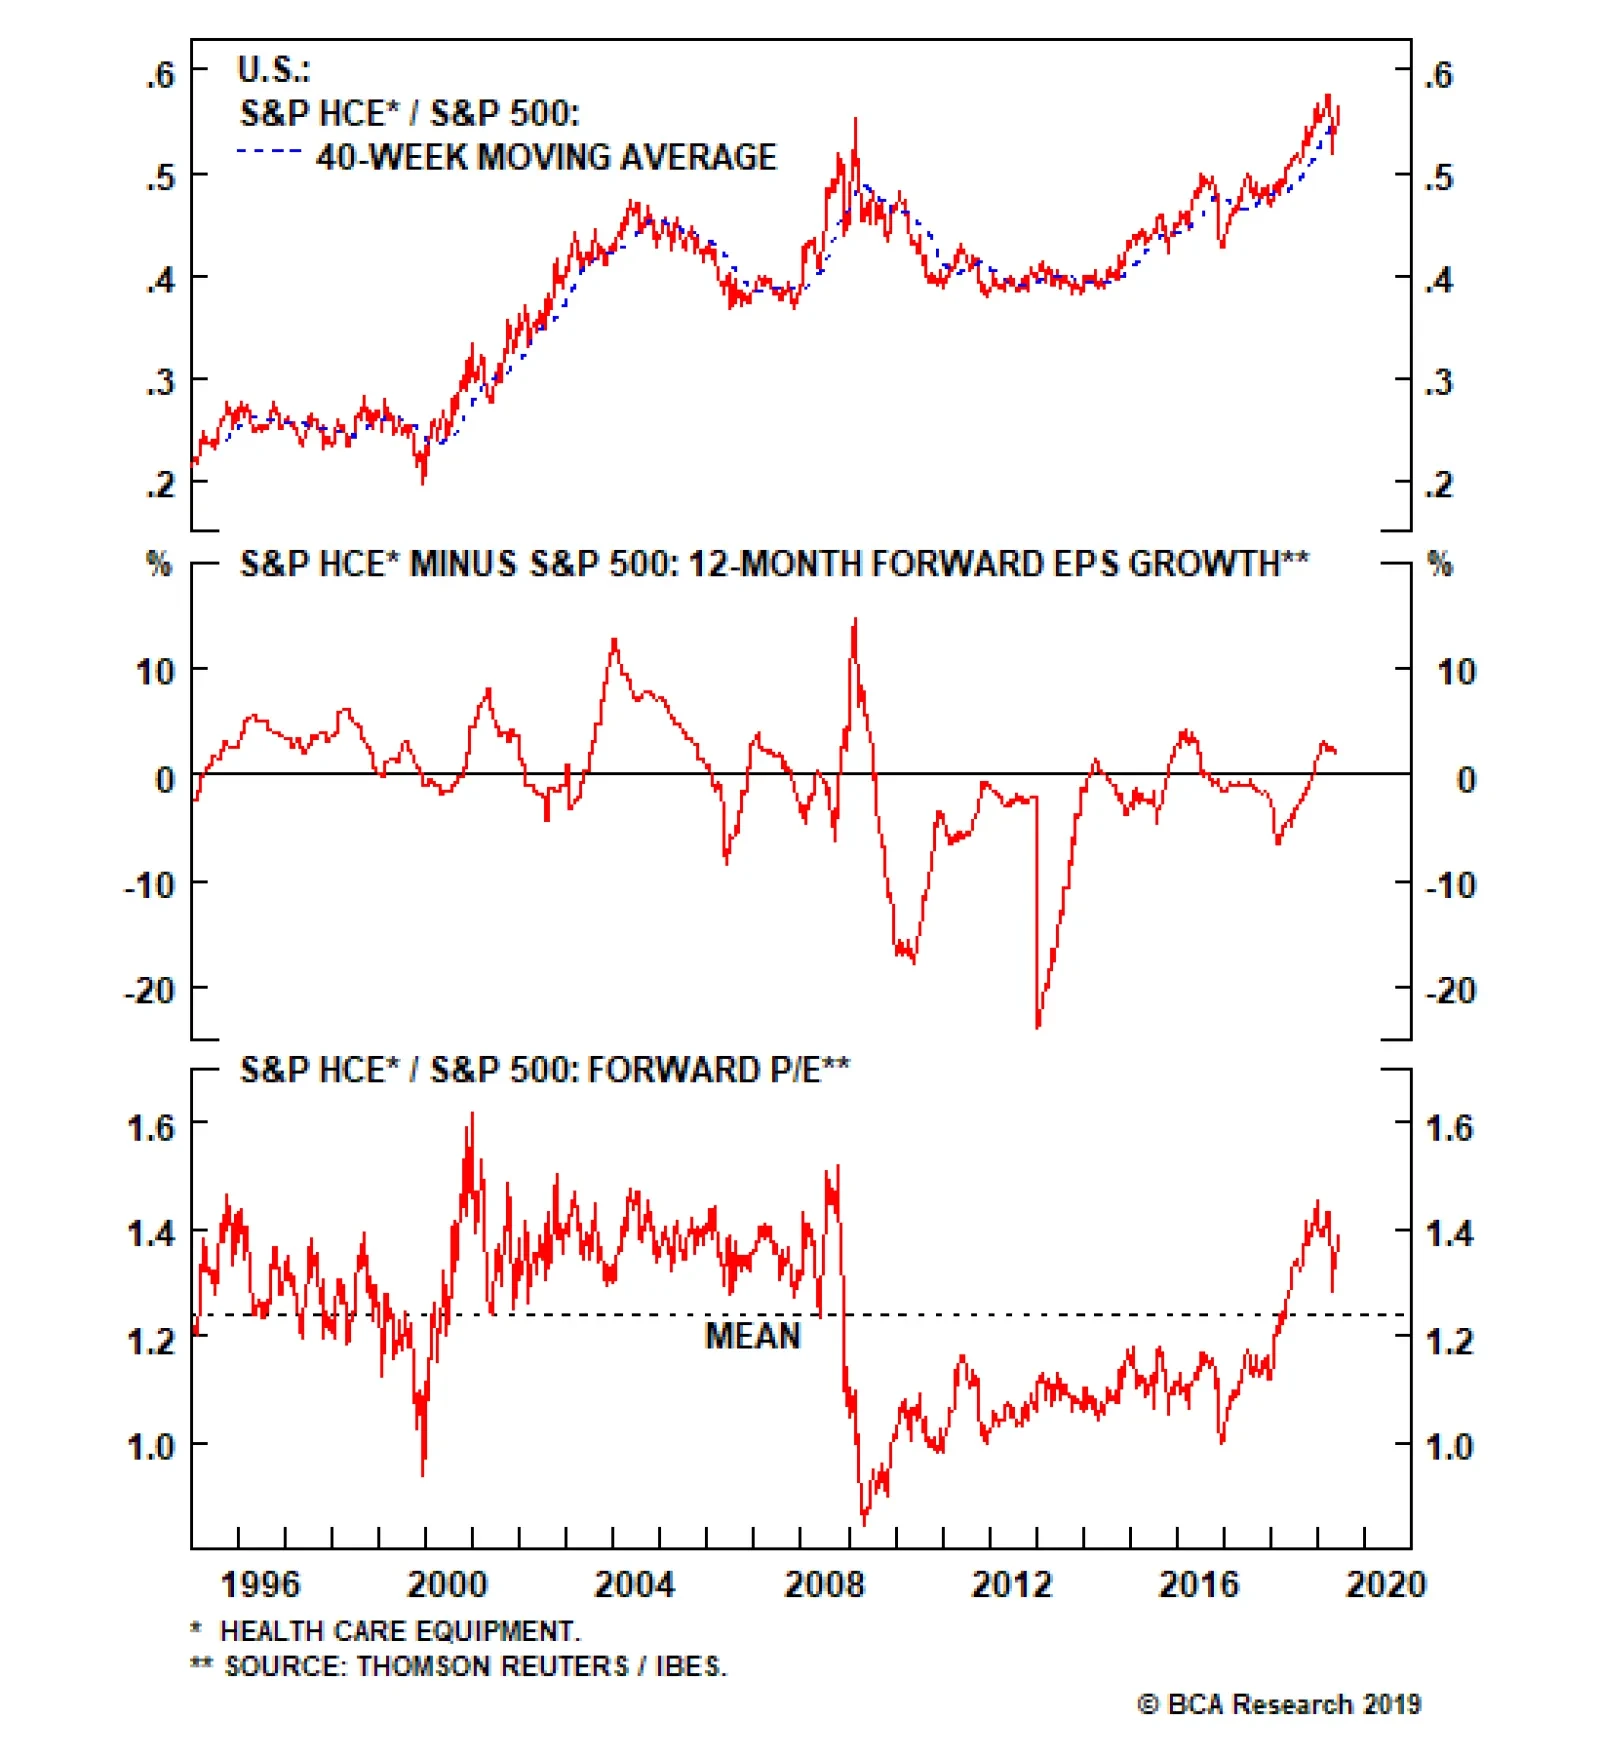
The global PMI has historically led U.S. medical equipment exports. While the former has been decelerating for 13 consecutive months, it has been diverging from export growth for the past year. We believe this is a function of the early stages of a secular…
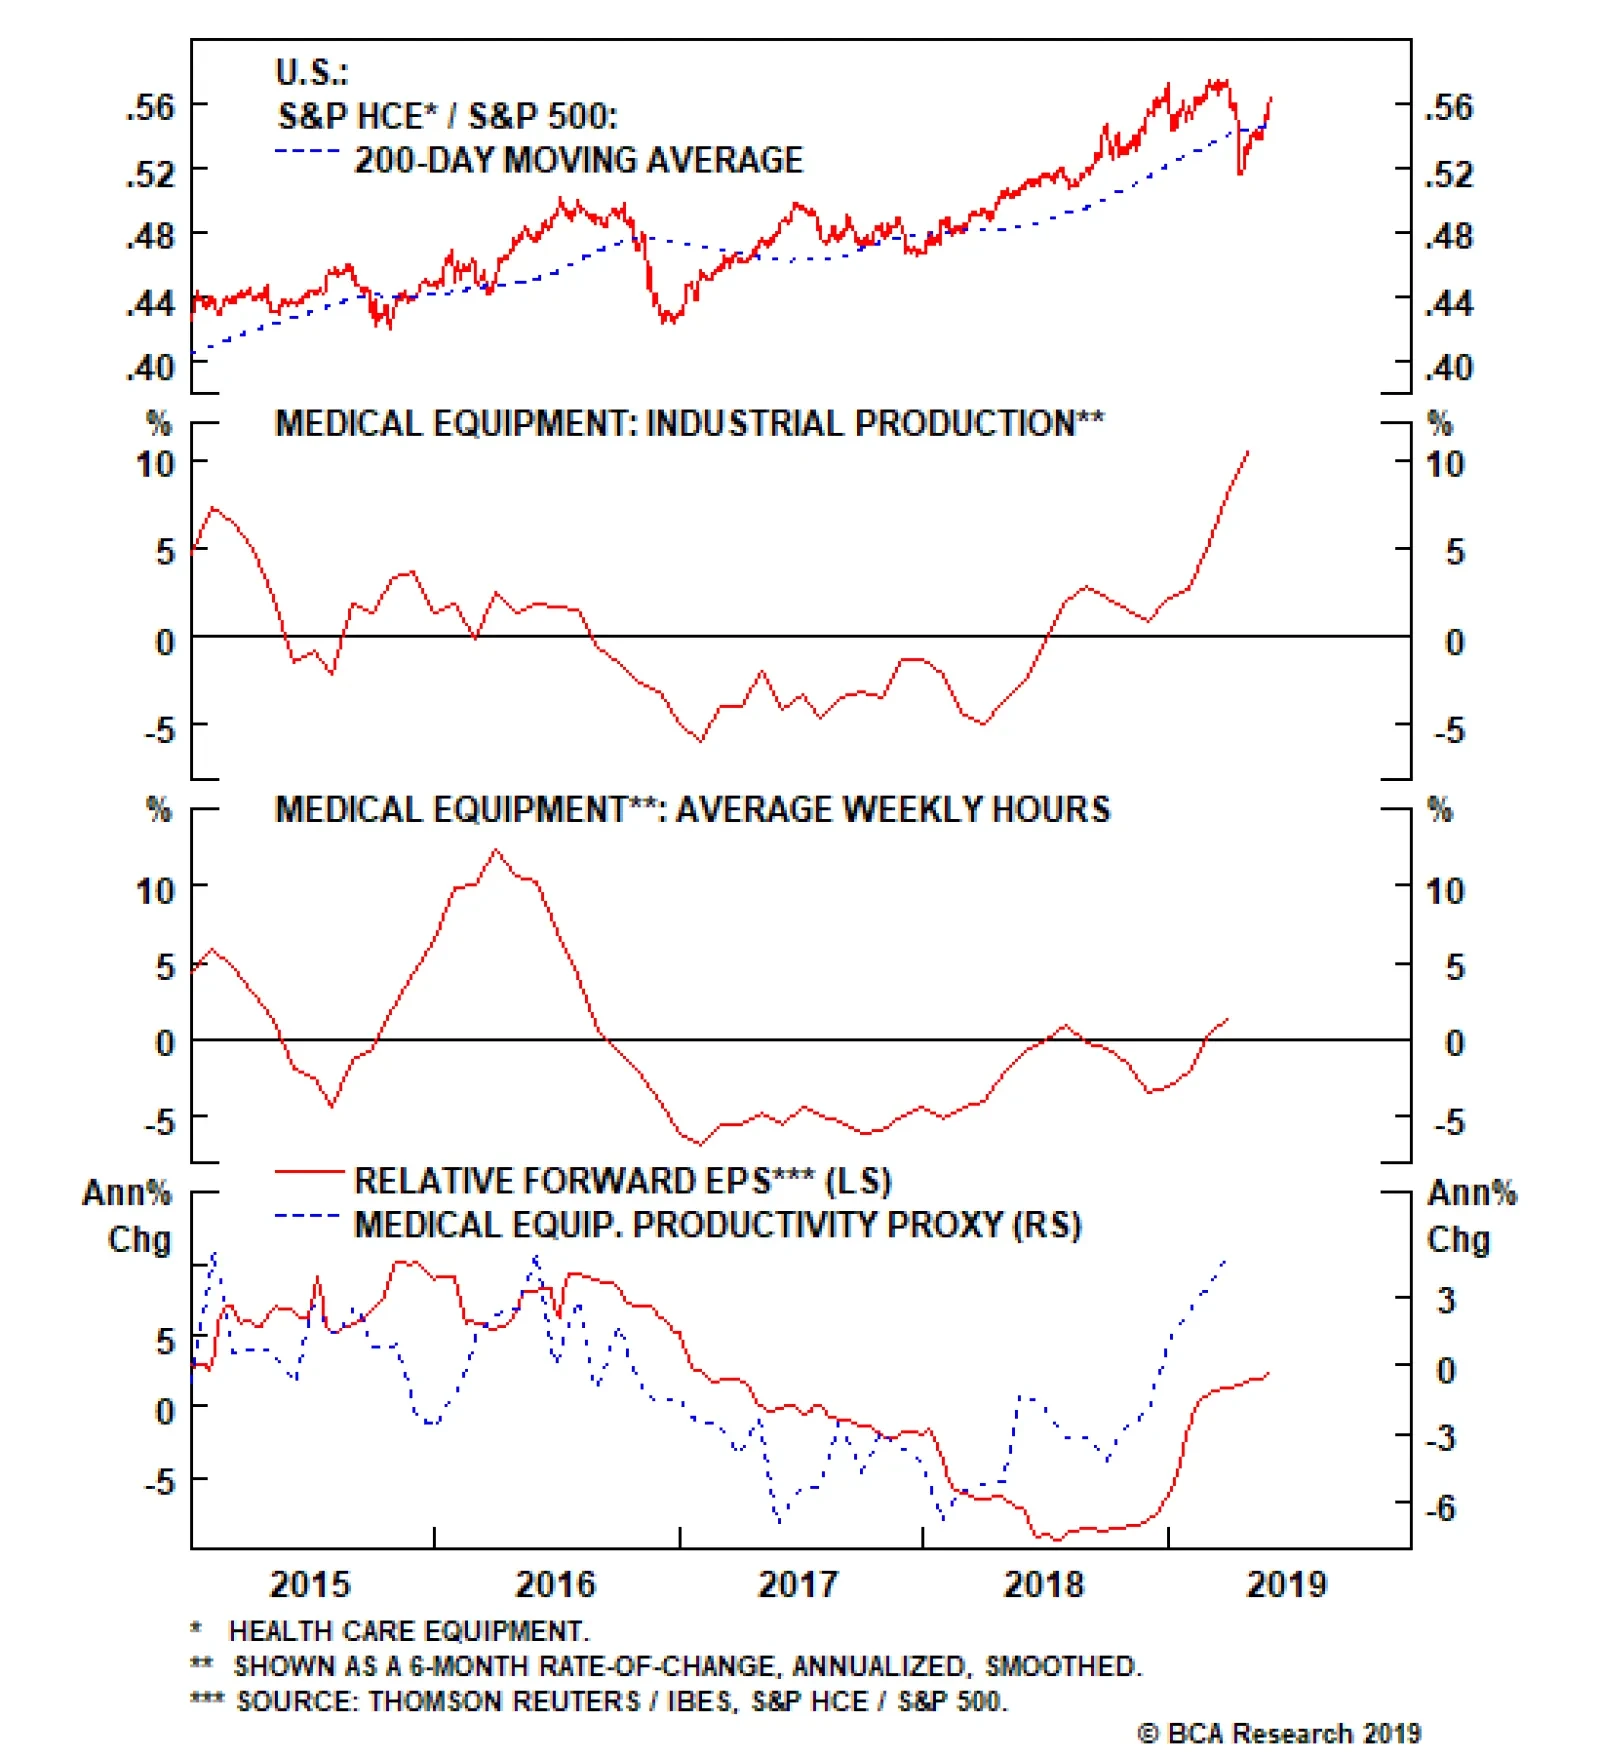
This upgrade is a combination of overwrought investors having created a buying opportunity, combined with health care’s historic outperformance at the end of the business cycle. Nevertheless, an examination of the sector’s macro environment is revealing.…
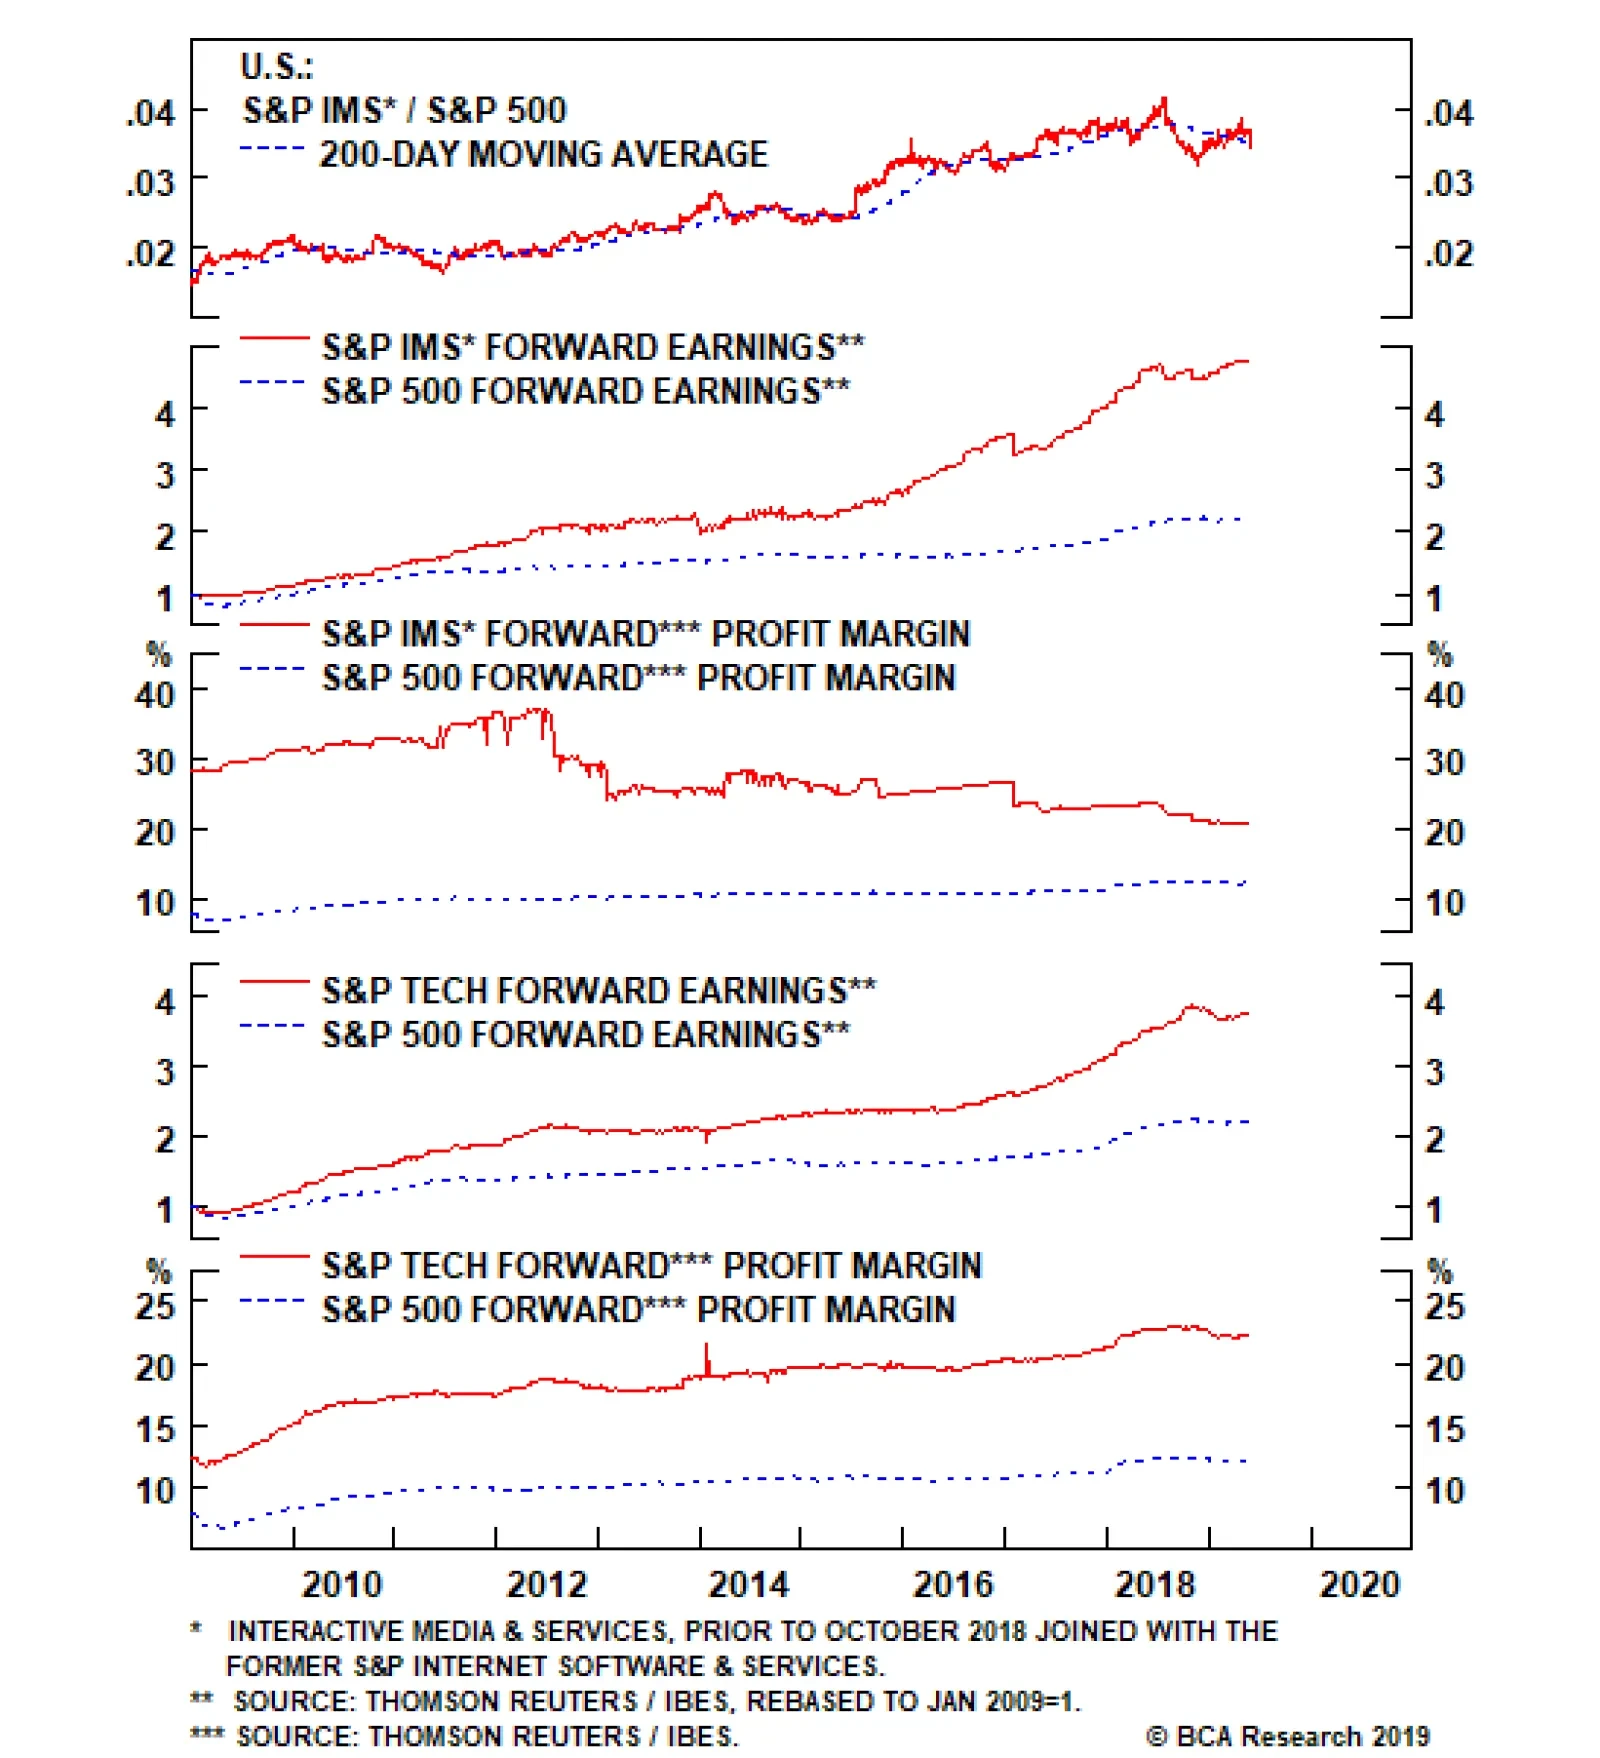
Late Friday night news broke that the DOJ was working on an antitrust investigation into Alphabet Inc., parent of GOOGL/GOOG, and on Monday, according to the Wall Street Journal, the “FTC got jurisdiction for a possible Facebook Inc. antitrust investigation”.…