Sectors
Stocks in the S&P insurance index have been mostly treading water since their collapse at the beginning of 2018, a result of reasonably solid premium growth and low catastrophe losses offsetting slowing growth in house & auto sales, the fundamental…

Highlights Odds are that the recently improved access to financing will allow property developers to boost construction volumes modestly in the coming months. Yet, the outlook for new credit origination and government tolerance of another credit binge is highly uncertain. For now, the completion of previously launched projects will help construction-adjacent industries in the short run. However, these activities will consume real estate developers’ cash augmenting both their liquidity needs and financial vulnerability. That is a basis to underweight the Chinese real estate sectors within both the Chinese MSCI investable universe and the onshore A-share indexes. Feature The emergent divergence among Chinese property sales, starts and completions constitutes an exceptionally bizarre phenomenon. The gaps between these three indicators are currently unprecedented (Chart I-1). Understanding these divergences is critical to correctly gauging the outlook for the Chinese real estate market. This report aims to assess the growth outlook of these three variables. Odds are that these gaps will narrow going forward. Over the next three to six months, the Chinese property market is likely to be characterized by a contraction in floor space sold, a considerable relapse in floor space starts, and a rebound in floor space completions (Chart I-2). Chart I-1An Unprecedented Divergence…
The Unprecedented Divergence
The Unprecedented Divergence
Chart I-2…But A Convergence Looms
Convergence Ahead
Convergence Ahead
In terms of the strength of construction activity in the Chinese property market, the real estate developers’ access to funding has been and remains the key. Over the next three to six months, the Chinese property market is likely to be characterized by a contraction in floor space sold, a considerable relapse in floor space starts, and a rebound in floor space completions. For now, we reckon the improved access to financing in recent months should help property developers to boost construction volumes modestly in the coming months (Chart I-3). Chart I-3Construction Activity Will Modestly Improve In The Coming Few Months
Further Credit Easing Will Likely Lead To Rising Construction Activity
Further Credit Easing Will Likely Lead To Rising Construction Activity
That said, the current round of credit stimulus has probably been front-loaded in the first quarter, and property developers’ access to funding will begin to deteriorate again going forward. This will weigh on their ability to raise construction volumes materially. Understanding The Construction Cycle In China Floor space sold, starts and completions generally move in tandem. Specifically, strong sales lead rising starts, which then with a time lag result in increased completions. However, over the past 15 months, the growth rate of property starts has accelerated to over 20%, while sales have mildly contracted and floor space completions have been shrinking dramatically (Chart I-2). The key reason for these divergences has been the considerable financing difficulties facing property developers. Tighter monetary policy and credit beginning in late 2016 severely impaired developers’ ability to raise funds. This made Chinese real estate developers desperate for any source of possible revenue or financing. Launching new projects aggressively last year – i.e., more property starts – allowed real estate developers to pre-sell and get cash at a time when credit was tight. Property developers were also aiming to conserve cash flow amid tight credit. After investing 25% of the total investment required for a property project (excluding the value of the land), they received a presale permit from the authorities. The permits allowed them to sell housing units in advance. Home-buyers had to pay at least 30% of the total property value at the time they signed the presale contract. This way, developers were able to obtain both deposits and advance payments1 (Chart I-4). This was a welcome addition to scarce financing last year. After this phase, property developers then slowed their investment in construction, installation and equipment purchases – because these would consume precious, limited cash. This depressed construction activity has resulted in a material contraction in floor space completed (Chart I-5). Chart I-4Developers’ Funding Has Improved Due To Deposits & Advanced Payments
Rising Funding From Deposits And Advance Payments
Rising Funding From Deposits And Advance Payments
Chart I-5
Bottom Line: Launching new projects and pre-selling housing units while shrinking construction enabled Chinese real estate developers to stay afloat last year amid tight access to credit. What Does This Mean? There are two important implications related to this unprecedented divergence among property sales, starts and completions. The first is that raising funds via launching property starts along with shrinking completions has resulted in a significant increase in Chinese property developers’ liabilities. This is a form of borrowing money for property developers, and it has been occurring on top of very poor financial health. Specifically, Chinese real estate developers’ debt-to-equity ratio is currently above 4, and continues to surge (Chart I-6). Further, in 2018, 54 out of 131 Chinese property developers had negative free cash flow. This scheme of raising funding via new launches along with postponing building and completions is becoming unsustainable. The divergence between surging property starts and contracting completions suggests that real estate developers have raised funds through selling more uncompleted buildings instead of completed properties (Chart I-7, top panel). Chart I-6Chinese Property Developers Are Very Leveraged
Chinese Property Developers Are Very Leveraged
Chinese Property Developers Are Very Leveraged
Chart I-7A Big Increase In Sales Of Uncompleted Buildings
A Big Increase In Sales Of Uncompleted Buildings
A Big Increase In Sales Of Uncompleted Buildings
Specifically, some 87% of total residential floor space sold in the past 12 months has been sold in advance, much higher than the approximate 77% total recorded in the years prior to 2018 (Chart I-7, bottom panel). The second important implication is that property developers’ ability to raise financing will determine the strength of property construction activities in China going forward. Chinese real estate developers are facing massive funding requirements this year. Developers need considerable amounts of funding this year to speed up their construction activities on delayed projects (launched but not completed ones). It generally takes about two years for real estate developers to complete a construction project and deliver the presold properties. Developers had already slowed their construction progress last year. They must accelerate the pace this year to ensure deliveries are made on time. Developers also need to roll over or repay significant amounts of debt coming due in 2019. On the whole, they have issued nearly RMB3.9 trillion of bonds so far, with most in the three- to five-year duration. Chart I-3 on page 2 shows that further improvements in credit flows in the economy will likely lead to ameliorating construction activity. Credit easing has allowed developers to raise funds through bank loans, bond issuances (both domestic and overseas) and other forms of borrowing (Chart I-8). Property developers’ ability to raise financing will determine the strength of property construction activities in China going forward. As a result, real estate investment in construction, installation and equipment purchases have all ameliorated in recent months (Chart I-9). This reflects a true pickup in real estate construction activities since the beginning of this year. Chart I-8Marginal Credit ##br##Easing
Marginal Credit Easing
Marginal Credit Easing
Chart I-9
However, whether or not this latest improvement develops into full-fledged recovery is contingent on credit flows in the economy in general, and property developers’ access to financing in particular. If the overflow of credit decelerates after the massive binge that took place in the first quarter, it will weigh on construction activity. If the first-quarter credit binge persists, Chinese property developers will likely be able to raise sufficient funds to speed up property completions and roll over their maturing debt this year. In this scenario, construction activity will gather speed, facilitating a recovery in the overall economy. At the current juncture, it is impossible to make a definite conclusion. The outlook for new credit flows and government tolerance of another credit binge is highly uncertain. On the one hand, the Politburo last month reiterated that China will push forward structural deleveraging and prevent speculation in the property market. Preliminary credit flow numbers for April appear to be very weak, not confirming blockbuster credit in the first quarter. Besides, the banking regulator has renewed pressure on banks to recognize non-performing loans and provision for them.2 This will curb banks’ ability to originate new loans and buy corporate bonds. On the other hand, an escalation of tensions between China and the U.S. and the uncertainty it is instilling in the economy and financial markets could lead the authorities to keep the credit taps open for longer, allowing credit to flow into the broader economy. Bottom Line: Real estate developers are extremely leveraged and lack cash to complete launched projects. Hence, property developers’ ability to raise financing holds the key in terms of the strength of property construction activities in China. Further easing in credit will likely lead to rebounding property completions and rising construction activity, and vice versa. What About Chinese Property Demand? Easy credit may alleviate the financing stress facing Chinese real estate developers and lift construction activity temporarily. However, the most important and sustainable source of funding for real estate developers is property sales. Chart I-10 shows that funding from property sales, including deposits, advance payments and mortgages assumed by property buyers, contributes nearly half of the sources of funds raised in that year.
Chart I-10
Self-raised funds are the second-largest component of the source of funds, with a share of 34%. One major component of self-raised funds – retained earnings – are also closely related to property sales. The other major component is equity and bond issuance. Bank loans and foreign investment (including direct equity injections, sales of bonds and equity, and borrowing from foreign banks) together account for only about 15%. Even though there has been some credit easing for Chinese real estate developers, the bad news is that property sales are still in a structural downtrend. Chart I-11Slower PSL Injections Will Negatively Impact Property Demand
Diminishing PSL Scheme Will Be Negative To Property Demand
Diminishing PSL Scheme Will Be Negative To Property Demand
As discussed in our previous reports,3 China’s property market is currently facing structural impediments. Low affordability, slowing rural-to-urban migration, demographic changes, the promotion of the housing rental market and the government’s continuing emphasis on clamping down speculation are together generating strong structural headwinds for property demand in China. Importantly, surging property demand between late 2015 and 2017 was mainly driven by the Chinese central bank’s direct lending to the real estate sector, which is not sustainable. Our calculations indicate that about 20% of floor space sold (in volume terms) in 2017 was due to the Pledged Summary Lending (PSL) facility designed for slum area reconstruction.4 Indeed, the central bank’s PSL injections have already decelerated considerably since last year (Chart I-11). This has resulted in contracting overall property sales. Late last month, the authorities significantly cut their slum-area reconstruction target by more than one-half – from 6.4 million units last year to 2.85 million units this year. This suggests the amount of PSL injections will decline correspondingly (Chart I-12).
Chart I-12
Besides the diminishing PSL scheme, some other factors are also signaling a dismal outlook for Chinese property demand. A deep and long contraction in property demand in rich provinces indicates demand saturation (Chart I-13). Sales outside eastern provinces track PSL injections very closely, as per Chart I-11, and are facing headwinds. Chinese households are more leveraged than U.S. ones, with the former’s debt-to-disposable income ratio having surpassed that of the latter (Chart I-14). Chart I-13Demand Is Saturated In China’s (Richer) Eastern Provinces
Demand Saturation In Rich Eastern Provinces
Demand Saturation In Rich Eastern Provinces
Chart I-14China’s Household Debt Burden Is Very Elevated
Escalated Household Debt In China
Escalated Household Debt In China
Chart I-
In addition, mortgage rates in China have not dropped much, despite monetary policy easing in the past 12 months. Recent data shows the average mortgage rate paid by first-time homebuyers has fallen from 5.71% last November to 5.56% this March, a still-high number. With respect to the ability to service mortgage payments, on a 90-square-meter house with a 30% down payment, our calculations show that annual interest costs account for about 27% of average household disposable income levels (Table I-1). Overall, poor affordability for Chinese homebuyers will constrain property demand in the coming years. Finally, the government is quite determined to implement its property tax in a few years. Local governments’ financing needs will become more acute as revenue from land sales decline substantially. China’s property market is on the way to becoming the market dominated by second-hand properties instead of new buildings – similar to many developed countries. Critically, the progress in establishing property tax laws in China seems to be accelerating. There have been more high-level meetings and discussions about the property tax law, and these meetings/discussions are becoming more detailed and concrete. Bottom Line: Chinese housing demand will be in a structural downtrend, weighing on construction activity beyond any near-term rebound. Investment Implications Based on the above findings, we draw the following investment strategy conclusions: It is reasonable to expect a slight pickup in real estate construction activity in China over the next few months. This will be marginally positive for construction-related commodities demand. Consequently, construction-related commodities markets (steel, cement, and glass) may be supported in the near term (Chart I-15). However, over the longer term, we remain fundamentally negative on construction activity within China’s property markets, as property sales will be in a structural downtrend. BCA’s Emerging Market Strategy service recommends equity investors underweight Chinese property developers within the Chinese equity indexes (Chart I-16). Chart I-15Construction-Related Commodities May Marginally Benefit From A Pickup In Activity
Contraction Commodities Prices May Marginally Benefit
Contraction Commodities Prices May Marginally Benefit
Chart I-16Underweight Real Estate Stocks Relative To The Domestic And Investable Benchmarks
Underweight Real Estate Stocks Within Respective Chinese Investable Universes
Underweight Real Estate Stocks Within Respective Chinese Investable Universes
The completion of previously launched projects will help construction-related industries. Yet, these activities will consume real estate developers’ cash augmenting their liquidity needs and amplifying their financial vulnerability. This is a basis for our recommendation to underweight property stocks, especially following their significant outperformance in the past six months. Further, property stocks respond to marginal changes in financing conditions rather than housing sales or construction activities. The basis is that they are extremely leveraged, and access to funding is key. In the coming months, if credit conditions tighten at a time when real estate developers must commit cash to complete previously launched projects, their cash flow will deteriorate. This will be reflected in their share prices, which will underperform the Chinese broader onshore and offshore indexes. This is likely to occur regardless of the absolute performance of Chinese stocks. Ellen JingYuan He, Associate Vice President ellenj@bcaresearch.com Footnotes 1 Chinese real estate developers could also slow the construction activity after completing 50% of a property project, which allows them to receive at least 60% of the presold property value from house buyers. 2 https://www.bloomberg.com/news/articles/2019-05-06/china-is-said-to-imp… 3 Please see Emerging Markets Strategy Special Report “China Real Estate: A Never-Bursting Bubble?” dated April 6, 2018 and China Investment Strategy Special Report “China’s Property Market: Where Will It Go From Here?” dated September 13, 2018. 4 Please see China Investment Strategy Special Report “China’s Property Market: Where Will It Go From Here?” dated September 13, 2018. Equity Recommendations Fixed-Income, Credit And Currency Recommendations
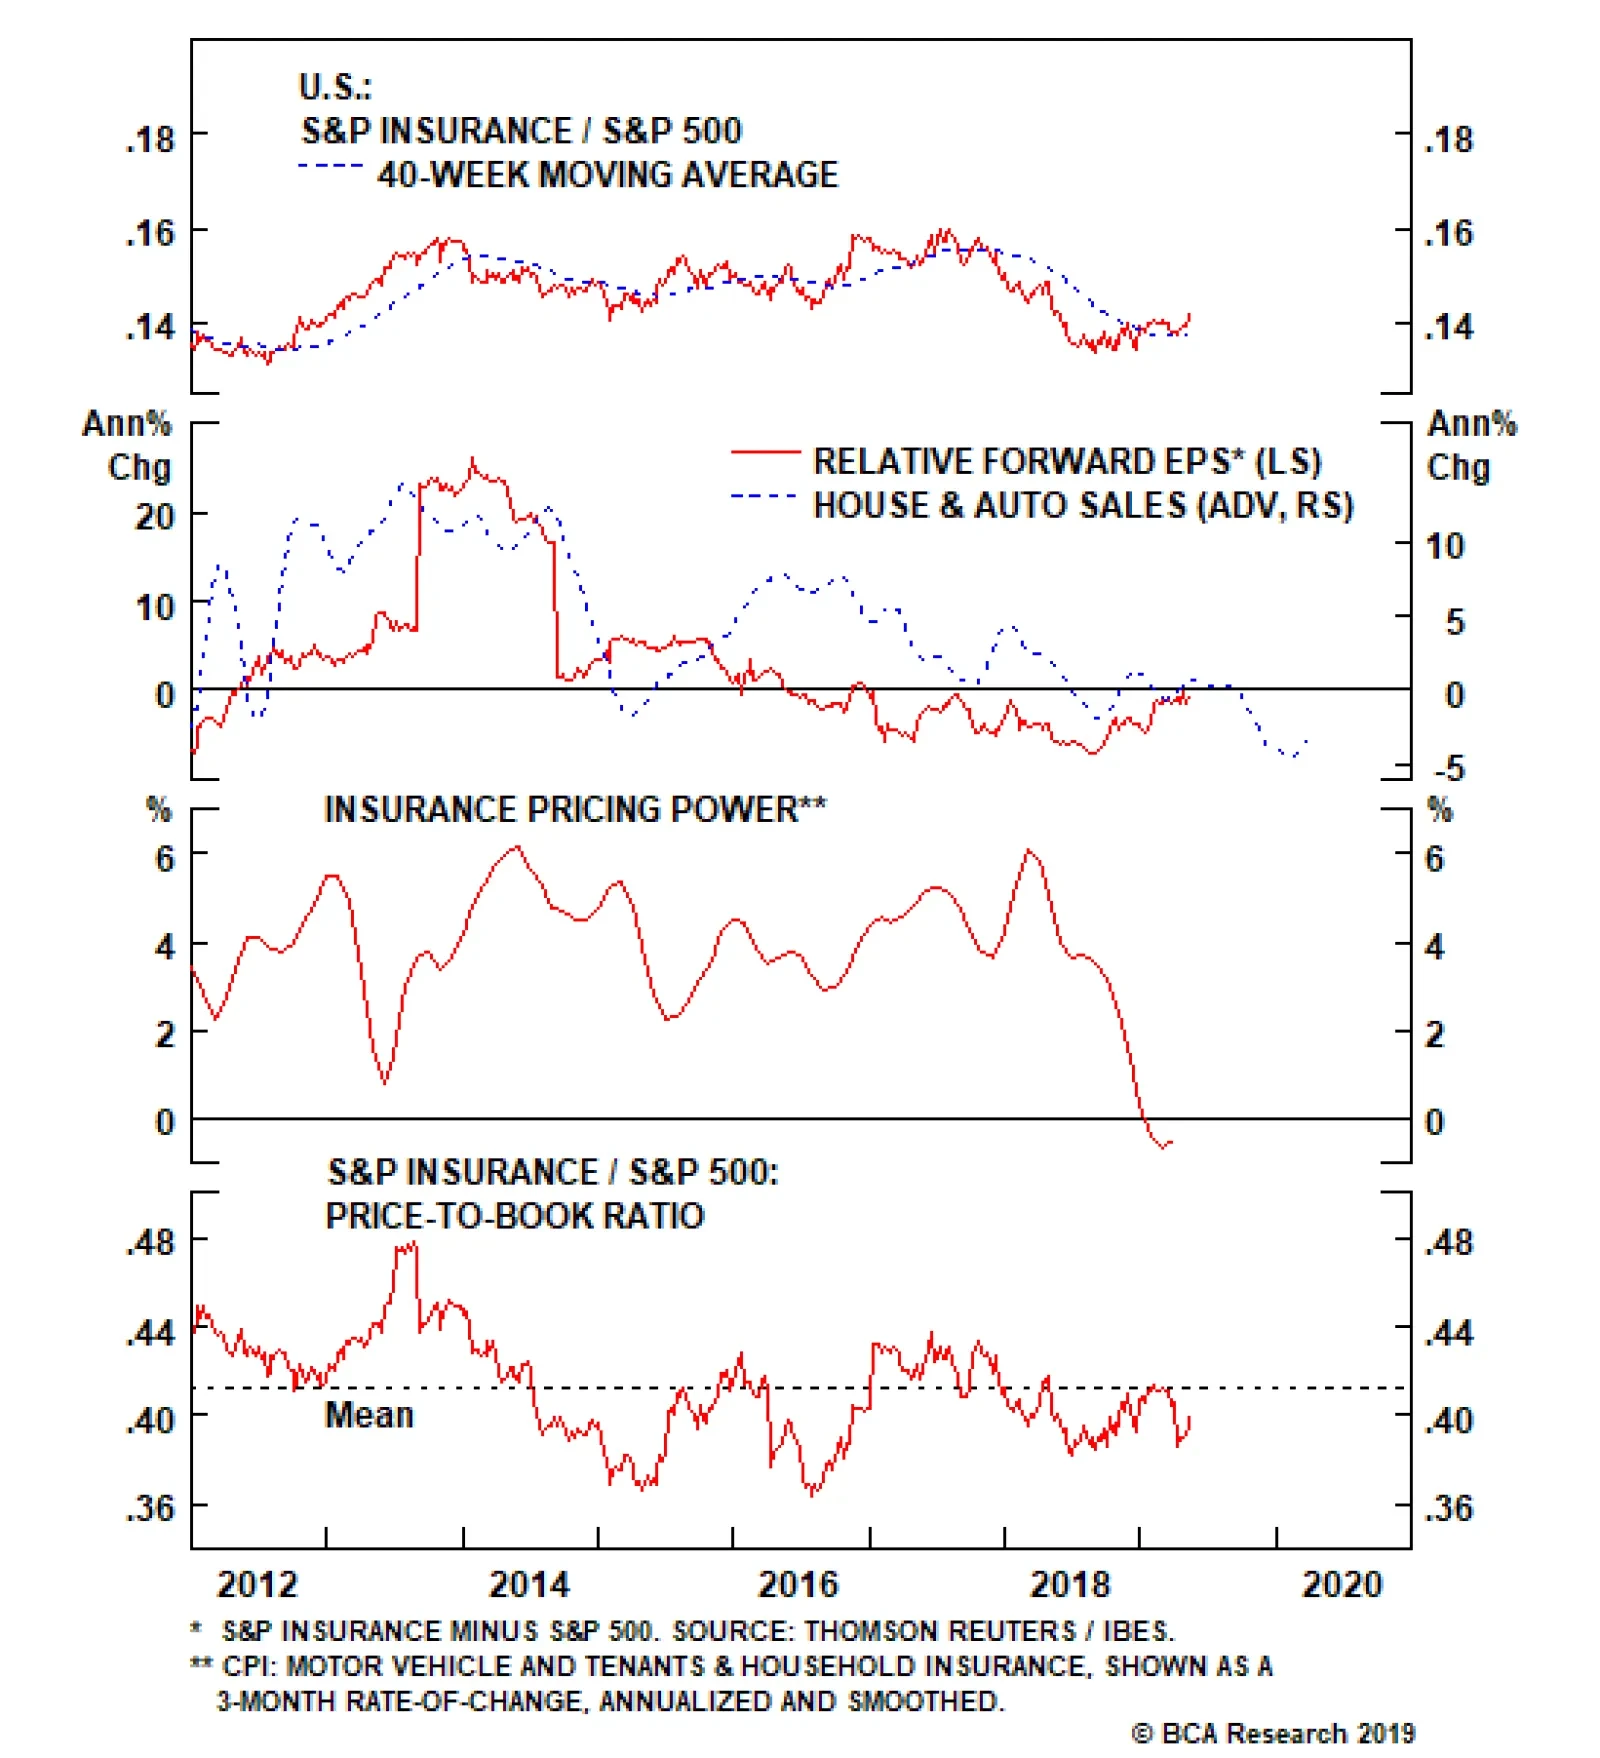
Underweight Stocks in the S&P insurance index have been mostly treading water since their collapse at the beginning of 2018, a result of reasonably solid premium growth and low catastrophe losses offsetting slowing growth in house & auto sales, the fundamental driver of insurers’ top line performance. However, we think another step down in relative performance is in the offing.
Chart 1
House & auto sales have been in contraction for much of the past six months, which bodes ill for insurance profits that have already been struggling to keep pace with the broad market (second panel). This is largely reflected in the momentum of insurance pricing power, which has fallen into outright deflation for the first time since the post-GFC recovery (third panel). While insurers have seen a modest valuation contraction (bottom panel), the very slight discount does not offset the significant headwinds to future earnings. Bottom Line: Decelerating house & auto sales have caused insurers’ pricing power to fall off a cliff while valuations have proven, at least temporarily, more resilient; stay underweight the S&P insurance index. The ticker symbols for the stocks in this index are: BLBG: S5INSU – CB, MMC, MET, PGR, AON, PRU, AIG, AFL, TRV, ALL, WLTW, HIG, AJG, PFG, CINF, L, LNC, RE, TMK, UNM.
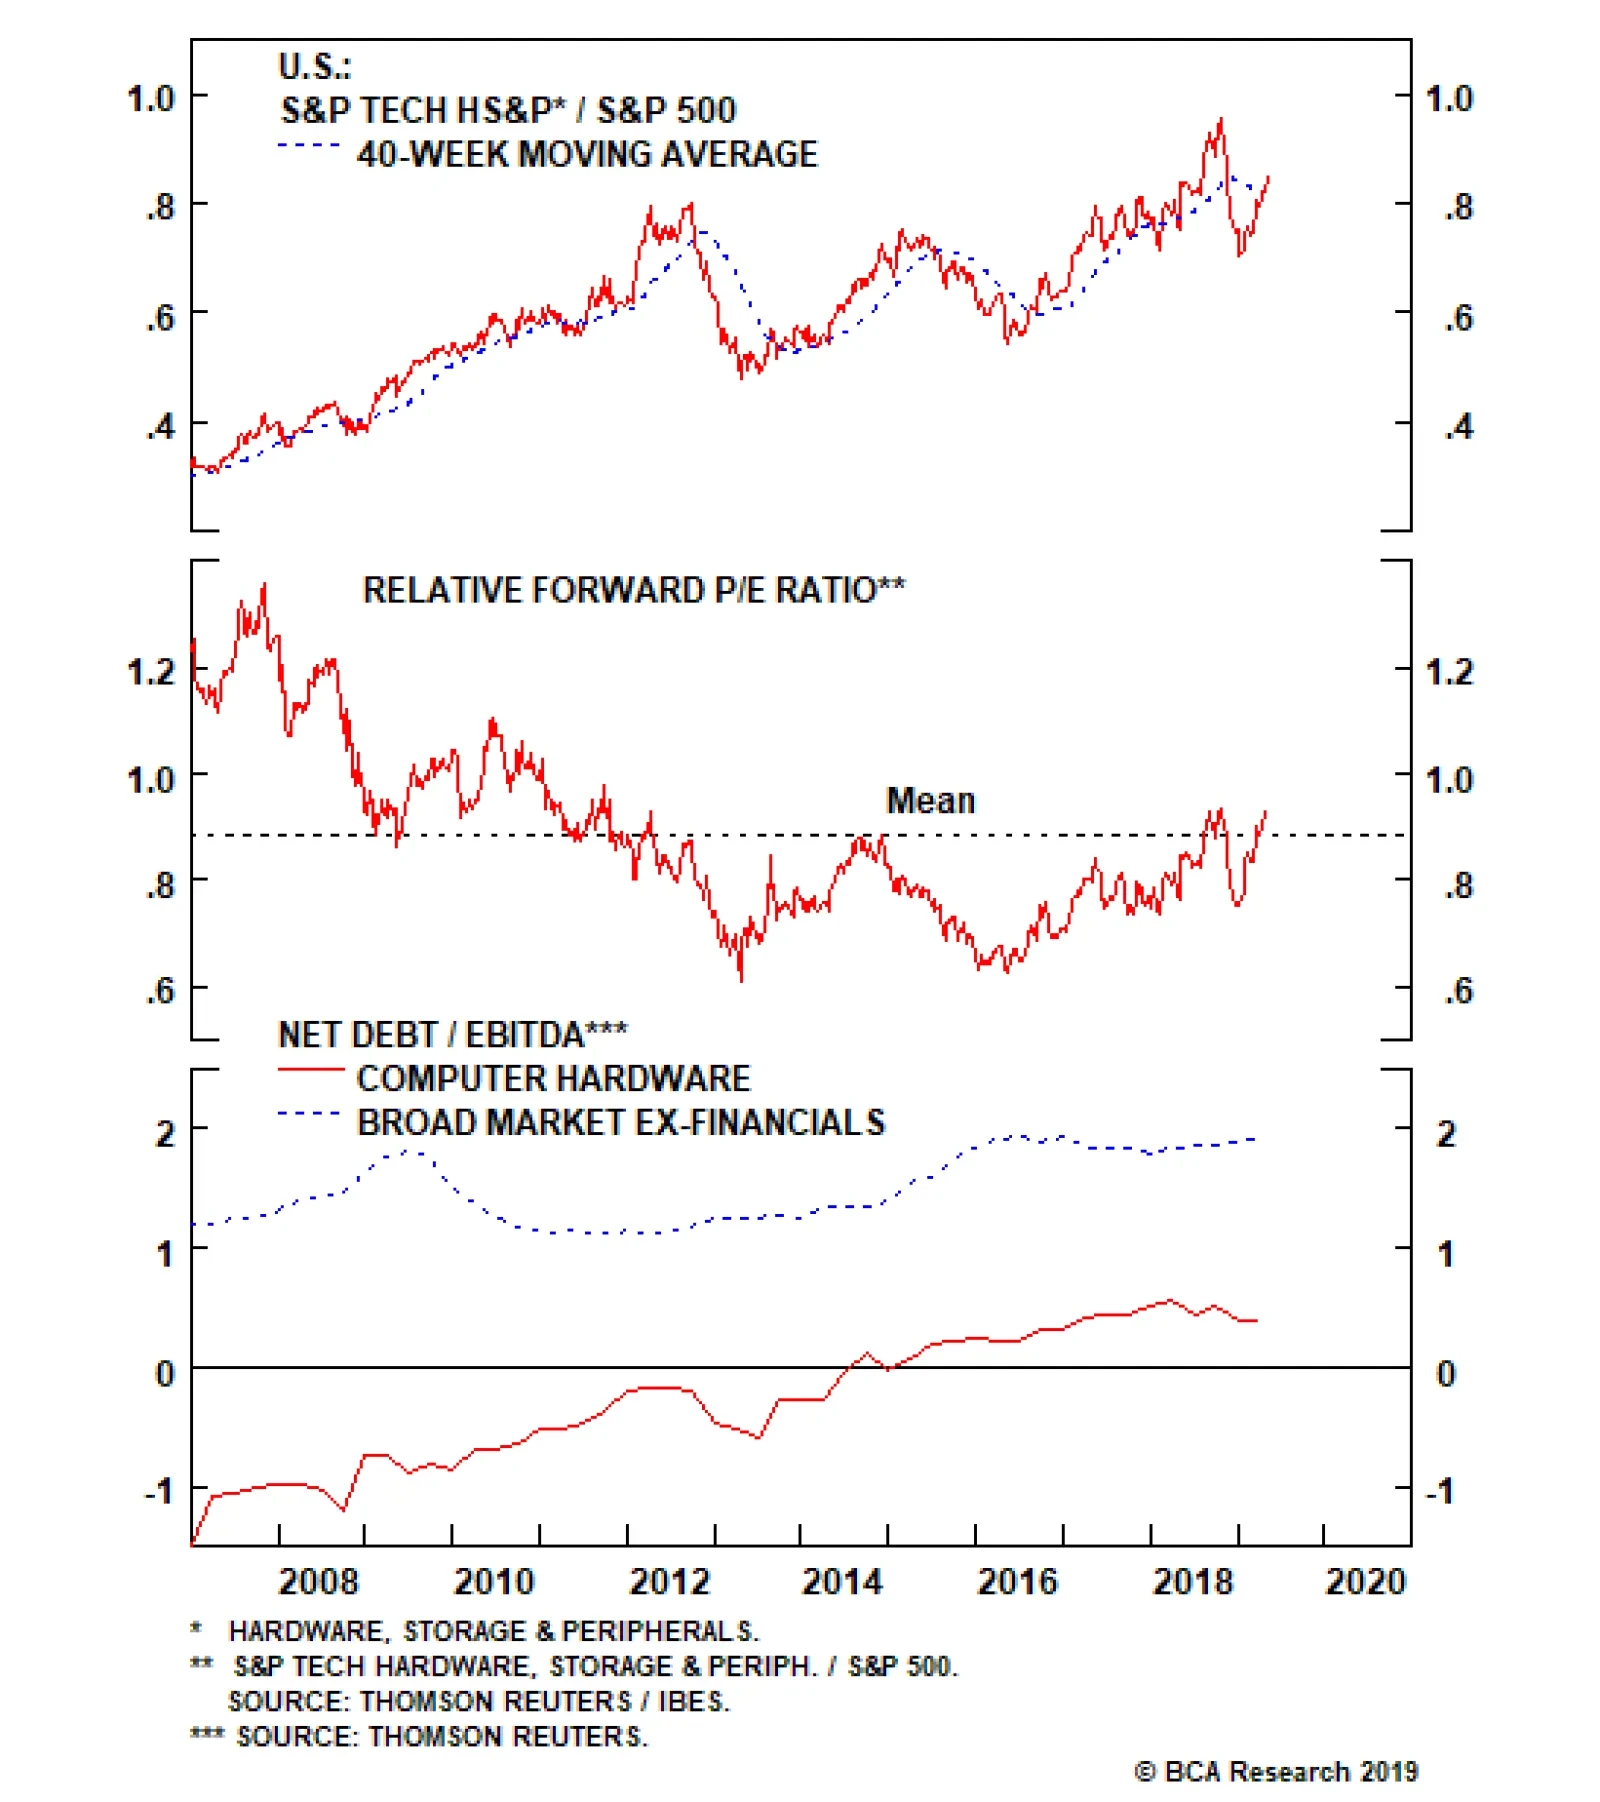
The Fed that has adopted an abruptly dovish stance and a recently inverted 10-year/fed funds rate yield curve indicates the market’s expectation that the next Fed move will be a cut, corroborated by elevated probabilities of a cut by December. This has driven a marked increase in client requests on positioning if rates are falling. Accordingly, we have updated our research to answer the question: what sectors perform best when the Fed eases? The results of our analysis of the seven Fed loosening cycles since 1965 are presented in the table below. The sector results are telling: defensives lead the pack in advance of a rate cut as market participants smell trouble and a defensive rotation occurs. The key source of funds in this defensive rotation in advance of a loosening cycle is S&P tech which underperforms early and continues to underperform dramatically through the initial stages of the loosening cycle. While we are not forecasting a cut and BCA’s view remains one of no recession for the coming 12 months, the production of this report may well be early. Nevertheless, its use as a sector positioning/return road map is evergreen; please see Monday’s Special Report for more details.
Chart 1
Our sector strategists recently examined the question of sector performance in an environment where the Fed is cutting rates. A Fed rate cut is not our base case view: leading indicators of inflation remain biased to the upside, the S&P 500 is close to…
Apple released its Q1 results last week. While not strong, they were better than the market had feared after the terrible Q4 print. Importantly, management commented that the rate of decline in China had eased significantly over the course of the…
Highlights Chart 1Is Low Inflation Transitory?
Is Low Inflation Transitory?
Is Low Inflation Transitory?
Persistent /pə’sıst(ə)nt/ adj. If inflation runs persistently above or below 2 percent, then the Fed would be forced to adjust its policy stance to nudge it back towards target. Transitory /’trænsıtərı/ adj. If inflation’s deviation from target is only transitory, it means that it will return to target even if the Fed maintains its current policy stance. Symmetrical /sı‘metrık(ə)l/ adj. The Fed’s inflation target is symmetrical because the FOMC is as concerned with undershoots as it is with overshoots. More recently, some members are urging the Fed to demonstrate the target’s symmetry by explicitly pursuing an overshoot. Last week, Chair Powell described recent low inflation readings as transitory (Chart 1). In other words, the Fed believes that interest rates are already low enough to send inflation higher over time. Equally, with downbeat inflation expectations signaling doubts about the symmetry of the Fed’s target (bottom panel), the committee is in no rush to hike. The result is status quo monetary policy for the time being. With the market priced for 25 basis points of rate cuts over the next 12 months, investors should keep portfolio duration low. Feature Investment Grade: Overweight Chart 2Investment Grade Market Overview
Investment Grade Market Overview
Investment Grade Market Overview
Investment grade corporate bonds outperformed the duration-equivalent Treasury index by 95 basis points in April, bringing year-to-date excess returns up to +365 bps. The corporate bond sector’s strong outperformance has resulted in spread tightening across the credit spectrum. In fact, average index spreads for the Aaa, Aa and A credit tiers are now at or below our fair value targets.1 Only the Baa credit tier, which accounts for about 50% of index market cap, remains attractively valued, with an average spread 11 bps above target (Chart 2). We recommend that investors focus their investment grade credit exposure on Baa-rated bonds. The combination of above-trend economic growth and accommodative Fed policy creates a favorable environment for credit risk. Spreads should continue to tighten in the near-term. However, we will turn more cautious once Baa spreads reach our target. Gross corporate leverage ticked higher in Q4, breaking a year-long downtrend (panel 4). Meantime, while C&I lending standards eased slightly in Q1 after having tightened in Q4 (bottom panel), C&I loan demand contracted for the third consecutive quarter. Weaker loan demand in the Fed’s Senior Loan Officer Survey often precedes tighter lending standards, and tighter lending standards usually coincide with wider corporate bond spreads.
Chart
Chart
High-Yield: Overweight Chart 3High-Yield Market Overview
High-Yield Market Overview
High-Yield Market Overview
High-Yield outperformed the duration-equivalent Treasury index by 137 basis points in April, bringing year-to-date excess returns up to +710 bps. Junk spreads for all credit tiers remain above our spread targets (Chart 3).2 At present: The Ba-rated option-adjusted spread is 214 bps, 35 bps above target. The B-rated spread is 356 bps, 79 bps above target. The Caa-rated spread is 709 bps, 145 bps above target. An alternative valuation measure, the excess spread available in the junk index after accounting for expected default losses, is currently 267 bps, slightly above average historical levels (panel 4). However, this measure uses the Moody’s baseline default rate forecast of 1.7% for the next 12 months. For that forecast to be realized, it would require a substantial decline from the current default rate of 2.4%. In a previous Special Report, we flagged some reasons why the Moody’s forecast might be too optimistic.3 Among them is the increase in job cut announcements, which remains a concern despite last month’s drop (bottom panel). If we assume that the default rate holds at 2.4% for the next 12 months, the default-adjusted junk spread would fall to 237 bps. Still reasonably attractive by historical standards, and consistent with positive excess returns. MBS: Neutral Chart 4MBS Market Overview
MBS Market Overview
MBS Market Overview
Mortgage-Backed Securities underperformed the duration-equivalent Treasury index by 1 basis point in April, dragging year-to-date excess returns down to +27 bps. The conventional 30-year zero-volatility spread widened 1 bp on the month, as a 5 bps widening in the option-adjusted spread (OAS) was partially offset by a 4 bps drop in the compensation for prepayment risk (option cost). At 42 bps, the conventional 30-year OAS now looks elevated compared to recent years, though it remains below the pre-crisis mean (Chart 4). In fact, we would assign high odds to MBS outperformance during the next few months. Not only is the OAS attractive, but mortgage refinancings – which have recently caused the nominal MBS spread to widen – have probably peaked (panel 2). Following its sharp decline earlier in the year, the 30-year mortgage rate has now leveled-off. Another downleg is unlikely, given the recent improvements in housing data. New home sales and mortgage purchase applications have both surged in recent months, while homebuilder optimism remains close to one standard deviation above its long-run mean.4 Moreover, even at current mortgage rates we calculate that only about 17% of the conventional 30-year MBS index is refinanceable. All in all, given that corporate credit offers higher expected returns, we continue to recommend only a neutral allocation to MBS. However, MBS spreads are very likely to tighten during the next few months. Government-Related: Underweight Chart 5Government-Related Market Overview
Government-Related Market Overview
Government-Related Market Overview
The Government-Related index outperformed the duration-equivalent Treasury index by 37 basis points in April, bringing year-to-date excess returns up to +152 bps. Sovereign debt outperformed duration-equivalent Treasuries by 83 bps on the month, bringing year-to-date excess returns up to +420 bps. Local Authorities outperformed the Treasury benchmark by 67 bps and Foreign Agencies outperformed by 40 bps, bringing year-to-date excess returns up to +208 bps and +192 bps, respectively. Domestic Agencies outperformed by 10 bps in April, bringing year-to-date excess returns up to +29 bps. Supranationals outperformed by 7 bps on the month, bringing year-to-date excess returns up to +23 bps. The Fed’s on-hold policy stance and signs of improvement in leading global growth indicators could set the U.S. dollar up for a period of weakness. All else equal, a softer dollar makes USD-denominated sovereign debt easier to service, benefiting spreads. However, a period of dollar weakness driven by improving global growth would also benefit U.S. corporate bonds, and valuation is heavily tilted in favor of U.S. corporate debt relative to sovereigns (Chart 5). Given that the last period of significant sovereign outperformance versus corporates was preceded by much more attractive valuation (panels 2 & 3), we maintain an underweight allocation to sovereign debt for the time being. We make an exception for Mexican sovereign debt, where spreads are attractive compared to similarly rated U.S. corporates (bottom panel). Our Emerging Markets Strategy service also thinks that the market is taking too dim a view of Mexican government finances.5 Municipal Bonds: Overweight Chart 6Municipal Market Overview
Municipal Market Overview
Municipal Market Overview
Municipal bonds outperformed the duration-equivalent Treasury index by 52 basis points in April, bringing year-to-date excess returns up to +105 bps (before adjusting for the tax advantage). The average Aaa-rated Municipal / Treasury yield ratio fell 3% in April, and currently sits at 78% (Chart 6). This is more than one standard deviation below its post-crisis mean and slightly below the average of 81% that prevailed in the late stages of the previous cycle, between mid-2006 and mid-2007. Long-dated municipal bonds (10-year, 20-year and 30-year) outperformed short-dated munis (2-year and 5-year) dramatically last month, but yield ratios at the long end remain well above those at the short end of the curve (panel 2). In other words, the best value in the municipal bond space continues to be found at the long-end of the Aaa muni curve. We showed in a recent report that lower-rated and shorter-maturity munis are much less attractive.6 First quarter GDP data revealed that state & local government tax revenues snapped back sharply in Q1, following a contraction in 2018 Q4. Meanwhile, current expenditures actually ticked down. Incorporating an assumption for Q1 corporate tax revenues, we forecast that state & local government interest coverage jumped to 16% in Q1 from 4% in 2018 Q4.7 This is consistent with municipal ratings upgrades continuing to outpace downgrades for the time being (bottom panel). Treasury Curve: Adopt A Barbell Curve Positioning Chart 7Treasury Yield Curve Overview
Treasury Yield Curve Overview
Treasury Yield Curve Overview
The Treasury curve bear-steepened in April. The 2/10 Treasury slope steepened 10 bps on the month and currently sits at 21 bps (Chart 7). The 5/30 slope steepened 7 bps on the month and currently sits at 60 bps. In recent reports we have urged investors to adopt barbell positions along the yield curve. In particular, investors should avoid the 5-year and 7-year maturities and instead focus their allocations at the very short and long ends of the curve.8 There are three main reasons to prefer a barbell positioning. First, the 5-year and 7-year yields are most sensitive to changes in our 12-month discounter. In other words, those yields fall the most when the market prices in rate cuts and rise the most when it prices in rate hikes. With recession likely to be avoided this year, the market will eventually price rate hikes back into the curve. Second, barbells currently offer a yield pick-up relative to bullets. The duration-matched 2/10 barbell offers 8 bps more yield than the 5-year bullet (panel 4), and the duration-matched 2/30 barbell offers 5 bps more yield than the 7-year bullet. This means that investors will earn positive carry in barbell positions while they wait for rate hikes to get priced back in. Finally, almost all barbell combinations look cheap according to our yield curve fair value models (see Appendix B). TIPS: Overweight Chart 8TIPS Market Overview
Inflation Compensation
Inflation Compensation
TIPS outperformed the duration-equivalent nominal Treasury index by 81 basis points in April, bringing year-to-date excess returns up to +157 bps. The 10-year TIPS breakeven inflation rate rose 13 bps on the month and currently sits at 1.91% (Chart 8). The 5-year/5-year forward TIPS breakeven inflation rate rose 12 bps on the month and currently sits at 2.02%. Both rates remain below the 2.3% - 2.5% range that has historically been consistent with inflation expectations that are well-anchored around the Fed’s target. As we noted in a recent report, the Fed has clearly pivoted to a more dovish stance in an effort to re-anchor inflation expectations at levels more consistent with its 2% target.9 This change should support wider TIPS breakevens, though investors will also need to see evidence of firming realized inflation before meaningful upside materializes. So far, such evidence is in short supply. Year-over-year core PCE inflation dipped to 1.55% in March. However, as Fed Chair Powell went out of his way to mention in last week’s press conference, core PCE was dragged down by one-off adjustments in the ‘Clothing & Footwear’ and ‘Financial Services’ components. In fact, 12-month trimmed mean PCE inflation actually moved up in March. It now sits at 1.96%, just below the Fed’s target (bottom panel). The combination of a dovish Fed and above-trend economic growth should push TIPS breakevens higher over time. Maintain an overweight allocation to TIPS versus nominal Treasuries. ABS: Underweight Chart 9ABS Market Overview
ABS Market Overview
ABS Market Overview
Asset-Backed Securities outperformed the duration-equivalent Treasury index by 9 basis points in April, bringing year-to-date excess returns up to +49 bps. The index option-adjusted spread for Aaa-rated ABS narrowed one basis point on the month and, at 32 bps, it remains close to its all-time low (Chart 9). In addition to poor valuation, the sector’s credit fundamentals are also shifting in a negative direction. Household interest payments continue to trend up, suggesting a higher delinquency rate going forward (panel 3). Meanwhile, the Fed’s Senior Loan Officer Survey revealed that average consumer lending standards tightened in Q1 for the second consecutive quarter. Tighter lending standards usually coincide with rising consumer delinquencies (bottom panel). Loan officers also reported slowing demand for credit cards for the fifth consecutive quarter, and slowing auto loan demand for the third consecutive quarter. The combination of poor value and deteriorating credit quality leads us to recommend an underweight allocation to consumer ABS. Non-Agency CMBS: Neutral Chart 10CMBS Market Overview
CMBS Market Overview
CMBS Market Overview
Non-Agency Commercial Mortgage-Backed Securities outperformed the duration-equivalent Treasury index by 40 basis points in April, bringing year-to-date excess returns up to +187 bps. The index option-adjusted spread for non-agency Aaa-rated CMBS tightened 6 bps on the month. It currently sits at 67 bps, below its average pre-crisis level but somewhat higher than levels seen last year (Chart 10). In a recent report, we noted that non-agency CMBS offer the best risk/reward trade-off of any Aaa-rated U.S. spread product.10 While we remain cautious on the macro outlook for commercial real estate, noting that prices are decelerating (panel 3) and banks are tightening lending standards (panel 4) amidst falling demand (bottom panel), we view elevated CMBS spreads as providing reasonable compensation for this risk for the time being. Agency CMBS: Overweight Agency CMBS outperformed the duration-equivalent Treasury index by 21 basis points in April, bringing year-to-date excess returns up to +95 bps. The index option-adjusted spread tightened 2 bps on the month and currently sits at 47 bps. The Excess Return Bond Map in Appendix C shows that Agency CMBS offer high potential return compared to other low-risk spread products. An overweight allocation to this defensive sector remains appropriate. Appendix A - The Golden Rule Of Bond Investing We follow a two-step process to formulate recommendations for bond portfolio duration. First, we determine the change in the federal funds rate that is priced into the yield curve for the next 12 months. Second, we decide – based on our assessments of the economy and Fed policy – whether the change in the fed funds rate will exceed or fall short of what is priced into the curve. Most of the time, a correct answer to this question leads to the appropriate duration call. We call this framework the Golden Rule Of Bond Investing, and we demonstrated its effectiveness in the U.S. Bond Strategy Special Report, “The Golden Rule Of Bond Investing”, dated July 24, 2018, available at usbs.bcaresearch.com. Chart 11 illustrates the Golden Rule’s track record by showing that the Bloomberg Barclays Treasury Master Index tends to outperform cash when rate hikes fall short of 12-month expectations, and vice-versa. At present, the market is priced for 25 basis points of cuts during the next 12 months. We do not anticipate any rate cuts during this timeframe, and therefore recommend that investors maintain below-benchmark portfolio duration. Chart 11The Golden Rule's Track Record
The Golden Rule's Track Record
The Golden Rule's Track Record
We can also use our Golden Rule framework to make 12-month total return and excess return forecasts for the Bloomberg Barclays Treasury index under different scenarios for the fed funds rate. Excess returns are relative to the Bloomberg Barclays Cash index. To forecast total returns we first calculate the 12-month fed funds rate surprise in each scenario by comparing the assumed change in the fed funds rate to the current value of our 12-month discounter. This rate hike surprise is then mapped to an expected change in the Treasury index yield using a regression based on the historical relationship between those two variables. Finally, we apply the expected change in index yield to the current characteristics (yield, duration and convexity) of the Treasury index to estimate total returns on a 12-month horizon. The below tables present those results, along with 95% confidence intervals. Excess returns are calculated by subtracting assumed cash returns in each scenario from our total return projections.
Image
Image
Appendix B - Butterfly Strategy Valuation The following tables present the current read-outs from our butterfly spread models. We use these models to identify opportunities to take duration-neutral positions across the Treasury curve. The following two Special Reports explain the models in more detail: U.S. Bond Strategy Special Report, “Bullets, Barbells And Butterflies”, dated July 25, 2017, available at usbs.bcaresearch.com U.S. Bond Strategy Special Report, “More Bullets, Barbells And Butterflies”, dated May 15, 2018, available at usbs.bcaresearch.com Table 4 shows the raw residuals from each model. A positive value indicates that the bullet is cheap relative to the duration-matched barbell. A negative value indicates that the barbell is cheap relative to the bullet. Table 4Butterfly Strategy Valuation: Raw Residuals In Basis Points (As of April 30, 2019)
The Fed's Inflation Dictionary
The Fed's Inflation Dictionary
Table 5 scales the raw residuals in Table 4 by their historical means and standard deviations. This facilitates comparison between the different butterfly spreads. Table 5Butterfly Strategy Valuation: Standardized Residuals (As of April 30, 2019)
The Fed's Inflation Dictionary
The Fed's Inflation Dictionary
Table 6 flips the models on their heads. It shows the change in the slope between the two barbell maturities that must be realized during the next six months to make returns between the bullet and barbell equal. For example, a reading of +56 bps in the 5 over 2/10 cell means that we would only expect the 5-year to outperform the 2/10 if the 2/10 slope steepens by more than 56 bps during the next six months. Otherwise, we would expect the 2/10 barbell to outperform the 5-year bullet. Table 6Discounted Slope Change During Next 6 Months (BPs)
The Fed's Inflation Dictionary
The Fed's Inflation Dictionary
Appendix C - Excess Return Bond Map The Excess Return Bond Map is used to assess the relative risk/reward trade-off between different sectors of the U.S. fixed income market. The Map employs volatility-adjusted breakeven spread analysis to show how likely it is that a given sector will earn/lose money during the subsequent 12 months. The Map does not incorporate any macroeconomic view. The horizontal axis of the Map shows the number of days of average spread widening required for each sector to lose 100 bps versus a position in duration-matched Treasuries. Sectors plotting further to the left require more days of average spread widening and are therefore less likely to see losses. The vertical axis shows the number of days of average spread tightening required for each sector to earn 100 bps in excess of duration-matched Treasuries. Sectors plotting further toward the top require fewer days of spread tightening and are therefore more likely to earn 100 bps of excess return.
Chart 12
Ryan Swift, U.S. Bond Strategist rswift@bcaresearch.com Jeremie Peloso, Research Analyst jeremiep@bcaresearch.com Footnotes 1 For further details on how we arrive at our spread targets please see U.S. Bond Strategy Weekly Report, “Paid To Wait”, dated February 26, 2019, available at usbs.bcaresearch.com 2 For further details on how we arrive at our spread targets please see U.S. Bond Strategy Weekly Report, “Paid To Wait”, dated February 26, 2019, available at usbs.bcaresearch.com 3 Please see U.S. Bond Strategy Special Report, “Assessing Corporate Default Risk”, dated March 19, 2019, available at usbs.bcaresearch.com 4 Please see U.S. Bond Strategy Weekly Report, “A High Bar For Rate Cuts”, dated April 30, 2019, available at usbs.bcaresearch.com 5 Please see Emerging Markets Strategy Special Report, “Mexico: The Best Value In EM Fixed Income”, dated April 23, 2019, available at ems.bcaresearch.com 6 Please see U.S. Bond Strategy Weekly Report, “Full Speed Ahead”, dated April 16, 2019, available at usbs.bcaresearch.com 7 Corporate tax revenue is not released until the second GDP estimate. We assume that the 2019 Q1 value equals the 2018 Q4 value. 8 Please see U.S. Bond Strategy Weekly Report, “Paid To Wait”, dated February 26, 2019, available at usbs.bcaresearch.com 9 Please see U.S. Bond Strategy Weekly Report, “The New Battleground For Monetary Policy”, dated March 26, 2019, available at usbs.bcaresearch.com 10 Please see U.S. Bond Strategy Weekly Report, “The Search For Aaa Spread”, dated March 12, 2019, available at usbs.bcaresearch.com Fixed Income Sector Performance Recommended Portfolio Specification Corporate Sector Relative Valuation And Recommended Allocation
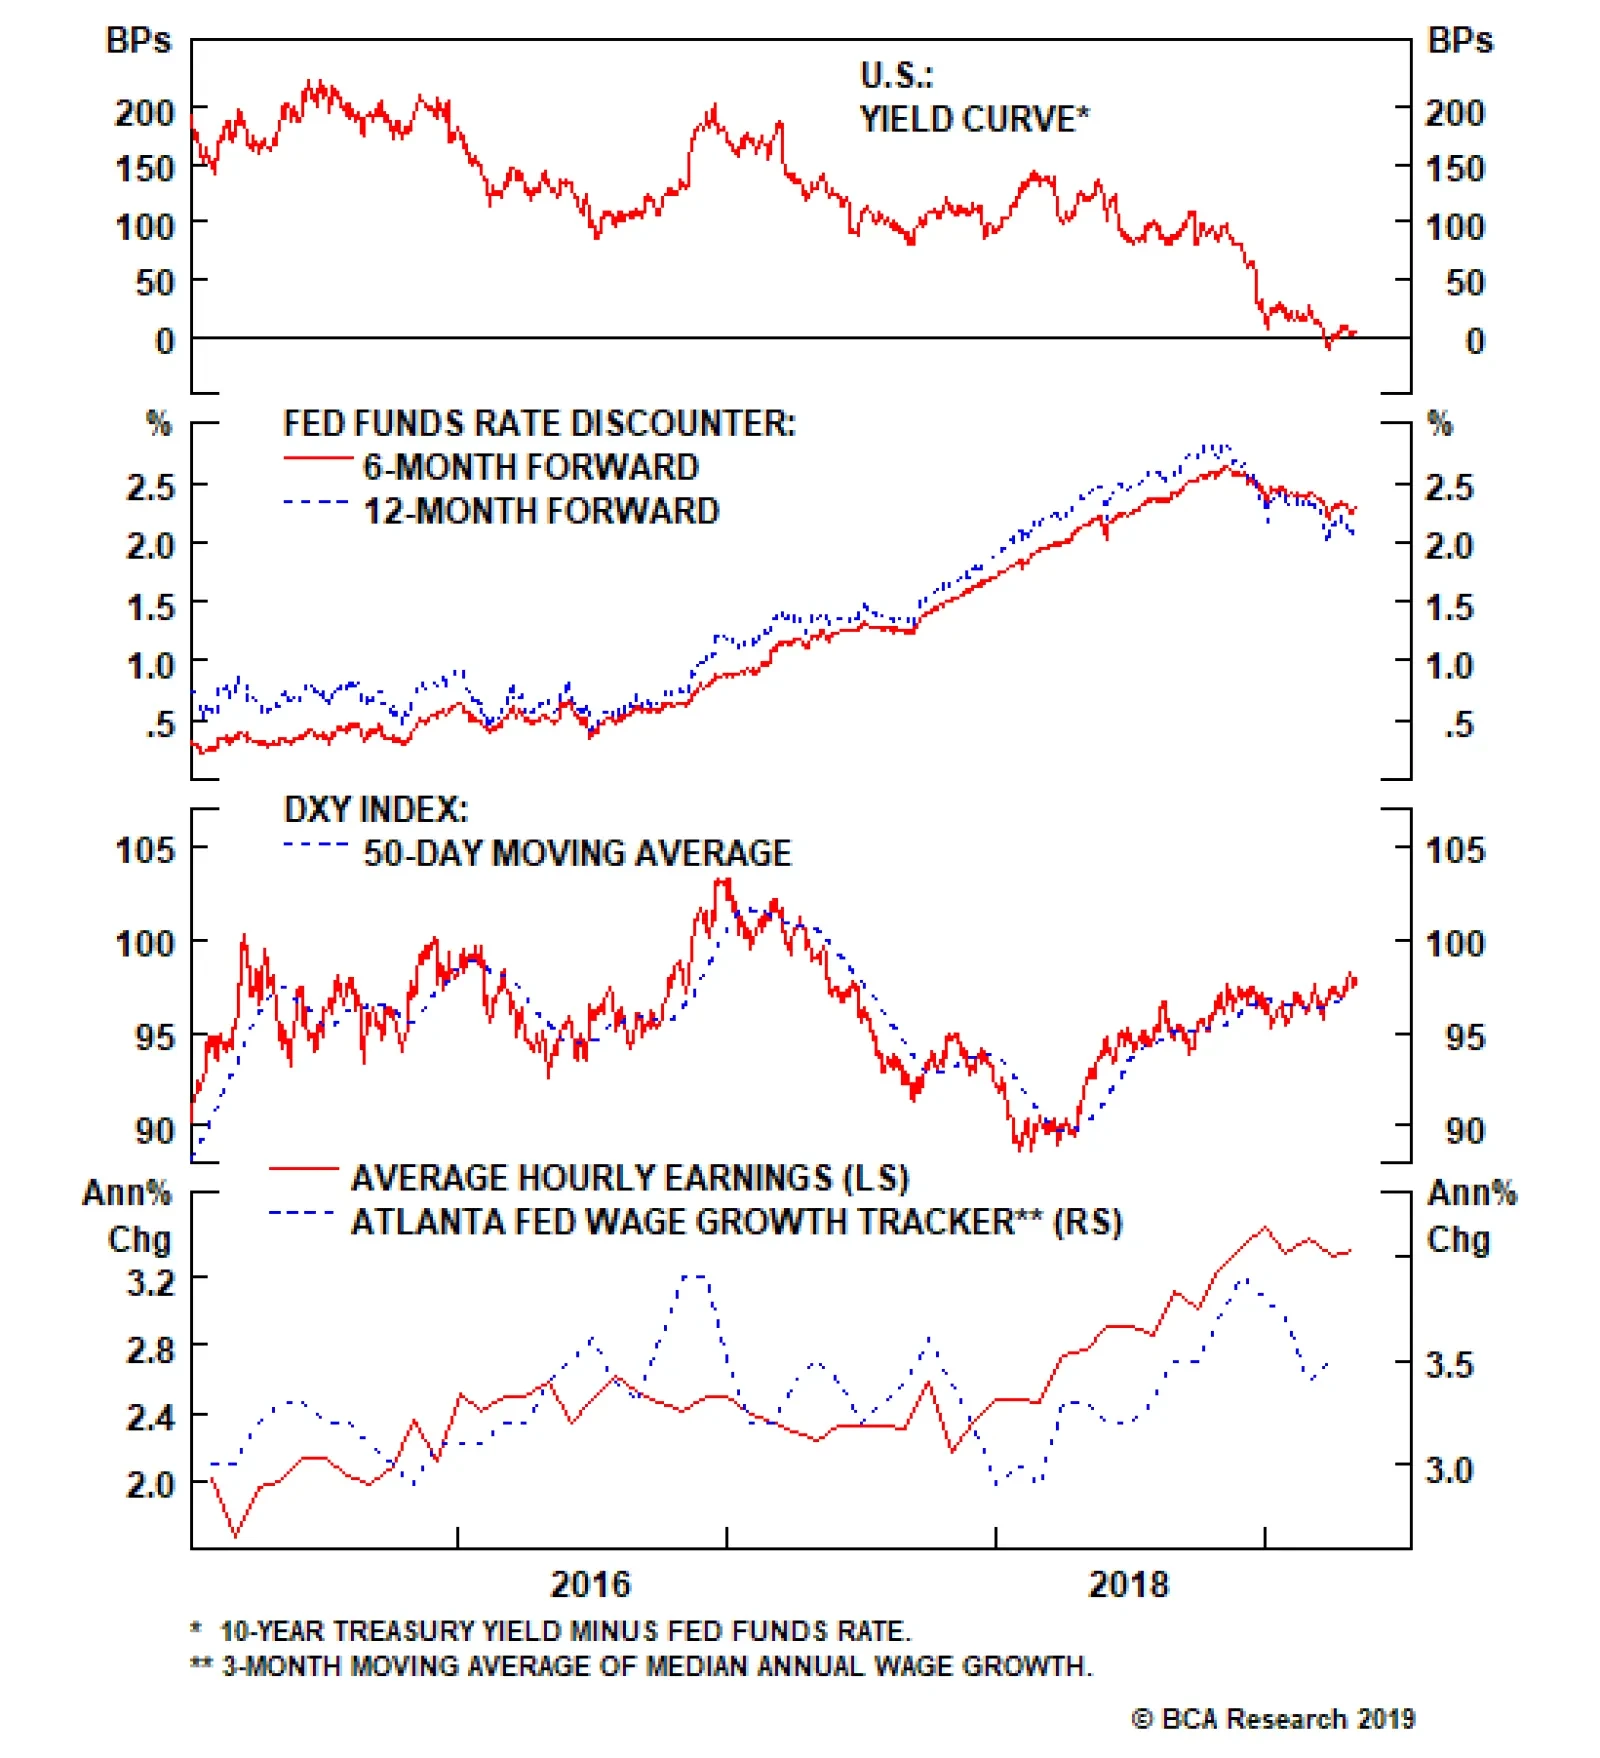
Feature Leading indicators of inflation, and hence a hawkish Fed, remain biased to the upside. The S&P 500 is close to all-time highs, the U.S. dollar has been strong this year, and wage growth has been resilient. Almost exactly eight years ago, we published a report examining historical sector performance across the various Fed tightening cycles.1 We now find ourselves on the other side with a Fed that has adopted an abruptly dovish stance and a recently inverted 10-year/fed funds rate yield curve indicating the market’s expectation that the next Fed move will be a cut. Accordingly, we have updated our research to analyze the opposite perspective when rates are falling and answer the question: what sectors perform best when the Fed eases? Such an exercise may seem ill-timed; leading indicators of inflation, and hence a hawkish Fed, remain biased to the upside. The S&P 500 is close to all-time highs, the U.S. dollar has been strong this year, and wage growth has been resilient (Chart 1). Nevertheless, we have been inundated by client requests on this topic and, while we may well be early in its production, its use as a sector positioning/return road map is evergreen and not necessarily to forecast that a Fed cut is nearing. Chart 1Inflation Indicators Still Don’t Point To A Cut
Inflation Indicators Still Don’t Point To A Cut
Inflation Indicators Still Don’t Point To A Cut
The results of our analysis of the seven Fed loosening cycles since 1965 are presented in Table 1. While we highlight the May 1980 iteration as an easing cycle, we have excluded it from our analysis owing to its returns overlap with the March 1981 iteration less than a year later, which offers a cleaner analysis. Table 1Sector Relative Performance And Seven Fed Easing Cycles
Sector Performance And Fed Loosening Cycles: A Historical Roadmap
Sector Performance And Fed Loosening Cycles: A Historical Roadmap
Still, the sector results are telling: defensives lead the pack in advance of a rate cut as market participants smell trouble and a defensive rotation occurs. Some of the results should be taken with a grain of salt. As shown in Table 1, the broad market delivers significant returns 24 months after an easing cycle begins. However, the last two easing cycles (January 2001 and September 2007) witnessed the S&P returning -37% and -31%, respectively, two years post rate cut. Thus, a rate cut does not signal with certainty a positive two year return. The key source of funds in this defensive rotation in advance of a loosening cycle is S&P tech which underperforms early and continues to underperform dramatically through the initial stages of the loosening cycle. Still, the sector results are telling: defensives lead the pack in advance of a rate cut as market participants smell trouble and a defensive rotation occurs (Chart 2). However, the results are not unambiguous as the rate-sensitive defensive S&P utilities and S&P telecoms indexes both underperform early while S&P consumer staples and S&P health care are the top performers of all sectors prior to, and both one and two years post rate cut (Charts 4 & 5).
Chart 2
Chart 3
The key source of funds in this defensive rotation in advance of a loosening cycle is S&P tech which underperforms early and continues to underperform dramatically through the initial stages of the loosening cycle (Chart 3). This is an excellent and consistent leading signal that we are monitoring closely. S&P tech’s deep cyclical peer S&P industrials surprisingly does not show advance warning of a loosening cycle, though persistently underperform once the cycle is underway. Also surprising is S&P energy’s outperformance in the early stages of a lower rate environment.
Chart 4
Chart 5
The current implied fed funds probabilities are roughly 50-50 for a rate cut at the Fed’s December 2019 meeting and move increasingly towards a rate cut thereafter. While we are not forecasting a cut and BCA’s view remains one of no recession for the coming 12 months, were a Fed cut to materialize, our barbell portfolio approach will likely be able to absorb the Fed shock. We highlight our overweight recommendation on S&P consumer staples and S&P energy along with our neutral recommendation on S&P health care as sector winners in an easing cycle and our underweight recommendation for S&P consumer discretionary as a sector laggard as rates fall. We further note our neutral recommendation on S&P tech. The reference charts below show individual sector relative performance charts along with the fed funds rate (shaded areas depict the initial Fed rate cut). Chris Bowes, Associate Editor U.S. Equity Strategy ChrisB@bcaresearch.com Anastasios Avgeriou, U.S. Equity Strategist anastasios@bcaresearch.com Chart 6
CHART 6
CHART 6
Chart 7
CHART 7
CHART 7
Chart 8
CHART 8
CHART 8
Chart 9
CHART 9
CHART 9
Chart 10
CHART 10
CHART 10
Chart 11
CHART 11
CHART 11
Chart 12
CHART 12
CHART 12
Chart 13
CHART 13
CHART 13
Chart 14
CHART 14
CHART 14
Chart 15
CHART 15
CHART 15
Footnotes 1 Please see BCA U.S. Equity Strategy Special Report, “Sector Performance And Fed Tightening Cycles: An Historical Roadmap” dated April 25, 2011, available at uses.bcaresearch.com.
A Mixed Bag Of Earnings In Social Media
A Mixed Bag Of Earnings In Social Media
Underweight (High-Conviction) The last two weeks have seen earnings reports from the S&P interactive media & services index’s heavyweights Alphabet (the parent of Google) and Facebook and the prints were varied. Facebook reported revenue ahead of estimates and falling, but still solid, margins and the stock price soared. However, Alphabet reported slowing growth that drove the worst single-day share performance in seven years. A theme in both quarterly results were regulatory fines; privacy violations saw Facebook set aside $3 billion for an expected fine from the Federal Trade Commission while Alphabet’s earnings were lowered by the $1.7 billion fine over advertising violations from the EU. As a reminder, increasing regulation is core to our high-conviction underweight thesis. With respect to fundamentals, the S&P interactive media & services index’s forward earnings growth has fallen below that of the broad market (second panel) while above-market share price performance so far in 2019 has driven the valuation premium to extreme levels (bottom panel). This is a mismatch that we expect to be resolved via significant relative underperformance in the year to come. We reiterate our high-conviction underweight recommendation. The ticker symbols in the stocks in this index are: S5INMS – GOOGL, GOOG, FB, TWTR and TRIP.
Highlights In Indonesia, investors are ignoring the weakness in global growth, which is an important driver of the country’s financial markets. The Indonesian currency, equities and local currency bonds all remain vulnerable. We continue to recommend underweighting Indonesian assets for now. In Turkey, additional adjustments in the exchange rate and interest rates are unavoidable. Stay put/underweight Turkish financial markets. In the UAE, the economy is set to improve marginally this year. We recommend overweighting UAE equities and corporate spreads within their respective EM portfolios. Feature Indonesia: The Currency And Bank Stocks Are At Risk Indonesian financial assets have benefited from the Federal Reserve’s dovish turn and corresponding fall in U.S. bond yields (Chart I-1, top panel). Moreover, the market is cheering President Joko Widodo’s lead in the presidential vote tally. Yet investors are ignoring the budding weakness in industrial metals prices, which has historically been an important driver of Indonesia’s exchange rate (Chart I-1, middle panel). Going forward, the Indonesian currency, equities and local currency bonds all remain vulnerable: Falling global growth in general and Chinese imports in particular will intensify Indonesia’s exports contraction and worsen the country’s already wide current account deficit. In turn, the latter will induce currency depreciation, which will then lead to higher interbank rates (Chart I-2). Chart I-1Global Growth Matters For Indonesian Markets
Global Growth Matters For Indonesian Markets
Global Growth Matters For Indonesian Markets
Chart I-2Falling Current Account Deficit = Higher Local Rates
Falling Current Account Deficit = Higher Local Rates
Falling Current Account Deficit = Higher Local Rates
Upward pressure on local interbank rates will cause a slowdown in domestic private loan growth. The Indonesian central bank – Bank Indonesia (BI) – has been attempting to lower interbank rates, which have been hovering above the central bank's policy rate (Chart I-3). To achieve this, the central bank has substantially increased excess reserves in the banking system (Chart I-4). It has done so by purchasing central bank certificates from commercial banks, conducting foreign exchange swaps and providing repo lending. Chart I-3A Sign Of Liquidity Strains
A Sign Of Liquidity Strains
A Sign Of Liquidity Strains
Chart I-4Bank Indonesia Is Injecting Liquidity
Bank Indonesia Is Injecting Liquidity
Bank Indonesia Is Injecting Liquidity
Yet by expanding banking system liquidity so aggressively, BI risks renewed currency depreciation. Like any central bank in a country with an open capital account, BI cannot expect to have full control over the exchange rate while simultaneously targeting local interest rates. The Impossibly Trinity dilemma dictates that a central bank needs to choose between controlling the two. Yet investors are ignoring the budding weakness in industrial metals prices, which has historically been an important driver of Indonesia’s exchange rate. Therefore, if BI continues to inject local currency liquidity to cap or bring down interest rates (interbank rates), the resulting excess liquidity could encourage and facilitate speculation against the rupiah. Scratching below the surface, the recent strong outperformance of Indonesian equities has been entirely due to the surge in the country’s bank share prices (Chart I-5, top panel). Remarkably, the performance of Indonesian non-financial as well as small-cap stocks has been especially dismal (Chart I-5, middle and bottom panels). This is an upshot of poor profitability among Indonesia’s non-financial listed companies (Chart I-6). Chart I-5Indonesian Bank Stocks Are The Only Outperformers
Indonesian Bank Stocks Are The Only Outperformers
Indonesian Bank Stocks Are The Only Outperformers
Chart I-6Falling Non-Financial Corporate Profitability
Falling Non-Financial Corporate Profitability
Falling Non-Financial Corporate Profitability
Furthermore, deteriorating financial health of non-financial corporates, especially small companies, will lead to higher NPLs on banks’ books. Notably, Indonesian banks are more heavily exposed to businesses than to households. As NPLs rise anew, Indonesian commercial banks will need to lift their bad-loan provisioning levels, generating a major profit relapse (Chart I-7). Importantly, Indonesian commercial banks have been boosting their profits by reducing NPL provisions since early 2018. Reversing this will materially affect their earnings. Chart I-7Indonesian Bank Share Prices Are Vulnerable
Indonesian Bank Share Prices Are Vulnerable
Indonesian Bank Share Prices Are Vulnerable
Additionally, bank stocks are vulnerable due to falling net interest income margins. Moreover, their share prices are overbought and not cheap. To be clear, we are not negative on Indonesia’s structural outlook. The above-mentioned alarms are more near-to-medium terms issues. Still, foreign ownership of local currency bonds and stocks – at 38% each – are high, and could be a major source of potential outflows if the rupiah depreciates. This would cause Indonesian stocks and local currency bonds to sell off severely. Bottom Line: The global growth slowdown/commodities downturn and the U.S. dollar upturn are not yet over. Consequently, foreign flows into EM will diminish, which will be particularly negative for Indonesian financial markets. We recommend investors continue underweighting Indonesian equities and avoid Indonesian local currency bonds for now. We continue to recommend a short position in the IDR versus USD. Ayman Kawtharani, Associate Editor ayman@bcaresearch.com Turkey’s Foreign Debt Bubble: The Worst Is Not Yet Behind Us Turkish financial assets, and the currency especially, will remain under selling pressure in the coming months. Additional adjustments in the exchange rate and interest rates - as well as in the real economy and current account balance - appear unavoidable. The key imbalance remains the gap between foreign debt obligations (FDOs) and the availability of foreign currency to meet these debt obligations. Turkey’s FDOs in 2019 are equivalent to $180 billion (Chart II-1). FDOs measure the sum of short-term claims, interest payments and amortization over the next 12 months. This consists of $15 billion in interest payments, $65 billion in debt amortization and $100 billion in maturing short-term (under one year) claims. In theory, these debt obligations can either be rolled over, or the nation should generate current account and capital account surpluses and use these surpluses to pay down FDOs. Even though the current account deficit is shrinking, it is still in a deficit of $18 billion. Net FDI inflows remain weak at US$10 billion. Hence, it appears that Turkey’s only options are either to roll over maturing foreign currency debt or to lure foreign investors into local currency assets and use the surplus in net portfolio inflows to meet these FDOs. The central bank’s foreign currency reserves excluding both commercial banks’ deposits at the Central Bank of Turkey and FX swaps now stand at $13 billion. However, due to a lack of credibility in the Turkish government’s macro policies - in addition to the ongoing deep economic recession and heightened financial market volatility - external creditors will be unwilling to roll over the debt. In fact, net portfolio flows into government debt and equities have tumbled for the same reason. Typically, when foreign funding dries up temporarily, a country can use its foreign exchange reserves to meet its FDOs. However, Turkey’s foreign exchange reserves have already plummeted to extremely low levels (Chart II-2). The central bank’s foreign currency reserves excluding both commercial banks’ deposits at the Central Bank of Turkey and FX swaps now stand at $13 billion. This is negligible compared with the $180 billion FDO figure due in 2019. Chart II-1Turkey: A Large Foreign Debt Servicing Burden
Turkey: A Large Foreign Debt Servicing Burden
Turkey: A Large Foreign Debt Servicing Burden
Chart II-2Foreign Exchange Reserves Are Too Small
Foreign Exchange Reserves Are Too Small
Foreign Exchange Reserves Are Too Small
The recent plunge in the central bank’s net foreign exchange reserves excluding swaps (i.e. net international reserves) has put many pertinent metrics at record lows. In particular, net international reserves are at a precarious level relative to both total imports and external debt (Chart II-3). Finally, the net international reserves-to-broad money supply ratio has fallen to 7% (from 15% in 2014) despite the fact that the massive lira depreciation reduced the U.S. dollar measure of broad money supply (Chart II-4). Chart II-3FX Reserves Do Not Cover Imports Or External Debt
FX Reserves Do Not Cover Imports Or External Debt
FX Reserves Do Not Cover Imports Or External Debt
Chart II-4Low Coverage Of Broad Money By International Reserves
Low Coverage Of Broad Money By International Reserves
Low Coverage Of Broad Money By International Reserves
The currency will have to depreciate further and interest rates will have to move higher to shrink domestic demand/imports more. This is needed to generate a current account surplus that could be used to service FDOs, or that otherwise entices foreign creditors to be willing to roll over foreign debt or invest in Turkey. Finally, while the adjustment in the real economy is advanced, it is unlikely to be over, due to the large foreign debt bubble. Importantly, with large foreign and local currency debt obligations coming due for both companies and households - in addition to the deterioration in economic activity and higher interest rates - NPLs are bound to rise (Chart II-5). This is especially likely to occur because a lot of borrowing has been used in the property market both for construction and purchases. Notably, real estate volumes are shrinking, and prices are deflating in real terms (Chart II-6). Chart II-5NPLs Will Rise A Lot
NPLs Will Rise A Lot
NPLs Will Rise A Lot
Chart II-6Turkey: Real Estate Is In Free Fall
Turkey: Real Estate Is In Free Fall
Turkey: Real Estate Is In Free Fall
Bottom Line: The macro adjustment in Turkey is not yet complete. The country still lacks foreign currency supply to service its enormous 2019 FDOs. Further currency depreciation and higher interest rates are required to depress domestic demand/imports and push the current account into surplus. Stay put / underweight Turkish financial markets. The authorities are becoming desperate, and the odds of capital control enforcement are not negligible. While such an outcome is not possible to forecast with any certainty or time frame, investors should consider this very real risk. Andrija Vesic, Research Analyst andrijav@bcaresearch.com Overweight UAE Equities And Corporate Bonds Over the next six to nine months, we believe both UAE equities and corporate spreads will outperform their respective emerging market (EM) benchmarks. The UAE economy is set to improve marginally this year (Chart III-1). It will benefit from expansionary fiscal policy, rising oil output, a buoyant tourism sector, a resilient banking sector and less of a drag from the real estate sector. First, sizable fiscal spending will lead to rising non-oil economic growth. The UAE’s federal budget spending for 2019 will increase by 17.3% from a year ago, much higher than the 5.5% year-on-year growth in 2018. Second, UAE oil output could increase by 15% later this year from current levels (Chart III-2). The U.S. announced on April 22 that all Iran sanction waivers will not be extended beyond the early-May expiration date. The U.S. administration also stated that it has secured pledges from Saudi Arabia and the UAE to increase their oil production in order to offset disrupted supply from Iran. Rising oil output will mitigate the negative impact of potentially lower oil prices on the UAE’s economy. Chart III-1Improving UAE Economy
Improving UAE Economy
Improving UAE Economy
Chart III-2Rising Oil Output
Rising Oil Output
Rising Oil Output
Third, the outlook for the tourism sector is also positive. The number of tourists is set to rise as Expo 2020 approaches. The government is targeting 20 million visitors in 2020, 26% higher than last year’s levels. The UAE is building theme parks, museums, hotels and infrastructure to attract more tourists. The UAE economy is set to improve marginally this year. Fourth, the UAE’s banking sector will enjoy rising credit growth, robust profitability and improved asset quality this year. The banking system has been in consolidation mode since January 2016, with a 15% reduction in branches and a 14% drop in the number of employees. This has improved the banking sector’s profitability by cutting operating costs and increasing efficiency. The improving growth outlook will lift credit growth. The central bank’s most recent Credit Sentiment Survey suggests banks’ lending standards for both business and personal loans are loosening (Chart III-3). In addition, UAE banks enjoy large capital buffers. Despite rising non-performing loans (Chart III-4), UAE banks still reported a Tier-1 capital adequacy ratio of 17% as of December 2018. Chart III-3Credit Growth Is Likely To Increase
Credit Growth Is Likely To Increase
Credit Growth Is Likely To Increase
Chart III-4Rising NPLs, But Still Large Capital Buffers
Rising NPLs, But Still Large Capital Buffers
Rising NPLs, But Still Large Capital Buffers
Lastly, the real estate markets in both Dubai and Abu Dhabi have suffered from oversupply (from both mushrooming supply and weaker demand) over the past several years. Property prices have already fallen over 20% in both Dubai and Abu Dhabi from their 2014 peaks (Chart III-5). Odds are high that the most dangerous phase of the property market downturn is behind us. Chart III-5Real Estate Adjustment Is Advanced
Real Estate Adjustment Is Advanced
Real Estate Adjustment Is Advanced
In addition, the government’s efforts to attract people to stay in the country longer will somewhat offset the ongoing exodus of expatriates. Last May, the UAE introduced a new visa system that will allow investors, innovators and talented specialists in the medical, scientific, research and technical fields to stay in the country for up to 10 years. Overall, a potential bottom in property demand and restrained supply will likely make the real estate sector less of a drag on this bourse this year. Finally, the authorities are also more open to increasing the foreign ownership cap in the banking sector, albeit not up to 100%. For example, in early April, the largest UAE lender – First Abu Dhabi Bank – obtained regulatory approval to increase its foreign ownership limit to 40% from 25%. This has boosted foreign equity purchases and has supported the equity index. Bottom Line: We recommend an overweight position in UAE equities within an EM portfolio this year (Chart III-6). For fixed income investors, we recommend overweighting UAE corporate credit in an EM corporate credit portfolio. UAE corporate credit is a lower beta market and will outperform as EM corporate spreads widen (Chart III-7). Most UAE-dollar corporate bonds have been issued by banks. Banks in the UAE do not suffer from structural overhangs, and the cyclical downturn in the property market is well advanced. This is why they have been, and will remain, a lower beta sector within an EM corporate credit portfolio. Chart III-6Overweight UAE Equities Within An EM Portfolio
Overweight UAE Equities Within An EM Portfolio
Overweight UAE Equities Within An EM Portfolio
Chart III-7UAE Corporate Credit Will Likely Outperform EM Benchmark
UAE Corporate Credit Will Likely Outperform EM Benchmark
UAE Corporate Credit Will Likely Outperform EM Benchmark
Ellen JingYuan He, Associate Vice President ellenj@bcaresearch.com Footnotes Equity Recommendations Fixed-Income, Credit And Currency Recommendations