Sectors

Optimism Is Rising For Home Builders
Optimism Is Rising For Home Builders
Overweight The S&P homebuilders index has been outperforming nicely so far this year on the back of renewed optimism in the domestic housing market. This is reflected in the V-shaped recovery from the end-of-year homebuilder blues in 2018 (second panel). Further, Lennar, the largest constituent firm of the S&P homebuilders index reported Q1 results this week that noted record orders through the first two months of the year. In their earnings release, Lennar highlighted a pullback in mortgage rates as the largest rationale behind resurgent demand; as the principal driver of house affordability (mortgage rates shown inverted, third panel), this is unsurprising. Still, housing starts data, also released this week, was tepid in the context of generationally low unemployment and firm household formation (bottom panel). We believe it is only a matter of time before housing starts catch up with increasing affordability-fueled demand and reiterate our overweight recommendation. We further express this view through a long S&P homebuilding/short S&P home improvement retail pair trade that we also reiterate.1 The ticker symbols for the stocks in this index are: BLBG: S5HOME - DHI, LEN, PHM. 1 Please see BCA U.S. Equity Strategy Report, “ Dissecting 2019 Earnings”, dated January 22, 2019, available at uses.bcaresearch.com
Highlights For the Eurostoxx50 to outperform the S&P500, the big euro area banks have to outperform the big U.S. tech stocks. Tactically overweight Eurostoxx50 versus S&P500 as well as other pro-cyclical positions such as overweight EM versus DM… …but prepare to take profits in the summer months. In the medium term, the euro area versus U.S. long-bond yield spread has plenty of scope to compress from its current -180 bps… …and EUR/USD has the scope to head higher. Feature Without a shadow of a doubt, the chart that causes the greatest stir among our clients is the Chart of the Week. It shows that one of the biggest investment decisions, the choice between the euro area and U.S. equity markets, reduces to the choice between the three large euro area banks – Santander, BNP Paribas, and ING – and the three U.S. tech behemoths – Apple, Microsoft, and Google. Chart of the WeekEurostoxx50 Vs. S&P500 Is Just 3 Banks Vs. 3 Tech Stocks!
Eurostoxx50 Vs. S&P500 Is Just 3 Banks Vs. 3 Tech Stocks!
Eurostoxx50 Vs. S&P500 Is Just 3 Banks Vs. 3 Tech Stocks!
Clients are simultaneously amazed and unsettled by this manifestation of the Pareto Principle, which states that the vast majority of an effect is explained by a tiny minority of causes. Financials feature large in the Eurostoxx50 while tech giants dominate the S&P500. But the amazing thing is that almost all of the relative performance can be explained by just three stocks in each market. The vast majority of an effect is explained by a tiny minority of causes. The chart creates a cognitive dissonance. What about the things that are supposed to matter for stock market selection: relative economic growth, profits growth, margins, valuations and geopolitics? The answer is that all of these are interesting areas of study, but they are mere details in the big picture. For the Eurostoxx50 to outperform the S&P500, the big euro area banks have to outperform the big U.S. tech stocks (Chart I-2). Period. Chart 2For The Eurostoxx50 To Outperform The S&P500, Euro Area Banks Have To Outperform U.S. Tech
For The Eurostoxx50 To Outperform The S&P500, Euro Area Banks Have To Outperform U.S. Tech
For The Eurostoxx50 To Outperform The S&P500, Euro Area Banks Have To Outperform U.S. Tech
Our view is that in the immediate future this is certainly possible, but that over the long haul it will prove to be a very tall order. When The Mean Is Meaningless The structural performances of vastly different equity sectors can diverge for a very long time. How long? Japanese banks have underperformed U.S. tech for thirty years and counting! In this situation, mean-reversion and ‘standard deviations’ from the mean become meaningless concepts (Chart I-3). Chart I-3Japanese Banks Have Underperformed U.S. Tech For Thirty Years And Counting!
Japanese Banks Have Underperformed U.S. Tech For Thirty Years And Counting!
Japanese Banks Have Underperformed U.S. Tech For Thirty Years And Counting!
The statistical concept of a standard deviation is only meaningful if the underlying data is stationary, which is to say mean-reverting. If it isn’t, then it is impossible to say that a sector price or valuation is stretched either versus another sector, or versus its own history. One problem is that sector performances and valuations undergo phase-shifts when they enter a different economic climate. The structural outlook for bank profits experiences a phase-shift when a debt super-cycle ends. Therefore, comparing a bank valuation after a debt super-cycle with the valuation during a debt super-cycle is as meaningless as comparing your height as an adult to your height when you were a child! Sector performances and valuations undergo phase-shifts when they enter a different economic climate. To which, a frequent riposte is: within the same sector, euro area companies appear cheaper than their counterparts elsewhere in the world. But again, this apparent value is deceptive because it is simply an adjustment for the so-called ‘currency translation effect’ and the anticipated long-term moves in exchange rates. If investors anticipate the euro ultimately to strengthen – because they see that it is trading well below purchasing power parity – then a multinational company listed on a euro area bourse will suffer a future headwind to its mixed-currency denominated profits when they are translated back to a stronger euro. To discount this anticipated headwind, the euro area multinational must trade cheaper compared with a peer in, say, the U.S. But the cheapness is a false impression. Pulling together these complexities of sector effects, phase-shifts in sector valuations and currency effects, making the big call between Europe and America on the basis of performance or valuation mean-reversion is dangerous. Instead, we come back to the basic question: should you tilt towards euro area financials or towards U.S. tech? Own Banks For The Short Term Only Japanese financial sector profits peaked in 1990 and stand at less than half that level today. Euro area financial sector profits peaked in 2007, and are tracking the Japanese experience with a 17-year lag. If euro area financial profits continue to follow in Japan’s footsteps, expect no sustained growth through the next 17 years (Chart I-4). Chart I-4Euro Area Financial Profits Are Following Japanese Footsteps
Euro Area Financial Profits Are Following Japanese Footsteps
Euro Area Financial Profits Are Following Japanese Footsteps
In a post credit boom era, banks lose the lifeblood of their business: credit creation. This loss becomes a multi-decade headwind to financial sector profit growth and share price performance. Bank profits are dependent on two other drivers. One is operational leverage – the amount of equity held against the balance sheet. More stringent European regulation is making this a headwind too. Banks have to hold more equity capital against assets, diluting their profitability. The other driver is the net interest margin – the difference between rates received on loans and rates paid on deposits. In this regard, both fintech and the blockchain are likely to create a further headwind to bank profitability. Japan’s experience suggests that euro area financials will struggle to outperform structurally. Admittedly, U.S. tech may also face its own headwinds or phase-shift, most obviously antitrust lawsuits to counter its near-monopoly status. But even allowing for this, Japan’s experience suggests that euro area financials will struggle to outperform structurally. Rather, financials is a sector to play for outperformance phases lasting no more than a few quarters. Last autumn, we noted that short-term credit impulses in the major economies were flipping from a sharp down-oscillation into an up-oscillation phase (Chart I-5). On that basis, we recommended a tactical overweight to Eurostoxx50 versus S&P500 as well as other pro-cyclical positions such as overweight EM versus DM. Those pro-cyclical sector positions have broadly succeeded, but they are still appropriate given that up-oscillation phases very reliably last around nine months. Chart I-5Short-Term Credit Impulses Have Flipped To Up-Oscillations
Short-Term Credit Impulses Have Flipped To Up-Oscillations
Short-Term Credit Impulses Have Flipped To Up-Oscillations
The caveat is: prepare to take profits in the summer months. The Fed Is Now At ‘Neutral’, But Where Is The ECB? Last week, the Federal Reserve confirmed that “the Federal funds rate (at 2.5 percent) is now in the broad range of estimates of neutral – the rate that tends neither to stimulate nor to restrain the economy.” This begs the question: where is the ECB policy rate (now at 0 percent) relative to its neutral? Our very high conviction view is that the ECB policy rate is well below neutral. Financials is a sector to play for outperformance phases lasting no more than a few quarters. The twenty year life of the euro captures multiple manias and crises, some centred in Europe, some in the U.S. Through these twenty years, the euro area versus U.S. long bond yield spread has averaged -50 bps1 (Chart I-6). Over this same period, the euro area versus U.S. annual inflation differential has also averaged -50 bps (Chart I-7). Ergo, the real interest rate differential has averaged zero. Meaning, the ex-post neutral real interest rates in the euro area and the U.S. have been exactly the same. Chart I-6The Euro Area Vs. U.S. Yield Spread Has Averaged -50 Bps...
The Euro Area Vs. U.S. Yield Spread Has Averaged -50 Bps...
The Euro Area Vs. U.S. Yield Spread Has Averaged -50 Bps...
Chart I-7...The Euro Area Vs. U.S. Inflation Spread Has Also Averaged -50 Bps
...The Euro Area Vs. U.S. Inflation Spread Has Also Averaged -50 Bps
...The Euro Area Vs. U.S. Inflation Spread Has Also Averaged -50 Bps
With little difference in the neutral real rates over the past two decades, is there a valid reason to expect a difference in the future? An obvious response is the fragility of the euro area’s banking system will require the ECB to persist with its zero interest rate policy for years. In Germany and France, bank lending is healthy, and could easily weather modestly tighter monetary policy. In fact, the evidence suggests that this fear is exaggerated. In Germany and France, bank lending is healthy, and could easily weather modestly tighter monetary policy (Chart I-8). The problem has been localised in Italy, where bank lending relapsed once again in 2018. Chart I-8Bank Lending Is Healthy In Germany And France
Bank Lending Is Healthy In Germany And France
Bank Lending Is Healthy In Germany And France
However, on closer examination this was a direct result of political tensions. Recently, Italian bank lending has been a very tight (inverse) function of the Italian bond yield. The BTP yield spiked last year when Rome escalated its budget spat with Brussels, and bank lending took a hard hit. But now that the Italian bond yield has retraced, lending should recover (Chart I-9). Chart I-9Italian Bank Lending Should Recover Now That The Bond Yield Has Come Down
Italian Bank Lending Should Recover Now That The Bond Yield Has Come Down
Italian Bank Lending Should Recover Now That The Bond Yield Has Come Down
The central issue is can the U.S. policy rate – which is at neutral – and the ECB policy – which is below neutral – diverge much from here? Our high conviction answer is no. Therefore, in the medium term, the euro area versus U.S. long-bond yield spread has plenty of scope to compress from its current -180 bps, one way or the other (Chart I-10). Chart I-10Can Interest Rate Expectations Diverge Much From Here?
Can Interest Rate Expectations Diverge Much From Here?
Can Interest Rate Expectations Diverge Much From Here?
It also implies that after remaining range-bound in the immediate future, EUR/USD has the scope to head higher. Dhaval Joshi, Chief European Investment Strategist dhaval@bcaresearch.com Fractal Trading System This week’s recommended trade is to go long SEK/NOK, as it is close to the limit of tight liquidity that has signaled many previous technical reversals in this currency cross. Set a profit target of 1.5 percent with a symmetrical stop-loss. In other trades, the on-going rally in government bonds caused the short position in 30-year T-bonds to hit its stop-loss. This leaves us with five open positions. Long SEK/NOK. For any investment, excessive trend following and groupthink can reach a natural point of instability, at which point the established trend is highly likely to break down with or without an external catalyst. An early warning sign is the investment’s fractal dimension approaching its natural lower bound. Encouragingly, this trigger has consistently identified countertrend moves of various magnitudes across all asset classes. Chart I-11
Long SEK/NOK
Long SEK/NOK
The post-June 9, 2016 fractal trading model rules are: When the fractal dimension approaches the lower limit after an investment has been in an established trend it is a potential trigger for a liquidity-triggered trend reversal. Therefore, open a countertrend position. The profit target is a one-third reversal of the preceding 13-week move. Apply a symmetrical stop-loss. Close the position at the profit target or stop-loss. Otherwise close the position after 13 weeks. Use the position size multiple to control risk. The position size will be smaller for more risky positions. * For more details please see the European Investment Strategy Special Report “Fractals, Liquidity & A Trading Model,” dated December 11, 2014, available at eis.bcaresearch.com Footnotes 1 Calculated from the over 10-year government bond yield: euro area average, weighted by sovereign issue size, less U.S. Fractal Trading System Recommendations Asset Allocation Equity Regional and Country Allocation Equity Sector Allocation Bond and Interest Rate Allocation Currency and Other Allocation Closed Fractal Trades Trades Closed Trades Asset Performance Currency & Bond Equity Sector Country Equity Indicators Bond Yields Chart II-1Indicators To Watch - Bond Yields
Indicators To Watch - Bond Yields
Indicators To Watch - Bond Yields
Chart II-2Indicators To Watch - Bond Yields
Indicators To Watch - Bond Yields
Indicators To Watch - Bond Yields
Chart II-3Indicators To Watch - Bond Yields
Indicators To Watch - Bond Yields
Indicators To Watch - Bond Yields
Chart II-4Indicators To Watch - Bond Yields
Indicators To Watch - Bond Yields
Indicators To Watch - Bond Yields
Interest Rate Chart II-5Indicators To Watch - Interest Rate Expectations
Indicators To Watch - Interest Rate Expectations
Indicators To Watch - Interest Rate Expectations
Chart II-6Indicators To Watch - Interest Rate Expectations
Indicators To Watch - Interest Rate Expectations
Indicators To Watch - Interest Rate Expectations
Chart II-7Indicators To Watch - Interest Rate Expectations
Indicators To Watch - Interest Rate Expectations
Indicators To Watch - Interest Rate Expectations
Chart II-8Indicators To Watch - Interest Rate Expectations
Indicators To Watch - Interest Rate Expectations
Indicators To Watch - Interest Rate Expectations
Highlights Taiwan’s semiconductor sector is facing both cyclical and structural headwinds. Semiconductor exports will continue to contract over the next six months or so, on retrenching global demand. In the long run, Taiwan is facing increasing competition from Korea in the high-end supply, and from mainland China in the medium- to low-end supply of the semiconductor market. The latest rebound in Taiwanese share prices is unsustainable, and they are about to relapse anew. Within an EM equity portfolio, we recommend staying neutral on Taiwanese stocks for now. Feature Taiwan’s exports and manufacturing are in full-blown recession. The equity market has rebounded after a major selloff last year. However, the overall manufacturing PMI and its export sub-component are extremely weak, and do not justify the latest share-price rebound (Chart I-1). Chart I-1Taiwanese Equities: Unsustainable Rally
Taiwanese Equities: Unsustainable Rally
Taiwanese Equities: Unsustainable Rally
Are manufacturing activity and exports about to recover? Or will the stock market rally fade? Our answer is the latter. There are currently no signs suggesting a recovery in exports is imminent. Moreover, the engine of the economy – the semiconductor sector – is facing both cyclical and structural headwinds. We remain negative on Taiwanese stocks in absolute terms. Within an EM equity portfolio, we recommend a market-weight allocation to Taiwanese stocks for now. Importance Of Semiconductors Over the past 15 years, the semiconductor sector has become the cornerstone of the Taiwanese economy. The Taiwanese economy is highly dependent on its external sector, as exports contribute to nearly 70% of GDP. As such, Taiwan’s business cycle has often been closely associated with its export sector. This means the region’s growth outlook relies on both external demand (a cyclical factor) and the competitiveness of its export sector (more of a structural factor). Over the past 15 years, the semiconductor sector has become the cornerstone of the Taiwanese economy. It contributes to over one-third of the region’s total exports, up from 22% in 2009 (Chart I-2). Chart I-2Semiconductor: Cornerstone Of Taiwanese Economy
Semiconductor: Cornerstone of Taiwanese Economy
Semiconductor: Cornerstone of Taiwanese Economy
Consistently, tech stocks also account for the lion’s share of the Taiwanese stock market, representing nearly 60% of the MSCI Taiwan Index and 47% of the Taiwanese Stock Exchange (TSE) index in market-value terms. There have been two key forces behind the significant growth of Taiwan’s semiconductor sector: booming global demand for smartphones/tablets and increasing competitiveness among domestic semiconductor companies. However, looking forward, the Taiwanese manufacturing sector and its semiconductor exports are facing a double-whammy: cyclical weakness in global demand and a relative decline in Taiwan’s export ability. In the context of a negative structural outlook, a cyclical downtrend engenders substantial deterioration in manufacturing, and by extension corporate profitability. Cyclical Downturn In Global Semiconductor Demand The outlook for the Taiwanese semiconductor industry remains poor. The global semiconductor industry has already been in a cyclical downtrend since early 2018. Global smartphone sales are shrinking. Both DRAM and NAND prices have been falling (Chart I-3). Chart I-3Falling Memory Chips Prices
Falling Memory Chips Prices
Falling Memory Chips Prices
The freefall in Taiwan's new export orders seems to entail a further contraction in exports (Chart I-4). Chart I-4A Further Contraction In Exports Is Likely
A Further Contraction In Exports Is Likely
A Further Contraction In Exports Is Likely
Importantly, exports of electronics parts lead Taiwanese tech EPS growth, and currently point to an impending contraction in corporate earnings (Chart I-5). Chart I-5An Impending Contraction In Corporate Earnings
An Impending Contraction In Corporate Earnings
An Impending Contraction In Corporate Earnings
The outlook for the Taiwanese semiconductor industry remains poor. First, Taiwanese semiconductor producers are highly vulnerable to any further downside in global smartphone demand. There are two major pure-play wafer manufacturers in Taiwan: Taiwan Semiconductor Manufacturing Company (TSMC) and United Microelectronics (UMC). TSMC and UMC are the world’s largest and fourth-largest dedicated integrated circuit (IC) foundries, respectively. The smartphone sector has been the main revenue source for both companies, accounting for a 45% share for TSMC and 40% for UMC. Global smartphone demand is likely to decline further in 2019, as major markets such as mainland China and advanced economies have entered the saturation phase of mobile-phone demand. DRAMeXchange expects global smartphone production volume for 2019 to fall by 3.3% from last year following a 4% drop in 2018 (Chart I-6). Chart I-6Global Smartphone Demand Started A Downtrend
Global Smartphone Demand Started A Downtrend
Global Smartphone Demand Started A Downtrend
Smartphone sales in mainland China remain in deep contraction after two consecutive years of declines (Chart I-7). Odds are that smartphone shipments will remain sluggish amid the ongoing economic slump in the mainland’s economy. Chart I-7Smartphone Sales In Mainland China Are In A Deep Contraction
Smartphone Sales In Mainland China Are In A Deep Contraction
Smartphone Sales In Mainland China Are In A Deep Contraction
In addition, Taiwan’s TSMC is the sole chip supplier for Apple iPhones. A further decline in Apple smartphone shipments will reduce the company’s revenue and profits, damaging the region’s growth outlook. Mainland China now can produce top-notch quality smartphones at relatively cheaper selling prices. This will further crowd out higher-priced products from Apple, Samsung and others (Chart I-8). Chart I-8Apple Has Been Losing Market Share In Global Smartphone Market
Apple Has Been Losing Market Share In Global Smartphone Market
Apple Has Been Losing Market Share In Global Smartphone Market
Second, the significant surge in bitcoin prices greatly boosted cryptocurrency mining activity in 2016-‘17 as miners quickly expanded their computing power. This boosted demand for graphic process unit (GPU) chips and in turn brought higher revenue for Taiwan chipmakers between June 2016 and early 2018. However, with the bust in bitcoin prices (Chart I-3 on page 3), demand from cryptocurrency mining has vanished and is unlikely to revive soon. Indeed, Taiwan chipmakers have suffered from last year’s plunge in cryptocurrency mining activity. According to TSMC, revenue from the cryptocurrency mining-related high-performance computing (HPC) sector contracted by double digits in 2018. Given that HPC demand is the second-biggest source of revenue for TSMC, with 32% share, TSMC revenue will be curtailed as HPC chip demand will continue to decline on weak bitcoin prices. Last, developments in new technologies, such as foldable smartphones, artificial intelligence, fifth-generation (5G) mobile networks and the so-called Internet of Things (IoTs) could only produce a modest pick-up in semiconductor demand. Most of these developments are still in their infancy and early stages. Hence, their growth will not be large enough to make a cyclical difference in global semiconductor demand. For example, the foldable smartphone that Huawei recently announced is indeed appealing. However, a lack of stability in panel supply and quite-high selling prices will limit sales. WitsView, a division of TrendForce, predicts that the market penetration rate of the foldable phone will be only 0.1% in 2019, and could rise to 1% in 2020 if more panel providers join the game, enabling a significant reduction in panel costs. Moreover, these categories together account for only ~23% of TSMC’s revenue; their modest growth will not be able to make up for the losses from the smartphone and HPC sectors within Taiwan’s economy. Besides, there has been a slowdown in demand from high-growth areas such as data center servers, as well as the automotive and industrial sectors. Putting it all together, odds are that global semiconductor demand will only materially recover in 2020. By that time, more-mature 5G technology and the increasing adoption of the 5G network and 5G-related products may be able to shift global semiconductor demand from the current downturn to a cyclical uptrend. Hence, the cyclical weakness in global semiconductor demand is likely to persist over the next six months. Consequently, Taiwan’s major types of semiconductor production will likely remain in contraction, and inventory levels will stay elevated (Chart I-9 and Chart I-10). Chart I-9Taiwan: Semiconductor Output Contraction Will Likely Continue
Taiwan: Semiconductor Output Contraction Will Likely Continue
Taiwan: Semiconductor Output Contraction Will Likely Continue
Chart I-10Taiwan: Semiconductor Inventory Are Elevated
Taiwan: Semiconductor Inventory Are Elevated
Taiwan: Semiconductor Inventory Are Elevated
Bottom Line: There are no signs of an imminent recovery in exports. A Potential Decline In Taiwan’s Semiconductor Competitiveness Taiwan wafer manufacturers are facing an increasing threat from their Korean and mainland China competitors. Leadership in advanced process technologies has been a key factor in Taiwan’s strong market position in the global semiconductor industry. With cutting-edge technologies, Taiwan has been the global wafer capacity leader since 2015. As of last year, it held about 22% of global installed wafer capacity (Chart I-11).
Chart I-11
However, Taiwan wafer manufacturers are facing an increasing threat from their Korean and mainland China competitors. Korean Chipmakers While Taiwan will remain highly competitive in 7 nanometer (nm) and 10 nm wafer production, it is facing fierce competition from Korea. Manufacturing technologies designated by smaller nanometer numbers tend to have faster speeds and be more power-efficient than technologies designated by larger numbers. TSMC was the first company in the world to mass-produce 7 nm node wafers. Its 7 nm deep ultraviolet lithography (DUV) node has been in mass production since April 2018, producing chips for AMD, Apple, HiSilicon, and Xilinx. Beginning at the end of this month, TSMC will be ready to begin mass production of 7nm wafers using extreme ultraviolet lithography (EUV). The switch from 7nm DUV to 7nm EUV allows for fewer defects and fewer steps required during the production process. The company also aims to boost volume production of its 5 nm nodes in early 2020 and has a target of 3 nm wafers for 2022. Last year, wafer revenue from 7nm and 10nm chips accounted for 9% and 11% of TSMC’s total revenue, respectively (Chart I-12).
Chart I-12
Samsung has been closely following TSMC in terms of technological innovation. It started mass production of EUV-based 7nm chips last October, with a plan of risk production1 of 5nm wafers in 2019 and a target of 4nm wafers in 2022. Meanwhile, IBM announced last December that it signed an agreement with Samsung to produce its next-generation processors with Samsung’s 7nm technology. As Samsung seeks to diversify its revenue source away from memory chips, which last year contributed to about 80% of its operating profit, the company has been determined to ramp up the development of its foundry business. It aims to replace TSMC as the world’s largest foundry producer by 2030. In the near term, Samsung aims to secure a 25% market share in the global pure-play foundry market by 2023, a rise from 19% currently. Last year, Samsung surpassed Taiwan’s UMC to become the world’s second-largest dedicated chipmaker. Moreover, Samsung’s capital spending has been and will continue to be much higher than TSMC. Over the course of 2017 and 2018, Samsung spent about $46.9 billion on semiconductor capital expenditures, more than double TSMC’s $21 billion. Hence, the competition between TSMC and Samsung in the high-end chip market will intensify in the coming years. Chipmakers In Mainland China The competition between TSMC and chipmakers from mainland China is also escalating. Chart I-12 shows that 80% of TSMC’s wafer revenue comes from bigger node wafers (bigger than 10 nm). Taiwan’s second-biggest chipmaker, UMC, only produces wafers equal to or bigger than 28 nm. Therefore, the chip market using less-advanced technology than 10 nm will be the main battlefield between Taiwanese and mainland China’s chipmakers. Before 2014, there were few wafer manufacturers in mainland China, and those that did exist were too weak to compete with giant market players like TSMC. In 2014, the Chinese central government made a move to foster development within the local IC industry. Since then, the authorities have poured significant amounts of capital into semiconductor foundries, as well as companies focused on memory production, chip design and related equipment and materials. Semiconductor Manufacturing International Corporation (SMIC) is the world’s fourth-largest dedicated wafer manufacturer, and is the largest in mainland China. While 28nm will likely remain a large part of its business, SMIC plans to go into production on its 14 nm technology in the first half of 2019. The company is also working on 10nm and 7nm nodes with the use of EUV. SMIC currently counts HiSilicon and Qualcomm as customers, manufacturing smartphone chips with medium-to-low technology. As mainland China aims to increase its self-sufficiency rate for ICs significantly over the next five to 10 years, the nation’s producers will significantly expand their wafer capacity. Mainland China is likely to reduce its semiconductor imports from Taiwan considerably in the coming years, especially wafer imports. According to IC Insights, nine 300mm wafer fabs2 are scheduled to open worldwide in 2019, with five of them in mainland China. Based on another set of data from SEMI, the number of 200mm wafer fabs in the world will increase from 194 in 2017 to 203 by 2022, with an additional 56 established fabs planning to expand their manufacturing capacity. Mainland China is expected to account for 44% of the growth. In comparison, Taiwan only accounts for about 10% of the growth. Mainland China currently accounts for over 30% of Taiwanese electronic parts exports (wafers, PCBs, mainboards and others). As mainland China continues to build new wafer manufacturing capacity and gradually improve its existing technology, it will switch its consumption from imports to domestic production. Consequently, mainland China is likely to reduce its semiconductor imports from Taiwan considerably in the coming years, especially wafer imports (Chart I-13). This is structurally bearish for Taiwanese semiconductor companies. Chart I-13Mainland China’s Semiconductor Imports From Taiwan Will Drop
Mainland China’s Semiconductor Imports From Taiwan Will Drop
Mainland China’s Semiconductor Imports From Taiwan Will Drop
Bottom Line: Taiwan is facing increasing challenges from Korea in terms of defending its market share in the high-end wafer market. Meanwhile, Taiwan is also set to lose market share in the medium-to-low market to wafer producers from mainland China. What About The Rest Of The Economy? The rest of the economy is exhibiting mixed signals, with contracting major non-semiconductor export sectors but decent household consumption and property market. Table 1 shows Taiwan’s top 10 exported products, with the top three attributing to over half of total exports. Besides the semiconductor sector, exports of the other two major products – electrical machinery products and machinery – are beginning to contract (Chart I-14).
Chart I-
Chart I-14Taiwan: Contracting Non-Semiconductor Exports
Taiwan: Contracting Non-Semiconductor Exports
Taiwan: Contracting Non-Semiconductor Exports
However, the domestic economy seems to be running well at present. Production of construction materials in volume terms is growing rapidly, accompanied by a rebound in building permits granted (Chart I-15). While employment growth is decent, average wage growth has been quite strong (Chart I-16). With persistent contraction in exports and inflation very low, the central bank could cut rates in 2019. Chart I-15Decent Domestic Demand
Decent Domestic Demand
Decent Domestic Demand
Chart I-16Strong Wage Growth
Strong Wage Growth
Strong Wage Growth
Ongoing contraction in semiconductor exports will likely slow domestic demand with a time lag. In fact, the inverted 5-year/6-month yield curve is indeed signaling an economic slump in Taiwan (Chart I-17). Chart I-17Inverted Yield Curve Signals Continuing Economic Slump Ahead
Inverted Yield Curve Signals Continuing Economic Slump Ahead
Inverted Yield Curve Signals Continuing Economic Slump Ahead
Investment Recommendations The latest rebound in Taiwanese stocks is unsustainable and share prices will relapse again. Within an EM equity portfolio, we recommend maintaining a market-weight allocation to Taiwan for now. We are reluctant to downgrade Taiwan to underweight because some other emerging markets and sectors within the EM universe have a poorer outlook. In addition, Taiwanese shares have already underperformed the EM benchmark since last September (Chart I-18). Chart I-18Taiwanese Stocks: Staying Neutral Within EM
Taiwanese Stocks: Staying Neutral Within EM
Taiwanese Stocks: Staying Neutral Within EM
The Taiwanese currency is cheap (Chart I-19). The region has a massive current account surplus and foreigners do not hold any local bonds, which is very different from many other EM countries. Hence, Taiwan is less vulnerable to capital outflows than many current-account-deficit EM economies. The latter could be forced to raise rates, which will place pressure on their banks as well as on domestic demand. In contrast, Taiwan has the ability to cut rates. Chart I-19TWD Is Cheap
TWD Is Cheap
TWD Is Cheap
Ellen JingYuan He, Associate Vice President Emerging Markets Strategy ellenj@bcaresearch.com 1 "Risk Production" means that a particular silicon wafer fabrication process has established a baseline in terms of process recipes, device models, and design kits, and has passed standard wafer level reliability tests. 2 A fab, sometimes called foundry, is a semiconductor fabrication plant where devices such as integrated circuits are manufactured. Equity Recommendations Fixed-Income, Credit And Currency Recommendations
Buy The Software Breakout
Buy The Software Breakout
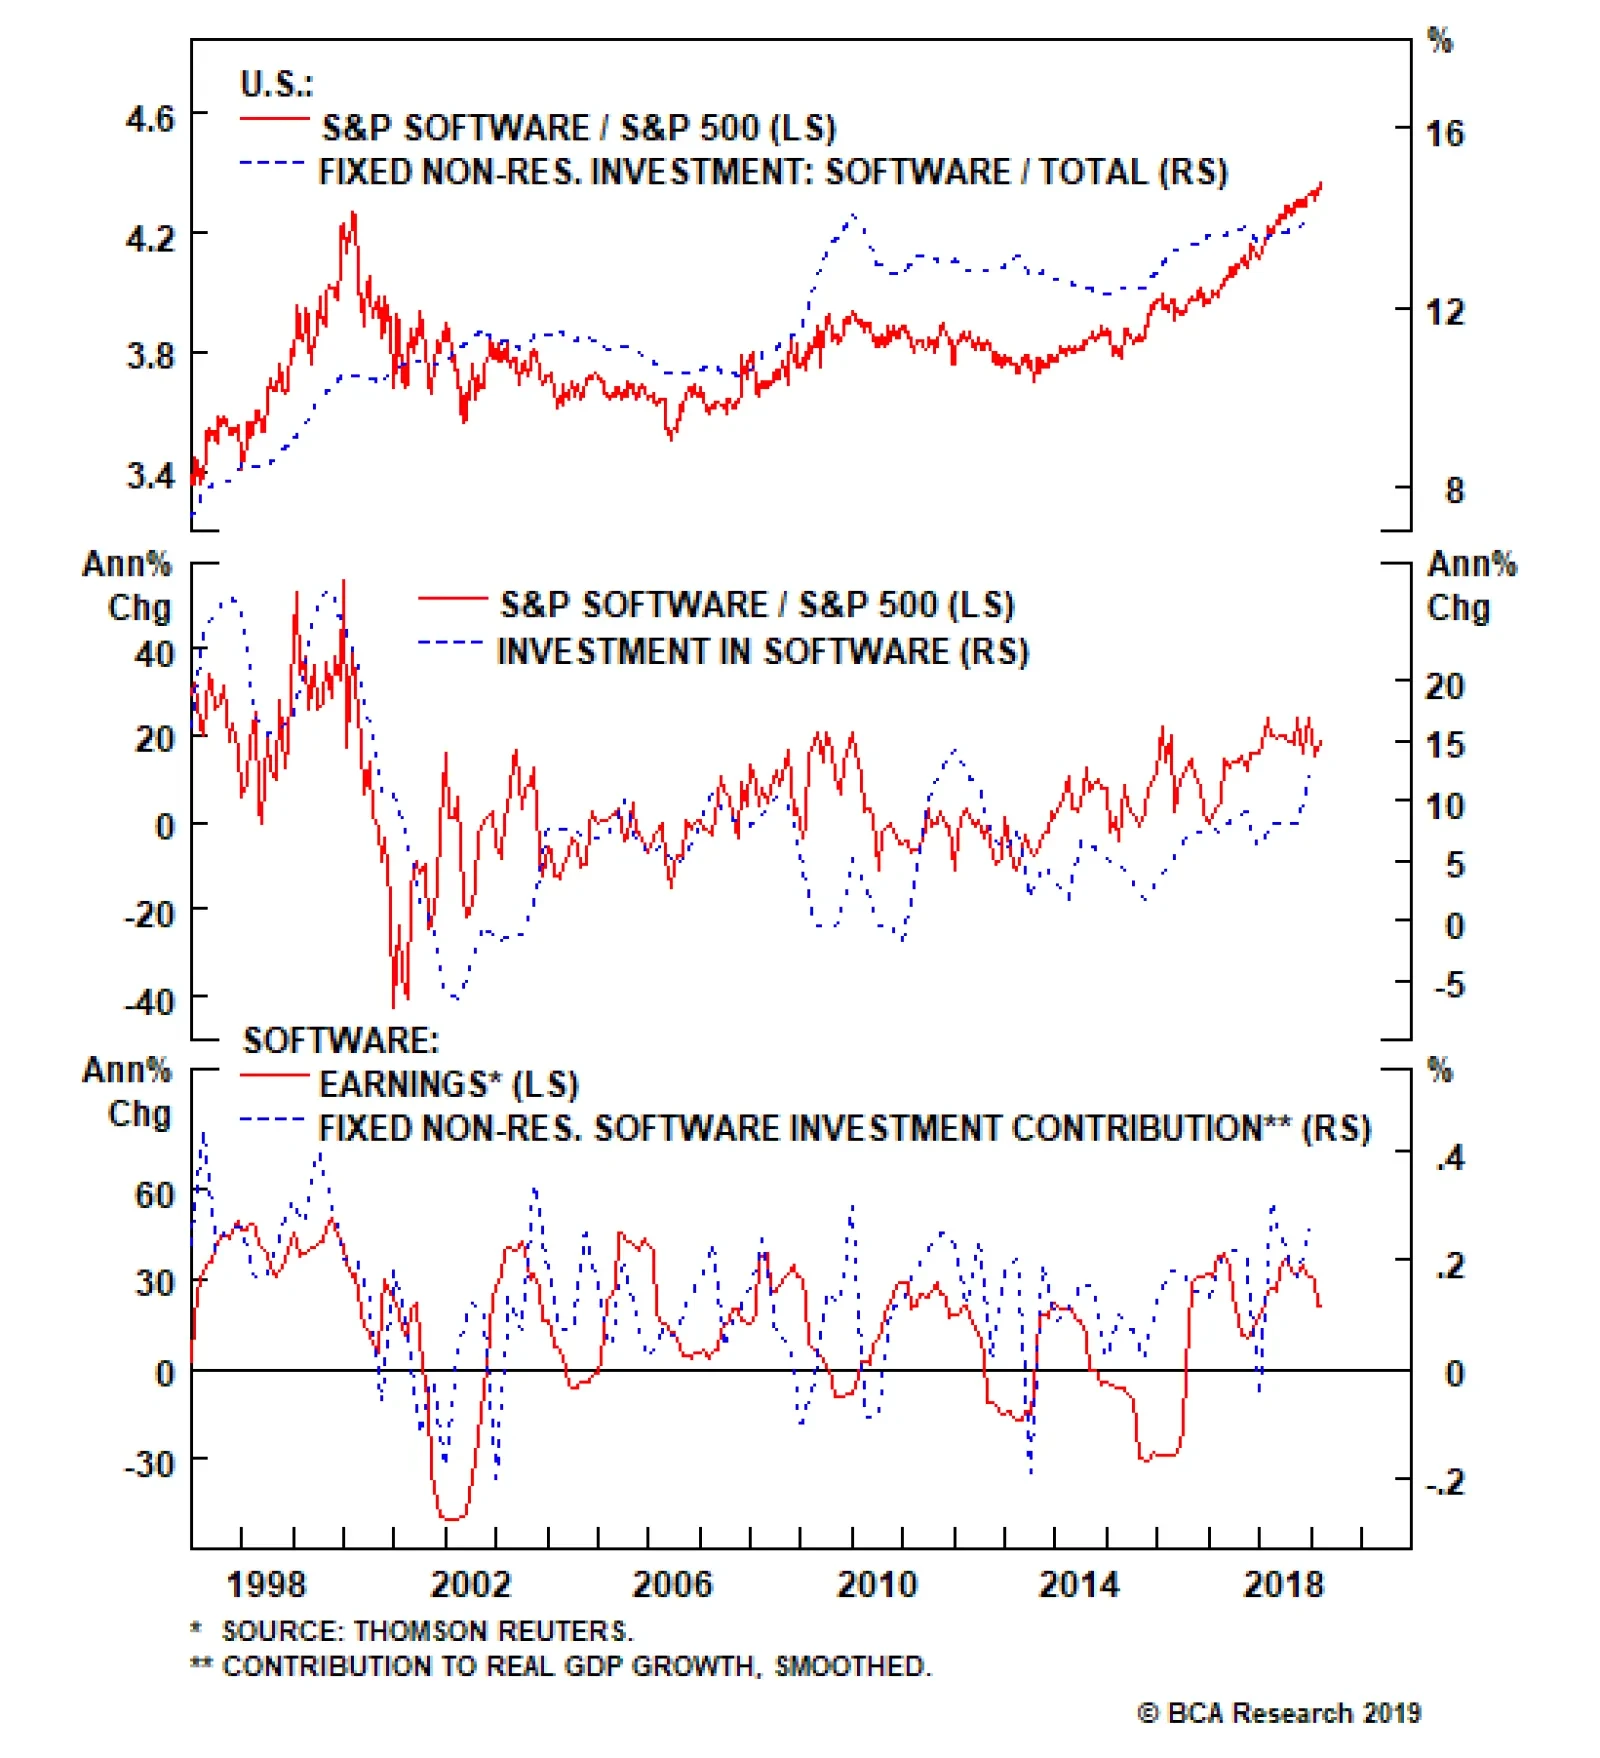
Overweight (High-Conviction) Software stocks are on fire and leading profit indicators suggest that more gains are in store in the coming months. Sustained capital outlays on software are a key driver of industry profits (bottom panel). In an otherwise muted Q4 GDP release, rising non-residential fixed investment in general and surging investment in software in particular suggest that our bullish software capex thesis is alive and kicking (middle panel). The move to cloud computing and SaaS, the proliferation of AI, machine learning and augmented reality are not fads but enjoy a secular growth profile, and signal that capital outlays on software are also in a structural uptrend. Not only private sector software capex is near all-time highs as a share of total outlays, but also government investment in software is reaccelerating at the fastest pace since the tech bubble. When productivity gains are anemic, both the business and government sectors resort to software upgrades in order to boost productivity. Bottom Line: We reiterated our high-conviction overweight recommendation on the S&P software index on Monday. Please see our Weekly Report for more details. The ticker symbols for the stocks in this index are: BLBG: S5SOFT – MSFT, ORCL, ADBE, CRM, INTU, ADSK, RHT, CDNS, SNPS, ANSS, SYMC, CTXS, FTNT.
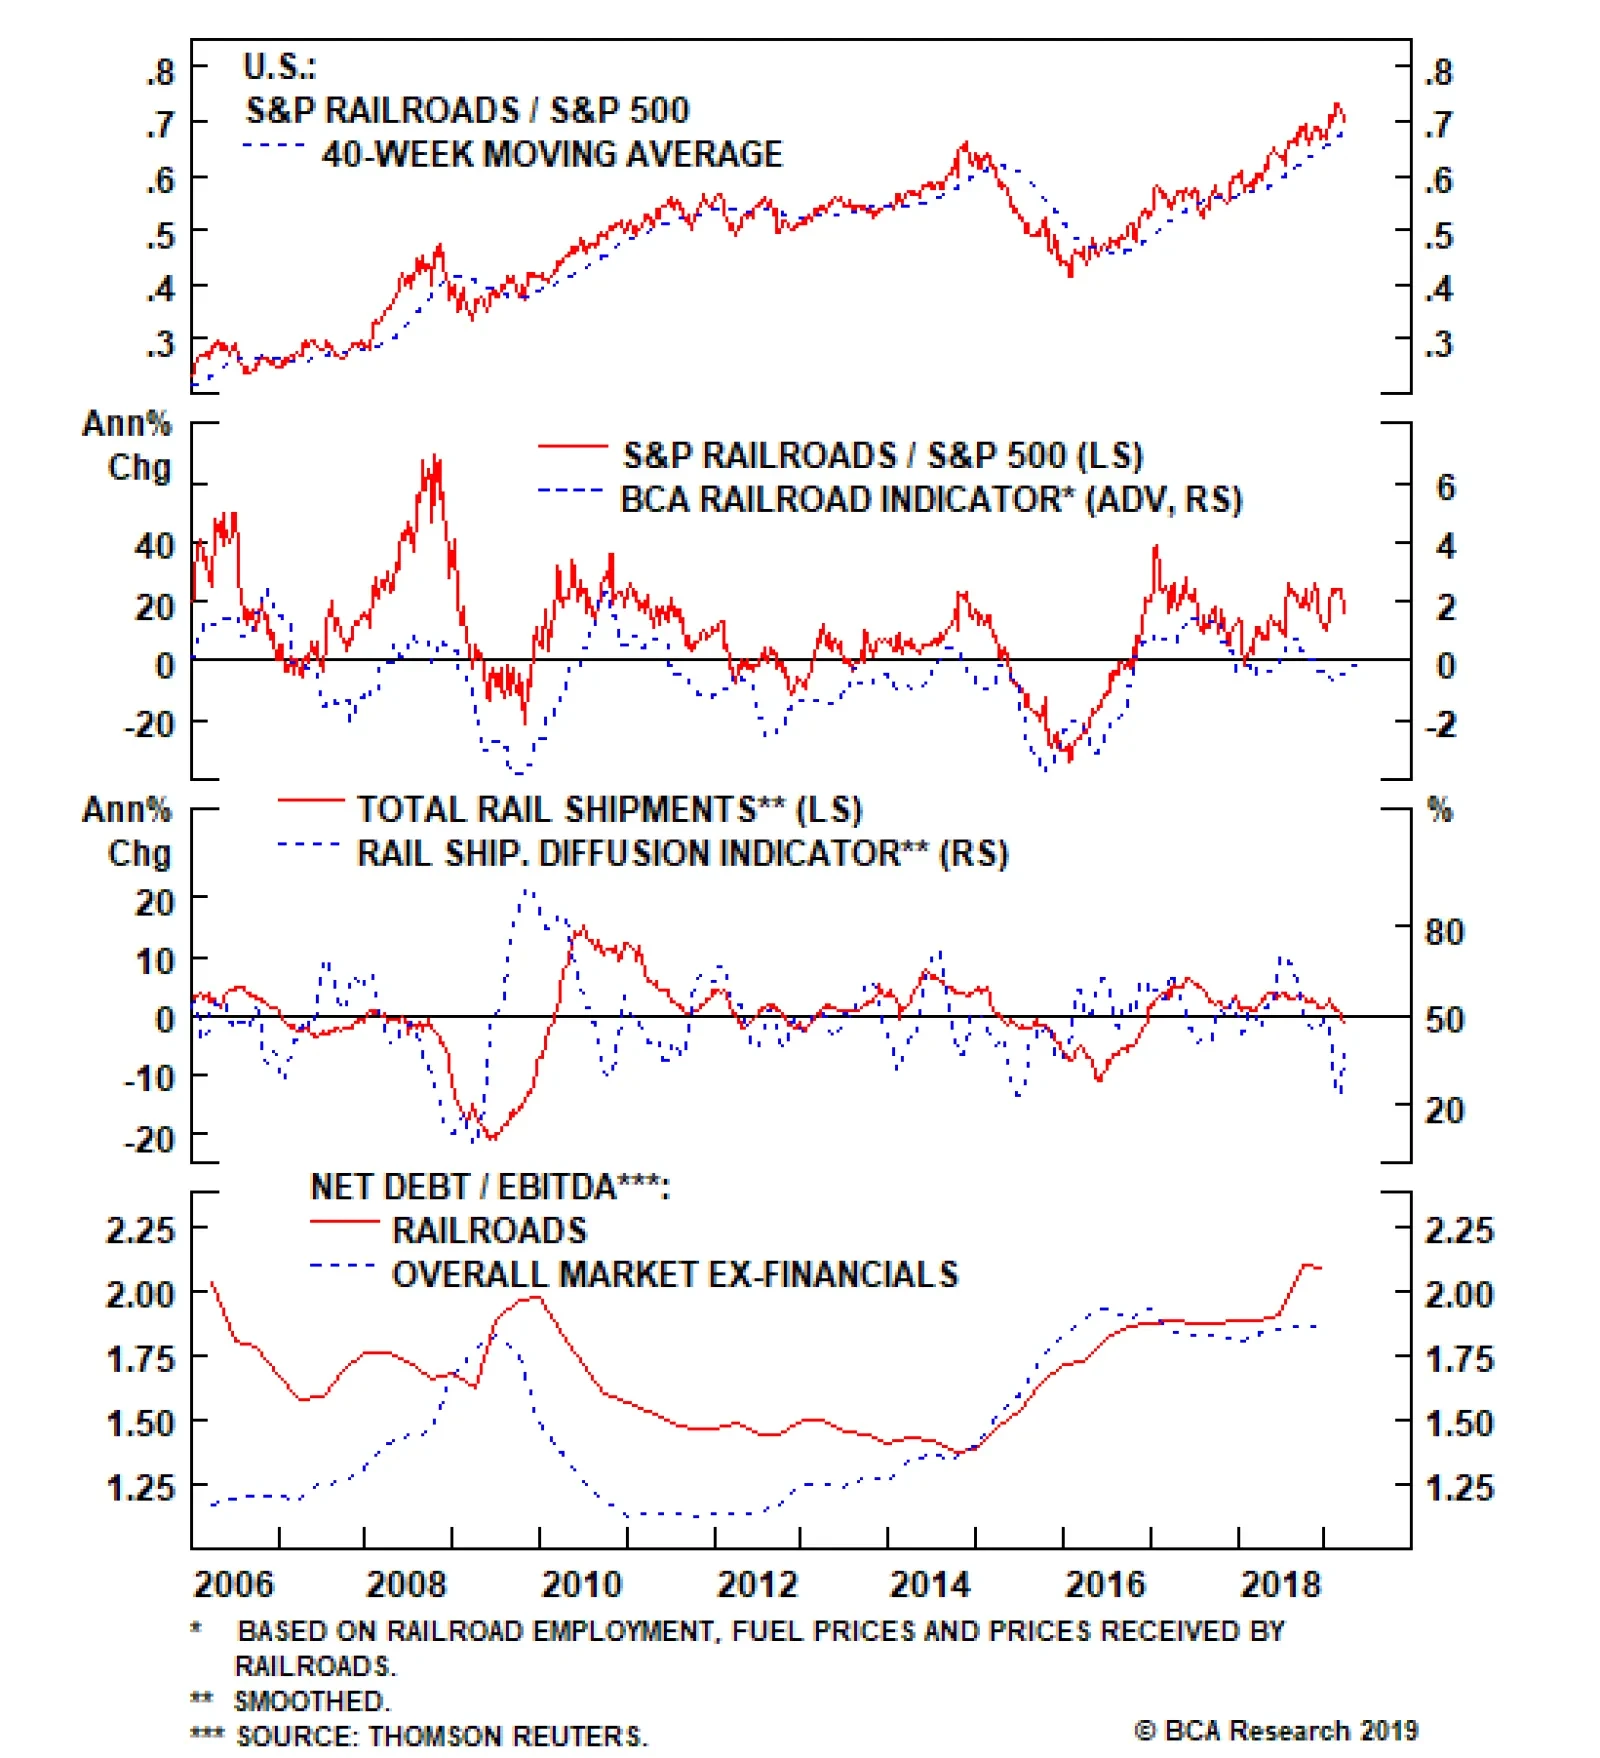
The Railroad Indicator and our Rail Shipment Diffusion Indicator, have continued to deteriorate, as well as total rail shipments which have now started to contract for the first time since the 2015-16 manufacturing recession. Intermodal shipments in…
While the broad tech sector is on an even keel with the SPX, software EPS are racing at twice the speed of the broad market, roughly 14%. The software profit juggernaut is intact and our U.S. Equity Strategy team reiterates its high-conviction overweight…
Highlights Portfolio Strategy Corporate sector selling price inflation is nil while leading wage inflation indicators signal additional labor cost increases in the coming months. The risk is that profit margins have already peaked for the cycle. We reiterate our tactically cautious overall equity market view. Galloping higher private and public sector software outlays, a structurally enticing software demand backdrop and ongoing industry M&A all signal that it still pays to be bullish software stocks Recent Changes Last Thursday we downgraded the S&P railroads index to underweight. Also last Thursday we trimmed the S&P air freight & logistics index to neutral. Table 1
Have SPX Margins Peaked?
Have SPX Margins Peaked?
Feature The SPX stalled last week, digesting the now-complete Fed pivot. Our sense is that the Fed’s dovish turn is now fully reflected in equities. Importantly, the longer and wider the dichotomy between stocks and bonds gets, the more painful the ramifications from the eventual snap will be, likely with equities yielding to the bond market (Chart 1). As we first posited on March 4, short-term equity market caution is still warranted.1 Chart 1Time To Get Back Together
Time To Get Back Together
Time To Get Back Together
While the Fed meeting and sharp decline in Treasury yields dominated headlines last week, it was the NFIB’s latest release that really caught our attention. Importantly, it revealed that taxes and big government are no longer the biggest problems facing small and medium business owners, but labor is: “Twenty-two percent of owners cited the difficulty of finding qualified workers as their Single Most Important Business Problem, only 3 points below the record high. Ten percent of owners find labor costs as their biggest problem, a record high for the 45-year survey.”2 Historically, such extreme tightness in the SME labor market is a precursor of a yield curve inversion (NFIB cost of labor shown inverted, Chart 2). The link is clearer if we show this same NFIB series with the Labor Department’s average hourly earnings monthly release that is currently running at a 3.4%/annum clip (Chart 3). In other words, a tight labor market is conducive to corporations bidding up the price of labor which in turn causes the Fed to raise interest rates, eventually inverting the yield curve. Chart 2Cycle Is Long In The Tooth
Cycle Is Long In The Tooth
Cycle Is Long In The Tooth
Chart 3Wage Growth...
Wage Growth...
Wage Growth...
This macro backdrop is slightly unnerving and our biggest concern is the S&P 500’s profit margins (Chart 4). Q3/2018 marked the all-time peak in SPX quarterly margins according to Standard & Poor’s,3 and in Q4/2018 margins have deflated from a high mark of 12.13% to 10.11%, or a 16.7% q/q drop. Chart 4...Denting Margins
...Denting Margins
...Denting Margins
Undoubtedly, last year’s fiscal easing-induced all-time highs in SPX margins is unsustainable, and a tight labor market is a warning shot. Using the same NFIB series on cost of labor being the most important problem SMEs face and subtracting it from our corporate pricing power proxy, we constructed an equity market margin proxy, shown as a Z-score in Chart 5. Historically, the y/y change in SPX profit margins move in lockstep with our margin proxy and the current message is grim (Chart 5). Chart 5Margin Trouble Ahead
Margin Trouble Ahead
Margin Trouble Ahead
Before getting too bearish though, we want to make three salient points: First, while the NFIB survey’s labor related indicators are disconcerting, unit labor costs – the best measure of wage growth – remain muted as productivity growth has ramped up recently. Second, using empirical evidence dating back to the 1960s, the ultimate SPX profit margin mean reversion occurs during recessions, when EPS suffer a major setback. The implication is that margins can move sideways or grind lower in the coming year. As a reminder, BCA’s review remains that the U.S. will avoid recession in the next 12 months. Third, the most important yield curve slope, the 10/2, has not yet inverted, and even when it does invert, investors will have time to start positioning defensively; we have shown in recent research that the S&P peaks after the yield curve inverts.4 On a related note, we use this opportunity to update our corporate pricing power proxy, and Table 2 summarizes the sectorial results. Table 2Industry Group Pricing Power
Have SPX Margins Peaked?
Have SPX Margins Peaked?
Corporate sector selling price inflation has ground to a halt at a time when wage inflation is rearing its ugly head. Worrisomely, our pricing power diffusion index’s breadth sunk below the 50% line, whereas our wage growth diffusion index spiked higher; 70% of the 44 industries we track are struggling with rising wages (second & third panels, Chart 6). Taken together, there is evidence that broad-based profit margin pressures are escalating, the mirror image of what our gauges were signaling in our last update late-last year.5 Chart 6Margins Have Likely Peaked
Margins Have Likely Peaked
Margins Have Likely Peaked
Digging beneath the surface of our corporate pricing power proxy is revealing. As a reminder, we calculate industry group pricing power from the relevant CPI, PPI, PCE and commodity growth rates for each of the 60 industry groups we track. Table 2 also highlights shorter term pricing power trends and each industry's spread to overall inflation. 57% of the industries we cover are lifting selling prices, but only 27% are raising prices at a faster clip than overall inflation. Both figures are lower than our early-November report. Outright deflating sectors increased by eight to twenty four since our last update, fifteen of which are deflating at 1%/annum pace or lower. One third of the industries we cover are experiencing a downtrend in selling price inflation, representing a 43% increase since our most recent report (Table 2). Deep cyclicals/commodity-related industries (ex-oil) continue to dominate the top ranks, occupying the top six slots (Table 2). Despite the ongoing global manufacturing deceleration and still unresolved U.S./China trade tussle, the commodity complex's ability to increase prices remains resilient. On the flip side, energy-related industries occupy the bottom of the ranks as WTI crude oil is still 22% lower than the most recent peak in October 2018. In sum, business sector selling price inflation is nil while leading wage inflation indicators signal additional labor cost increases in the coming months. The risk is that profit margins have already peaked for the cycle. We reiterate our tactically cautious overall equity market view. This week we update a high-conviction overweight tech subgroup and recap our transportation subsurface moves from last Thursday. Buy The Software Breakout Software stocks are on fire and leading profit indicators suggest that more gains are in store in the coming months. Last week, we published a table ranking all the sectors and subsectors by 12-month forward profit growth estimates (please refer to Table 2 from the March 18 Weekly Report). While the broad tech sector is on an even keel with the SPX, software EPS are racing at twice the speed of the broad market, roughly 14%. Keep in mind, when growth gets scarce, investors flock to industries with accelerating profit prospects. The software profit juggernaut is intact and we reiterate our high-conviction overweight recommendation. Sustained capital outlays on software are a key driver of industry profits (bottom panel, Chart 7). In an otherwise muted Q4 GDP release, rising non-residential fixed investment in general and surging investment in software in particular suggest that our bullish software capex thesis is alive and kicking (middle panel, Chart 7). Chart 7Software On A Tear
Software On A Tear
Software On A Tear
The move to cloud computing and SaaS, the proliferation of AI, machine learning and augmented reality are not fads but enjoy a secular growth profile, and signal that capital outlays on software are also in a structural uptrend. Not only private sector software capex is near all-time highs as a share of total outlays, but also government investment in software is reaccelerating at the fastest pace since the tech bubble. When productivity gains are anemic, both the business and government sectors resort to software upgrades in order to boost productivity. Cyber security is another more recent source of software related demand as governments are taking such risks extremely seriously the world over (second panel, Chart 8). Chart 8Earnings Led Advance
Earnings Led Advance
Earnings Led Advance
Meanwhile, fear of missing out has rekindled industry M&A and both the dollar amount and number of deals are sky high, with acquirers bidding up premia to the stratosphere (Chart 9). This supply reduction is bullish for industry pricing power. Chart 9M&A Frenzy
M&A Frenzy
M&A Frenzy
Granted the M&A frenzy has pushed relative valuations on the expensive side especially on a forward P/E basis, but on EV/EBITDA software stocks are trading below the historical mean and still significantly lower than the late-1990s peak valuation (bottom panel, Chart 8). If our bullish software profit thesis continues to pan out, then software stocks will grow into their pricey valuations. Finally, shareholder friendly activities are ongoing in this key tech subsector and buybacks in particular provide an added layer of artificial EPS growth (bottom panel, Chart 9). Adding it up, galloping higher private and public sector software outlays, a structurally enticing software demand backdrop and ongoing industry M&A, all signal that it still pays to be bullish software stocks. Bottom Line: Buy the software breakout. The S&P software index remains a high-conviction overweight. The ticker symbols for the stocks in this index are: BLBG: S5SOFT – MSFT, ORCL, ADBE, CRM, INTU, ADSK, RHT, CDNS, SNPS, ANSS, SYMC, CTXS, FTNT. Tweaking Transport Subgroup Positioning The S&P transports index’s recovery rally has stalled recently and is a cause for concern for the overall market. In more detail, the recent gulf between relative share prices and the SPX has widened and warns that the overall market is at a risk of suffering a pullback (Chart 10). Chart 10Engine Trouble
Engine Trouble
Engine Trouble
Thus on Thursday last week, we made two subsurface transport changes, downgrading a subgroup to underweight that commands lofty valuations at a time when leading profit indicators are flashing red, and also downgrading to neutral a globally exposed transport sub-index. Get Off The Rails In our downgrade of the S&P railroads index late last year to a benchmark allocation, we highlighted that two of our key industry Indicators, the Railroad Indicator and our Rail Shipment Diffusion Indicator, had turned negative.6 These indicators have continued to deteriorate, including total rail shipments which have now started to contract for the first time since the 2015-16 manufacturing recession (third panel, Chart 11). Intermodal shipments in particular have nosedived, likely a result of weak retail sales, as we highlighted earlier this month.7 Chart 11Downgrade Rails To...
Downgrade Rails To...
Downgrade Rails To...
This contraction would be far less concerning were it not for the rapid degradation of industry balance sheets as firms have sought to increase relatively cheap leverage in order to retire equity. Railroads are now significantly more indebted than the broad market which itself has not shown an aversion to adding leverage (bottom panel, Chart 11). Such a change in railroad capital structure has kept EPS growth rates artificially high while simultaneously adding an extra measure of equity risk premium that does not yet appear fully reflected in relative share prices. Moreover, when we downgraded the S&P railroads index to neutral last year, deteriorating Indicators were offset by exceptionally healthy pricing power.8 After a multi-year expansion, selling price inflation has now rolled over (second panel, Chart 12), taking away the remaining pillar supporting a neutral view which compelled us to move to an underweight allocation last week. Chart 12...Underweight
...Underweight
...Underweight
Pricing power is one of the key determinants in our earnings model that, when combined with the previously noted contracting volumes, is indicating the end to the industry’s above-trend earnings growth is nigh (third panel, Chart 12). With relative earnings growth slowing and rising leverage adding incremental risk, the S&P railroads index’s premium valuation multiple looks increasingly dicey (bottom panel, Chart 12). Bottom Line: Broad based declines in traffic volumes, falling pricing power and high leverage suggest that earnings will underwhelm. Accordingly, last Thursday we moved to an underweight recommendation on the S&P railroads index as we expect a de-rating phase to materialize. The ticker symbols for the stocks in this index are: BLBG: S5RAIL - UNP, CSX, NSC, KSU. Air Freight Had Its Wings Clipped We have been offside on the high-conviction overweight call on the S&P air freight & logistics index and the recent FedEx warning suggests that profits will come under pressure for this index for the rest of the year and will trail the SPX. As such, we trimmed exposure to neutral late-last week and removed it from the high-conviction overweight list for a loss of 14%. Chart 13 shows that all the profit drivers we had identified in early December last year have taken a sharp turn for the worse. Energy costs are no longer in deflation as oil prices have jumped from $42/bbl to near $60/bbl. Not only is global growth still decelerating, but also U.S. growth is in a softpatch: the manufacturing shipments-to-inventory ratio is on the verge of contraction, warning that delivery services’ selling prices are in for a turbulent ride (second panel, Chart 13). In addition, definitive news of Amazon becoming a formidable competitor in courier delivery services is structurally negative for the industry. Chart 13Air Freight: Move To The Sidelines
Air Freight: Move To The Sidelines
Air Freight: Move To The Sidelines
Nevertheless, we refrain from turning outright bearish as air freight stocks are technically oversold and valuations are trading at the steepest discount to the broad market since mid-2002. Bottom Line: Last Thursday we downgraded the S&P air freight & logistics index to neutral and also removed it from the high-conviction overweight list. The ticker symbols for the stocks in this index are: BLBG: S5AIRF - UPS, FDX, CHRW, EXPD. Anastasios Avgeriou, U.S. Equity Strategist anastasios@bcaresearch.com Footnotes 1 Please see BCA U.S. Equity Strategy Weekly Report, “The Good, The Bad And The Ugly” dated March 4, 2019, available at uses.bcaresearch.com. 2https://www.nfib.com/assets/jobs0219hwwd.pdf 3https://ca.spindices.com/documents/additional-material/sp-500-eps-est.xlsx?force_download=true 4 Please see BCA U.S. Equity Strategy Weekly Report, “Signal Vs. Noise” dated December 17, 2018, available at uses.bcaresearch.com. 5 Please see BCA U.S. Equity Strategy Weekly Report, “Recuperating” dated November 5, 2018, available at uses.bcaresearch.com. 6 Please see BCA U.S. Equity Strategy Weekly Report, “Critical Reset“, dated October 29, 2018, available at uses.bcaresearch.com. 7 Please see BCA U.S. Equity Strategy Weekly Report, “The Good, The Bad And The Ugly“, dated March 4, 2019, available at uses.bcaresearch.com. 8 Please see BCA U.S. Equity Strategy Weekly Report, “Critical Reset“, dated October 29, 2018, available at uses.bcaresearch.com. Current Recommendations Current Trades Size And Style Views Favor value over growth Favor large over small caps
A Reboot In Sentiment For Tech Hardware
A Reboot In Sentiment For Tech Hardware
Overweight The S&P tech hardware, storage & peripherals (THSP) index has been outperforming in the past few sessions as sell side sentiment has reversed course, principally on the dominant constituent firm, Apple. Net earnings revisions have bounced back strongly from the collapse following Apple’s repeated lowered forward guidance at the end of 2018 (second panel); it appears both the sell side and the market are looking forward from a new reset point. Optimism seems justified: Apple’s recent revamp of a number of product lines was well received and Monday’s upcoming launch of the company’s streaming service and its potential for deepening high-margin services revenue and cementing the company’s ecosystem has drawn a number of ratings upgrades this week. From a macro perspective we remain focused on valuation and leverage, both of which are encouraging. Despite the recent rally, the S&P THSP index continues to trade at a >10% discount to the broad market (third panel). Further, the still-pristine balance sheets reinforce some expectations that Apple could unveil a $100 billion share buyback program for the year to come. Bottom Line: A number of catalysts should propel the reasonably valued S&P THSP index higher; stay overweight. The ticker symbols for the stocks in the S&P THSP index are: BLBG: S5CMPE - HPQ, WDC, STX, XRX, AAPL, HPE, NTAP.
Air Freight Had Its Wings Clipped Air Freight & Logistics
Air Freight Had Its Wings Clipped Air Freight & Logistics
Neutral We have been offside on the high-conviction overweight call on the S&P air freight & logistics index and the recent FedEx warning suggests that profits will come under pressure for this index for the rest of the year and will trail the SPX. As such, we are trimming exposure to neutral and removing it from the high-conviction overweight list today for a loss of 14%. The chart shows that all the profit drivers we had identified in early December last year have taken a sharp turn for the worse. Energy costs are no longer in deflation as oil prices have jumped from $42/bbl to near $60/bbl. Not only is global growth still decelerating, but also U.S. growth is in a softpatch: the manufacturing shipments-to-inventory ratio is on the verge of contraction, warning that delivery services’ selling prices are in for a turbulent ride (second panel). In addition, definitive news of Amazon becoming a formidable competitor in courier delivery services is structurally negative for the industry. Nevertheless, we refrain from turning outright bearish as air freight stocks are technically oversold and valuations are trading at the steepest discount to the broad market since mid-2002. Bottom Line: Downgrade the S&P air freight & logistics index to neutral and also remove it from the high-conviction overweight list today. The ticker symbols for the stocks in this index are: BLBG: S5AIRF - UPS, FDX, CHRW, EXPD.
Pricing Power Is Derailing
Pricing Power Is Derailing
Underweight Our previous Insight referenced the deterioration of indicators that caused us to grow more negative in last year’s downgrade of the S&P railroads index to a benchmark allocation but what kept us from moving to an outright bearish position at that time was exceptionally strong pricing power.1 After a multi-year expansion, pricing power has now rolled over (second panel), taking away the remaining pillar supporting a neutral view and we are compelled to move to an underweight allocation today. Pricing power is one of the key determinants in our earnings model which, when combined with the contracting volumes noted in the previous Insight, is indicating the end to the industry’s above-trend earnings growth is nigh (third panel). With relative earnings growth slowing and rising leverage adding incremental risk, the S&P railroads index’s premium valuation multiple looks increasingly dicey (bottom panel). Bottom Line: Broad based declines in traffic volumes, falling pricing power and high leverage suggest that earnings will underwhelm. Accordingly we are moving to an underweight recommendation on the S&P railroads index as we expect a de-rating phase to materialize. Please see the next Insight for another transportation subsector change. The ticker symbols for the stocks in this index are: BLBG: S5RAIL - UNP, CSX, NSC, KSU. 1 Please see BCA U.S. Equity Strategy Report, “Critical Reset“, dated October 29, 2018, available at uses.bcaresearch.com.