Sectors

Get Off The Rails
Get Off The Rails
Underweight In our downgrade of the S&P railroads index late last year to a benchmark allocation, we highlighted that two of our key industry Indicators, the Railroad Indicator and our Rail Shipment Diffusion Indicator, had turned negative.1 These indicators have continued to deteriorate, including total rail shipments which have now started to contract for the first time since the 2015-16 manufacturing recession (third panel). Intermodal shipments in particular have nosedived, likely a result of weak retail sales, as we highlighted earlier this month.2 Such a contraction would be far less concerning were it not for the rapid degradation of industry balance sheets as firms have sought to increase relatively cheap leverage in order to retire equity. Railroads are now significantly more indebted than the broad market which itself has not shown an aversion to adding leverage (bottom panel). Such a change in railroad capital structure has kept EPS growth rates artificially high while simultaneously adding an extra measure of equity risk premium that does not yet appear fully reflected in relative share prices. Our concerns surrounding the S&P railroads index have amplified as our Indicators have deteriorated and leverage has mounted; please see the following Insight for our change in recommendation. 1 Please see BCA U.S. Equity Strategy Report, “Critical Reset“, dated October 29, 2018, available at uses.bcaresearch.com. 2 Please see BCA U.S. Equity Strategy Report, “The Good, The Bad And The Ugly“, dated March 4, 2019, available at uses.bcaresearch.com.
The S&P transports index’s recovery rally has stalled recently and is a cause for concern for the overall market. In more detail, the recent gulf between relative share prices and the SPX has widened and warns that the overall market will likely pullback. As a reminder, we first became tactically cautious on the overall market in the March 4thWeekly Report, and today we reiterate this short-term cautious stance, especially given FedEx’s recent warning. Thus, we are making two subsurface transport changes today, downgrading a subgroup to underweight that commands lofty valuations at a time when leading profit indicators are flashing red, and also downgrading to neutral a globally exposed transport subindex. Please see the following three Insights detailing our intra-transportation industry moves.
Tweaking Transport Subgroup Positioning
Tweaking Transport Subgroup Positioning
Valuations Are Too High For Interactive Media & Services
…
Valuations Are Too High For Interactive Media And Services
Valuations Are Too High For Interactive Media And Services
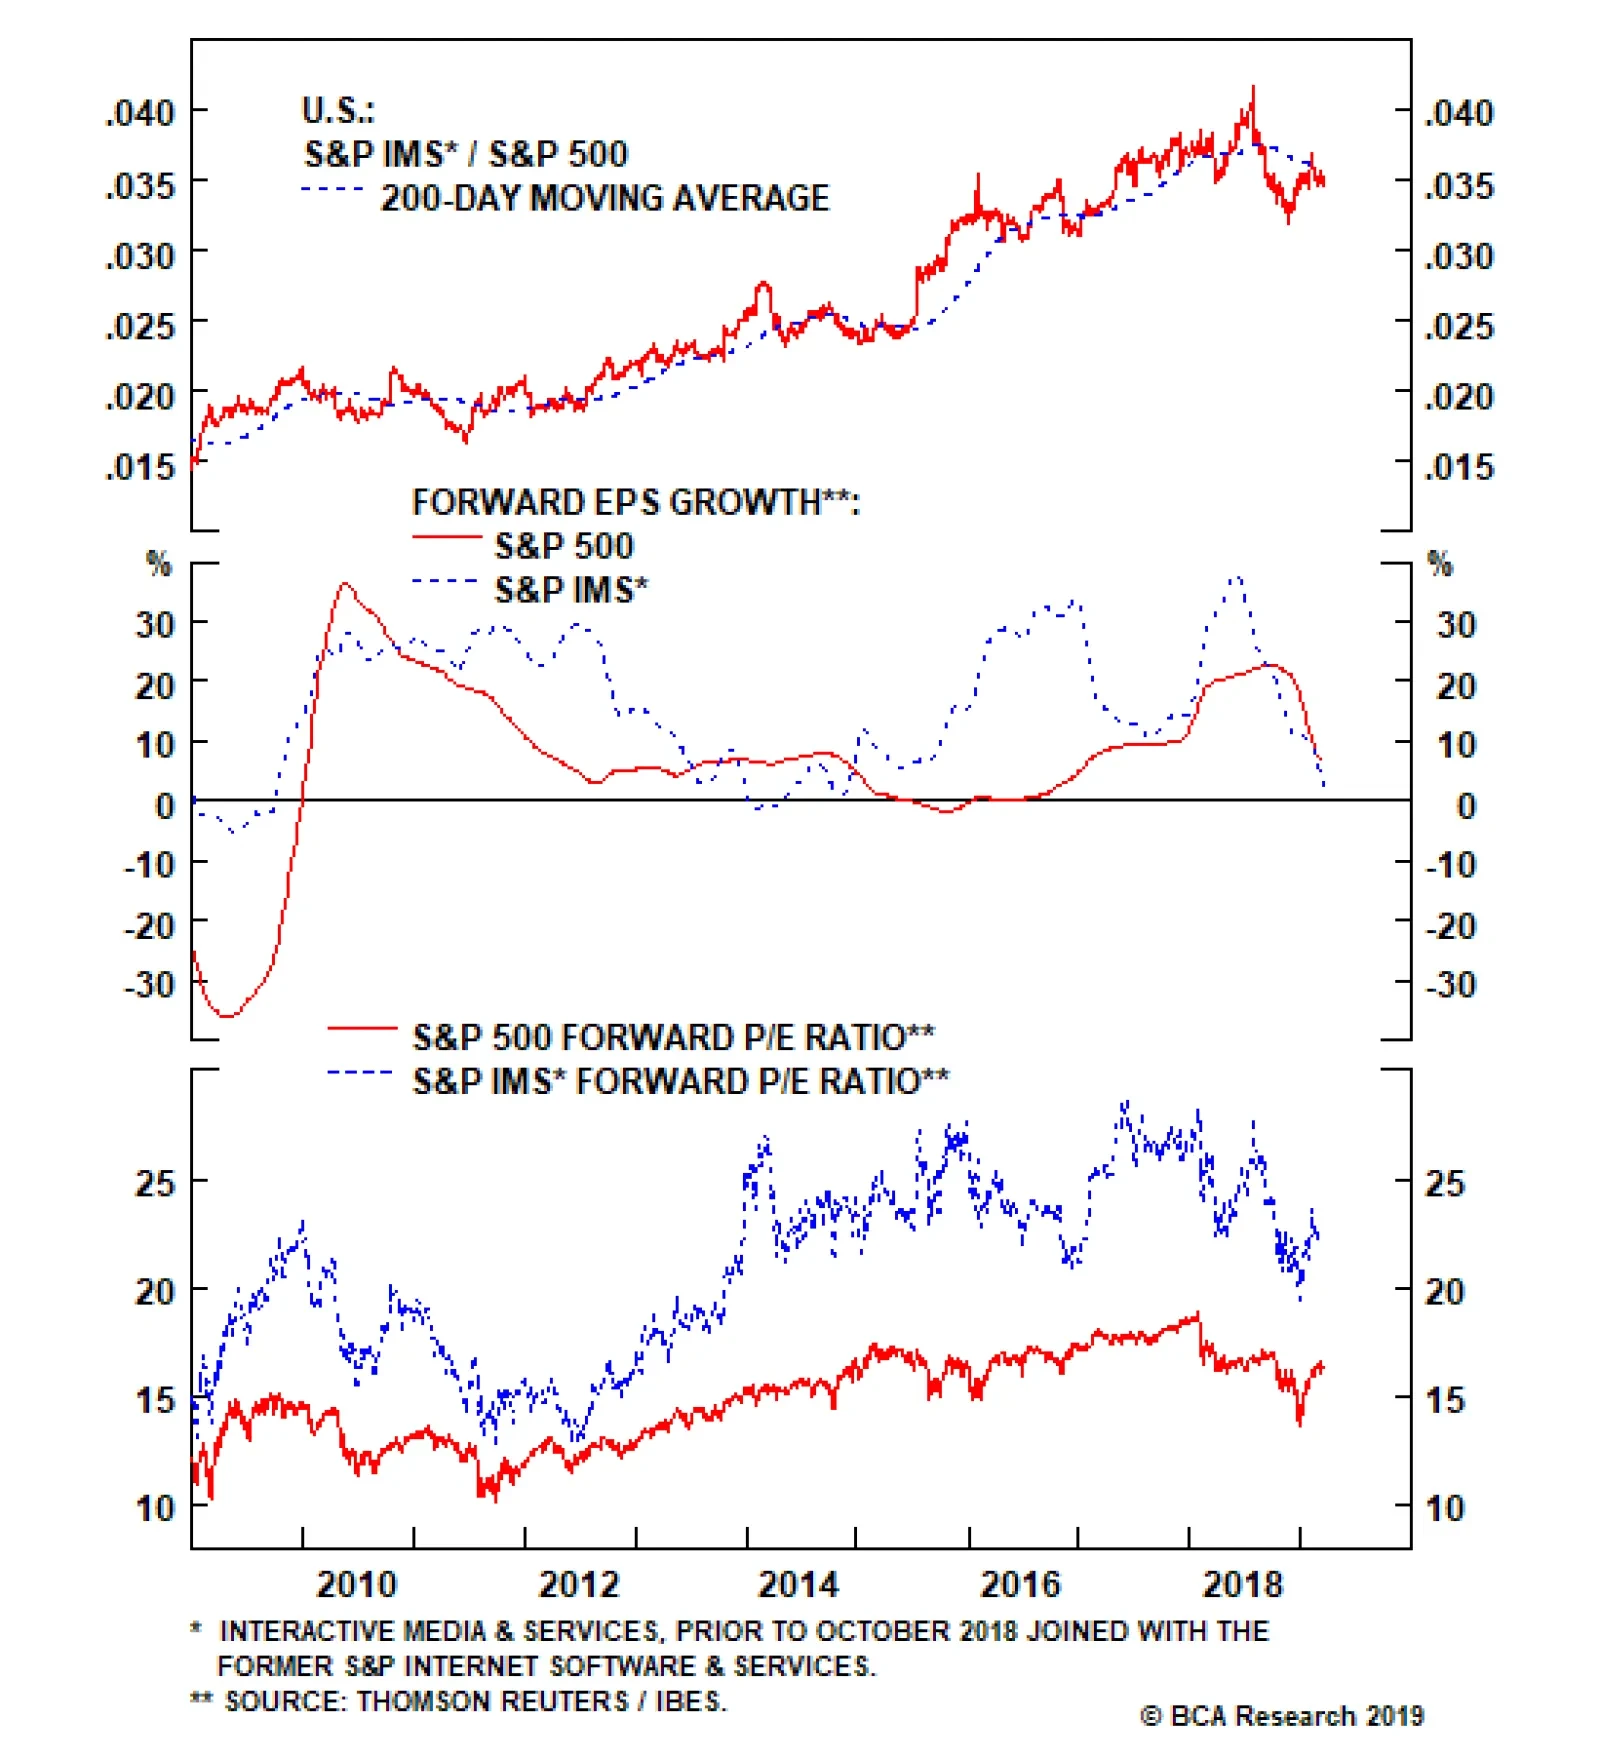
Underweight (High-Conviction) Shares in Facebook, a heavyweight component of the S&P interactive media & services index, have been falling recently as an exodus of executives, including the founders of the Instagram platform, have shaken investor confidence. This adds to our core concern over pending privacy regulation which may further dampen the company’s prospects, as highlighted in our initiation of the index last year.1 Facebook is not alone in facing regulatory struggles as anti-trust legislation against the other index heavyweight Alphabet seems ever more likely to gain traction; at least one presidential contender has made tech break-up part of her election platform. Beyond the headline risks faced by the S&P interactive media & services index, we remain concerned by the growth and valuation prospects. The sector’s forward earnings growth has collapsed to just above the zero line and fallen below the broad market (middle panel). Meanwhile, the slower-growing S&P interactive media & services index trades at an enormous premium to the S&P 500 (bottom panel). Bottom Line: We continue to think a mismatch exists between valuation, growth and regulatory headwinds and reiterate our high-conviction underweight in the S&P interactive media & services index. The ticker symbols in the stocks in this index are: S5INMS – GOOGL, GOOG, FB, TWTR and TRIP. 1 Please see BCA U.S. Equity Strategy Special Report, "Is The Stock Rally Long In The FAANG?," dated August 1, 2018, available at uses.bcaresearch.com.
This deteriorating demand backdrop more than offset the industry’s reaction function, which has been intra and inter-industry M&A. Now that the M&A dust has settled, what is next in store for the industry? There are many cross-currents. Our U.S.…
The share of residential investment as a percentage of GDP has been steadily decreasing over the past 70 years, and is down to just 3% today. Although housing remains an important component of the U.S. economy and large fluctuations in the space will surely…
Highlights Portfolio Strategy As growth becomes scarce, investors flock to sectors that are slated to outgrow the broad market and shy away from the ones that are forecast to trail the SPX’s growth rate. This week we rank sectors and subsectors by EPS growth in our universe of coverage, and identify sweet and trouble spots. Fired up crack spreads, firming refining industry operating metrics, reaccelerating exports along with washed out technicals and compelling valuations, all signal that the time is ripe to buy into refining weakness. The cable industry’s demand headwinds are reflected in depressed relative valuations at a time when industry pricing power is trying to stage a comeback and a drifting lower greenback may also provide positive profit offsets. Stick with a benchmark allocation. Recent Changes Boost the S&P Oil & Gas Refining & Marketing index to overweight all the way from underweight today, locking in relative profits of 21%. Table 1
Awaiting Validation
Awaiting Validation
Feature Equities broke out last week and surpassed the upper band of their recent trading range, despite economic data releases that continued to surprise to the downside. Two weeks ago, we cautioned investors not to put cash to work as a tactical indigestion period loomed, with the SPX facing stiff resistance near the 2,800 level. In addition, we posited that most of the good news related to the U.S./China trade spat front was reflected in the S&P 500’s V-shaped recovery (top panel, Chart 1). In relative terms, the bottom panel of Chart 1 confirms that the easy money has already been made on the assumption of a positive resolution to the U.S./China trade dispute. Chart 1Trade Deal Priced In
Trade Deal Priced In
Trade Deal Priced In
Going forward, the earnings juggernaut will have to remain in place in order for stocks to vault to fresh all-time highs, likely in the back half of the year. The Trump administration’s massive fiscal stimulus artificially fueled profit growth last year both by lowering the corporate tax rate and by encouraging overseas cash repatriation. The latter boosted share buybacks to an all-time record. Despite 24% EPS growth and $1tn in equity retirement, the SPX ended 2018 6% lower. Why? It became clear that EPS growth was headed lower. In order to gauge trend EPS growth we opt to use EBITDA, a cash flow proxy measure that strips out the direct impact of last year’s fiscal easing. Chart 2 clearly shows that trend growth took a step down following the positive base effects of the GFC-induced collapse and averaged close to 5%/annum from 2012 to 2014. Subsequently, the late-2015/early-2016 manufacturing recession sunk EBITDA into contraction, but the euphoria surrounding the newly elected President pushed trend EBITDA growth to near 10%/annum for two full years in 2017 and 2018. Chart 2Return To 5% Growth?
Return To 5% Growth?
Return To 5% Growth?
Since the late-2018 peak, 12-month forward EBITDA growth continues to drift lower and is now hovering just shy of 3%. Our sense is that 5% organic profit growth is consistent with nominal GDP printing 4%-4.5% at this stage of the business cycle, signaling that a return to the 2012-2014 growth backdrop is likely later in the year. As a reminder, positive profit growth in calendar 2019 remains one of the three pillars underpinning stocks that we have highlighted since the beginning of this year. Stocks have come full circle recovering all of last December’s losses, but in order to make fresh all-time highs, profits will have to deliver. We deem that an earnings validation phase is transpiring and there are early signs that profit growth will trough sometime in the first half of the year. Not only has EBITDA breadth put in a bottom (Chart 2), but also economically hypersensitive indicators suggest that forward EBITDA growth will soon tick higher. Namely, the ISM manufacturing new orders component has perked up on a year-over-year basis. The trough in lumber futures momentum corroborates this message, as does the tick higher in the U.S. boom/bust indicator (Chart 3). Chart 3Growth Green-shoots
Growth Green-shoots
Growth Green-shoots
Given the current macro backdrop and awaiting the profit validation, when growth becomes scarce investors flock to sectors that are outgrowing the broad market and shy away from ones that trail the SPX’s growth rate. Typically, in recessionary times that would equate to investors bidding up defensive sectors that command stable cash flow businesses and avoiding highly cyclical industries. But, BCA does not expect a recession in the coming year. Thus, in order to identify high growth sectors that should outperform during the current soft patch and growth laggards that should underperform, we compiled a table with the GICS1 sectors and all the subsectors we cover. First, we rank the GICS1 sectors and then within each sector we rank the subsectors, both times by absolute 12-month forward EPS growth using I/B/E/S/ data (see second columns, Table 2). We aim to reproduce this table once a quarter. Table 2Identifying S&P 500 Sector EPS Growth Leaders And Laggards
Awaiting Validation
Awaiting Validation
The third columns in Table 2 show the sector growth rate relative to the SPX. The final columns in Table 2 highlight the trend in relative growth. In more detail, they compare the current relative growth rate to that of three months ago: a positive sign indicates an upgrade in analysts’ relative estimates and a negative sign a downgrade in analysts’ relative estimates. Industrials and financials (we are overweight both) are leading the pack outpacing the broad market by 410bps and 350bps, respectively, and enjoy a rising profit trend. On the flip side, energy (overweight) and real estate (underweight) trail the broad market by 490bps and 1480bps, respectively, and showcase a deteriorating EPS trend. With regard to energy, we first identified that analysts are really punishing this sector in the January 22 Weekly Report and the sector’s 2019 EPS contribution was and remains negative.1 Our overweight call will be offside if oil prices suffer a new setback, but our Commodity & Energy strategy service remains bullish on oil, implying relative EPS outperformance in 2019. Year-to-date, energy has bested the SPX by 170bps. This week, we make an energy sector subsurface tweak, and also update a communication services subgroup. Light My Fire Last summer we took refiners down to a below benchmark allocation as all of the good news was perfectly reflected in soaring relative share prices (top panel, Chart 4), at a time when cracks were forming. Now we are compelled to book gains of 21% and boost exposure all the way to overweight. Chart 4Crack Spreads Are On Fire
Crack Spreads Are On Fire
Crack Spreads Are On Fire
Today, refiners paint a near exact opposite picture compared with last July. Relative share prices are no longer rising by 50%/annum. Instead, momentum has collapsed and is now contracting (middle panel, Chart 4). Sell-side analyst exuberance has turned into outright pessimism: refiners’ profits are expected to trail the broad market in the coming year. By comparison, last summer they were penciled in to beat the market by 30 percentage points (bottom panel, Chart 4). Granted M&A activity had also added fuel to the fire, but now all the hot air has come out of the refining industry, and then some. Refiners’ riches move in tandem with crack spreads. When refining margins widen, profits excel and vice versa. Now that refining margins are in a slingshot recovery, refining ills will turn into fortunes (bottom panel, Chart 4). Importantly, wide Brent-WTI spreads underpin crack spreads. Moreover, the crude oil versus refined product inventory backdrop currently reinforces a widening in refining margins. In absolute terms, gasoline stockpiles are being worked off (gasoline inventories shown inverted, bottom panel, Chart 5) and grinding higher demand for refined petroleum products (top panel, Chart 5) will further tighten the industry’s inventory outlook. Chart 5Healthy Supply/Demand Backdrop
Healthy Supply/Demand Backdrop
Healthy Supply/Demand Backdrop
One way domestic refiners are taking advantage of the still wide Brent-WTI differential is via the export markets. Net refined products exports are running at over 3mn barrels/day (bottom panel, Chart 6), and the softening greenback since November will further boost profits with a slight lag as U.S. refining exports will grab an even larger slice of the global pie (U.S. dollar shown inverted and advanced, middle panel, Chart 6). Chart 6U.S. Dollar Softness Is A Boon To Refining Profits
U.S. Dollar Softness Is A Boon To Refining Profits
U.S. Dollar Softness Is A Boon To Refining Profits
On the valuation front, both the relative forward P/E and P/S have undershot their respective historical means and EPS breadth is as bad as it gets, offering investors an excellent entry point in the pure-play oil & gas refining industry (Chart 7). Chart 7Extreme Analyst Pessimism Reigns
Extreme Analyst Pessimism Reigns
Extreme Analyst Pessimism Reigns
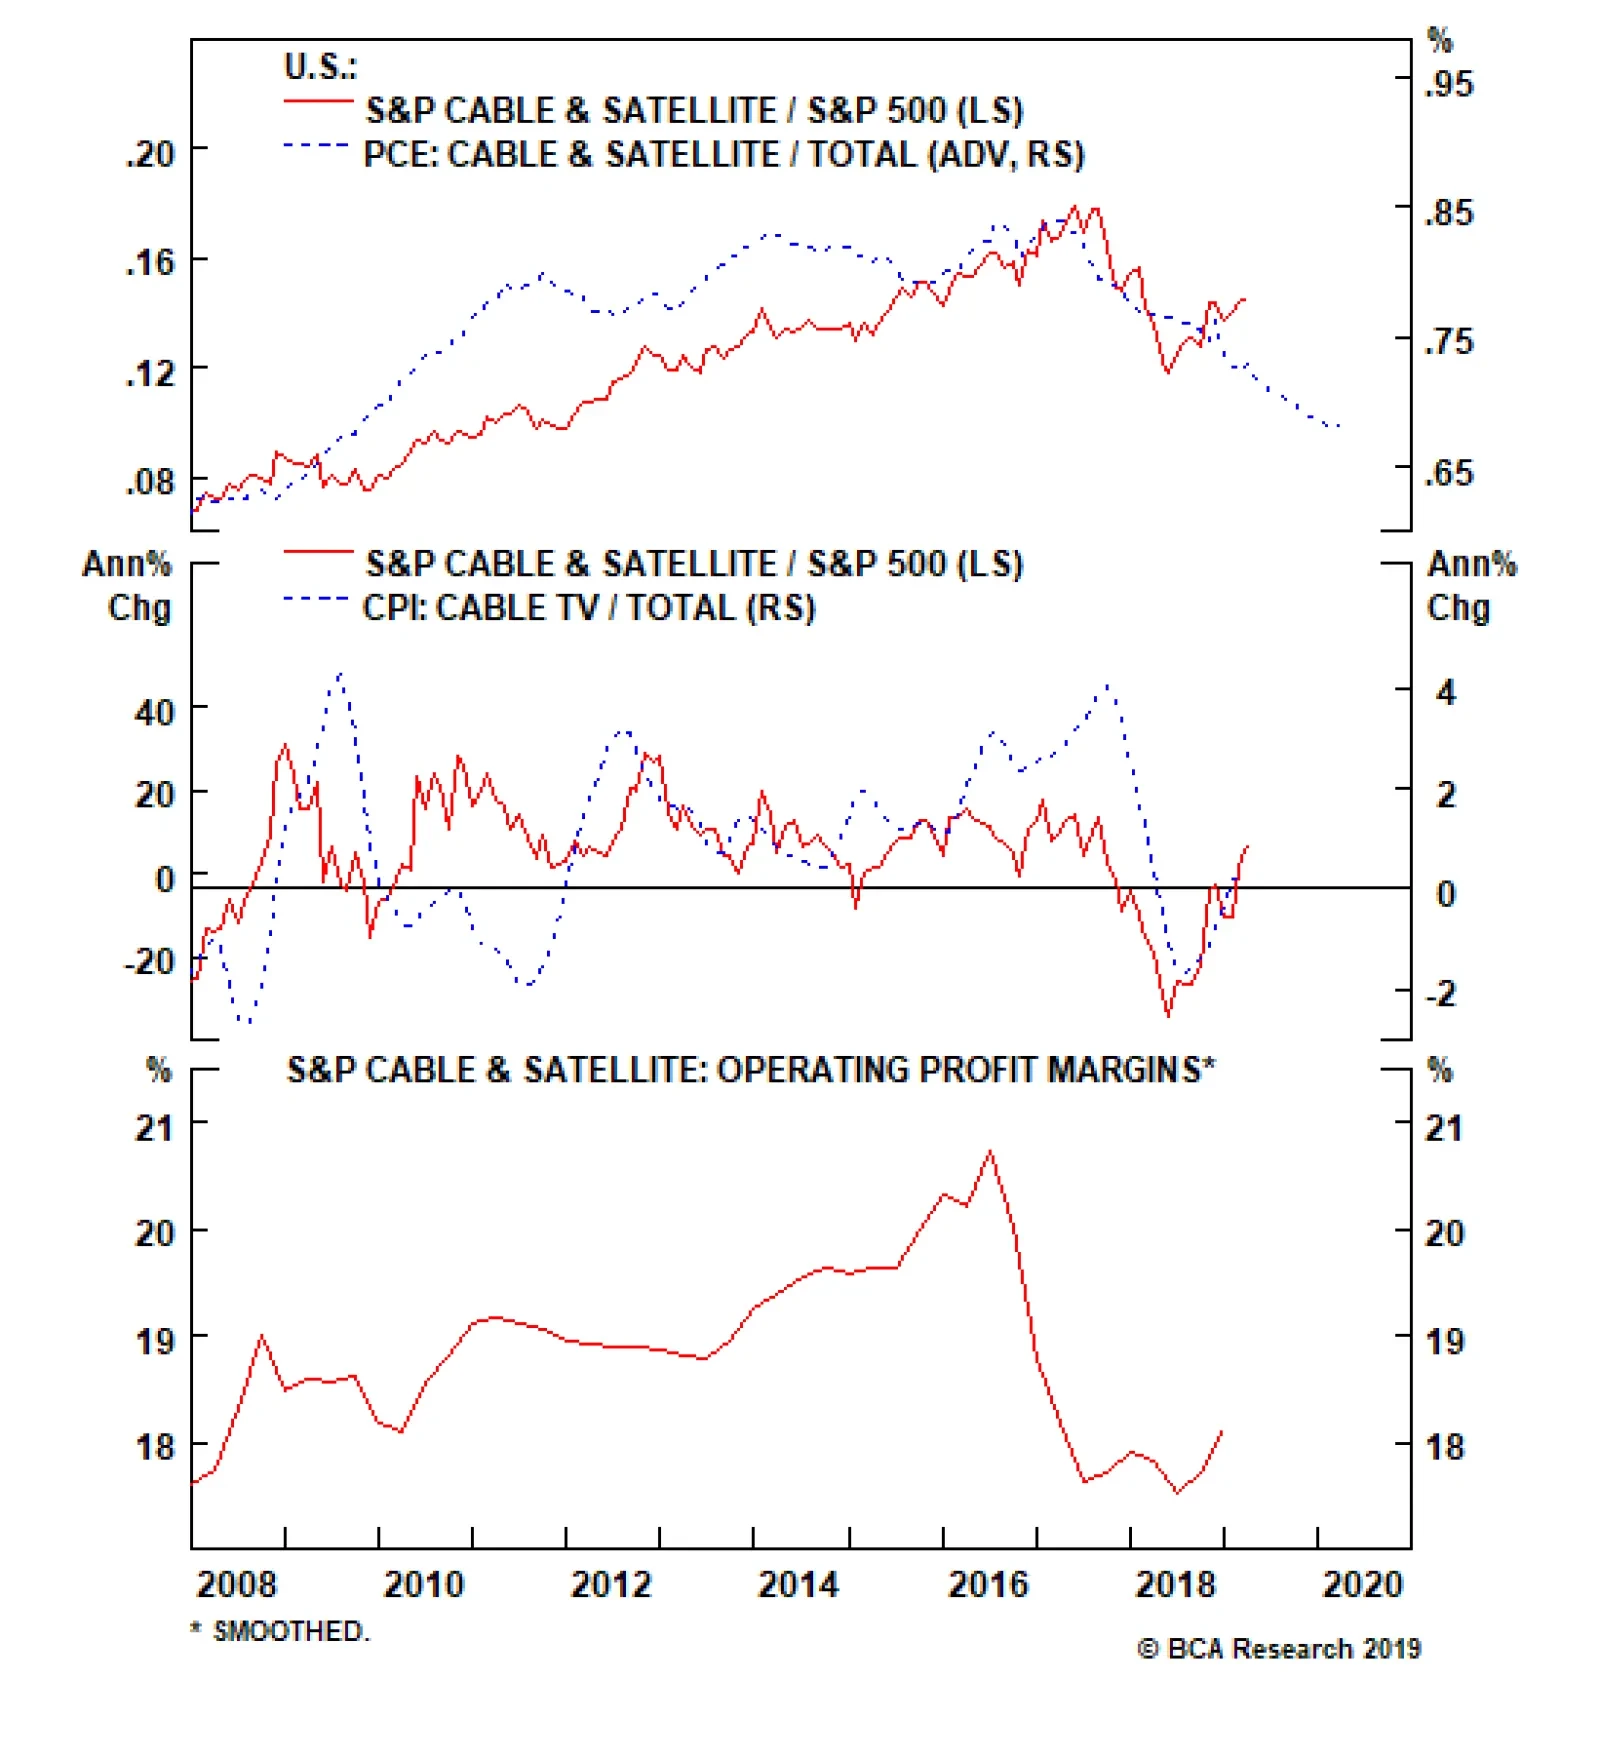
In sum, fired up crack spreads, firming refining industry operating metrics, reaccelerating exports along with washed out technicals and compelling valuations, all signal that the time is ripe to buy into refining weakness. Bottom Line: Lift the S&P oil & gas refining & marketing index to overweight all the way from a below benchmark allocation, crystalizing 21% in relative profits since last summer’s inception. The ticker symbols for the stocks in this index are: BLBG: S5OILR – PSX, MPC, VLO, HFC. Cable’s Down But Not Out Cable & satellite stocks had been in an uninterrupted run from the depths of the Great Recession until the peak in relative share prices in August 2017. Since then, cord cutting news and the proliferation of on demand streaming services have wreaked havoc on the industry and cable stocks have trailed the market by over 33% from peak to the most recent trough (top panel, Chart 8). Chart 8Cable Signals Are…
Cable Signals Are…
Cable Signals Are…
This deteriorating demand backdrop more than offset the industry’s reaction function, which has been intra and inter-industry M&A. Now that the M&A dust has settled, what is next in store for the industry? We reckon that leading profit indicators are a mixed bag and we continue to recommend a benchmark allocation in this niche communications services subgroup. The top panel of Chart 8 shows that relative outlays on cable are on a slippery slope, and will continue to weigh heavily on relative share prices for the coming quarters. Nevertheless, the ISM services survey ticked higher recently and is on the cusp of making fresh recovery highs, unlike its sibling the ISM manufacturing survey. This is encouraging news for cable executives and suggests that demand for cable services may not be as moribund as the PCE release is projecting (second panel, Chart 9). Chart 9..A Mixed…
..A Mixed…
..A Mixed…
While the cable demand backdrop is unclear, industry pricing power has managed to exit deflation. Cable selling prices have been positive for the better part of the past decade, but starting in late-2017 they collapsed by roughly 600bps relative to overall inflation. True, this deflationary impulse dented profit margins, but currently the industry’s selling prices – and to a much lesser extent profit margins – are in a V-shaped recovery mostly courtesy of base effects (middle & bottom panels, Chart 8). Absent a sustained hook up in cable demand, selling price inflation will prove fleeting and the recent margin expansion phase will also lose steam. Meanwhile, cable stocks and the U.S. dollar enjoy a positive correlation as most of the constituents’ earnings are derived domestically (Chart 10). The recent U.S. dollar softness will, at the margin, weigh on relative profits and thus relative share prices, especially if the Fed stays pat and refrains from raising rates for the rest of the year as the bond market currently expects. Chart 10…Bag
…Bag
…Bag
Finally, earnings breadth continues to fall, but relative valuations are still well below the historical mean (third & bottom panels, Chart 9). Netting it all out, cable’s demand headwinds are well reflected in depressed relative valuations at a time when industry pricing power is trying to stage a comeback and a drifting lower greenback may both provide positive profit offsets. Bottom Line: Remain on the sidelines in the S&P cable & satellite index. The ticker symbols for the stocks in this index are: BLBG: S5CBST – CMCSA, CHTR, DISH. Anastasios Avgeriou, U.S. Equity Strategist anastasios@bcaresearch.com Footnotes 1 Please see BCA U.S. Equity Strategy Weekly Report, “Dissecting 2019 Earnings” dated January 22, 2019, available at uses.bcaresearch.com. Current Recommendations Current Trades Size And Style Views Favor value over growth Favor large over small caps
Highlights We are asked nearly everywhere we go about the Fed’s independence, … : The Fed’s independence is an especially popular topic overseas, and it typically takes some persuasion to bring clients around to our view that it’s not at risk. … and Jay Powell shed some light on how the Fed intends to protect it: Since Bernanke, the Fed has fought back against criticism by attempting to open a window on its operations, and showing how they benefit all Americans. Powell’s Stanford speech and 60 Minutes appearance continued the transparency and charm offensive. The housing debate remains unresolved, but year-to-date activity has supported our sanguine outlook: Demand came back smartly following the decline in mortgage rates, and there is still no sign of overheating or oversupply on the horizon. Coincident indicators have a place, too: We do not include the three-month moving average of the unemployment rate in our recession indicator because it’s only a coincident indicator, but it does help to validate the leading indicators we follow. Feature BCA was established on our founder’s insight that tracking money flows through the banking system informs the future direction of the economy and financial markets. Monetary policy is of the utmost importance to BCA as a firm, and the fed funds rate cycle is a pillar of our U.S. Investment Strategy asset-allocation framework. That said, spending time parsing Fed speeches can be unavailing and tedious. Although we continually monitor comments from the Fed governors and regional bank presidents, we don’t often write about them. Since last summer, when the President first began expressing his displeasure with the Fed 140 characters at a time, we have been inundated with questions about the Fed’s independence, especially from overseas clients. We have noted repeatedly that conflicts between the White House and the Fed are nothing new. They are largely inevitable, and highlight the importance of insulating central banks from political pressure. A recent television interview and speech by Fed Chair Powell illustrated how the Fed hopes to safeguard its independence. The speech also sketched out some of the arguments supporting a potential re-interpretation of the Fed’s price stability mandate. If the Fed really were to pursue some sort of price-level targeting, the implications could be profound. TRIGGER ALERT: The following sections may promote cardiac distress among Austrian School devotees and other hard-money types. An Open, Friendly Fed Fed Chair Jerome Powell sat for an extended interview with venerable U.S. television news magazine 60 Minutes, broadcast in prime time Sunday March 10th. His comments carried no new information for Fed watchers, but appearances on 60 Minutes are not intended for Fed watchers, any more than Janet Yellen’s stop to watch community college students welding on her first official trip as Chair was. Powell appeared briefly alongside Yellen and Ben Bernanke in the 60 Minutes segment, and his appearance followed his predecessors’ public-relations game plan closely: defend the Fed’s independence, and explain the Fed’s role in managing the economy, so as to dispel some of the mystery about its mission and modus operandi. It was Bernanke who first sat for 60 Minutes, in 2009 and 2010, attempting to broadcast the Fed’s aims to the general public. Yellen extended the public outreach, as we noted in these pages five years ago, following her debut appearance:1 Not only did she make her first major outside appearance at a community development conference, she placed the plight of three locals grappling with unemployment and/or underemployment at the center of her remarks. She dined at a community-college training restaurant on the night before the speech, and went to another community college after delivering it, where she visited a shop floor and watched students weld. One could easily have mistaken her for a candidate for public office, given the photo ops and her dogged efforts to drive home the message that the labor market heads the Fed’s list of concerns. A New Take On Price Stability Powell’s 60 Minutes interviewer occasionally went out of his way to express skepticism about the Fed and its pre-crisis performance. A voiceover pointed to Powell’s academic record and Wall Street experience as signs of privilege, rather than evidence of aptitude or acumen. As Powell noted in a speech at Stanford University two days before the 60 Minutes interview aired, the current climate is one of “intense scrutiny and declining trust in public institutions” globally. Outwardly welcoming the scrutiny, and seeking to shore up the public’s trust, the Fed plans to hold a series of town-hall-style “Fed Listens” events around the country. The post-crisis Fed has tried to protect its independence by becoming more transparent. The Fed’s listening tour will be a part of its year-long review of monetary policy strategy, tools and communication practices, but we were most interested in Powell’s comments on strategy as it relates to the Fed’s price-stability mandate. Concerned that the secular decline in rates will regularly make the zero lower bound a binding policy constraint, the Fed is exploring the potential for some sort of price-level-targeting strategy. As a part of its review, it is asking, “Can the Federal Reserve best meet its statutory objectives with its existing monetary policy strategy, or should it consider strategies that aim to reverse past misses of the inflation objective?” When targeting the inflation rate, the Fed hasn’t much sweated inflation undershoots. Price-level targeting would represent a significant change from managing to the 2% annual inflation target on a non-cumulative basis. As shown in Chart 1, the Fed has executed its price-stability mandate by aiming for 2% annual inflation, as measured by the headline PCE price index. In theory, each year-over-year change is an independent event, considered without regard to prior overshoots or undershoots. The post-crisis shortfalls have no explicit bearing on the price-stability goal going forward, though perhaps they have made the Fed a little more inclined to wait until it sees the whites of inflation’s eyes before it removes accommodation in earnest. Chart 1Traditional Policy Has Been Directed At Keeping Prices From Rising Too Fast ...
Traditional Policy Has Been Directed At Keeping Prices From Rising Too Fast ...
Traditional Policy Has Been Directed At Keeping Prices From Rising Too Fast ...
A price-level-targeting framework, on the other hand, would take its cues directly from past overshoots and undershoots. Whereas the Fed simply aimed at 2% every year in the old regime, under price-level targeting, it would be attempting to stay in continual contact with the 2% trend-growth line in Chart 2. Had price-level targeting been in place since the crisis began, the cumulative misses from 2008 on would eventually have to be made up. If the price-level target were to be reached by the end of this year, 2019 inflation would have to be 8.1%; by the end of next year, annualized inflation would have to be 5%; in five years, 3.2%; and in ten years, 2.6% (Table 1). Chart 2... Price-Level Targeting Seeks To Ensure They've Risen Enough
... Price-Level Targeting Seeks To Ensure They've Risen Enough
... Price-Level Targeting Seeks To Ensure They've Risen Enough
Table 1Price-Level Targeting
Kinder, Gentler Central Banking
Kinder, Gentler Central Banking
Higher inflation rates would presumably push Treasury bond volatility higher (Chart 3, top panel), along with the term premium (Chart 3, bottom panel). The increased uncertainty inherent in hitting a moving target would also help stoke interest-rate volatility, which would ripple out into the rest of financial markets. The Fed wouldn’t deliberately pursue a policy that stokes volatility unless it delivers other significant benefits. By boosting inflation expectations, price-level targeting could help stave off a deflationary mindset like the one that has crippled Japan since the bursting of its bubble three decades ago. More immediately, it could help combat the secular stagnation effects Larry Summers has been warning about for the last several years by making it easier for the Fed to reduce real rates. Chart 3Lower Inflation Has Helped Tamp Down Treasury Volatility And The Term Premium
Lower Inflation Has Helped Tamp Down Treasury Volatility And The Term Premium
Lower Inflation Has Helped Tamp Down Treasury Volatility And The Term Premium
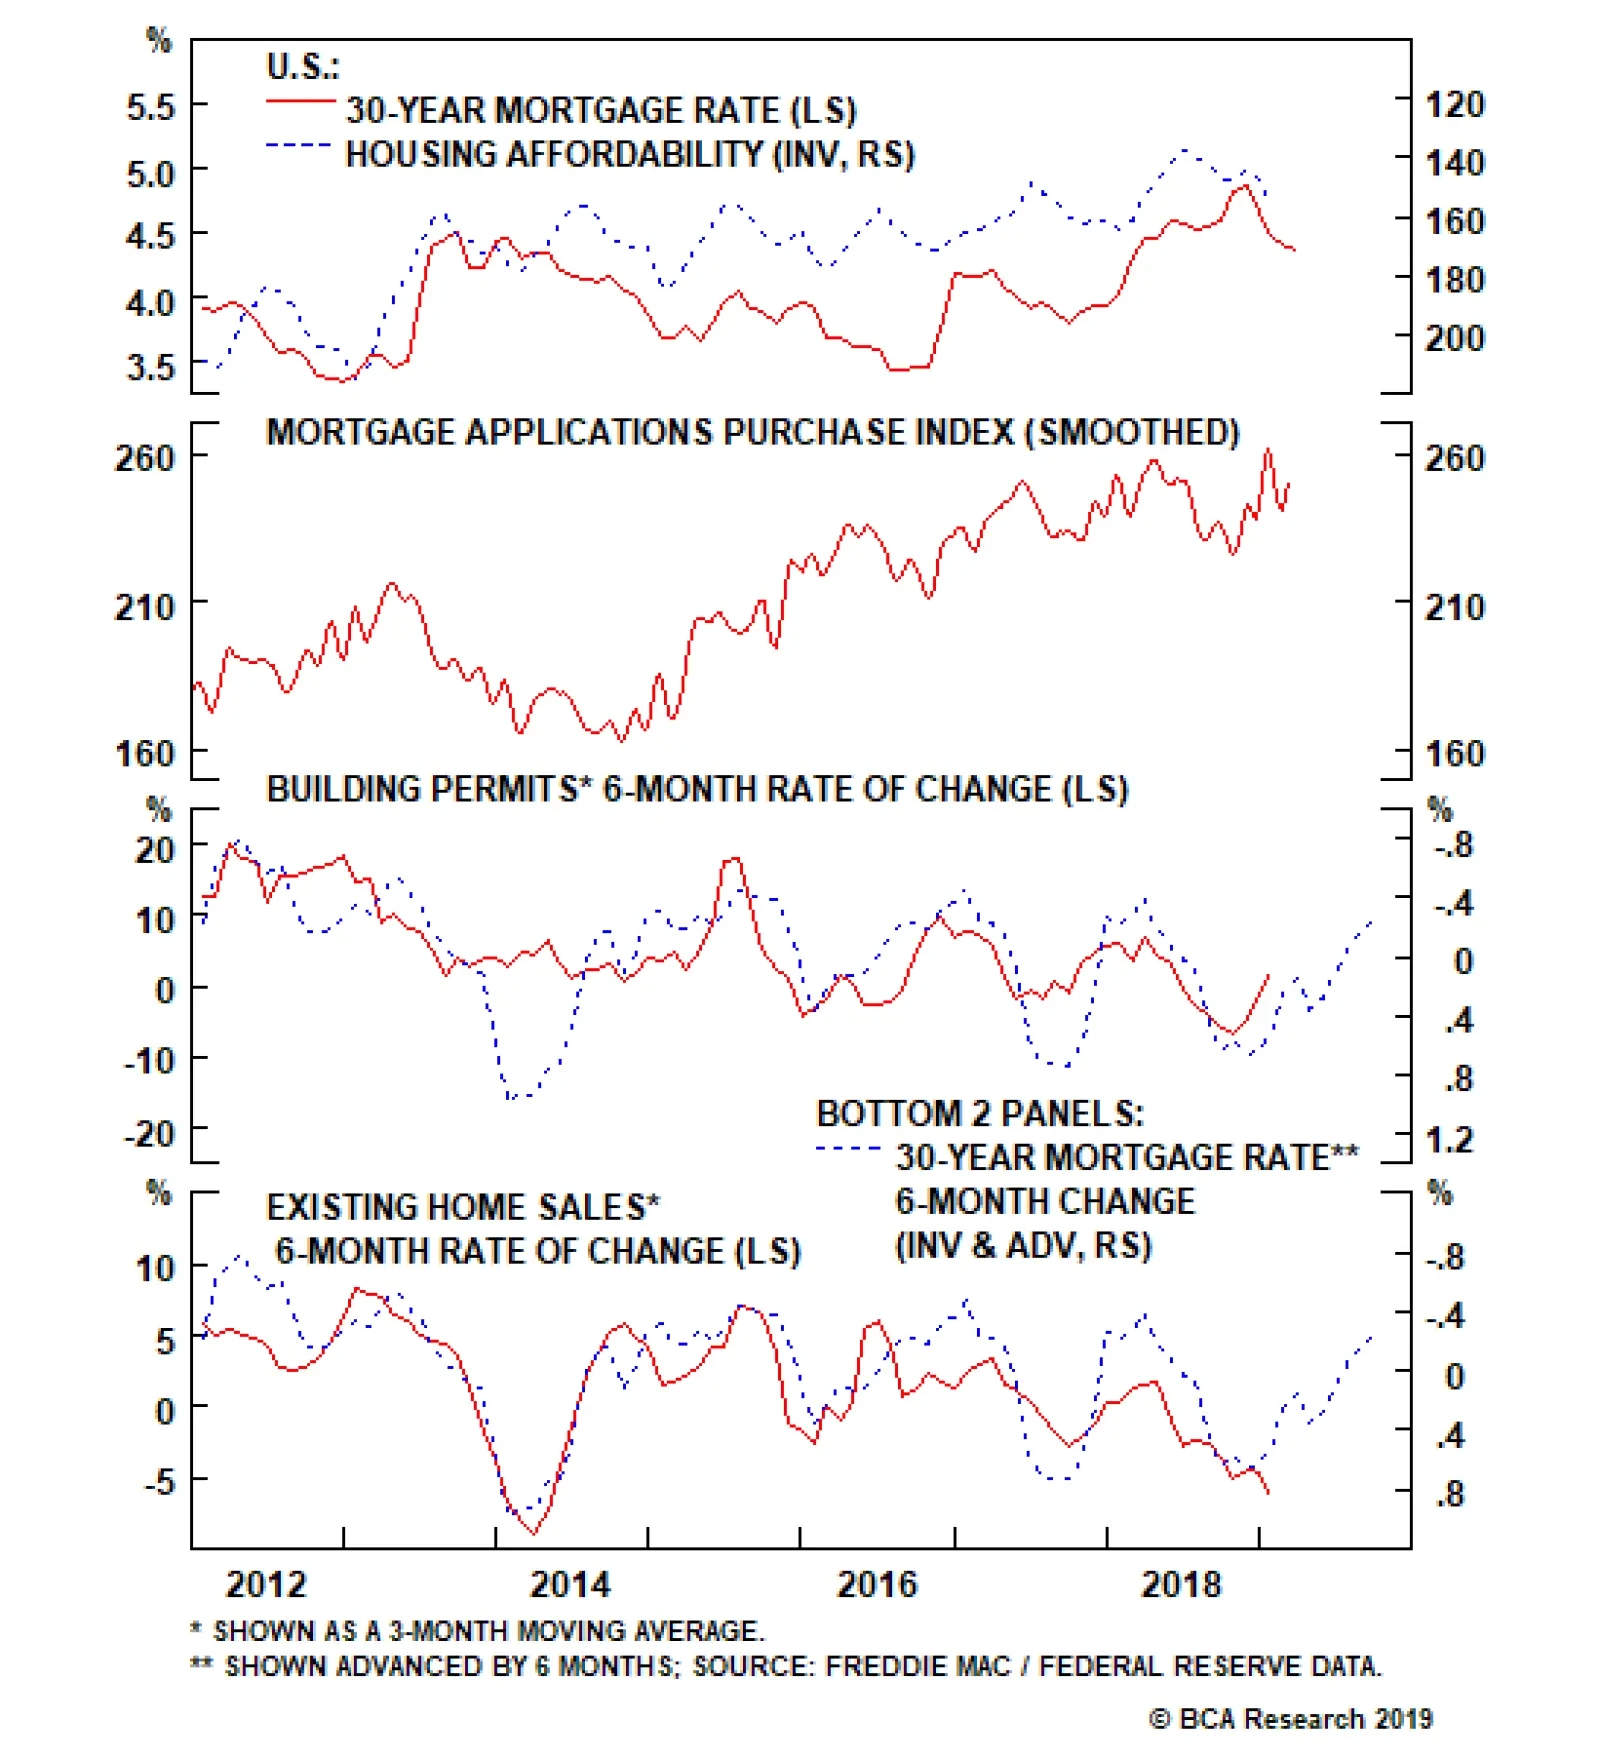
There is no sign that a change in the Fed’s monetary policy strategy, as it relates to price stability, is coming. The Fed performs a great deal of research and develops hypothetical game plans for a wide range of hypothetical economic outcomes. Discussions about price-level targeting are only conceptual for now, and the Fed will not necessarily adopt it. If price-level targeting were to become mainstream policy, it might better equip central banks with a tool for counteracting disinflationary impulses and could turn out to be marginally equity-friendly and bond-unfriendly. If it were to shift to a price-level-targeting framework, the Fed would be equally concerned about undershoots and overshoots. Housing Update We were unperturbed by the softness in the U.S. housing market when we published our housing Special Reports late last year. Three months into 2019, the data have supported our view, and we remain confident that the housing market does not represent the leading edge of an imminent downturn. We expect price-level targeting would increase financial-market volatility, at least when it’s first implemented. We highlighted in those Special Reports2 that the share of residential investment as a percentage of GDP has been steadily decreasing over the past 70 years, and is down to just 3% today. Although housing remains an important component of the U.S. economy and large fluctuations in the space will surely impact other segments of the economy, it is unlikely to exert a powerful drag. Home values also comprise a sizable portion of households’ net worth, and a decline in house prices will affect consumption patterns, but investors probably exaggerate the impacts. Housing now accounts for less than 15% of household equity – well below its 1980s and 2006 peaks – whereas pension entitlements and direct and indirect equity holdings account for 25% each. The rate at which mortgage rates change can exert a powerful impact on home sales and residential construction activity. 2018’s soft housing data was likely the byproduct of the yearlong rise in mortgage rates. Home sales and construction tend to decline in the six-month period after mortgage rates rise (Chart 4). Although higher mortgage rates took a toll on housing affordability last year, it remained at comfortable levels relative to history, and has already regained a good bit of ground now that the 30-year mortgage rate has declined by half a percentage point since its November peak. Mortgage applications have duly picked up since the end of last year. Chart 4Mortgage Rates Hurt Housing Last Year, But Are Poised To Help It This Year
Mortgage Rates Hurt Housing Last Year, But Are Poised To Help It This Year
Mortgage Rates Hurt Housing Last Year, But Are Poised To Help It This Year
Most importantly for the overall economy, there is no evidence of construction excess. In contrast to the decade preceding the crisis, there is still plenty of room for new supply as housing starts still lag the pace of new household formations. New-home inventories have increased, but only back to their pre-housing boom range, and they amount to no more than a fraction of existing-home inventories, which are bumping around 30-year lows (Chart 5). The aggregate supply of homes for sale is not at all a matter for concern. Chart 5Housing Inventory Levels Are Low
Housing Inventory Levels Are Low
Housing Inventory Levels Are Low
Bottom Line: The outlook for the housing market has improved since the end of the year. Homes remain affordable relative to history, and the aggregate inventory of homes for sale is the lowest it’s been since the mid-‘90s. The housing market still looks okay to us. Unemployment Is A Coincident Indicator We received a question from a client following last week’s review of our bond-upgrade and equity-downgrade checklists. Why do we include the three-month moving average of the unemployment rate in the equity checklist, but not our recession indicator? The simple answer is that the recession indicator is meant to be forward-looking.3 The unemployment measure has a sterling track record of coinciding with recessions, but it does not lead them (Chart 6). Chart 6A Coincident Indicator
A Coincident Indicator
A Coincident Indicator
The three components of our recession indicator – an inverted yield curve, year-over-year contraction in the Leading Economic Indicator (LEI), and an above-equilibrium fed funds rate – have all consistently preceded recessions (Table 2). When combined into a single indicator, they’ve done so an average of just over six months before the onset of recessions, in line with the S&P 500’s average peak. The unemployment rate has been a coincident indicator, sending its signal an average of just under a month after recessions begin (Table 3). Table 2Lead Times For Indicator Components And Bear Markets
Kinder, Gentler Central Banking
Kinder, Gentler Central Banking
Table 3Unemployment And Postwar Recessions
Kinder, Gentler Central Banking
Kinder, Gentler Central Banking
The unemployment rate’s three-month moving average has a perfect record of coinciding with recessions, but indicators have to lead to be included in our recession alarm system. Tacking on an extra month to account for the lag in the data release, the unemployment rate alerts an investor to a recession two months after it’s begun. That’s too late to help sidestep the brunt of the S&P 500’s bear-market declines, so we leave it out of our recession indicator. Unemployment’s recession signal is nonetheless a good bit more timely than the NBER’s official recession declaration, which has come an average of eight months after the start of the last five recessions. The three-month moving average of the unemployment rate provides reliable confirmation that recessions have begun, and that has earned it a place in our equity checklist. Doug Peta, CFA Chief U.S. Investment Strategist dougp@bcaresearch.com Jennifer Lacombe, Senior Analyst jenniferl@bcaresearch.com Footnotes 1 Please see the April 7, 2014 U.S. Investment Strategy Weekly Report, “Fed To America: We Care.” Available at usis.bcaresearch.com. 2 Please see the November 19, 2018 and December 3, 2018 U.S. Investment Strategy Special Reports, “Housing: Past, Present And (Near) Future,” and “Housing Seminar.” Available at usis.bcaresearch.com. 3 Please see the August 13, 2018 U.S. Investment Strategy Special Report, “How Much Longer Can the Bull Market Last?” Available at usis.bcaresearch.com.
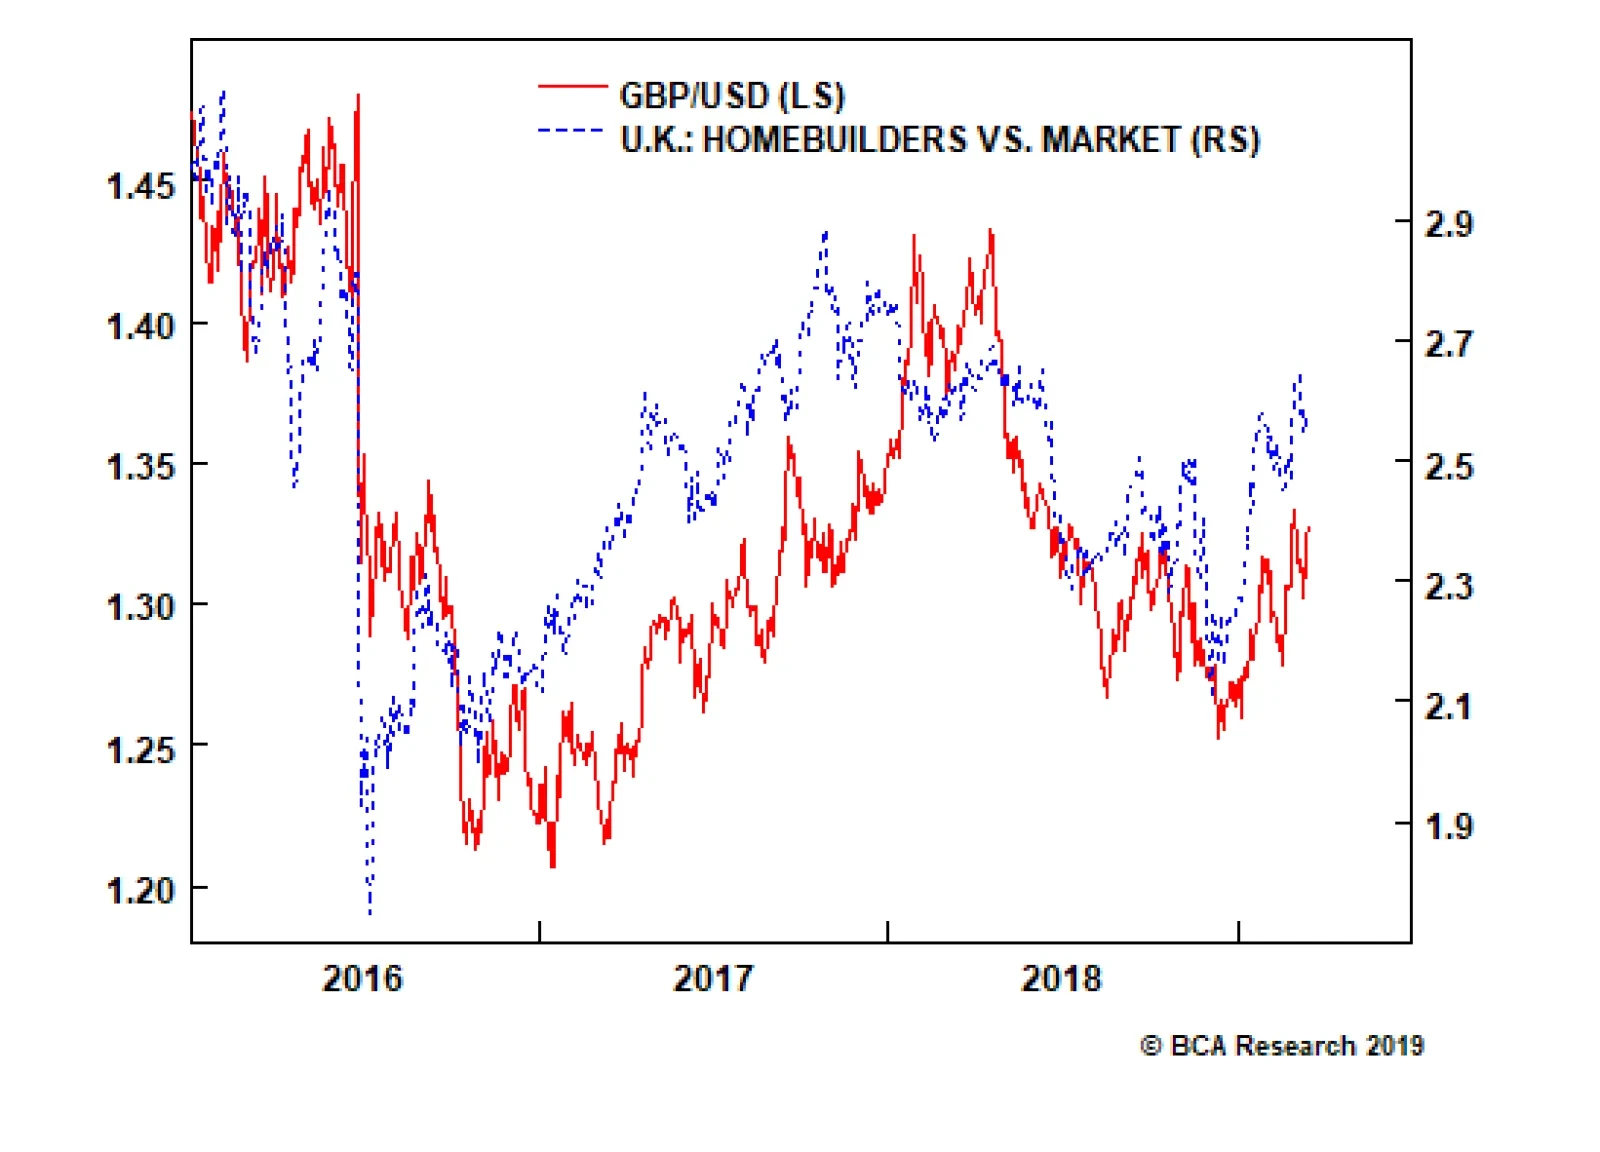
From the moment almost three years ago that the U.K. voted to leave the EU, it was clear that a rational and measured Brexit would require the U.K. to remain in a customs union with the EU. Rational and measured because a customs union would protect the…
Underweight In last month’s downgrade of the S&P pharma index to underweight, we highlighted that headwinds to drug prices would weigh on the sector’s earnings profile.1 This week’s CPI report confirmed this negative pricing view with prescription drugs falling into outright deflation; in fact industry pricing power is falling at its fastest rate in more than 15 years (second panel). Despite collapsing prices, pharma inventories have continued to climb which indicates that prices may have to fall further to clear out excess supply (third panel). The upshot is that, though they still trail the broad market by a wide margin, the recent uptick in both short- and long-term relative earnings estimates may be premature (bottom panel). Bottom Line: An increasingly difficult pricing environment means more downside lies in store for S&P pharma earnings estimates and, consequently, share prices; stay underweight. The ticker symbols for the stocks in this index are: BLBG: S5PHAR – JNJ, PFE, MRK, LLY, BMY, ZTS, AGN, MYL, NKTR, PRGO. Deflating Drug Prices Bode Ill For Pharma Profits
Deflating Drug Prices Bode Ill For Pharma Profits
Deflating Drug Prices Bode Ill For Pharma Profits
1 Please see BCA U.S. Equity Strategy Weekly Report, “ Reflating Away” dated February 19, 2019, available at uses.bcaresearch.com.