Sectors
This performance is due in large part to Boeing taking on the mantle of a global trade bellwether and also dominating our BCA aerospace index. Considering the global nature of the firm, this role seems appropriate. In the company’s order backlog, the…

Underweight The S&P hotels, resorts and cruise lines index has been trading sideways for the last several months. Weakness in the cruise lines half of the index has been offset by relative outperformance by hotels, specifically Hilton, who released better than expected Q4 results last month. The market cheered the results, despite the company trimming this year’s revenue per available room guidance. We think the lowered guidance bears scrutiny. Domestic capacity has been rapidly expanding for the past seven years and while pricing has been resilient for much of that time, it is likely only a matter of time before the pricing reacts to the dramatic supply increase, let alone the ongoing Airbnb threat (construction spending shown inverted and advanced, second panel); Hilton’s guidance appears to confirm this. Meanwhile, a tight labor market is driving a recovery in sector wages which will provide added pressure to margins if prices falter (third panel). All of this is captured by our earnings model which indicates earnings underperformance should persist (bottom panel). Bottom Line: Headwinds to hotel earnings should remove the remaining support for the S&P hotels, resorts and cruise lines index; stay underweight. The ticker symbols for the stocks in this index are: BLBG: S5HOTL - MAR, CCL, RCL, HLT, NCLH.
Hotel Earnings Headwinds Have Begun
Hotel Earnings Headwinds Have Begun
Earnings Are Increasing Thrust In Aerospace
…
Neutral In this week’s Special Report, we moved to a neutral recommendation on the BCA aerospace index. The report highlights the two pillars supporting the aerospace index and its relative performance: global trade sentiment and execution-driven profit performance. With respect to the first, relief in trade wars represents a powerful catalyst. Nevertheless, that same trade sentiment pendulum swings both ways and we believe elevated trade tensions will increase volatility and decrease predictability, particularly considering the global nature of aerospace firms (second panel). Still, aerospace sales and earnings growth look assured for a reasonable forecast horizon, considering the upbeat commercial aerospace demand over the past five years as well as the current robust order environment. However, aerospace firms have been blowing out their balance sheets to retire debt and currently enjoy near-record valuations (third & bottom panels). Bottom Line: On balance, we think it no longer pays to be underweight the BCA aerospace index and we moved to a benchmark allocation. Please see Monday’s Special Report for more details.
Aerospace - Spooling Up
Aerospace - Spooling Up
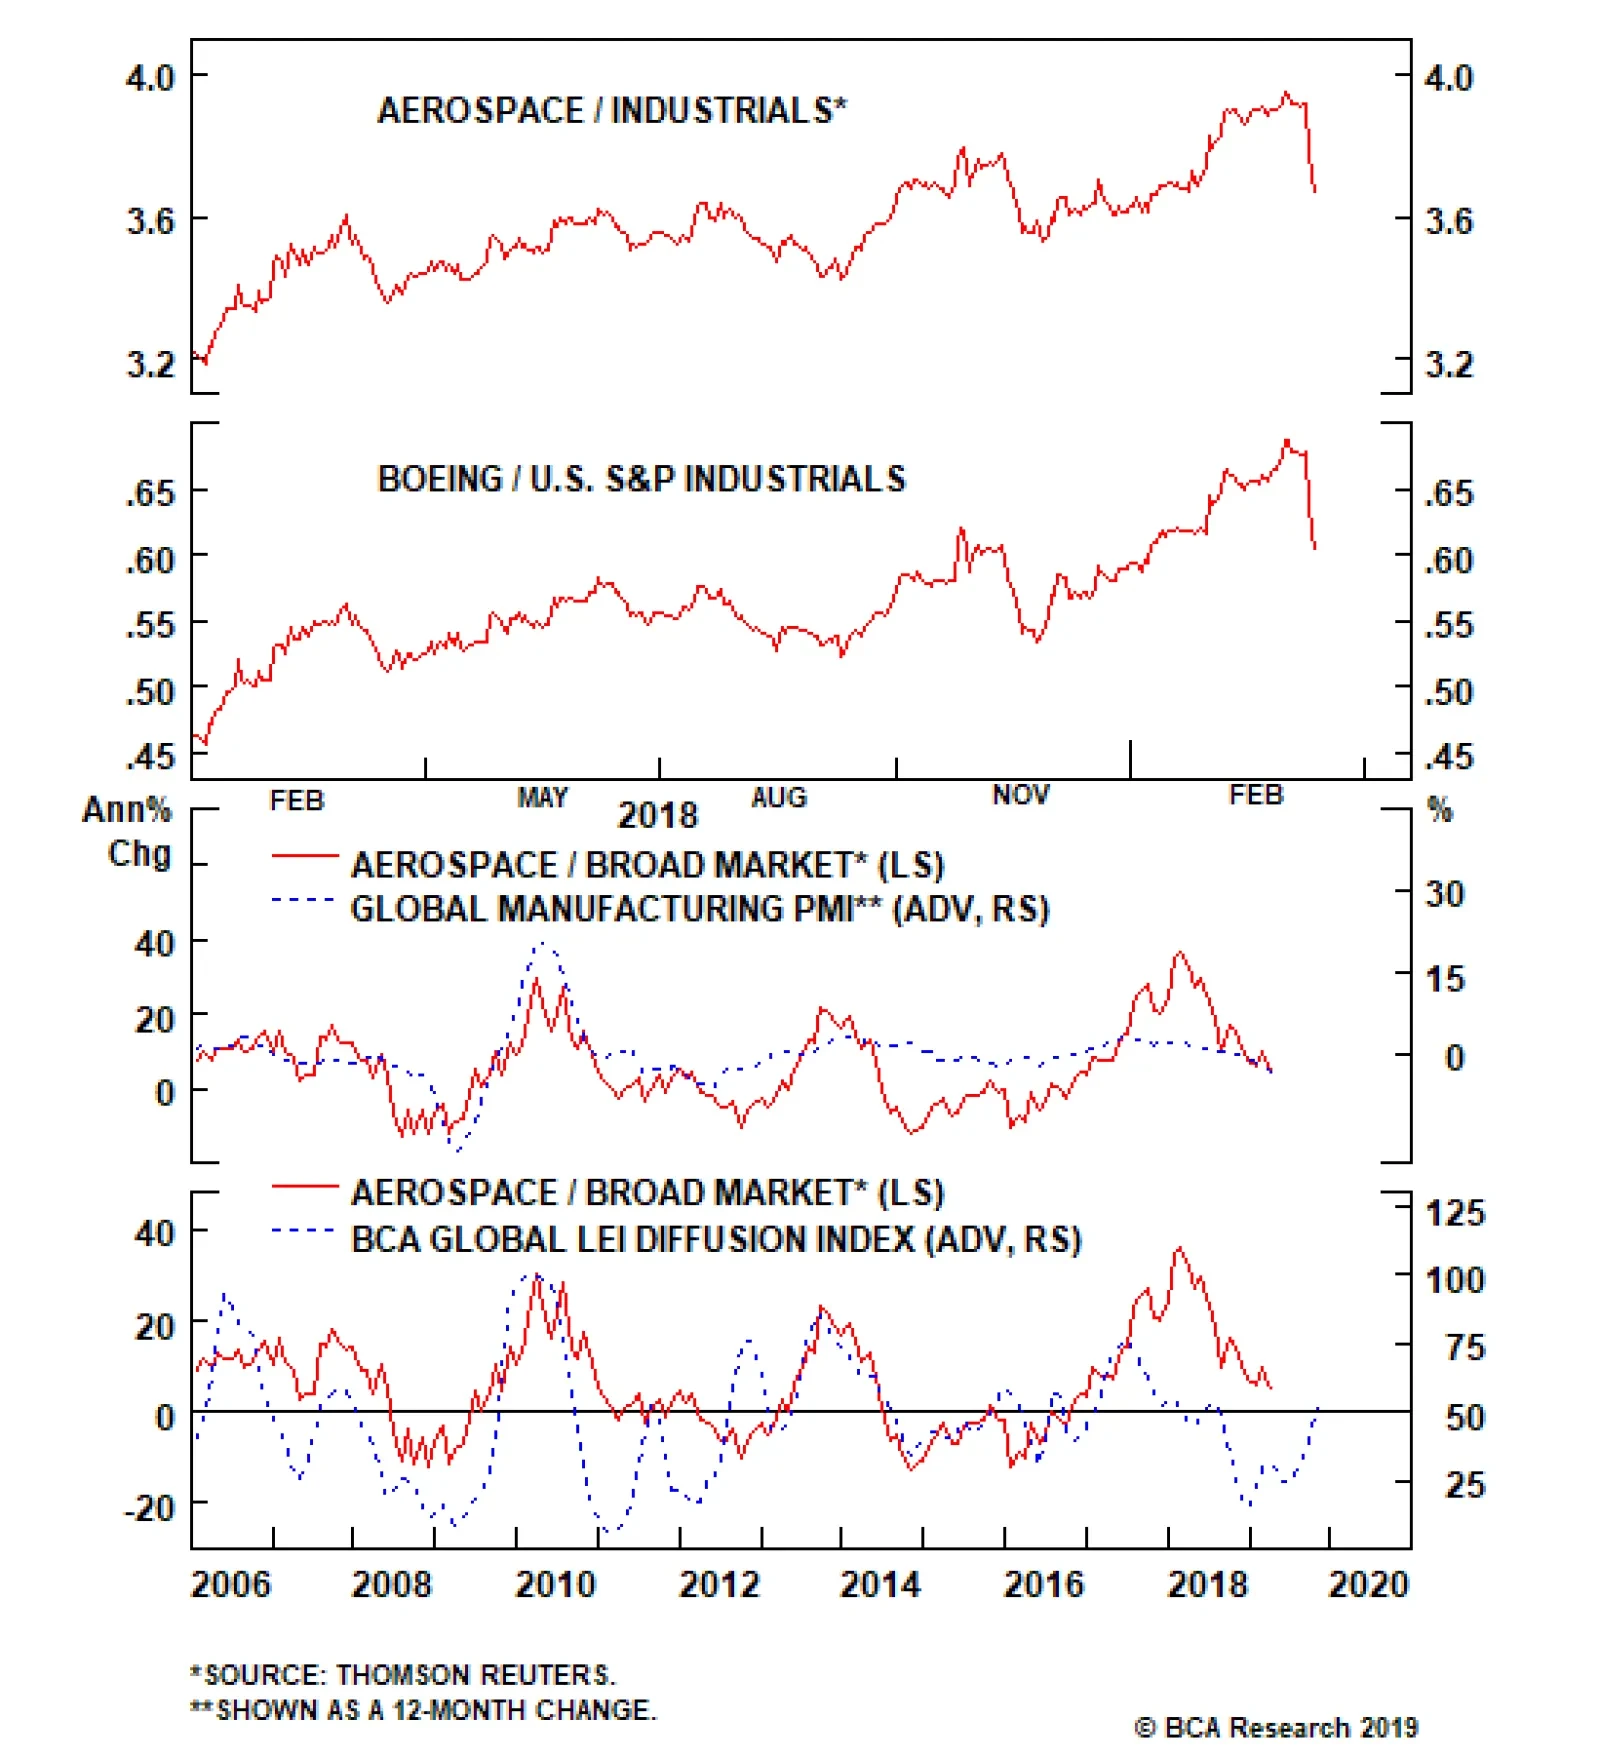
Feature It no longer pays to be underweight the BCA aerospace index considering the long profit growth runway and potential trade easing catalysts. Accordingly, we are moving to a benchmark allocation in this sector. There are two pillars supporting the BCA aerospace index and its relative performance: global trade sentiment and execution-driven profit performance. Despite a tangible easing in trade tensions between the U.S. and China, the global trade environment remains uncertain in the near term as economic weakness has permeated beyond U.S. shores and new trade issues seem likely to pop up (including potential tariffs on EU- or Japan-produced autos) to replace those being resolved. Aerospace profits are soaring to new heights and have been underpinning an aerospace bull market in 2019; a robust order environment suggests this may continue. However, a debt-fueled change in corporate capitalization and stratospheric valuations should keep investor expectations grounded. The Canary In The Coal Mine The ebb and flow of the trade dispute with China has been reflected partially in the relative performance of industrials1 in general (top panel, Chart 1), aerospace in particular (middle panel, Chart 1) and Boeing specifically (bottom panel, Chart 1). This is due in large part to Boeing taking on the mantle of a global trade bellwether and also dominating our index. Chart 1Aerospace Is Leading The Way
Aerospace Is Leading The Way
Aerospace Is Leading The Way
Considering the global nature of the firm, this role seems appropriate. Chart 2 shows the company’s order backlog by region; the domestic market represents only 25% of the next several years of production while all of the DM represents only 40%. The bulk of Boeing’s production backlog, and hence future revenues, are derived from the EM. Boeing is also particularly unique in that it has virtually no currency exposure as its products are invariably priced in U.S. dollars, as is the case with the bulk of U.S. aerospace firms.
Chart 2
Examining relative performance with global leading indicators provides some insight. The global manufacturing PMI shares an exceptionally tight directional relationship with aerospace’s relative performance (second panel, Chart 3). Though the current message is negative, BCA’s Global Leading Economic Indicator (GLEI) diffusion index has already started to recover (bottom panel, Chart 3), signaling that global growth is likely putting in a bottom and aerospace outperformance may resume anew. Chart 3Global Indicators Lead Relative Performance
Global Indicators Lead Relative Performance
Global Indicators Lead Relative Performance
Nevertheless, from a sentiment perspective, aerospace investors are focused squarely on weakness in the Chinese economy. On this front, we think there are three reasons to be modestly hopeful. First, negativity has been prominent in the media narrative (second panel, Chart 4) but this seems now fully priced in to the market. Second, China’s efforts to reflate the economy and the resulting rising odds of a soft landing is a boon to U.S. aerospace stocks (third panel, Chart 4). Lastly, as we have highlighted repeatedly in previous research, resolution of the trade spat between the U.S. and China would provide a significant catalyst for U.S. equities with particular emphasis on the trade-geared aerospace stocks. Chart 4Aerospace Is An EM Bellwether
Aerospace Is An EM Bellwether
Aerospace Is An EM Bellwether
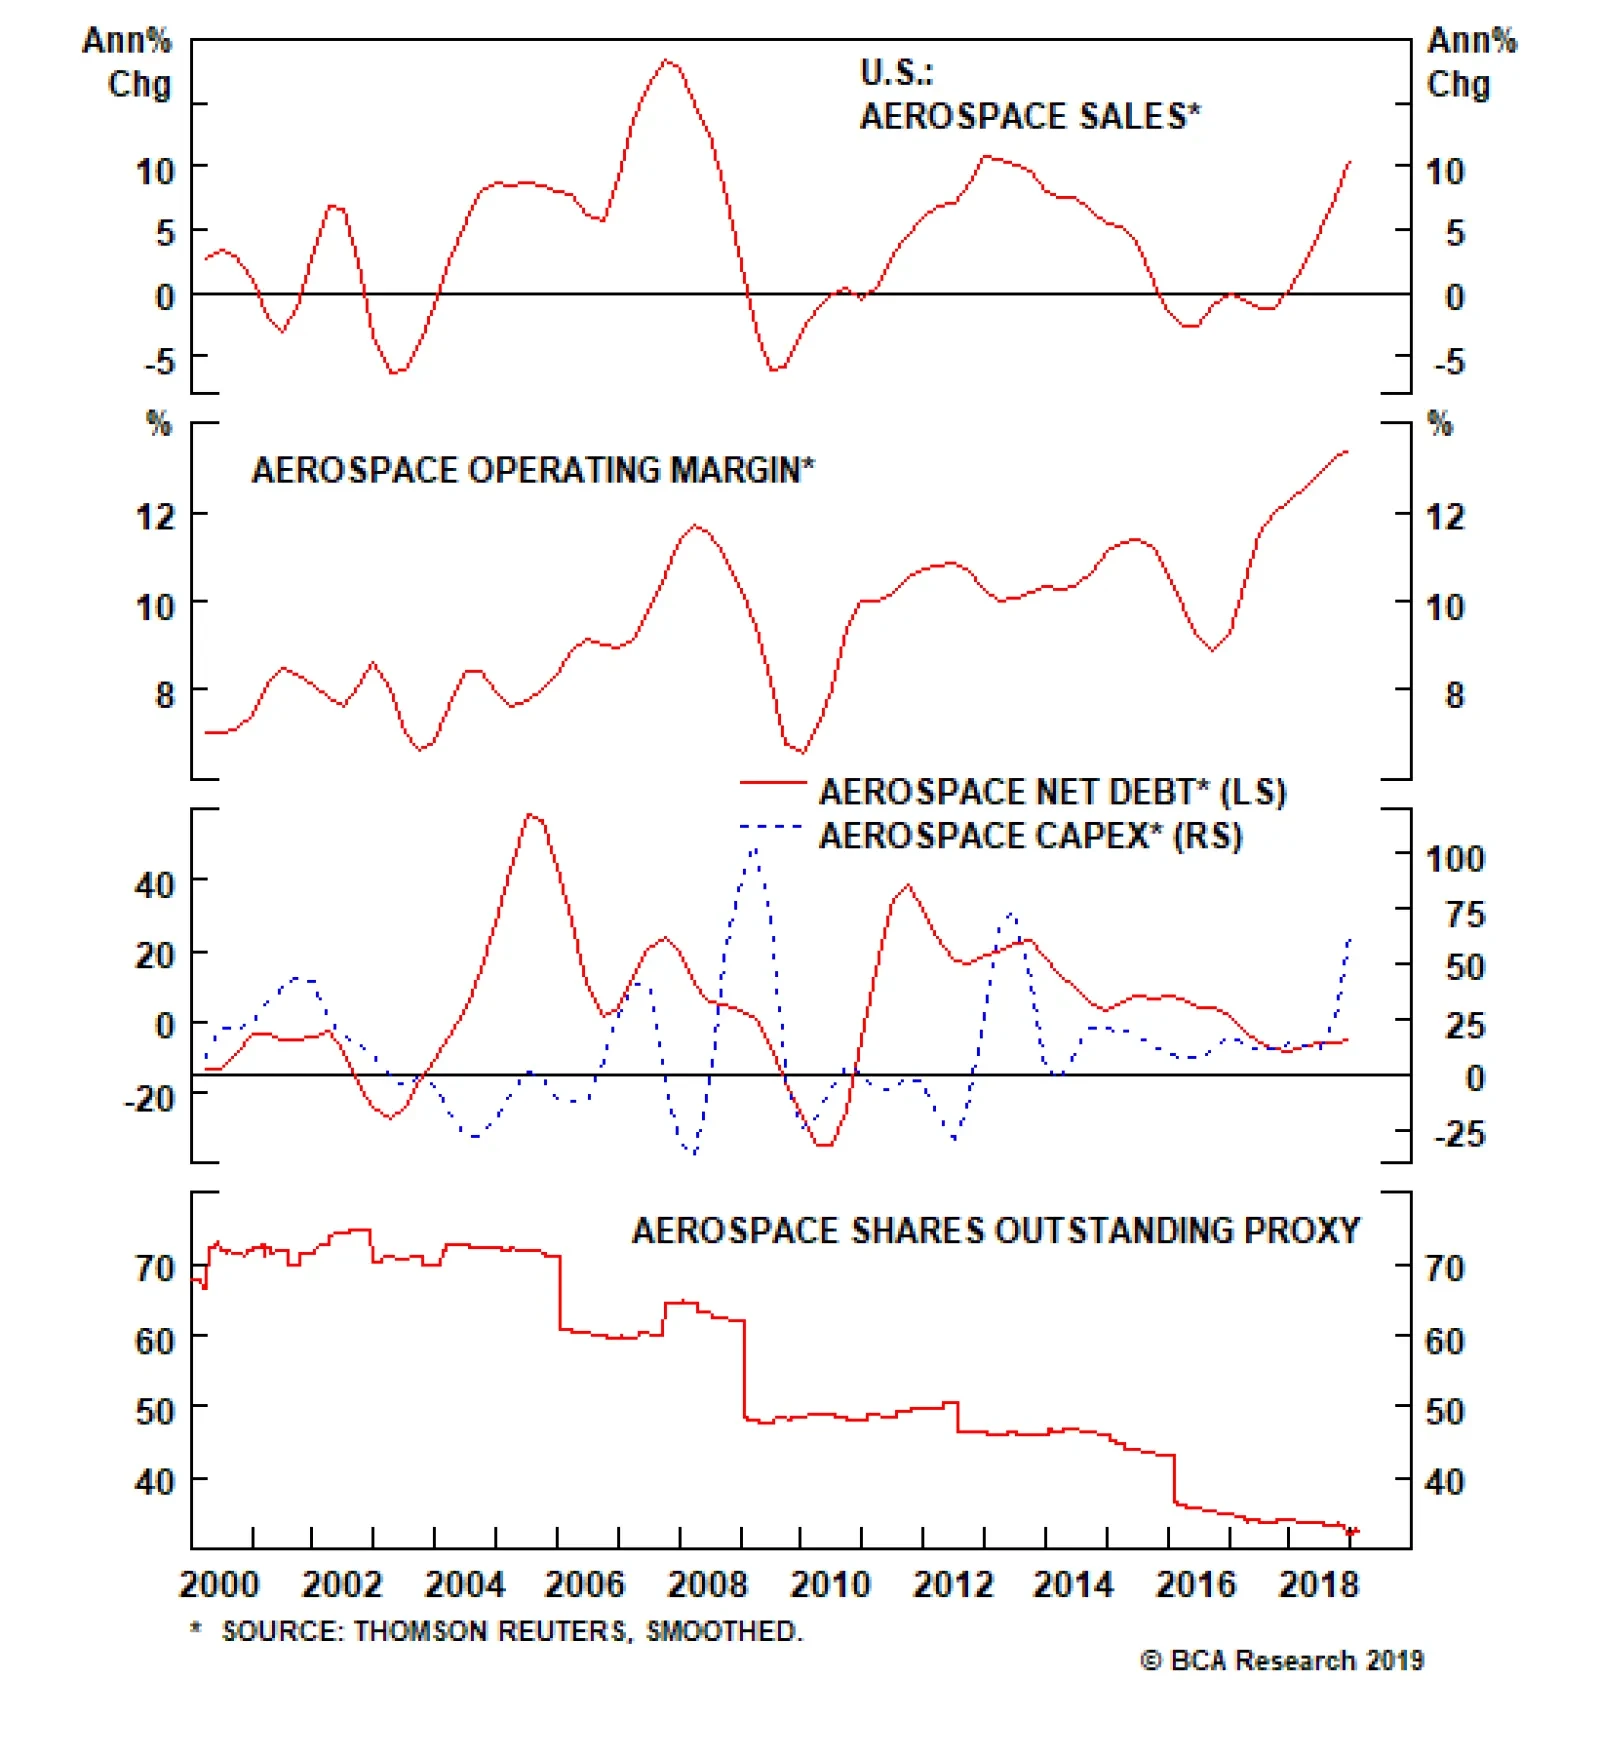
Net, though we remain optimistic for global trade, aerospace’s role as the wind vane for how trade winds are blowing should add both a greater degree of volatility and unpredictability to the index. Earnings Are Increasing Thrust In Aerospace Despite the above section, the reason why aerospace stocks went vertical at the end of January of this year was not easing trade relations. Rather, it was Boeing’s release of blowout earnings which was followed by earnings beats across the sector. Industry sales have pushed into double-digit growth territory (second panel, Chart 5) while margins are reaching into the stratosphere, hitting record levels (third panel, Chart 5). Chart 5Aerospace Margins At Record Highs
Aerospace Margins At Record Highs
Aerospace Margins At Record Highs
We think the reason why earnings are so elevated has much to do with the age of the order book. In Chart 6, we show Boeing’s order backlog and the years of production in backlog. Following a meltdown in 2008, Boeing’s backlog consistently represented between six and eight years of production. The implication is that the portion of the backlog currently being delivered was booked in the 2012 to 2014 period (circled in Chart 6) which happened to be the best order growth period in Boeing’s history and, in the context of this exceptionally powerful demand, likely built in particularly wide margins. This is compounded to the upside by being that much further along the production curve, particularly for some airliner programs that were troubled at the time, notably the 787 program.
Chart 6
Nevertheless, it stands to reason that the bookings added to backlog in the difficult period during and immediately post the GFC and the resulting weak margin performance of 2016-2017 has largely been worked through. Investors should now focus on the current margin profile as being the new status quo and current bookings as an indication of future earnings growth. Can Orders Sustain This Trajectory? New orders in aerospace are driven, as with all capex decisions, by growth and margin considerations. With respect to the latter, the obvious driver is jet fuel prices which are usually the largest cost line item in an airline’s P&L. In 2010, jet fuel prices spiked and stayed elevated for the next five years (jet fuel prices shown advanced by nine months, top panel, Chart 7). Global airlines responded by splurging on new orders to replace older, less efficient aircraft with more modern and highly efficient types. Chart 7Fare Growth & Input Costs Drive Orders
Fare Growth & Input Costs Drive Orders
Fare Growth & Input Costs Drive Orders
Though jet fuel prices are off the heights that spurred the extraordinary order growth in the early part of this decade, they are also above the lows of the energy price crash in 2015. If BCA’s bullish oil view comes to fruition, order flow should continue to be well supported by the refleeting theme. At the same time as fuel prices were spiking in 2010, DM consumer confidence was climbing out from beneath the recession (G7 consumer confidence shown advanced by one year, bottom panel Chart 7), giving airlines the demand push to add capacity to global fleets. The rapid increase in aerospace orders has been revealing itself in global airline capacity growth, which has been increasing by mid-single digits for the past six years (top panel, Chart 8). Interestingly, global load factors (the ratio of revenue-paying passengers to available seats, the airline industry measure of capacity utilization) have been rising despite this increase in capacity, implying global demand has been outstripping supply growth.
Chart 8
This data is echoed in the core domestic market where the load factor has plateaued at a record high level, approximating the global average (bottom panel, Chart 9), while capacity has grown mostly uninterrupted since the GFC. Chart 9Few Barriers To Domestic Capacity Expansion
Few Barriers To Domestic Capacity Expansion
Few Barriers To Domestic Capacity Expansion
In sum, we expect upbeat aerospace orders on the back of firming passenger demand driving capacity growth combined with the pursuit of ever more efficient aircraft to drive profits. However, given the long lead times, order growth should be used only as a guide; profit growth has driven relative performance (bottom panel, Chart 10) to a much greater degree than order growth (middle panel, Chart 10). Chart 10Earnings Drive Performance Over Orders
Earnings Drive Performance Over Orders
Earnings Drive Performance Over Orders
Changing Financial Structure And Costly Equities Notwithstanding the rapid increase in sales and, hence, production in the aerospace sector, capex has been in decline for the last couple of years (second panel, Chart 11). However, industry debt levels have been rapidly increasing (third panel, Chart 11), begging the question: where has the industry been deploying capital? Chart 11Debts Levels Are Rising...
Debts Levels Are Rising...
Debts Levels Are Rising...
The answer is in share buybacks. Our share count proxy (middle panel, Chart 12) shows that industry share counts have been roughly halved over the past decade, which partially underlies the outperformance of sector equities. In late-2018, Boeing announced a new $20 billion stock buyback plan, representing roughly 10% of its market capitalization, implying share buybacks in the aerospace sector are not fading anytime soon. Chart 12...As Share Counts Are Shrinking
...As Share Counts Are Shrinking
...As Share Counts Are Shrinking
At the same time, profit growth has not kept pace with the ramp up in leverage and leverage ratios have worsened to their highest point since the aviation crises of the early-2000’s (bottom panel, Chart 12). While still reasonable relative to the broad market, net debt / EBITDA has reached a level where further deterioration would likely add an incremental risk premium to aerospace stocks, denting valuations. With that in mind, valuations bear close examination. The exceptionally robust stock price run over the past two years and ballooning balance sheets has resulted in sector enterprise values skyrocketing (second panel, Chart 13). Relative to sector EBITDA, equities in the aerospace sector are as expensive as they have ever been (bottom panel, Chart 13). Chart 13Sky-High Valuations...
Sky-High Valuations...
Sky-High Valuations...
This message is echoed by our valuation and technical indicators (Chart 14) which indicate that aerospace stocks are at least one standard deviation overvalued and overbought, respectively. Chart 14...Across Multiple Measures
...Across Multiple Measures
...Across Multiple Measures
A Word On Defense Few of the stocks in our aerospace index are pure-play commercial aerospace investments. Rather, most of the companies rely, to a certain extent, on defense revenues either as a primary supplier of defense goods or as a part of defense production supply chains. Boeing, for example, averaged more than 20% of its revenues in the last three fiscal years from its defense segment. United Technologies, the next largest constituent firm, will likely generate an even greater proportion of its revenues from defense once its spinoff of its commercial & industrial businesses are complete, though at 14% of sales last year, defense is clearly a significant driver. Late last year we reiterated our secular overweight in the BCA defense index2 and we take this opportunity to do it again. We believe defense remains on a structural growth trajectory, driven by rising competition between the world's great nations, the decline of globalization and the resumption of a global arms race. Domestic defense spending has been rocketing higher since the Trump administration took the reins (second and third panels, Chart 15). Further, the non-partisan Congressional Budget Office projects this rapid buildup in defense spending to continue apace for the foreseeable future (bottom panel, Chart 15). With little political will to pare this growth from either side of the aisle, we see no reason to expect these estimates to falter. As such, our positive view on defense equities stands in support of our more sanguine view of their aerospace peers. Chart 15Defense Spending Is Accelerating
Defense Spending Is Accelerating
Defense Spending Is Accelerating
A Long Runway For Aerospace But Risks Are Elevated Overall, aerospace sales and earnings growth look assured for a reasonable forecast horizon, considering the upbeat commercial aerospace demand over the past five years as well as the current robust order environment. Add to this the powerful catalyst that relief in trade wars represent, at least from a sentiment perspective, and aerospace equities are on a solid footing. Nevertheless, that same trade sentiment pendulum swings both ways and we believe elevated trade tensions will increase volatility and decrease predictability. Further, aerospace firms have been blowing out their balance sheets to retire debt and currently enjoy record valuations. Net, we think it no longer pays to be underweight the BCA aerospace index and we are moving to a benchmark allocation. The ticker symbols for the stocks in the BCA aerospace index are: BA, UTX, HON, TXT. Chris Bowes, Associate Editor chrisb@bcaresearch.com Footnotes 1 Please see BCA U.S. Equity Strategy Weekly Report, “Reflationary Or Recessionary?,” dated February 25, 2018, available at uses.bcaresearch.com. 2 Please see BCA U.S. Equity Strategy Weekly Report, “Icarus Moment?,” dated October 22, 2018, available at uses.bcaresearch.com.
A Modest Gold Portfolio Hedge Still Makes Sense
A Modest Gold Portfolio Hedge Still Makes Sense
Overweight Within our broad-based U.S. equity sector and subsector coverage, we continue to recommend a modest gold-related hedge via being overweight the global gold mining index (given that the S&P gold index only comprises a single stock) versus the MSCI All-Country World Index, expressed through the long GDX:US/short ACWI:US exchange traded funds. Globally there is a slowdown that has infected a number of economies and BCA’s calculated Global ZEW economic sentiment index has lit a fire under gold mining stocks (Global ZEW shown inverted, second panel). The longer the global soft-patch lasts, the longer Central Banks will remain on the sidelines or even ease monetary policy in order to rekindle growth. Moreover, the global policy uncertainty index is perking up given the ongoing U.S./China trade tussle (top panel), recent news of a no deal between the U.S. and North Korea and looming Brexit deadline. All of this underpins global gold stocks. Tack on the recent fear that gripped markets, and skyrocketing equity risk premia, and the ingredients are in place for additional gains in the relative share price ratio (bottom panel). Bottom Line: Stay overweight the global gold miners index (long GDX:US/short ACWI:US); please see Monday’s Weekly Report for more details.
Highlights Analysis on Indonesia is available below. EM financial markets have diverged from the global growth indicators they have historically correlated with. This raises doubts about the sustainability of this rally. In China, broad bank credit has not accelerated at all, while non-bank credit growth rose sharply in January. The lack of recovery in broad bank credit growth is corroborated by lingering sluggishness in broad money growth. This refutes widespread perception in the global investment community that Chinese banks have re-opened the credit spigots again. Feature The headline news has all been positive for emerging markets over the past two months: The Federal Reserve is going on hold, China is stimulating its economy, the U.S. and China are nearing a trade agreement and risk-on market dynamics are permeating worldwide. Nevertheless, EM stocks have failed to outperform the global equity benchmark (Chart I-1, top panel). Notably, EM relative equity performance rolled over in late December when global share prices bottomed. Chart I-1EM Stocks Have Underperformed DM Ones Since Late December
EM Stocks Have Underperformed DM Ones Since Late December
EM Stocks Have Underperformed DM Ones Since Late December
In absolute terms, EM equities have been attempting to break above their 200-day moving average, but have so far failed to do so decisively (Chart I-1, bottom panel). When a market struggles to break out or outperform amid favorable news flows and buoyant investor sentiment, the odds are that it is facing formidable headwinds under the surface, and is at risk of relapsing. We sense EM currently fits this profile. Needless to say, investor consensus is very bullish on EM, and dominated by the above-mentioned narrative, specifically the Fed turning dovish and China stimulating, which is reminiscent of 2016 when EM staged a cyclical rally. Consequently, investors have rushed to pile into EM stocks and fixed-income. Chart I-2 illustrates that asset managers’ net holdings of EM ETF (EEM) futures have doubled since October 2018. Chart I-2Investor Consensus Is Very Bullish On EM
Investor Consensus Is Very Bullish On EM
Investor Consensus Is Very Bullish On EM
As of mid-February, EMs were by far the most overweight region within global equity portfolios, according to the most recent Bank of America/Merrill Lynch survey. The survey states that net 37% of global equity investors - who participated in the survey - were overweight EM. One of our clients that we met with on the road last week summed it up like this: “Investors have ‘recency bias’.” In other words, investors believe that 2019 will resemble 2016, and in turn have no appetite to bet against Chinese stimulus. We are in accord with this interpretation of investor behavior and the EM/China rally. Yet there are some noteworthy differences between today and 2016. First, in 2016, there was massive stimulus for China’s property market. At the time, the People’s Bank of China (PBoC) monetized the unsold housing stock in Tier-3 and -4 cities via its Pledged Supplementary Lending facility. At present, there is no stimulus for real estate. Second, by early 2016 EM profits had already contracted substantially. EM profits have yet to shrink in the current downtrend. Our thesis is that EM profits will contract this year for reasons we elaborated on in depth in our previous report, Mind The Time Gap. China’s credit and fiscal impulse leads EM/Chinese profits by about 12 months, and the recent improvement in this indicator, if sustained, suggests that a trough in EM/Chinese corporate earnings will only be reached in late 2019 (Chart I-3). Therefore, as EM profits shrink, investors will likely sell EM risk assets. Chart I-3EM Corporate Earnings Are Beginning To Contract
EM Corporate Earnings Are Beginning To Contract
EM Corporate Earnings Are Beginning To Contract
Altogether, these differences with 2016 make us reluctant to chase the current EM rally, and we continue to expect a meaningful reversal in EM risk assets in the months ahead. Monitoring Global Growth We maintain that EM is much more leveraged to global trade and China’s growth than to Fed policy. For a detailed discussion on this matter, please refer to EM: A Replay of 2016 or 2001? report from February 7, 2019. Therefore, the Fed’s dovish turn is not a sufficient reason to buy EM risk assets. To buy EM cyclically, we would need to change our outlook on global trade and Chinese imports. China influences the rest of the world via its imports. A closer look at the indicators that correlate with EM risk assets and commodities do not justify the recent EM rebound. In particular: The import sub-component of China’s NBS manufacturing PMI strongly correlates with EM share prices, excess returns in EM sovereign credit, and industrial metals prices and suggest that investors should fade this rebound (Chart I-4). Chart I-4EM Stocks, EM Credit Markets, As Well As Commodities Prices Are Driven By Chinese Imports
EM Stocks, EM Credit Markets, As Well As Commodities Prices Are Driven By Chinese Imports
EM Stocks, EM Credit Markets, As Well As Commodities Prices Are Driven By Chinese Imports
The Caixin manufacturing PMI for China was up in February, but the NBS manufacturing PMI fell. In turn, manufacturing PMI indexes in Korea, Taiwan, Japan and Singapore are all plunging, with several of them dropping well below the 50 boom-bust mark (Chart I-5). Chart I-5Asian Manufacturing Is Contracting
Asian Manufacturing Is Contracting
Asian Manufacturing Is Contracting
Korean, Taiwanese, Japanese and Singaporean shipments to China were shrinking in January, while their exports to the U.S. were resilient (Chart I-6). This confirms that global trade has been weak due to China, and that there are no signs of its reversal. Chart I-6Asian Exports To China And U.S.
Asian Exports To China And U.S
Asian Exports To China And U.S
Moreover, Korea released its February export data, and its aggregate outbound shipments are contracting (Chart I-7). Chart I-7Korean Exports: Deepening Contraction
Korean Exports: Deepening Contraction
Korean Exports: Deepening Contraction
Further, China’s container freight index – the price to ship containers – has rolled over again after picking-up late last year due to front-loading of shipments to the U.S. which were induced by the U.S. import tariffs. This signals ongoing weakness in global demand, and does not justify the latest rebound in EM financial markets in general and currencies in particular (Chart I-8). Chart I-8Global Trade Is A Risk To EM Currencies
Global Trade Is A Risk To EM Currencies
Global Trade Is A Risk To EM Currencies
Finally, even in the U.S. where manufacturing has been the most resilient globally, the odds point to notable weakness in this sector. Specifically, the continuous underperformance of U.S. high-beta industrial stocks to U.S. overall industrials beckons a further slowdown in American manufacturing (Chart I-9). Chart I-9U.S. Manufacturing Is In A Soft Spot
U.S. Manufacturing Is In A Soft Spot
U.S. Manufacturing Is In A Soft Spot
Bottom Line: Although financial markets are forward-looking, the recent rally has been too fast and has already gone too far. This has created conditions for a material setback as global/China growth will continue to disappoint in the months ahead. China: Credit Versus Money Growth We have been receiving questions from clients as to whether investors should heed to the message from China’s money or credit data, given they are presently sending contradictory messages (Chart I-10). Chart I-10China: Narrow, Broad Money, And Aggregate Credit
China: Narrow, Broad Money, And Aggregate Credit
China: Narrow, Broad Money, And Aggregate Credit
Even though narrow money (M1) has historically been an excellent indicator for China/EM business cycles, the most recent (January) print – M1 annual growth rate registered a record low – was distorted due to technical/seasonal factors, and should be ignored. Specifically, deposits by enterprises plunged in January and household deposits surged as companies paid out bonuses to employees in late January ahead of the Chinese New Year that began on February 5 (Chart I-11). Provided enterprise demand deposits are in M1 but household demand deposits are a part of M2, M1 was artificially depressed in January. It will rebound in February. Chart I-11China: Technical Reasons For M1 Plunge In January
China: Technical Reasons For M1 Plunge In January
China: Technical Reasons For M1 Plunge In January
Broad money provides a more comprehensive picture of money creation in China. As such, it is more relevant to compare broad money with aggregate credit. To compute aggregate credit, we add outstanding central and local government bonds to Total Social Financing (TSF). Chart I-12 illustrates the latest improvement in aggregate credit is not confirmed by either the PBoC’s broad money measure, M2, or our measure, M3 (M3 = M2 plus other deposits plus banks’ other liabilities excluding bonds). We created this M3 measure of broad money supply because in our opinion, M2 has been underestimating the extent of money creation in China in recent years due to financial engineering. Chart I-12The Recent Uptick In Aggregate Credit Is Not Confirmed By Broad Money
The Recent Uptick In Aggregate Credit Is Not Confirmed By Broad Money
The Recent Uptick In Aggregate Credit Is Not Confirmed By Broad Money
As discussed in Box I-1 on pages 12-13, lending or purchasing of securities by banks simultaneously creates money. Therefore, bank broad credit acceleration should be mirrored in a broad money upturn. Does the lack of revival in broad money mean the latest uptick in aggregate credit data has been driven by non-bank credit? Our analysis suggests yes – non-bank credit is responsible for the strong rise in the aggregate credit numbers in January. We deconstructed aggregate credit into broad bank credit and non-bank credit (Diagram I-1). Chart I-13 illustrates that broad bank credit has not accelerated at all, while non-bank credit growth rose in January.
Chart I-
Chart I-13China: Recent Credit Acceleration Is Due To Non-Bank Credit
China: Recent Credit Acceleration Is Due To Non-Bank Credit
China: Recent Credit Acceleration Is Due To Non-Bank Credit
The lack of recovery in broad bank credit growth is corroborated by lingering sluggishness in broad money (both M2 and M3) growth (Chart I-14). Chart I-14Broad Bank Credit Is Consistent With Broad Money (As It Should Be)
Broad Bank Credit Is Consistent With Broad Money (As It Should Be)
Broad Bank Credit Is Consistent With Broad Money (As It Should Be)
Consequently, this refutes the widespread perception in the global investment community that Chinese banks have re-opened the credit spigots. Chart I-15demonstrates the annual growth rate of each component of broad bank credit. While mainland banks’ loan growth to enterprises has accelerated, their lending to non-bank financial institutions has continued to shrink. Chart I-15Broad Bank Credit And Its Components
Broad Bank Credit And Its Components
Broad Bank Credit And Its Components
In sum, broad bank credit and broad money have not revived, and their impulses are rolling over, having failed to break above zero (Chart I-14, bottom panel). Bottom Line: The improvement in aggregate credit growth in January was due to credit provided/bonds purchased by non-banks rather than by banks. This does not tell us whether the credit growth acceleration is sustainable. For a more detailed discussion on the differences between money and credit, please refer to Box I-1 on page 12-13. Investors prefer simple narratives, and have readily embraced the story that China has opened up the credit faucets. Broad bank credit data and broad money supply data do not corroborate this thesis. It may change in the months ahead, but our point is that for the moment there is not yet a simple narrative about China’s credit cycle. Investment Implications Even though China’s aggregate credit impulse ticked up in January, the 2011-‘12 and 2015-‘16 episodes signify that its bottoming can last many months. Critically, EM financial markets have historically lagged turning points in the aggregate credit impulse. These time lags have been anywhere between three to 18 months over the past 10 years. Furthermore, in 2012 there was only a minor rebound in EM share prices – not a cyclical rally – in response to the significant rise in China’s aggregate credit impulse (Chart I-16, top panel). Chart I-16Beware Of The Time Lag
Beware Of The Time Lag
Beware Of The Time Lag
Hence, even if January marked the bottom in the aggregate credit impulse – which is plausible in our opinion – EM risk assets will remain at risk based on historical time lags between the aggregate credit impulse and China-related financial markets.1 BOX 1 Why And When Money Supply Differs From Credit The following elaborates on the key differences between broad money supply and aggregate credit. 1. Why and when do broad money and credit diverge? When commercial banks provide loans to or buy bonds (or any other asset) from non-banks, they simultaneously create new money supply/deposits. Broad money supply is the sum of all deposits in the banking system, which is why we use the terms money and deposits interchangeably. When non-bank financial institutions – in China's case financial trust and investment corporations, financial leasing companies, auto-financing companies and loan companies – as well as enterprises and households make loans or buy bonds, they do not create money. Hence, money supply/deposits is mostly equal to net cumulative broad bank credit creation. The difference between aggregate credit and money supply is due to lending activities of non-bank entities (see Diagram I-1 on page 9). Lending, purchasing of bonds, or any other forms of financing by non-bank entities does not change money supply. Thus, aggregate credit is more relevant than money supply to forecast business cycle fluctuations. Apart from the fact that banks still play a very large role in aggregate financing in China, there are a few other reasons why one should not ignore broad money and rely solely on aggregate credit: Banks can extend credit, but might choose not to classify it as loans on their balance sheet for regulatory reasons. Chinese banks did this in the past by booking loans as non-standard credit assets. In any case, when a bank lends to a non-bank it creates new deposits/money, and it is hard to conceal deposits/liabilities. In these cases, broad money supply gives a better signal about the true extent of credit growth than statistics on loans. If under regulatory pressures banks reclassify their non-standard credit assets as loans, the amount of loans will expand, even though no new lending occurs. Yet, money supply/deposits will not change. In this case, loan numbers will give a false signal and money supply will be a better indicator for new credit origination by banks and, thereby, for economic activity. The true measure of Chinese bank loans and credit data were probably disguised over the past several years because banks and non-bank financial institutions were involved in financial engineering. However, in the past two years, the regulatory clampdown forced Chinese commercial banks to unwind some of these structures and properly reclassify items on their balance sheets. Both the masking of credit assets and the ensuing reclassification could have distorted loan and credit data. This is why we use broad money supply as a litmus test to gauge banks’ broad credit origination. Given TSF includes bank loans but does not include banks’ non-standard credit assets, we believe TSF understates the amount of credit in the economy. As a result, we have not been able to calculate an accurate aggregate level of non-bank credit. Only since mid-2017, when under the regulatory clampdown, banks have stopped classifying loans as non-standard credit assets, can the annual growth rate of TSF serve as a meaningful statistic. Hence, we estimate the annual growth rate of non-bank credit only starting in 2018 (please refer to Chart I-13 on page 9). 2. Does the central bank (PBoC) create money by injecting liquidity into the system? Barring lending to or buying assets from non-banks – which does not typically occur outside of quantitative easing (QE) programs – central banks do not create broad money or deposits. Central banks create banking system reserves, which are not part of the broad money supply in any country. Money supply/deposits, the ultimate purchasing power for economic agents, is created solely by commercial banks “out of thin air,” as we have discussed and illustrated in our series of reports on money, credit and savings. 3. Why do we use impulses (second derivatives of money/credit) rather than growth rates? Our goal is to forecast a change in economic activity/capital spending/imports/enterprise revenues – i.e., a change in flow variables. Money and credit are stock variables. Therefore, a change (the first derivative) in outstanding money and credit produces flow variables. The latter measures new credit and money origination in a given period. These are comparable with flow variables like spending, income and profits. To gauge changes in flow variables, i.e., the growth rate of spending, one needs to calculate a change in new money and credit origination – i.e., change in their net flow. In brief, to do an apples-to-apples comparison, one needs to use the second derivative (a change in change) in money and credit – i.e., changes in their flows – to predict changes in flow variables such as GDP/capital spending/imports/enterprise revenues. Arthur Budaghyan, Senior Vice President Emerging Markets Strategy arthurb@bcaresearch.com Lin Xiang, Research Analyst linx@bcaresearch.com Indonesia: It Is Not All About The Fed Indonesian stocks have outperformed their emerging market peers significantly in the past few months as the Federal Reserve has turned dovish and U.S. rate expectations have declined. Although U.S. bond yields do strongly and inversely correlate with Indonesian stocks’ relative performance versus the EM equity benchmark (Chart II-1, top panel), we believe there are other factors – such as Chinese growth and commodities prices – that are also important to this market (Chart II-1, bottom panel). Chart II-1Indonesian Stocks: The Fed Versus Commodities
Indonesian Stocks: The Fed Versus Commodities
Indonesian Stocks: The Fed Versus Commodities
In the next several months, slowing Chinese growth, lower commodities prices, and a renewed sell-off in EM markets will take a toll on Indonesian financial markets. Indonesian exports are contracting which will intensify as commodities prices fall and China’s purchases of coal and base metals drop (Chart II-2, top panel). Chart II-2Indonesia: Exports Are Shrinking
Indonesia: Exports Are Plunging
Indonesia: Exports Are Plunging
Indonesia’s current account deficit is already large and will continue widening as the export contraction deepens (Chart II-2, bottom panel). Remarkably, the nation’s commercial banks have been encouraged to keep the credit taps open as the central bank – Bank Indonesia (BI) – has been injecting enormous amounts of liquidity (excess reserves) into the banking system (Chart II-3, top panel). Given these liquidity injections, bank credit and domestic demand growth have remained more resilient than would otherwise have been the case. Chart II-3The Central Bank Is Injecting Liquidity
Indonesia's Central Bank Is Injecting Liquidity
Indonesia's Central Bank Is Injecting Liquidity
Yet, by injecting such enormous amounts of excess reserves into the system, the central bank has more than negated its previous liquidity tightening, resulting from the sales of its foreign exchange reserves in order to defend the rupiah (Chart II-3, bottom panel). The implications of such policy are that these excess reserves could encourage speculation against the rupiah, especially amid weakening global growth and falling commodities prices. Provided foreigners own large portions of Indonesian stocks and local-currency government bonds, a depreciation in the rupiah will produce a renewed selloff in the nation’s financial markets. A final point on Indonesian commercial banks: their net interest margins have been narrowing sharply (Chart II-4, top panel). Chart II-4Commercial Banks' Profits Will Weaken
Commercial Banks' Profits Will Weaken
Commercial Banks' Profits Will Weaken
Moreover, as global growth slows, non-performing loans (NPLs) on the balance sheets of Indonesian banks will rise. In turn, provisioning for bad loans will also increase, and bank earnings will decline (Chart II-4, bottom panel). These dynamics will be bearish for Indonesian commercial banks, which account for 44% of the overall MSCI Indonesia index. Bottom Line: Continue avoiding/underweighting Indonesian stocks and fixed-income markets. We continue shorting the IDR versus the U.S. dollar. Ayman Kawtharani, Associate Editor ayman@bcaresearch.com Footnotes 1 Please note that this represents the Emerging Markets Strategy team’s view and is different from BCA’s house view on global risk assets and global growth. The key point of contention is the outlook for China’s growth. Equity Recommendations Fixed-Income, Credit And Currency Recommendations
Dear Client, I am travelling this week so this report is a joint effort juxtaposing two contrasting observations about France. The ‘opulence’ part highlights France as the world’s dominant producer of luxury goods, and makes the case that some of the French luxury goods companies should form a core part of a long-term investment portfolio. The ‘rebellion’ part borrows from a recent Special Report on French politics penned by my colleague Jeremie Peloso. It analyses the recent yellow vest protests in France, and assesses whether they are a cause for concern. Best regards, Dhaval Joshi, Chief European Investment Strategist Feature Opulence Made In France
Chart I-1
Global luxury goods sales amount to a quarter of a trillion dollars, and Europe dominates in the production of these luxury goods. Measured by the number of companies, the leading luxury goods country is Italy. But on the more important metric of share of total global sales, the undisputed world leader is France. In fact, just four French companies produce a quarter of the world’s luxury goods sales. The four are: LVMH, Kering, L’Oreal, and Hermes1 (Chart of the Week, Chart I-2, and Table I-1).
Chart I-2
Chart I-
France’s luxury goods sector is an excellent diversifier for investors. This is because, compared to other goods and services, luxuries follow very different laws of economics: The demand for luxuries has a positive elasticity to price. Put more simply, the desirability of a luxury increases as its price goes up. This is opposite to the demand for non-luxuries which has a negative elasticity to price: for non-luxury items, the demand declines as the price goes up. By definition, you cannot compete with a luxury item by undercutting its price. Given that a luxury implies fine-craftsmanship rather than mass production, the sector is highly resilient to the existential threats confronting other European industries that emanate from out-sourcing to lower cost economies and from automation. Luxury demand is also relatively insensitive to exchange rate movements. The barrier to entry into the luxuries sector is extremely high. It takes years, or even decades, for a luxury item to acquire its premium status based on consistent high quality in materials and craftsmanship. This high barrier to entry makes it much harder for other economies to challenge the European and French dominance in providing these luxury products. Despite these attractive characteristics the sector does still require a source of structural demand. Our premise, expounded in our Special Report “Buying European Clothes: An Investment Megatrend”, is that the feminisation of consumer spending, particularly in Europe, is providing a strong structural tailwind to the demand for ‘soft’ luxury goods. A recent industry study by Deloitte corroborates this thesis, pointing out that the strongest growth in the luxury sector is to be found in cosmetics, fragrances, bags and accessories. On this premise, the four leading French companies are big beneficiaries.2,3 Are market valuations already aware of, and fully discounting, the thesis of feminisation of consumer spending? We think not, as most investors are surprised by the thesis and unaware of the on-going dynamics behind it. On this basis, three of the four French luxury companies, trading on forward PE multiples in the 20s or below, still appear reasonably valued for their growth prospects (Table I-2). The exception is Hermes which, on a multiple of 40, does seem richly priced.
Chart I-
The bottom line is that the three other leading French luxury goods companies – LVMH, Kering, and L’Oreal – do deserve to be a core part of a long-term investment portfolio. Rebellion Made In France The yellow vest protest movement is not a coherent force led by a clear leadership. What started on the social media as a protest against the fuel tax in rural areas has evolved into a movement against President Macron. This transition occurred in part because a large segment of the population believes that Macron’s reforms have mainly benefited the wealthy. 77 percent of respondents in a recent poll view him as the “president of the rich.” The modification of the ‘wealth tax’ – which mostly shifts the focus toward real estate assets instead of financial assets – was highly criticized for favouring the wealthiest households. It resonated strongly with the perception that past governments helped the wealthiest households to accumulate more wealth on the back of the middle class. But it is not clear how intense or durable this popular sentiment will be, given that this type of inequality is not extreme in France and has not been rising (Chart I-3). Chart I-3What Income Inequality?
What Income Inequality?
What Income Inequality?
Public support for the protests has hovered consistently around 70 percent since they started in November 2018 (Chart I-4). However, there are now more respondents who think that the protests should stop as that they should continue (Chart I-5). As a sign of things to come, a demonstration against the yellow vests and in support of Macron and his government – held by the “red scarves” – managed to gather more people on the streets of Paris than the regionally based yellow vests have done in the capital city.4
Chart I-4
Chart I-5
Who are the yellow vests? They are mostly rural, mostly hold a high school degree (or less), and overwhelmingly support anti-establishment political leaders Marine Le Pen (right-wing leader of the National Rally) or Jean-Luc Mélenchon (left-wing leader of La France Insoumise). This suggests that the movement has failed to cross the ideological aisle and win converts from the centre (Diagram I-1).
Chart I-
How many French people are actually protesting? Although there was a slight pickup in protests at the beginning of January, the numbers countrywide are not high. In fact, they are far from what they were back in November and therefore would have to get much larger for markets to become concerned anew (Chart I-6). If we are to compare these protests to those in 1995 or 2010, the numbers pale in comparison (Table I-3). For instance, the protest of December 1995 brought a million people onto the streets while the demonstrations against the Woerth pension reform in 2010 lasted for seven months and gathered close to nine million protesters across eight different events (Chart I-7).
Chart I-6
Chart I-
Chart I-7
We would compare the yellow vest protests to the 15-month long Spanish Indignados in 2011, which gathered between six and eight million protesters overall, and the U.S. Occupy Wall Street protests that same year. The two movements were similarly disorganized and combined disparate and often contradictory demands. In both cases, the governments largely ignored the protesters. Thus the yellow vests should not have a major impact on Macron’s reform agenda. As expected, Macron has not mentioned changing course on his most business-friendly reforms, which we see as a signal to investors that, despite the recent chaos, the plan remains the same. There is no strategic reason why Macron would reverse course. His popularity is already in the doldrums. His only chance at another term is to plough ahead and campaign in 2022 on his accomplishments. Nevertheless, to ensure that he does not plough into a rock, Macron will adjust course to calm the protesters. For example, the recent increase in the minimum wage that the government announced in response to the demonstrations was not supposed to be implemented until later in the presidential term. In a similar vein, pension reforms will likely be postponed given the ongoing protests. Macron hoped to introduce a universal, unified pension system by the middle of 2019 to replace an overly complex and fragmented system in which 42 different types of pension coexist, each one having its own rules of calculation. Though protests (both yellow vest and otherwise) have been unimpressive by historical standards, it might be too risky for the government to push the pension reform so close to these events. Such adjustments to the reform agenda should help reduce the protest movement’s fervour or otherwise its support. The bottom line is that the yellow vest protests were to be expected – they are the natural consequence of Emmanuel Macron’s push to reform the French economy and state. However, when compared to previous efforts to derail government reforms, the numbers simply do not stack up. Their disunited and broad objectives are likely to limit the effectiveness of the movement going forward.5 Dhaval Joshi, Chief European Investment Strategist dhaval@bcaresearch.com Jeremie Peloso, Research Analyst jeremiep@bcaresearch.com Footnotes 1 In the case of L’Oreal this refers to the L’Oreal Luxe division. 2 Please see the European Investment Strategy “Buying European Clothes: An Investment Megatrend”, dated December 6, 2018 available at eis.bcaresearch.com. 3 Deloitte: Global Powers of Luxury Goods 2018, Shaping the future of the luxury industry 4 According to the government, 10,500 “red scarves” marched in Paris on January 27, 2018. 5 For the full report, please see the Geopolitical Strategy Special Report “France: La March A Suivre?”, dated February 27, 2019, available at gps.bcaresearch.com.
The Race To $1 Trillion
The Race To $1 Trillion
Overweight (High-Conviction) In last week’s GDP report, software was a clear standout. Investment in software as a ratio of total fixed non-residential investment has been on fire for much of the past four years and is on the cusp of surpassing the GFC highs when capex collapsed, but defensive outlays on software stood their ground (top panel). On a rate of change basis, growth in investment in software has breached the double-digit level for the first time in seven years; the last time this happened marked the beginning of software’s five year bull run. Further, the acute uptick in software investment’s contribution to GDP growth is an excellent herald for relative earnings performance. While the latter’s growth has been decelerating of late, the sharp divergence from the former suggests a resumption of outsized EPS growth in the S&P software index (bottom panel). Bottom Line: We reiterate our high-conviction overweight recommendation in the S&P software index. The ticker symbols for the stocks in this index are: BLBG: S5SOFT - MSFT, ORCL, ADBE, CRM, INTU, RHT, ADSK, SNPS, CTXS, ANSS, CDNS, FTNT and SYMC.
Highlights European Growth: Europe’s economy is slowing, while core inflation remains subdued. The ECB must now contemplate the need for a monetary policy ease so soon after ending its bond buying program. Likely ECB Options: The ECB will likely have no choice but to initiate a new round of LTROs – likely to be announced in either April or May – to prevent an unwanted tightening of credit conditions at a time of slowing economic growth. Fixed Income Implications: Stay below-benchmark on euro area duration, with inflation expectations likely to rebound alongside a more dovish ECB and rising global oil prices. Stay underweight Italian government bonds and neutral overall euro area corporate credit exposure, however, until there are more decisive signs that growth is stabilizing. Feature Back in December, the European Central Bank (ECB) - confident that the euro zone economy was healthy enough to allow the slow process of policy normalization to begin - ended its Asset Purchase Program and signaled that rate hikes could commence as soon as late 2019. Just two months later, the central bank is faced with an unexpectedly persistent and broad-based growth slump. Markets now expect no change in short-term interest rates until well into 2020. By most conventional measures, the ECB is running a very accommodative monetary stance, with a €4.7 trillion balance sheet and negative interest rates (both in nominal and inflation-adjusted terms). On a rate-of-change basis, however, policy has become incrementally less stimulative, with the balance sheet no longer expanding and real interest rates unchanged from levels of a year ago (Chart 1). An additional potential tightening of liquidity conditions is on the horizon with the ECB’s long-term funding operations for euro zone banks (LTROs and TLTROs) set to begin rolling off next year. Chart 1The ECB Needs To Ease Policy Somehow
The ECB Needs To Ease Policy Somehow
The ECB Needs To Ease Policy Somehow
Our ECB Monitor indicates that fresh monetary easing will soon be required if the current downtrend in growth persists. Given the persistent fragilities within the European banking system, not only in Italy but increasingly in core countries like Germany, a combination of slowing economic momentum and tightening monetary liquidity is a potentially toxic brew. Weaker growth raises the specter of a rise in non-performing loans held by banks that also have significant sovereign debt exposures (the so-called “Doom Loop”). In this Special Report, we consider the policy options that the ECB could realistically deliver in the coming months - given the state of the economy, inflation and banking system – with the associated investment implications for European fixed income markets. Our conclusion: the ECB will be forced to take a dovish turn as an insurance policy against tighter credit conditions and weak growth. Eurozone Economy: Broad-Based Mediocrity The ECB has categorized the current downturn, which has pushed real GDP growth in the Eurozone to a below-trend pace of 1.7% and triggered a technical recession in Italy, as simply the product of a bunch of idiosyncratic country-specific shocks (a cut in Germany auto production due to changing emissions standards, Italy-EU fiscal policy debates that raised the cost of capital in Italy, and political unrest in France damaging consumer spending). The biggest shock, however, has been exogenous. Trade policy uncertainty and a weakening Chinese economy have both been a major drag on growth for euro zone countries that rely heavily on exports, in general, and Chinese import demand, in particular. The “one-off shocks” narrative is incorrect because the slowdown has been broad-based. The majority of countries within the euro zone are suffering slowing GDP growth, falling leading economic indicators and decelerating headline inflation, according to our diffusion indices for each (Chart 2). The previous three times such a synchronized slowdown unfolded (2001, 2009 and 2012), the ECB responded with a full-blown rate cutting cycle. Inflation trends today, however, make it a bit more difficult for the ECB to consider any such possible shift in a more dovish direction. Chart 2ECB Typically Eases After A Broad-Based Economic Downturn
ECB Typically Eases After A Broad-Based Economic Downturn
ECB Typically Eases After A Broad-Based Economic Downturn
The overall unemployment rate for the region is 7.8%, well below the OECD’s estimate of the full employment NAIRU1 rate. In contrast to our diffusion indicators for the economy, the majority of euro area countries (83%) have unemployment rates lower than NAIRU (Chart 3). The previous two times labor markets were so tight in the euro area, wage inflation reached 4%, core inflation climbed beyond 2.5% and the ECB pushed policy interest rates to between 4-5%. Today, a large majority of countries are witnessing faster wage growth and core inflation, but the overall level of both is still relatively low (2.5% and 1%, respectively). Chart 3ECB Policy Is Already Very Easy
ECB Policy Is Already Very Easy
ECB Policy Is Already Very Easy
So from the point of view of the state of overall growth and inflation, the ECB is in a difficult position. Euro area growth has slowed, but not by enough to ease the nascent inflation pressures in labor markets. The story gets more complex when looking at growth and inflation at the individual country level. For the four largest economies in the region – Germany, France, Italy and Spain – the latter two remain a source of concern. Unemployment in both Spain and Italy remains in double-digits, with headline and core inflation rates at 1% or lower (Chart 4). Italy’s manufacturing PMI is now at 47.6 and Spain’s is now at 49.9, both below the 50 level indicating an expanding economy. Chart 4Italy & Spain Are Becoming An Issue (Again)
Italy & Spain Are Becoming An Issue (Again)
Italy & Spain Are Becoming An Issue (Again)
Credit growth exhibits a similar pattern. Total bank lending is contracting on a year-over-year basis in Italy (-4.3%) and Spain (-2.1%), while still growing at a positive, albeit decelerating, rate in Germany (+1.5%) and France (+5.3%). The most recent ECB Bank Lending Survey for the fourth quarter of 2018 showed that lending standards were becoming more stringent in Italy and Spain than in Germany or France (Chart 5). In Italy, where the growth downturn has been deeper and borrowing costs have gone up due to the Italian populist government’s repudiation of EU deficit limits, banks are actually tightening lending standards. Chart 5Credit Conditions Tightening At The Margin
Credit Conditions Tightening At The Margin
Credit Conditions Tightening At The Margin
The last thing the ECB wants to see now is a sustained credit contraction in the large economies where growth and banking systems are the most fragile – most notably, Italy. Bottom Line: Europe’s economy is slowing, while core inflation remains subdued. Weakness is more pronounced in the Peripheral countries compared to the Core, especially Italy. The ECB must now contemplate the need for a monetary policy ease so soon after ending its bond buying program. Italy’s Banks Are Still A Huge Headache For The ECB European banks have struggled to generate acceptable profits in recent years against a backdrop of sluggish economic growth, negative interest rates and increased regulatory capital requirements. Bank equity values remain near post-2008 crisis lows, with Italian bank stocks severely underperforming their competitors within the euro zone (Chart 6). Credit spreads for Italian banks are also far more elevated than those of their euro area peers, a reflection of the higher yields and wider spreads on Italian government bonds (which, given Italy’s BBB sovereign credit rating, means that the floor on Italian yields and credit spreads is higher than those of other euro zone countries with better credit ratings). Chart 6Italy's Fiscal Problems Impacting The Banks
Italy's Fiscal Problems Impacting The Banks
Italy's Fiscal Problems Impacting The Banks
Even given the economic fragility in Italy, Italian banks remain reasonably well-capitalized. According to the data from the European Banking Authority (EBA), Italian banks have a Common Equity Tier 1 (CET1) capital ratio of 13.8%, well above the minimum levels required by Basel III bank regulations and close to the overall euro area CET1 ratio of 14.7% (Chart 7).
Chart 7
The problem for Italian banks, however, remains the high level of non-performing loans (NPLs). EBA data shows that Italian banks have an NPL ratio of 9.4%, nearly three times the total euro area NPL ratio of 3.4%. While this is a substantial improvement from the near-20% NPL ratio seen after the 2011 European debt crisis, the absolute level of NPLs remains high. The other major risk for Italian banks is their large holdings of Italian sovereign bonds, which raises the risk of mark-to-market losses hitting the banks’ capital position as government bond yields rise (i.e. the “Doom Loop”). The ECB’s bond purchases have helped to reduce the share of Italian sovereign debt held by Italy’s banks from 25% to around 19% over the past five years (Chart 8). Yet with Italy’s sovereign credit rating now BBB – on the cusp of junk – Italian bank balance sheets remain heavily exposed to sovereign debt risk.
Chart 8
The ECB has tried to mitigate the impact of its extraordinary monetary stimulus on the profitability of Europe’s banks by offering longer-term loans (against acceptable collateral) at low interest rates. These programs, known as Long-Term Refinancing Operations (LTROs), have mostly been used by banks in Italy and Spain, which have taken up a combined 56% of all outstanding LTROs (Chart 9). Chart 956% Of ECB LTROs Have Gone To Italy & Spain
56% Of ECB LTROs Have Gone To Italy & Spain
56% Of ECB LTROs Have Gone To Italy & Spain
The most recent LTRO operation launched in 2016 was a Targeted LTRO (TLTRO) that tied the extension of ECB funding directly to the amount of new loans made by any bank that received the funding. Those TLTROs were offered at the ECB’s Marginal Deposit Rate of -0.4%, effectively providing a 40bps subsidy for new bank lending. The impact on loan growth from the TLTROs was far greater in Italy and Spain, where the share of total bank lending funded by LTROs in each country is now 10% compared to 4% for all euro area bank loans (Chart 10). Chart 10LTROs Funding 10% Of Bank Lending In Italy & Spain
LTROs Funding 10% Of Bank Lending In Italy & Spain
LTROs Funding 10% Of Bank Lending In Italy & Spain
The TLTROs extended in 2016 had a maturity of four years, which means that the loans will begin to mature next year.2 If the ECB lets these operations expire without any offering of a new program, then banks that have used that cheap liquidity will be faced with one of two choices: replace that funding with bank debt at much higher market interest rates, or reduce the size of their loan books (i.e. delever their balance sheets). For Italy’s banks, replacing all of that cheap TLTRO funding with expensive bank debt is highly unlikely. According to the Bank of Italy’s latest Financial Stability Report, bank debt represents as large a share of overall Italy bank funding as the TLTROs (around 10%), but the growth rate of that debt has been contracting at a -15% to -20% rate over the past couple of years (Table 1).3 This is how rising Italian sovereign bond yields translate into higher bank debt yields and market funding costs, restricting lending activity. Table 1Italian Banks Have Slashed Expensive Debt Market Funding
The ECB's Next Move: Taking Out Some Insurance
The ECB's Next Move: Taking Out Some Insurance
Already, Italian banks have been cutting back on lending to the most risky borrowers, according to Bank of Italy data (Chart 11). The growth rates of loans deemed “risky” and “vulnerable” contracted at a faster pace in 2018 than during 2015-17, while loans extended to “solvent” and “safe” borrowers grew more quickly in 2018 than the prior three years. These trends are likely to continue with credit standards now being tightened by Italian banks according to the ECB Bank Lending Survey.
Chart 11
An additional factor for the banks to consider is the upcoming implementation of the Basel III regulatory requirement that banks must maintain a minimum amount of funding with a maturity greater than one year (the Net Stable Funding Ratio, or NSFR). Even though the current round of TLTROs do not begin to expire until June 2020, they will turn into “short-term” funding as of June of this year when it comes to banks calculating their NSFR. That ratio is not yet binding, but banks will likely seek to plan ahead for their long-term funding and will seek guidance from the ECB. So the ECB is now faced with the prospect of letting the TLTROs begin to expire next year, placing 4% of total euro area bank lending and 10% of Italian and Spanish bank lending at risk. Given the current fragile state of growth in the euro area, especially in Italy, the central bank would be taking a huge gamble by risking an even deeper downturn through banks shrinking their loan books. The easiest way to prevent that outcome – more LTROs. Bottom Line: The ECB will likely have no choice but to initiate a new round of LTROs – likely to be announced in April or May - to prevent an unwanted tightening of credit conditions amid slowing economic growth. The ECB’s Likely Next Move? New LTROs With More Dovish Forward Guidance The ECB Governing Council meets this week. There will be a new set of economic projections prepared for this meeting, and the ECB has typically chosen to make changes to its monetary policies alongside shifts in its economic forecasts. ECB President Mario Draghi has already noted that the growth risks in the euro zone are now tilted to the downside. Even noted monetary hawks like German Bundesbank President Jans Weidmann and Dutch Central Bank President Klaas Knot – both candidates to replace Draghi when his term expires in October – have toned down their calls for monetary tightening given the weak growth in their own economies. We expect the ECB to follow a dovish script at the March ECB meeting, along these lines: Downgrade the ECB’s growth forecasts Delay the date when inflation is projected to return back to 2% target Extend forward guidance on the first rate hike out to “mid-2020 or later” (which only validates current market pricing) A pessimistic assessment of the outlook for bank lending based on elevated bank funding costs impairing the transmission of ECB’s “highly accommodative” monetary policy A discussion about the need for a new LTRO program to replace the ones that start expiring in 2020 Step 4 in that script could be delayed until the April or May ECB meetings, to allow for more time to see how the economic data unfolds. Almost all of the current downturn in real GDP growth can be attributed to the plunge in net exports – the contribution to growth from domestic demand has been stable over the past year (Chart 12). Thus, the ECB will likely want to see if the current indications of a U.S.-China trade deal, combined with more stimulus from China’s policymakers, puts a floor under the downturn in euro area trade activity. Chart 12ECB Growth Forecasts Require A Rebound In Exports
ECB Growth Forecasts Require A Rebound In Exports
ECB Growth Forecasts Require A Rebound In Exports
Step 5 in our March ECB meeting script can also be delayed to April or May, but the ECB is not likely to wait longer than that and run the risk of letting the current slowing of euro area credit growth turn into a full-blown contraction due to the end of cheap funding (Chart 13). Chart 13Tightening Lending Standards: Trigger For A New LTRO?
Tightening Lending Standards: Trigger For A New LTRO?
Tightening Lending Standards: Trigger For A New LTRO?
There has also been some speculation that the ECB could satisfy both the hawks and doves on the Governing Council by announcing a hike in the ECB Overnight Deposit rate at the same time as a new LTRO program. The Overnight Deposit rate represents the floor of the ECB’s policy interest rate corridor, with the Marginal Lending rate representing the ceiling and the Main Refinancing rate acting as the midpoint of the corridor. Yet with the ECB maintaining such a large balance sheet, with €1.2 trillion in excess reserves, the effective short-term interest rate (1-week EONIA) has traded near the Overnight Deposit Rate floor. Thus, lifting only the Overnight Deposit Rate, which is -0.4% and has been blamed for damaging the earnings of euro area banks, would effectively be the same as a traditional hike in the ECB’s main interest rate tool, the Main Refinancing Rate (Chart 14). Chart 14The ECB Cannot
The ECB Cannot "Just" Hike The Deposit Rate
The ECB Cannot "Just" Hike The Deposit Rate
Bottom Line: Offering a new LTRO, but perhaps for only a shorter time period than the expiring TLTROs (i.e. two years instead of four), seems to be the best solution for the ECB. This will prevent a potential liquidity-driven bank credit crunch in the most vulnerable parts of the European economy – Italy and Spain. Fixed Income Investment Implications Of Our ECB View 1. Duration: the benchmark 10-year German Bund yield had fallen as low as 0.09% in the most recent global bond rally, largely driven by a collapse in inflation expectations. The ECB’s likely dovish guidance on rate hikes will prevent any meaningful rise in real Bund yields. Inflation expectations, however, do have a lot more upside if BCA’s bullish oil forecast is realized – especially so if the ECB also takes a more dovish turn (Chart 15). Stay below-benchmark on euro zone duration, and stay long inflation-linked instruments like CPI swaps. Chart 15Stay Below-Benchmark On European Duration Exposure
Stay Below-Benchmark On European Duration Exposure
Stay Below-Benchmark On European Duration Exposure
2. Italian Sovereign Debt: A new LTRO program, combined with more dovish forward guidance, should help prevent the current Italian growth downturn from intensifying. However, a weak economy will sustain pressure on Italian sovereign spreads. Stay underweight for now, but look to upgrade when growth stabilizes (Chart 16). Chart 16Stay Cautious On Euro Area Spread Product Until Growth Bottoms
Stay Cautious On Euro Area Spread Product Until Growth Bottoms
Stay Cautious On Euro Area Spread Product Until Growth Bottoms
3. Euro Area Corporates: A more dovish ECB will help stabilize corporate credit spreads in the euro area, but like Italian sovereign debt, signs of more stable growth are required before spreads can meaningfully compress. Stay neutral for now. Robert Robis, CFA, Chief Fixed Income Strategist rrobis@bcaresearch.com Footnotes 1 Non-accelerating inflation rate of unemployment. 2 The loans were offered in four allotments in June 2016, September 2016, December 2016 and March 2017. Hence, the loans will mature in June 2020, September 2020, December 2020 and March 2021. 3 The November 2018 Bank of Italy Financial Stability Report can be found here: https://www.bancaditalia.it/pubblicazioni/rapporto-stabilita/2018-2/index.html Recommendations The GFIS Recommended Portfolio Vs. The Custom Benchmark Index
The ECB's Next Move: Taking Out Some Insurance
The ECB's Next Move: Taking Out Some Insurance
Duration Regional Allocation Spread Product Tactical Trades Yields & Returns Global Bond Yields Historical Returns