Sectors

Highlights Korean stocks are facing downside risks over the next several months. Exports will continue to contract on falling semiconductor prices and retrenching global demand. Growth deceleration and low inflation will lead the central bank to cut rates in 2019. Within an EM equity portfolio, we are downgrading Korean tech stocks from overweight to neutral but remain overweight the non-tech sector. We are booking gains on our strategic long positions in EM tech versus both the broader EM equity benchmark and materials. The KRW/USD exchange rate is at a critical technical juncture. Investors should wait to buy on a breakout and/or sell on a breakdown of the tapering wedge pattern. Feature Decelerating and lately contracting South Korean exports have been a major drag on the economy and stock market (Chart I-1). The country is heavily reliant on manufacturing, with exports of goods contributing to nearly half of real GDP. Chart I-1Korean Stocks: Unsustainable Rebound?
Korean Stocks: Unsustainable Rebound?
Korean Stocks: Unsustainable Rebound?
Although exports are currently shrinking, Korean domestic stock prices still rebounded. The rebound has mostly been driven by the information technology (tech) sector (Chart I-2).
Chart I-2
Is this recent rally justified by underlying fundamentals? Will share prices continue to rise in 2019? Our inclination is ‘no’ to both questions. There are still dark clouds on the horizon for both Korea’s business cycle and stock market. We are downgrading Korean tech stocks to neutral from overweight within a dedicated EM equity portfolio. However, we are maintaining our overweight in non-tech stocks relative to the EM equity benchmark. Lingering Risks In The Semiconductor Industry Korea’s dependence on the semiconductor sector has risen considerably in the past several years: Semiconductor exports have risen from under 10% to slightly above 20% of total goods exports (Chart I-3). As such, the outlook for semiconductor exports is a critical factor for future economic growth. Chart I-3Korea: Increasing Reliance On The Semiconductor Sector
Korea: Increasing Reliance On The Semiconductor Sector
Korea: Increasing Reliance On The Semiconductor Sector
Table 1 lists the top 10 major exported goods from Korea, together contributing about 72% of total exports. Semiconductors are by far the largest component. Last year, overseas sales of semiconductors alone contributed to some 90% of growth in Korean exports, and about one-third of the country’s nominal GDP growth.
Chart I-
Notably, Korea produces the largest quantity of DRAM and NAND memory chips in the world. Last year, Korean semiconductor companies accounted for about 70% of global DRAM and 50% of NAND flash global sales revenue. In 2019 Korean semiconductor exports will likely contract due to further deflation in DRAM and NAND memory prices (Chart I-4). Chart I-4Memory Prices Are Plunging
Memory Prices Are Plunging
Memory Prices Are Plunging
The 2016-2017 surge in DRAM and NAND flash prices was due to supply shortages relative to demand. Last year, NAND prices plunged and DRAM prices began to fall as their supply-demand balances shifted to oversupply. This year, the glut will worsen. Demand Global demand for DRAM and NAND memory is slowing. Memory demand from the global smartphone sector – one important end-user market for DRAM and NAND memory chips – is contracting. According to the International Data Corporation (IDC), the global mobile phone sector is the biggest end-market for both DRAM and NAND memory chips, with nearly 40% market share in each. As major markets like China and advanced economies have entered the saturation phase of mobile-phone demand, global smartphone shipments are likely to decline further in 2019 (Chart I-5, top panel). Chart I-5Global Memory Demand Is Slowing
Global Memory Demand Is Slowing
Global Memory Demand Is Slowing
DRAMeXchange1 expects global smartphone production volume for 2019 to fall by 3.3% from last year. In addition, the significant surge in bitcoin prices greatly boosted cryptocurrency mining activity in 2016-‘17 as miners quickly expanded their computing power. This contributed to strong DRAM demand and in turn higher semiconductor prices between June 2016 and May 2018. With the bust of bitcoin prices, this demand has vanished, which will further weigh on prices (Chart I-5, bottom panel). Supply High semiconductor prices in 2016-2017 boosted global production capacity expansion of DRAM and NAND memory chips. Based on data compiled by the IDC, global DRAM and NAND flash capacity expanded by 5.7% and 4.3% respectively in 2018 from a year earlier. As most of the global new capacity was added in the second half of 2018, the output of DRAM and NAND in 2019 will be higher than last year. Moreover, DRAM capacity will grow an additional 4% this year. Because of rising supply and slowing demand, both DRAM and NAND markets are in excess supply and have high inventories. DRAMeXchange forecasts that average DRAM prices will drop by at least another 20% in 2019, while NAND flash prices will fall another 10% from current levels. DRAM and NAND flash memory are the largest components of Korean tech producers. Yet they also sell many other tech products such as analog integrated circuits, LCD drivers, discrete circuits, sensors, actuators, and so on. Apart from the negative impact of declining global DRAM and NAND flash prices, the country’s semiconductor exports will also suffer from slowing demand in China in 2019. China, the biggest importer of Korean semiconductor products, has already shown waning demand. Its imports of electronic integrated circuits and micro-assemblies have contracted over the past two months in both value and volume terms (Chart I-6, top and middle panels). This mirrors a similar contraction in Korean semiconductor exports over the same period (Chart I-6, bottom panel). Chart I-6Weakening Chinese Semiconductor Demand
Weakening Chinese Semiconductor Demand
Weakening Chinese Semiconductor Demand
Bottom Line: Korean semiconductor producers will likely face a contraction in their sales in 2019 due to weakening demand and deflating semiconductor prices. Diminishing Competitive Advantage Korea has been losing its competitive edge in key sectors like automobiles and smartphones. Even though the country remains highly competitive in the global semiconductor industry, it is beginning to show early signs of losing competitiveness there too. Improving competitiveness among other producers as well as a slowing pace of technological improvement and rising production costs are major reasons underlying Korea’s diminishing global competitiveness. Automobiles Korean auto manufacturers have lost market share in the global auto market. In China, the world’s biggest auto market, Korean brands’ market share has declined significantly in the past four years, losing out to both Japanese and German brands (Chart I-7, top three panels). Chart I-7Korea: Losing Market Shares In China's Auto Market
Korea: Losing Market Shares In China's Auto Market
Korea: Losing Market Shares In China's Auto Market
Korean car companies have established auto manufacturing plants in China over the past decade. As a result, all Korean cars sold in China are produced within China, and automobile exports to China from Korea have fallen to zero (Chart I-7, bottom panel). Due to Korean auto manufacturers’ diminishing competitive advantage, Korean automobile production and exports peaked in 2012 in terms of volumes, and have been on a downtrend over the past seven years (Chart I-8, top panel). Chart I-8Further Decline In Korean Auto Output And Exports Is Possible
Further Decline In Korean Auto Output And Exports Is Possible
Further Decline In Korean Auto Output And Exports Is Possible
While demand for Korean cars in the EU remains resilient, sales volumes in the U.S., China and the rest of world have been on a downward trajectory (Chart I-8, bottom three panels). Smartphones In the global smartphone market, Korea’s major smartphone-producing company – Samsung – has been in fierce competition with Chinese brands, and it seems to be losing the battle. Chart I-9 shows that while Samsung’s smartphone sales declined 8% year-on-year last year, smartphone sales from major Chinese smartphone producers (Huawei, Xiaomi, Oppo and Vivo) continued to grow at a pace of 20%. Chart I-9Korea: Losing Market Shares In Global Smartphone Market
Korea: Losing Market Shares In Global Smartphone Market
Korea: Losing Market Shares In Global Smartphone Market
From 2012 to 2018, China’s share of global smartphone shipments rose from 6% to 39%. By comparison, Samsung’s share declined from 30% to 21% over the same period. Semiconductors Korean semiconductor companies – notably Samsung and SK Hynix – will likely remain the biggest producers in the memory market, given their advanced technology. However, there are still signs that Korean semiconductor companies will face increasing challenges in protecting their market share. Based on IDC data, Korean semiconductor companies’ share of global DRAM capacity will inch lower to 65% in 2019 from 65.4% in 2017, while their share of NAND capacity will decline to 53.8% from 57.5% during the same period. Meanwhile, China is focusing on boosting its self-sufficiency in terms of semiconductor production. At the moment there is still a three- to four-year technological gap between China and Korea in DRAM and NAND mass production, though the gap is likely to narrow. In the meantime, the U.S. will continue to create obstacles to prevent the rise of the Chinese semiconductor sector. However, these factors will only delay – not avert – the sector’s development and growth. We believe China will remain firmly committed to develop its semiconductor sector, particularly memory products, irrespective of the cost of investment necessary to do so. Similar to what has transpired in both automobile and smartphone production (Chart I-10), China will slowly increase its penetration in the semiconductor market with increasing capacity and a narrower technology gap over the next five to 10 years. After all, the world’s biggest semiconductor demand is in China. Chart I-10China: A Rising Star In Global Auto And Smartphone Market
China: A Rising Star In Global Auto And Smartphone Market
China: A Rising Star In Global Auto And Smartphone Market
Significant increase in labor costs = falling export competitiveness for all sectors Korean President Moon Jae-in’s flagship economic policy, “income-led growth,” has resulted in dramatic increases in minimum wages since he took office in 2017, further damaging Korea’s competitiveness. The nation’s minimum wage was hiked by 7.3% in 2017, 16.4% in 2018 and will rise by another 11% to 8,350 KRW or $7.40 an hour, in 2019. As the president remains committed to meeting his campaign pledge of lifting the minimum wage to 10,000 KRW an hour, or about $8.90, this would require a further 20% increase in the next year or two. In addition, the government has also limited the maximum workweek to 52 hours since last July for businesses with more than 300 workers. Last month, the Cabinet further approved a revision bill whereby workers are eligible to receive an additional eight hours of wages every weekend for 40 hours of work that week. The new wage regulations have become a substantial burden on employers in all industries. The impact is more severe on small- and medium-sized enterprises (SMEs). According a recent survey, about 30% of SMEs have been unable to pay workers due to the state-set minimum wage. It is also affecting large manufacturers. According to a joint statement released in late December by the Korea Automobile Manufacturers Association and the Korea Auto Industries Cooperative Association, local automakers’ annual labor cost burdens will increase by at least 700 billion won (US$630 million) a year. As for auto parts manufacturers, a skyrocketing financial burden due to the new policy may threaten their survival. In addition, despite the KORUS FTA agreement reached between Korea and the U.S. last September, Korean auto manufacturers still fear they will be subject to new tariffs in 2019. On February 17, the U.S. Commerce Department submitted a report about imposing tariffs on imported automobiles and auto parts to U.S. President Donald Trump, who will make a decision by May 18. Our Geopolitical Strategy Service (GPS) team believes the odds of U.S. administration imposing auto tariffs on imported cars from Korea are small as this will be against the KORUS FTA agreement.2 Our GPS team also believes Japan is less likely to suffer a tariff than the EU, and even if Japan suffers a tariff along with the EU, Japan will negotiate a waiver more quickly than the EU. In both cases, Korea is likely to sell more cars in the U.S., but it will continue to face strong competition from Japan. Bottom Line: In addition to weakening global demand, a deterioration in Korea’s competitive advantage, due in large part to improving competitiveness among other producers and rising domestic wages, will negatively affect Korean exports. What About Domestic Demand? Record fiscal spending in 2019 will boost public sector consumption considerably, offsetting weakening consumption in the private sector. As the new wage policy will likely result in more layoffs and additional shuttering of businesses, domestic retail sales growth will remain under pressure (Chart I-11). Hence, an unintended consequence of the government’s higher income policy will be weaker aggregate income and consumer spending growth. Chart I-11KOREA The New Wage Policy May Trigger More Layoffs And Weaken Retail Sales
KOREA The New Wage Policy May Trigger More Layoffs And Weaken Retail Sales
KOREA The New Wage Policy May Trigger More Layoffs And Weaken Retail Sales
Manufacturing and service sector jobs, including wholesale and retail trade and hotels and restaurants, account for 17% and 23% of total employment, respectively. Of all sectors, these two lost the most employees in January from a year ago. Meanwhile, due to the government’s deregulation of loans in 2014, Korean household debt has increased at a much faster pace than nominal income growth (Chart 12, top panel). As a result, Korea’s household debt has rapidly risen to 86% of its GDP as of the end of the third quarter of last year, from 72% four years ago – (Chart I-12, bottom panel). Elevated household debt at a time of rising layoffs will increase consumer anxiety and weigh on household spending. Chart I-12High Household Debt Will Weigh On Spending
High Household Debt Will Weigh On Spending
High Household Debt Will Weigh On Spending
In order to combat an economic downturn, the government last month approved a record 467 trillion won ($418 billion, 26.5% of the country’s 2018 GDP) budget for 2019, up 9.5% from last year. The last time the budget increased by such a big scale was in 2009, when spending rose 10.7% in the wake of the global financial crisis. In addition, the government will front-load spending – with 61% of the budget to be spent in the first half of 2019. Household spending and government expenditures account for 48% and 15% of real GDP, respectively, while exports equal about 50% of real GDP. Hence, the increase in fiscal spending will not entirely offset the contraction in exports and slowdown in consumer spending. This entails a considerable slowdown in economic growth in 2019. Bet On Monetary Easing With growth disappointing and both headline and core inflation well below 2% (Chart I-13), the central bank will cut rates in 2019. Chart I-13Bet On A Rate Cut
Bet On A Rate Cut
Bet On A Rate Cut
So far, economic growth has decelerated in the past 10 months, and recent data shows no signs of recovery. The country’s manufacturing sector is in contraction, with manufacturing PMI holding below the 50 boom-bust line in January (Chart I-14). Meanwhile, South Korea's unemployment rate rose to a nine-year high in January, with most of the job losses in the manufacturing and construction sectors. Chart I-14Manufacturing Sector: Still In Contraction
Manufacturing Sector: Still In Contraction
Manufacturing Sector: Still In Contraction
Saramin, a South Korean job search portal, surveyed 906 firms in South Korea last month, 77% of which expressed unwillingness to hire new employees due to higher labor costs and negative business sentiment. Retail sales volume growth recently tumbled to 2-3%, pointing to faltering domestic demand (Chart I-11 above, bottom panel). The fixed-income market is not pricing in a rate cut in 2019. Therefore, investors should consider betting on lower interest rates. Shrinking exports and rate cuts will likely undermine the Korean won. Bottom Line: Economic deceleration and low inflation will lead the central bank to cut interest rates in 2019. Investment Implications The following are our investment recommendations: Downgrade the Korean tech sector from overweight to neutral within the EM space. We are reluctant to downgrade to underweight because many other emerging markets and sectors within the EM universe have poorer structural fundamentals than Korean tech. The tech sector accounts for 38% of the MSCI Korea Index, and 27% of the KOSPI in terms of market value. The stock with the largest weight in the MSCI Korea equity index is Samsung Electronics, with a share of 25%, followed by SK Hynix, with a ~5% share. Both are very sensitive to semiconductor prices. Specifically, semiconductor sales accounted for 31% of Samsung’s revenue, but contributed 77% of Samsung’s operating profit last year (Table I-2).
Chart I-
Falling prices reduce producers’ profits by more than falling volumes.3 Hence, profits of semiconductor producers in Korea and globally will shrink in 2019. This will lead to a substantial selloff in Korean tech stocks (Chart I-15). Chart I-15Falling Memory Prices Will Trigger A Sell-Off In Korean Tech Stocks
Falling Memory Prices Will Trigger A Sell-Off In Korean Tech Stocks
Falling Memory Prices Will Trigger A Sell-Off In Korean Tech Stocks
Meanwhile, China accounts for 33% of Samsung’s revenue, making it the largest market (Chart I-16). The ongoing economic slump in China’s domestic demand implies weaker demand for Korean shipments to China, which account for 28% of its exports and 14% of its GDP.
Chart I-16
We are booking gains on our strategic long position in the Korean tech sector versus the EM benchmark index first instituted on January 27, 2010. This trade resulted in a 136% gain (Chart I-17, top panel). Chart I-16Taking Profits On Our Overweight Tech Positions
Taking Profits On Our Overweight Tech Positions
Taking Profits On Our Overweight Tech Positions
Consistently, we are also taking profits on our long EM tech / short EM materials stocks trade, a strategic recommendation initiated on February 23, 2010 that has yielded a 186% gain (Chart I-17, second panel). The basis for this strategic position was our broader theme for the decade of being long what Chinese consumers buy and short plays on Chinese construction, which we initiated on June 8, 2010.4 Stay overweight non-tech equities within the EM space. The fiscal stimulus will have a considerable positive impact on the economy. Besides, Korean non-tech stocks have been weak relative to the EM equity benchmark, and in a renewed EM selloff they could act as a low-beta play (Chart I-17, bottom panel). We initiated our long Korean non-tech sector versus the EM benchmark index on May 31, 2018, which has so far been flat. The KRW/USD exchange rate is at a critical technical juncture. Investors should wait and buy on a breakout or sell on a breakdown of the tapering wedge pattern. The KRW/USD has been in a tight trading range over the past eight months (Chart I-18) and is approaching a major breaking point – i.e., any move will be significant, which we expect will largely depend on the movement of the RMB/USD. Chart I-18Tapering Wedge Patterns
Tapering Wedge Patterns
Tapering Wedge Patterns
The natural path for the RMB would have been depreciation versus the U.S. dollar. However, China may opt for a flat exchange rate versus the U.S. dollar given its promises to the U.S. within the framework of forthcoming trade agreements. We have been shorting the KRW versus an equally weighted basket of USD and yen since February 14, 2018. We continue to hold this trade for the time being. Investors should augment their positions if the KRW/USD breaks down or close this trade and go long the won if the KRW/USD breaks out of its tapering wedge pattern. With respect to fixed income, we continue to receive Korean 10-year swap rates as we expect interest rates to fall meaningfully. Local investors should overweight bonds versus stocks. Ellen JingYuan He, Associate Vice President Emerging Markets Strategy ellenj@bcaresearch.com Footnotes 1 DRAMeXchange, the memory and storage division of a technology research firm TrendForce, has been conducting research on DRAM and NAND Flash since its creation in 2000. 2 Please see the Geopolitical Strategy Weekly Report, "Trump's Demands On China", published April 4, 2018. Available at gps.bcaresearch.com. 3 Please see the Emerging Markets Strategy Weekly Report “Corporate Profits: Recession Is Bad, Deflation Is Worse”, dated January 28, 2016, available at www.bcaresearch.com 4 Please see the Emerging Markets Strategy Special Report “How To Play Emerging Market Growth In The Coming Decade”, dated June 8, 2010, available at www.bcaresearch.com. Equity Recommendations Fixed-Income, Credit And Currency Recommendations
Highlights A no-deal Brexit which did not cause pain pour encourager les autres would be the much graver existential threat for the EU. A U.K. parliamentary vote to extend Article 50 by a few months would not be a game changer in itself, because it just delays the day of judgement. The real denouement will only happen when a workable route to a benign Brexit option commands a majority in the U.K. parliament. This is the point at which U.K. exposed risk-assets would outperform sustainably. Investors should then buy: the pound, the FTSE250, FTSE Small Cap, and U.K. homebuilders. Feature Chart of the WeekU.K. Homebuilders Is The Best Equity Sector To Play Brexit
U.K. Homebuilders Is The Best Equity Sector To Play Brexit
U.K. Homebuilders Is The Best Equity Sector To Play Brexit
The Article 50 process that governs Brexit is fast approaching its two-year time limit, and the question naturally arises as to what will happen when the clock strikes midnight on March 29.1 To answer this question, it is worth stepping back to ask something even more fundamental: what was the purpose of the two-year time limit in the first place? The EU Must Protect The Integrity Of The Union The two-year time limit in Article 50 was designed to disadvantage the exiting country relative to the EU, and this disadvantage has now become abundantly clear. After the two years have run down, a no-deal or ‘cliff edge’ exit would be bad for the EU27, but it would be far worse for the U.K. This balance of power has put the EU27 very much in the driving seat of the Brexit process, and there is no reason to presume that the EU27 will do anything other than prioritise and protect its own interests. For the EU27, the priority right now is to protect the unity and integrity of the Union in the face of a growing existential threat from populists and nationalists. Unfortunately, much of this has been overlooked in the Brexiteer rhetoric, with arguments like "they need to sell us their BMWs and Prosecco". Clearly, frictionless and barrier-less trade is in the economic interests of both parties, but the economic reality is that less than a tenth of EU27 exports go to the U.K. while something approaching half of U.K. exports go to the EU27 (Chart I-2 and Chart I-3). Chart I-2Less Than A Tenth Of EU27 Exports Go To The U.K. ...
Less Than A Tenth Of EU27 Exports Go To The U.K...
Less Than A Tenth Of EU27 Exports Go To The U.K...
Chart I-3...While Almost Half Of U.K. Exports Go To the EU27
...While Almost Half Of U.K. Exports Go To the EU27
...While Almost Half Of U.K. Exports Go To the EU27
Brexit is essentially a huge economic gamble in the name of an overarching political aim to ‘take back control’ (Chart I-4). Remember that the case for Brexit largely hinged on the desire to regain political sovereignty: specifically, controlling migration and ending the supremacy of the European Court of Justice. That’s fine, we have no qualms about that. But if the case for Brexit was largely political, it’s a bit rich to presume that the EU27 will not also prioritise its own overarching political aims – even if these political aims come at the cost of a short-term setback to the European economy. Chart I-4U.K. House Prices Have Stagnated Since The Brexit Negotiations Started
4. U.K. House Prices Have Stagnated Since The Brexit Negotiations Started
4. U.K. House Prices Have Stagnated Since The Brexit Negotiations Started
Brexit Is The Litmus Test For Optimality Of The EU A catastrophic no-deal Brexit would undoubtedly hurt the EU27, and be particularly painful for the member states most exposed to U.K. trade, notably Ireland and the Netherlands. But here’s the paradox: a no-deal Brexit which did not cause pain pour encourager les autres would be the much graver existential threat for the EU. If membership of the EU and its institutions is supposedly an optimal economic and political structure for European states, then Brexit is the litmus test for the sub-optimality of exiting, and especially the heavy cost of exiting abruptly. If, after the two-year notice of Article 50, the U.K. abruptly left the EU with negligible disruption and then quickly thrived outside the EU, it would galvanize the European nationalists and populists to emulate a newly confident and resurgent U.K.’s quick and painless divorce. As this could be the death knell of the European project, the paradox is highlighted in our mischievous title: why a catastrophic no-deal might be good… for the EU. Brexit can take three ultimate shapes: The U.K. revokes its intention to withdraw the EU and remains a full member of the Union. A long transition to a new and negotiated trading relationship between the U.K. and the EU27. A sharp cliff-edge in which the U.K. abruptly becomes a third country to the EU27. The U.K. population now clearly favours option 1 – remain – over the two alternatives (Chart I-5). Meanwhile, the U.K. parliament has expressed its opposition, albeit not yet legally binding opposition, to option 3 – the no-deal Brexit.
Chart I-5
As for the EU27, the best outcome is for the U.K. to revoke its intention to withdraw and thrive within the club; the next best outcome is a long transition to Brexit, during which and after which the U.K. economy underperforms its European peers to illustrate the sub-optimality of exiting. But if Brexit is a cliff-edge, it has to be demonstrably painful. Hence, the EU27 will want to put off the day it has to confront this paradox if there is any chance of avoiding it. Article 50 does allow for this delay. The specific wording of paragraph 3 states: The Treaties shall cease to apply to the State in question from the date of entry into force of the withdrawal agreement or, failing that, two years after the notification referred to in paragraph 2, unless the European Council, in agreement with the Member State concerned, unanimously decides to extend this period. But a close reading suggests that if there is still a real possibility of finalising a withdrawal agreement, or if withdrawal is an outcome that the State no longer desires, then this would not represent ‘failing’. Meaning that the period of negotiation of a withdrawal agreement could be extended beyond March 29, or indeed Article 50 could be entirely revoked. A Short Delay Is Not A Game Changer, But A Second Referendum Would Be Looking at the desired outcomes of the U.K. population, the U.K. parliament, and the EU27, Brexit should rationally end up as benign options 1 or 2. The trouble is that rational outcomes can be thwarted if there is no mechanism to implement them. Although the U.K. parliament has expressed its desire to avoid a no-deal, it has not yet coalesced a majority around how exactly to avoid the cliff-edge outcome. A parliamentary vote to extend Article 50 by a few months would not be a game changer in itself because it just delays the day of judgement, though a longer extension would be more significant. But if the extension facilitated a second referendum or a general election, then that would be a game changer – as there would be the potential for the U.K. population to overturn the decision to leave. It follows that the real denouement will only happen when a workable route to either of the benign Brexit options 1 or 2 above commands a majority in the U.K. parliament. From the perspective of investors, what this way forward turns out to be – permanent customs union, Common Market 2.0, second referendum, or general election – does not really matter. What matters is that a parliamentary majority exists for a positive course of action that eliminates no-deal rather than just delays it. This would be the point at which the BoE is finally liberated from its emergency policy (Chart I-6 and Chart I-7), pushing up U.K. gilt yields relative to other government bond yields (Chart I-8), and allowing a sustained rally in the pound (Chart I-9). Chart I-6Brexit Has Subdued The BoE...
Brexit Has Subdued The BoE...
Brexit Has Subdued The BoE...
Chart I-7...Despite A Tight U.K. Labour Market
...Despite A Tight U.K. Labour Market
...Despite A Tight U.K. Labour Market
Chart I-8Were It Not For Brexit, U.K. Interest Rates Would Be 1 Percent Higher...
Were It Not For Brexit, U.K. Interest Rates Would Be 1 Percent Higher...
Were It Not For Brexit, U.K. Interest Rates Would Be 1 Percent Higher...
Chart I-9…And The Pound Would Be At $1.50
...And The Pound Would Be At 1.50 USD
...And The Pound Would Be At 1.50 USD
In this event, U.K. exposed risk-assets would also outperform. Note that the FTSE100 is not one of these investments. Whenever the pound strengthens, the weaker translation of the FTSE100 companies’ dollar-denominated earnings tends to weigh down this large-cap index (Chart I-10). Instead, investors should focus on: the FTSE250 (Chart I-11) and the FTSE Small Cap, but the best play is the U.K. homebuilders (Chart of the Week). Chart I-10When The Pound Rallies, The FTSE100 Underperforms...
When The Pound Rallies, The FTSE100 Underperforms...
When The Pound Rallies, The FTSE100 Underperforms...
Chart I-11...So Prefer The FTSE250
...So Prefer The FTSE250
...So Prefer The FTSE250
Fractal Trading System* We are pleased to report that long Italy’s MIB versus Eurostoxx600 reached the end of its 3-month holding period very comfortably in profit which is now crystallised. This week, we note that the sharp underperformance of aluminium versus tin is at the limit of tight liquidity which has previously signalled a trend-reversal. Hence, the recommended trade is long aluminium versus tin. Set a profit target of 6.5 percent with a symmetrical stop-loss. For any investment, excessive trend following and groupthink can reach a natural point of instability, at which point the established trend is highly likely to break down with or without an external catalyst. An early warning sign is the investment’s fractal dimension approaching its natural lower bound. Encouragingly, this trigger has consistently identified countertrend moves of various magnitudes across all asset classes. Chart I-12
Long Aluminium Versus Tin
Long Aluminium Versus Tin
The post-June 9, 2016 fractal trading model rules are: When the fractal dimension approaches the lower limit after an investment has been in an established trend it is a potential trigger for a liquidity-triggered trend reversal. Therefore, open a countertrend position. The profit target is a one-third reversal of the preceding 13-week move. Apply a symmetrical stop-loss. Close the position at the profit target or stop-loss. Otherwise close the position after 13 weeks. Use the position size multiple to control risk. The position size will be smaller for more risky positions. * For more details please see the European Investment Strategy Special Report “Fractals, Liquidity & A Trading Model,” dated December 11, 2014, available at eis.bcaresearch.com Dhaval Joshi, Senior Vice President Chief European Investment Strategist dhaval@bcaresearch.com Footnote 1 Midnight British Summer Time Fractal Trading System Recommendations Asset Allocation Equity Regional and Country Allocation Equity Sector Allocation Bond and Interest Rate Allocation Currency and Other Allocation Closed Fractal Trades Trades Closed Trades Asset Performance Currency & Bond Equity Sector Country Equity Indicators Bond Yields Chart II-1Indicators To Watch - Bond Yields
Indicators To Watch - Bond Yields
Indicators To Watch - Bond Yields
Chart II-2Indicators To Watch - Bond Yields
Indicators To Watch - Bond Yields
Indicators To Watch - Bond Yields
Chart II-3Indicators To Watch - Bond Yields
Indicators To Watch - Bond Yields
Indicators To Watch - Bond Yields
Chart II-4Indicators To Watch - Bond Yields
Indicators To Watch - Bond Yields
Indicators To Watch - Bond Yields
Interest Rate Chart II-5Indicators To Watch - Interest Rate Expectations
Indicators To Watch - Interest Rate Expectations
Indicators To Watch - Interest Rate Expectations
Chart II-6Indicators To Watch - Interest Rate Expectations
Indicators To Watch - Interest Rate Expectations
Indicators To Watch - Interest Rate Expectations
Chart II-7Indicators To Watch - Interest Rate Expectations
Indicators To Watch - Interest Rate Expectations
Indicators To Watch - Interest Rate Expectations
Chart II-8Indicators To Watch - Interest Rate Expectations
Indicators To Watch - Interest Rate Expectations
Indicators To Watch - Interest Rate Expectations
Underwhelming Earnings For Home Improvement Retail
Underwhelming Earnings For Home Improvement Retail
Underweight (High-Conviction) Home Depot, the S&P home improvement retail (HIR) index heavyweight, reported earnings yesterday that missed expectations as same store sales fell well short of estimates. The company also added guidance that this key figure would moderate in the coming year from 2018 levels. While a slower rate of top line growth this quarter was fairly predictable, given the Q4 collapse in lumber prices (recall that HIR earns a markup on lumber), the outlook does not bode well. This tough operating environment is captured by our model that, even with a modest recovery in lumber prices, still points to a significant decline in the S&P HIR index (third panel). Still, the HIR index trades at a premium to the broad index despite the headwinds facing the sector (bottom panel). A premium valuation seems misplaced and we accordingly reiterate our high-conviction underweight recommendation on the sector. We further point investors to our market neutral trade going long homebuilders/short HIR.1 The ticker symbols for the stocks in this index is BLBG: S5HOMI – HD and LOW. 1 Please see BCA U.S. Equity Strategy Report, “Dissecting 2019 Earnings,” dated January 22, 2019, available at uses.bcaresearch.com.
A Healthier GE With Less Healthcare
A Healthier GE With Less Healthcare
Overweight General Electric took the S&P industrial conglomerates index higher yesterday on news it had agreed to sell its BioPharma business to Danaher, the former home of GE’s relatively new CEO. The deal, which will raise more than $21 billion for the firm, was celebrated by investors who delivered one of the best share price moves for the company in a decade. Importantly, GE promised to use the proceeds of the transaction to pay down the debt load that has weighed on the stock since the GFC. Further, the deal will see Danaher assuming the pension obligations of the group, another source of shareholder angst. We share investor sentiment with respect to deleveraging; more is better for this highly indebted sector and yesterday’s news is another step in the right direction (third panel). Tack on the catalyst that relief in the trade war with China adds (please see our previous Insight Report) and the recent rally in the still reasonably valued S&P industrial conglomerates index (bottom panel) looks very sustainable; stay overweight. The ticker symbols for the stocks in this index are: BLBG: S5INDCX - GE, MMM, HON, ROP.
Dont Write Off Mighty Industrials
Dont Write Off Mighty Industrials
Overweight Year-to-date, industrials stocks are the best performing GICS1 sector, outperforming the SPX by a massive 650bps. While such a breakneck pace is unsustainable and a short term breather is likely, from a cyclical perspective more gains are in store in this still underowned sector. In Monday’s Weekly Report, we highlighted the top five reasons it still pays to be overweight this deep cyclical sector. With Sunday’s news that the Trump administration is planning to delay the slate of additional Chinese tariffs that were scheduled to begin on March 1 and optimistic tweets on the progress of negotiations, one reason in particular seems most relevant: an easy credit, fiscal & monetary policy trifecta in China. Beyond the positive resolution in the U.S./China trade dispute, China has opened up its central bank liquidity tap to complement ongoing easy monetary policy. Tack on the recent monster loan origination and reaccelerating infrastructure spending and factors are falling into place for a pick up in end demand, which is a boon for U.S. capitals goods producers. Bottom Line: Stay overweight the S&P industrials sector and see Monday’s Weekly Report for more details and the other four reasons we still like industrials.
There are high odds that the chip cycle will soon take a turn for the better. Global chip sales have been decelerating for 17 months and are now on the cusp of contracting. Over the past two decades, steep contractions have been associated with recessions.…
The capex upcycle theme remains intact. Recently, there has been some softness in the investment outlays reported in the national accounts, however, it is highly unlikely that spending plans will grind to a halt similar to the one experienced in…
Highlights Portfolio Strategy The ongoing capex upcycle, resurgent credit growth, easy Chinese policy trifecta, upbeat signals from high frequency financial market data and depressed technicals, all suggest that a re-rating phase looms in the S&P industrials sector. Leading indicators of chip end-demand are flashing green, at a time when the chip liquidation phase is clearing excess supplies. It no longer pays to be bearish the S&P semiconductors index. Recent Changes Lift the S&P semiconductors index to neutral today; it is now also on upgrade alert. Table 1
Reflationary Or Recessionary?
Reflationary Or Recessionary?
Feature The SPX continued to grind higher last week, and is now within reach of the key 2,800 level. We expect stiff resistance to persist at that mark; 2,800 has served as a barrier on several occasions last year as we highlighted in recent research (please refer to Chart 1 from the January 28 Weekly Report).1 Year-to-date, we have identified three pillars that would propel the market higher – a more dovish Fed alongside a softer U.S. dollar, a year-over-year increase in SPX EPS for calendar 2019 and a positive resolution to the U.S./China trade spat. As the S&P 500 has come full circle and returned to the early December level, this slingshot recovery suggests that there is positive progress on all three pillars. However, our sense is that the bond market now has to remain tamed in order to cement these equity market gains and vault to fresh all-time highs, likely in the back half of the year. Chart 1 highlights this goldilocks macro backdrop. Chart 1Staying Divorced For A While
Staying Divorced For A While
Staying Divorced For A While
In other words, as U.S. GDP downshifts from last year’s fiscal easing-induced sugar-high back down to trend growth and most importantly avoids recession, equities should excel. Why? Not only will this entice the Fed to stand pat for longer, but the 10-year Treasury yield will also remain on a lower trajectory than previously anticipated. Crudely put, a neither too-hot nor too-cold economic backdrop will allow equities to reflate away. As such, there are high odds that stocks stay divorced from bond yields for a while longer, and we interpret this bond market backdrop as reflationary rather than recessionary. Meanwhile on the Chinese front, following news of the PBoC’s quasi QE that we highlighted in early February as a positive SPX and cyclicals over defensives catalyst,2 it appears that Chinese authorities could not stomach a below 50 print in the Chinese manufacturing PMI for long and are aggressively opening the fiscal taps anew (Chart 2). Chart 2Chinese reflation...
Chinese reflation...
Chinese reflation...
This enormous lending/fiscal stimulus complements ongoing monetary easing and the recent PBoC’s quasi QE, and should ensure that the Chinese economy at least steadies. The upshot is that global growth should also stabilize and put an end to its yearlong deceleration (Chart 3). Chart 3... Should Aid Global Growth
... Should Aid Global Growth
... Should Aid Global Growth
In addition, as U.S. and Chinese negotiation teams race to the finish line in order to get some sort of a deal done before the March 1st deadline, it is clear that a positive outcome is already discounted by the stock market as the SPX enjoys one of the best starts to the year in recent memory. Once this trade policy uncertainty permanently dies down, then last year’s worst performing sectors that were hit hard by the trade dispute will turn into this year’s stock market champions (Chart 4). Chart 4Trade War Hit Deep Cyclicals The Most
Trade War Hit Deep Cyclicals The Most
Trade War Hit Deep Cyclicals The Most
In that light, we reiterate our cyclical over defensive portfolio bent and this week we highlight that a deep cyclical sector stands to benefit greatly from China’s reflation and the apparent resolution of the U.S./China trade spat; another tech subsector weighed down by the trade tussle is also going to enjoy a reversal of fortune and it no longer pays to be bearish. Don’t Write Off Mighty Industrials Year-to-date, industrials stocks are the best performing GICS1 sector, outperforming the SPX by a massive 650bps (Chart 5). While such a breakneck pace is unsustainable and a short term breather is likely, from a cyclical perspective more gains are in store in this still underowned sector. In this report we highlight the top five reasons it still pays to be overweight this deep cyclical sector.
Chart 5
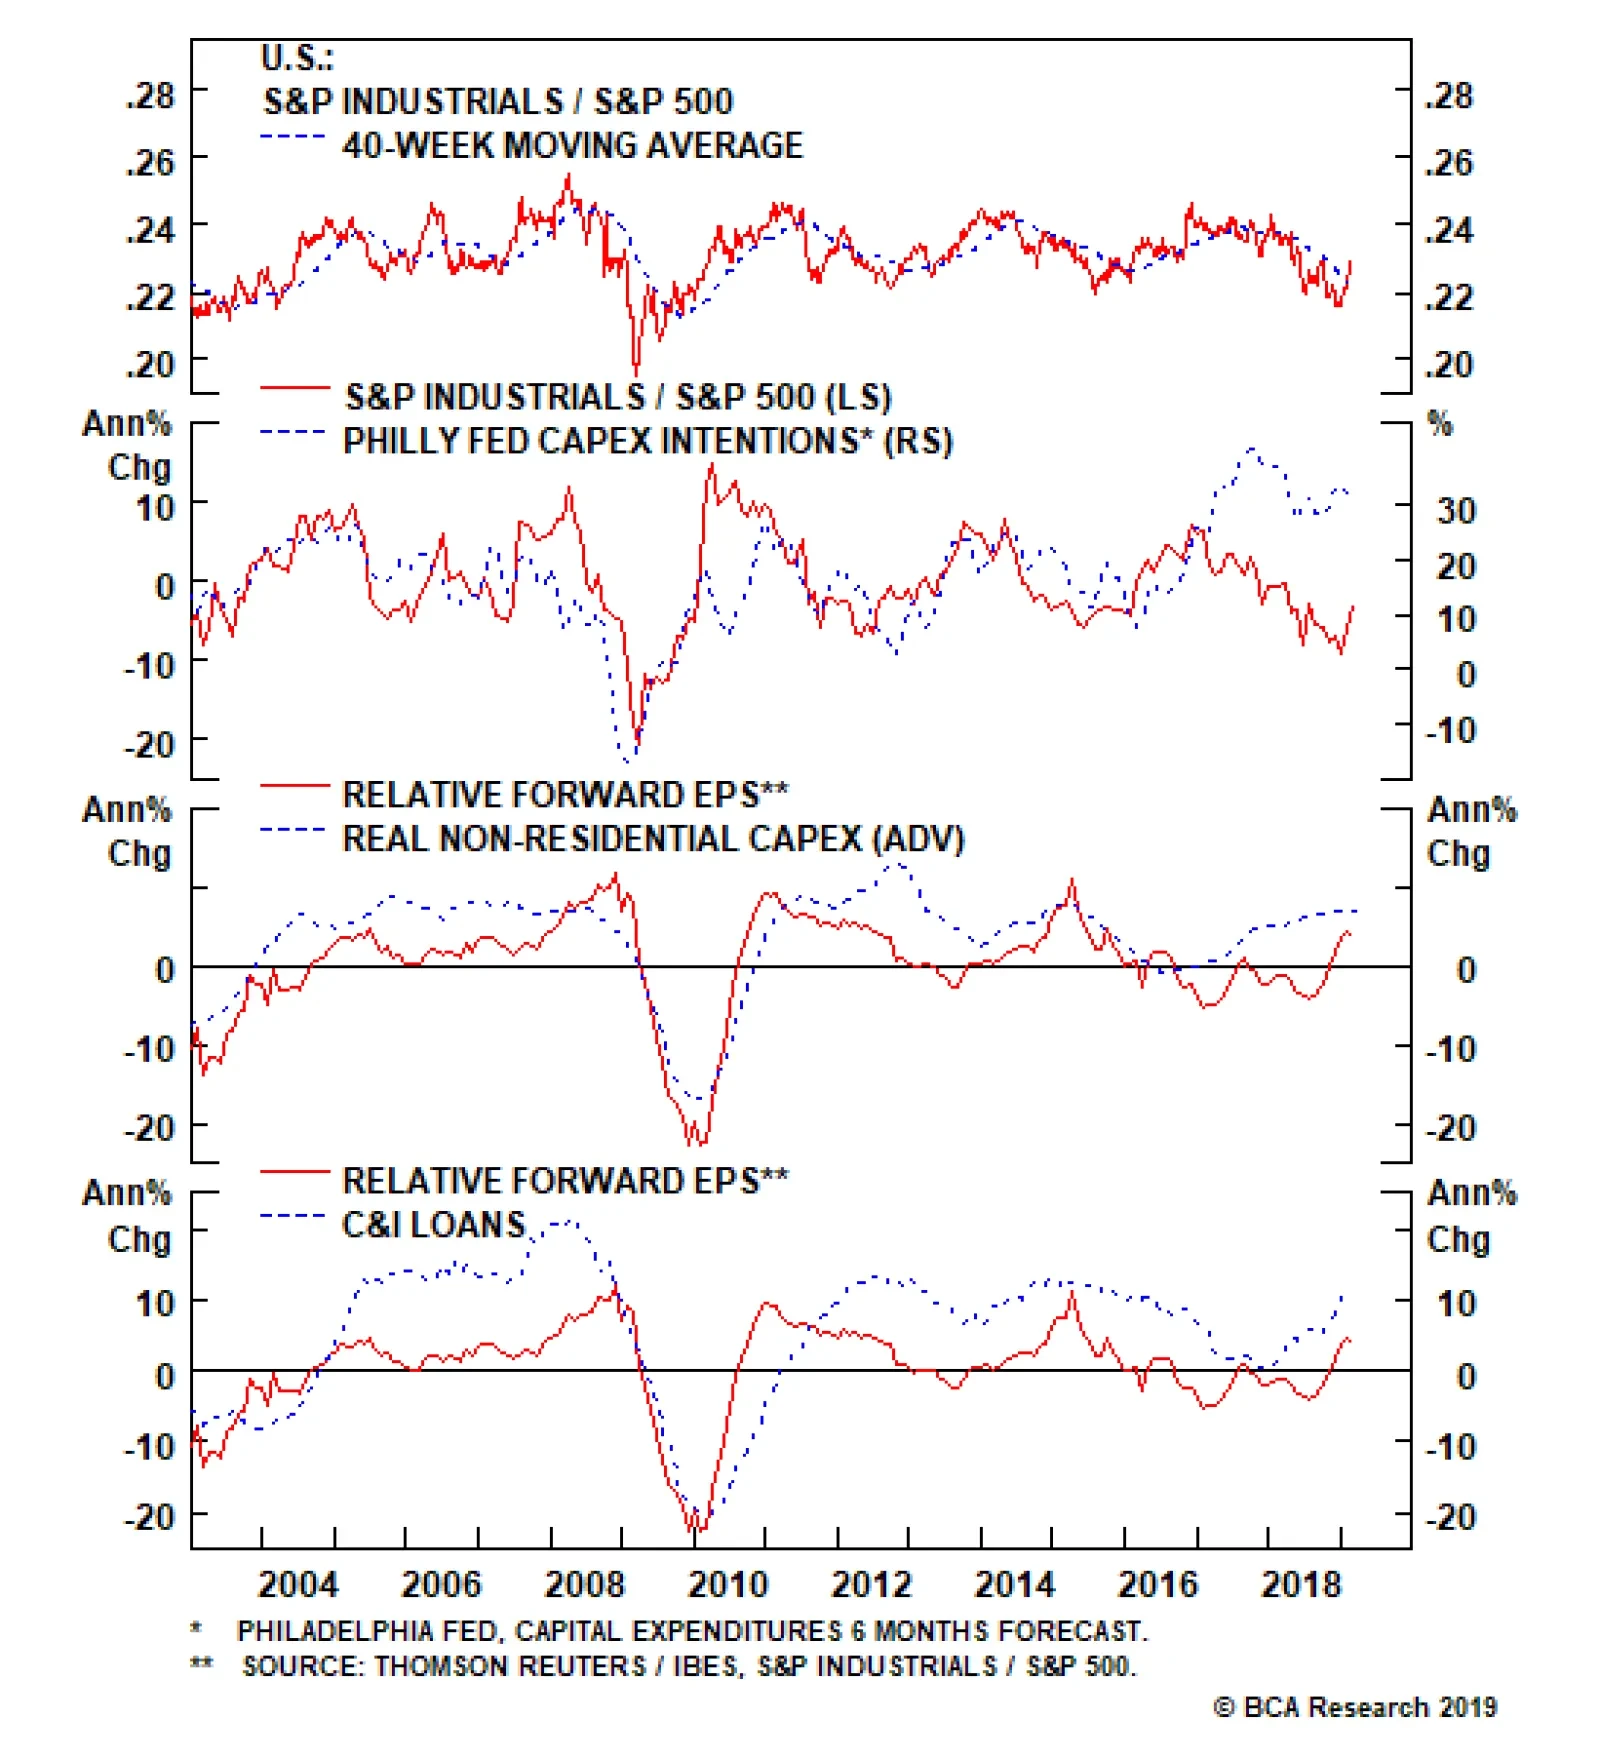
Capex upcycle. The capex upcycle theme remains intact and while there has been some softness recently in the national accounts reported investment outlays, it is highly unlikely that spending plans will grind to a halt similar to the late-2015/early-2016 episode (third panel, Chart 6). Capital goods producers have since replenished their cash coffers and remain committed to develop their capital expenditure projects. Importantly, leading indicators of capex corroborate this backdrop; regional Fed surveys suggest that capital outlays will remain firm for the rest of the year (second panel, Chart 6). Chart 6Capex Upcycle Supports Industrials
Capex Upcycle Supports Industrials
Capex Upcycle Supports Industrials
Resurgent credit growth. Loan growth is on fire in the U.S. and commercial and industrial loan growth is leading the pack, galloping higher and breaching the 10%/annum mark. Bankers are providing the needed fuel to bring to fruition industrials capex plans and, given that historically loan growth and relative profit growth have been positively correlated, the current message is upbeat (Chart 7). Chart 7Loan Growth Fueling The Fire
Loan Growth Fueling The Fire
Loan Growth Fueling The Fire
Chinese easy policy trifecta: credit, fiscal & monetary. Beyond the positive resolution in the U.S./China trade dispute, China has opened up its central bank liquidity tap to complement ongoing easy monetary policy. Tack on the recent monster loan origination and reaccelerating infrastructure spending and factors are falling into place for a pick up in end demand, which is a boon for U.S. capitals goods producers (Chart 8). Chart 8Heed The Chinese Reflation Message...
Heed The Chinese Reflation Message...
Heed The Chinese Reflation Message...
Upbeat signal from high frequency EM related financial market data. Emerging market stocks have been outperforming the MSCI ACW Index since early-October and even in absolute terms have troughed in late-October. The ultimate leading EM indicator, EM FX, put in a bottom in early September, sniffing out some sort of reflationary impulse. Meanwhile, momentum in the CRB raw industrials commodity index has also troughed, confirming the high-frequency EM data points. As a reminder, industrials stocks and the global commodity complex move in lockstep, and we heed the positive message all these financial market indicators are emitting (Chart 9). Chart 9...EM Financial Variables Concur
...EM Financial Variables Concur
...EM Financial Variables Concur
Downtrodden sector sentiment and compelling valuations. Despite this year’s rebound in industrial equities, sour investor sentiment appears deeply ingrained. Relative EPS breadth and oversold technical conditions are contrarily positive. Relative valuations are also beaten down and still offer a compelling entry point (Chart 10). Even on a forward P/E basis industrials are trading at a 4% discount to the broad market and below the historical average. Finally, industrials profit and revenue expectations for the coming 12-months are forecast to trail the broad market according to the sell-side community. Were our thesis to pan out, these would represent low hurdles for capital goods producers to surpass. Chart 10Underowned And Unloved
Underowned And Unloved
Underowned And Unloved
Nevertheless, there is a key macro variable, the U.S. dollar, that is a risk to our sanguine S&P industrials sector view. Chart 11 shows that the greenback and industrials sector fortunes are tightly inversely correlated. Not only is an appreciating U.S. dollar deflationary for global commodities that are priced in the reserve currency, but it also weighs on industrials P&Ls via negative translation effects. As a reminder, roughly 40% of industrials sales are international. Chart 11Rising Greenback Is A Risk
Rising Greenback Is A Risk
Rising Greenback Is A Risk
Netting it all out, the ongoing capex upcycle, resurgent credit growth, easy Chinese policy trifecta, upbeat signals from high frequency EM related financial markets and depressed technicals, all suggest that a re-rating phase looms in the S&P industrials sector. Bottom Line: Stay overweight the S&P industrials sector. The Chip Cycle Is Turning It no longer pays to be bearish chip stocks; lift the S&P semiconductors index to neutral from underweight today. There are high odds that the chip cycle will soon take a turn for the better. Global chip sales have been decelerating for 17 months and are now on the cusp of contraction (Chart 12). Over the past two decades, steep contractions have been associated with recession. Given that BCA’s view does not call for recession this year, it is highly unlikely for global semi sales to suffer a major setback. While we do not rule out a brief and shallow dip below zero similar to the 2011/12 and 2015/16 parallels, leading indicators of global semi sales suggest that a trough is near. Chart 12Global Semi Cycle...
Global Semi Cycle...
Global Semi Cycle...
Namely, BCA’s Global Leading Economic Indicator (GLEI) diffusion index is in a V-shaped recovery signaling that global growth is close to a nadir (middle panel, Chart 12). Similarly the U.S. dollar is decelerating which is a boon to global growth and conducive to higher global chip sales (trade-weighted U.S. dollar shown inverted, bottom panel, Chart 12). With regard to U.S. domiciled semi producers, a depreciating currency provides tremendous leverage to profits as foreign sourced revenues are roughly 80% of the total or twice as high compared with the SPX. Table 2, shows the one year trailing internationally- and China-derived revenues of the ten largest firms in the S&P semiconductors index, representing over 95% of the index. On a weighted basis, 80% of sales are sourced from overseas, including 36% of total sales coming from China. Clearly, global growth in general and Chinese growth in particular are key drivers of semi top line growth. Thus, any positive U.S./China trade dispute resolution would provide more relief for the S&P semi index. Table 2Semi Sales Geographical Exposure
Reflationary Or Recessionary?
Reflationary Or Recessionary?
Moreover, electronics activity is an excellent gauge for semi end-demand. The all-important Chinese electronics imports have ticked up recently. In the U.S., consumer outlays on electronics are firing on all cylinders. Taken together, there is tentative evidence that global semi demand will soon bottom (Chart 13). Chart 13...Is Turning
...Is Turning
...Is Turning
Importantly, the global semi inventory liquidation is ongoing and this supply backdrop should help balance the market. Already Asian DRAM prices, our pricing power gauge for the semi industry, are contracting, underscoring that the semi market is clearing (second & third panels, Chart 14). Importantly, global semi billings that tend to lead global semi sales by a few months have also ticked higher of late (top panel, Chart 14). Chart 14Improving Supply/Demand Dynamics
Improving Supply/Demand Dynamics
Improving Supply/Demand Dynamics
Unfortunately, none of these positive catalysts are picked up by sell-side analysts. In fact, despite the recent rebound in relative share prices, 12-month forward EPS and revenue expectations remain in free fall. Net EPS revisions are as bad as they get, and have sunk near previous troughs that have coincided with durable relative share price rallies (second panel, Chart 15). Chart 15Analysts Have Thrown In The Towel
Analysts Have Thrown In The Towel
Analysts Have Thrown In The Towel
On the relative technical and valuation fronts, pessimism reigns supreme. Our Technical Indicator hovers near one standard deviation below the historical mean and our Valuation Indicator is probing all-time lows. Interestingly, the S&P semi index sports a higher dividend yield than the SPX currently, underscoring that semi stocks are cheap (Chart 16). Chart 16Compelling Valuations And Technicals
Compelling Valuations And Technicals
Compelling Valuations And Technicals
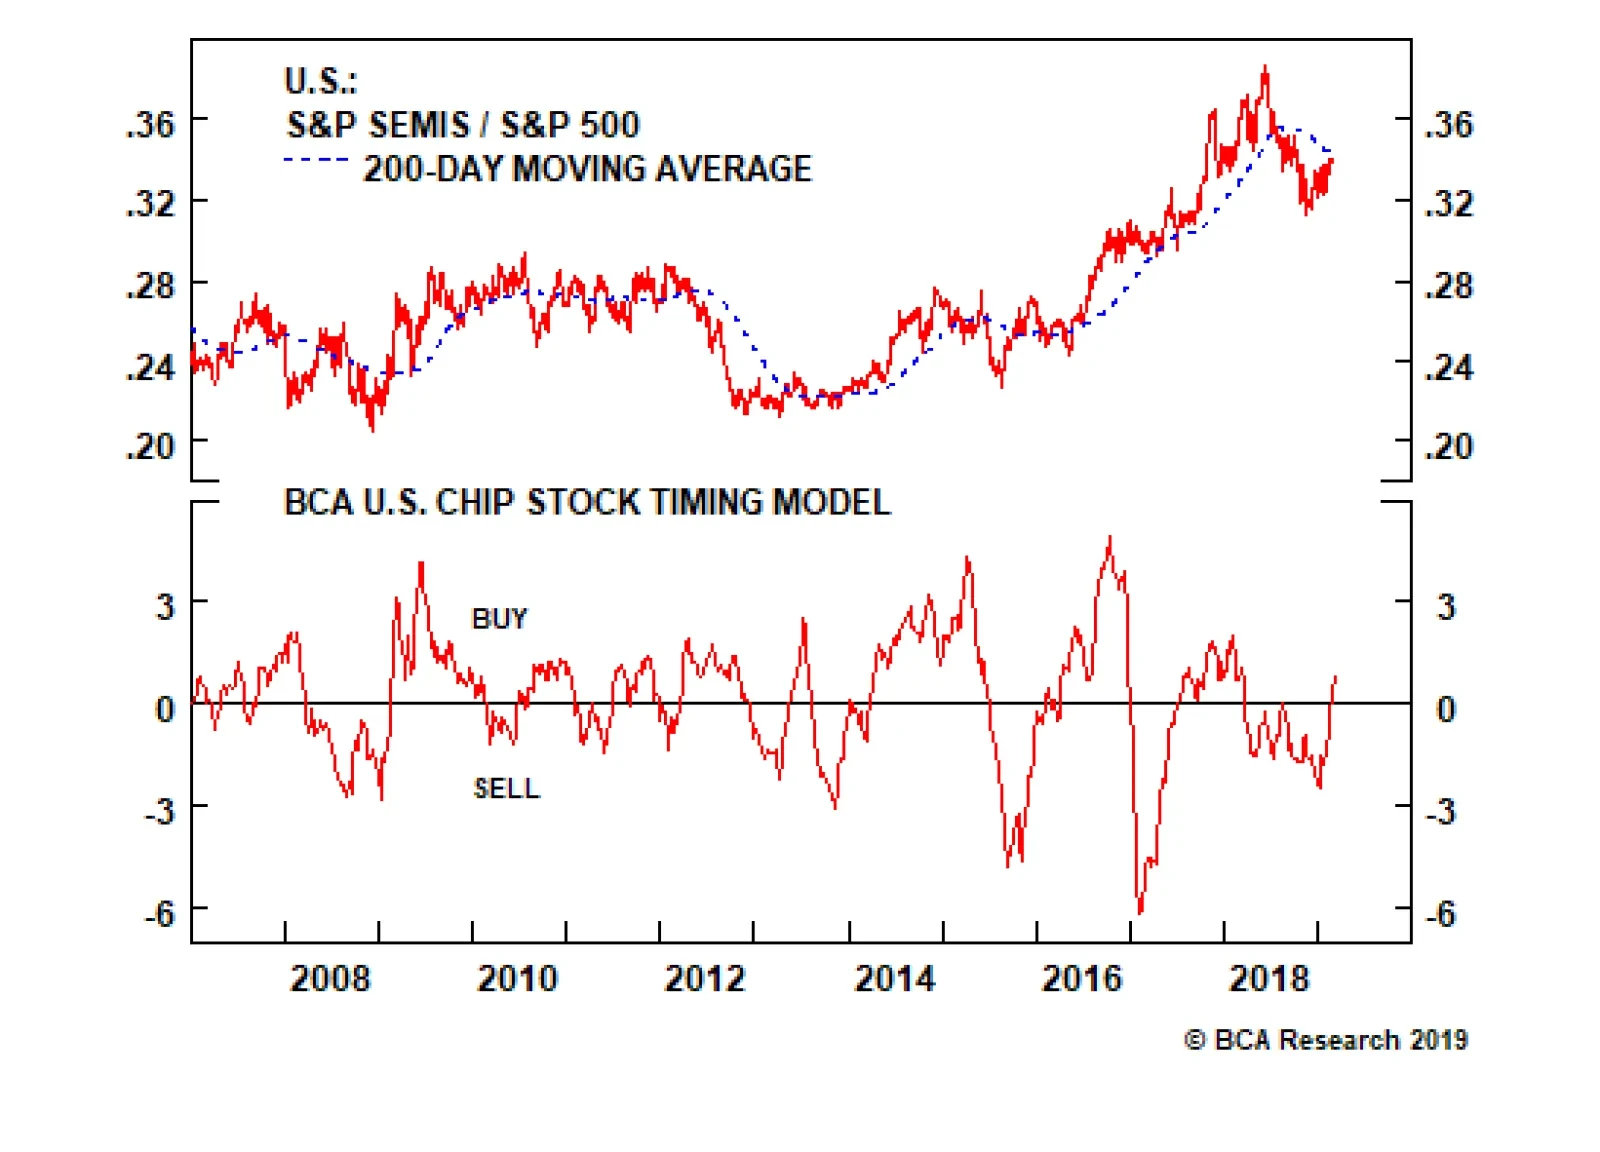
Our Chip Stock Timing Model (CSTM) does an excellent job in capturing all these moving parts and is currently sending a bullish signal (Chart 17). We heed the signal from our CSTM and are compelled to lift exposure to neutral. Chart 17Prepare To Deploy Capital
Prepare To Deploy Capital
Prepare To Deploy Capital
Bottom Line: Lift the S&P semiconductors index to neutral and it is now also on our upgrade watch list; we are looking for an opportunity to boost to overweight on a pullback, stay tuned. Finally, from a risk management perspective we are enticed to increase our trailing stop to 15% in our tactical overweight in the S&P semi equipment index, in order to protect gains. The ticker symbols for the stocks in the S&P semiconductors index are: BLBG: S5SECO – INTC, AVGO, TXN, NVDA, QCOM, MU, ADI, XLNX, AMD, MCHP, MXIM, SWKS, QRVO. Anastasios Avgeriou, Vice President U.S. Equity Strategy anastasios@bcaresearch.com Footnotes 1 Please see BCA U.S. Equity Strategy Weekly Report, “Trader’s Paradise” dated January 28, 2019, available at uses.bcaresearch.com. 2 Please see BCA U.S. Equity Strategy Weekly Report, “Don’t Fight The PBoC” dated February 4, 2019, available at uses.bcaresearch.com. Current Recommendations Current Trades Size And Style Views Favor value over growth Favor large over small caps
As this winter’s fall in bond yields boosted high dividend yielding stocks, the S&P telecom services index enjoyed a brief respite from its decade long more-or-less steady underperformance. Furthermore, the massive deflation in telco selling prices looked…
Tough Times For Telco Top Lines
Tough Times For Telco Top Lines
Tough Times For Telco Top Lines
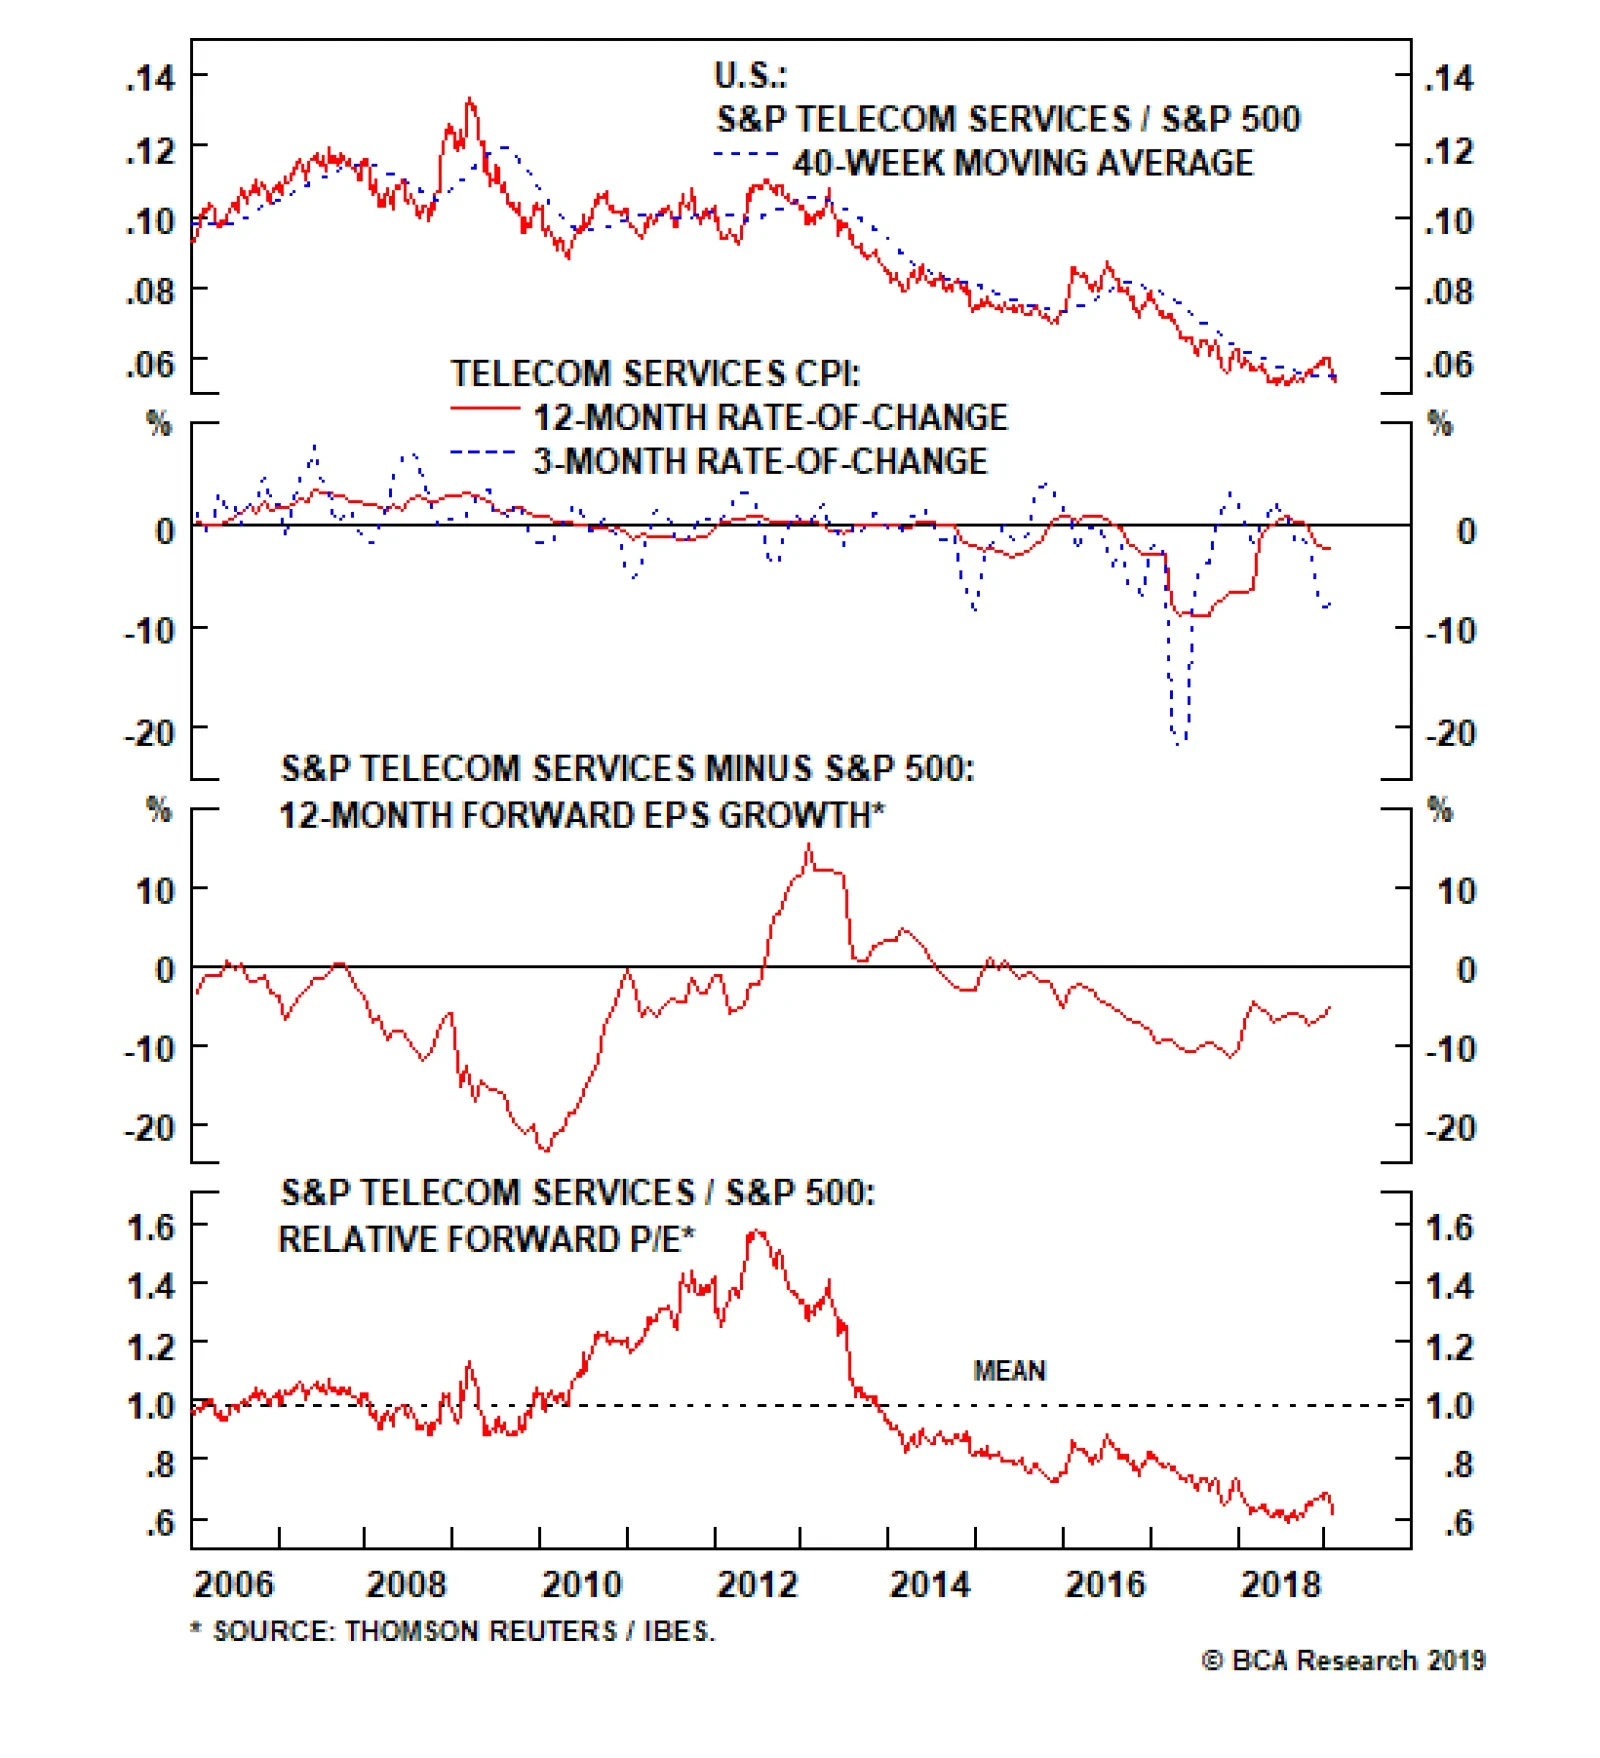
Underweight The S&P telecom services index had recently been enjoying a brief respite from their mostly steady relative performance decline over the past decade, as a fall in yields boosted these high dividend yielding stocks. Further, the massive deflation in selling prices looked like it had taken a breather (second panel). However, yields have since stabilized and selling prices have resumed their descent and the S&P telecom services index in 2019 has given up all the ground it made in the back half of 2018. Despite the negative pricing picture facing telcos, relative EPS growth has been fairly stable although estimates continue to trail the growth of the broad market (third panel). This sell side optimism seems misplaced as the current trajectory of selling prices resembles the fall in late-2016. Should a wave of downward revisions arrive, the sector’s valuation discount (bottom panel) would likely evaporate. Further, we continue to expect rates to rise in the back half of this year, adding another headwind to the troubled sector; stay underweight the S&P telecom services index. The ticker symbols for the stocks in this index are: BLBG: S5TELSX - T, VZ, CTL.