Sectors
Pharmaceutical companies have been nearly uninterruptedly raising prices for the past four decades. Higher selling prices have been synonymous with higher profits and thus, higher share prices. However, profit margins crested right after the late-1990’s…

Soft Drinks Have Gone Flat
Soft Drinks Have Gone Flat
Underweight S&P soft drinks index heavyweight Coke reported its results last week and though it beat earnings estimates, the stock offered its worst performance in more than a decade. This is despite solid pricing gains for the industry as a whole (second panel) and for Coke in particular. The reason for the fall was weak guidance for the year ahead; Coke flagged weakening EM consumer trends and currency headwinds as the key culprits behind the softening results. This jives with the pain all consumer products exporters are feeling (third panel), perhaps more acutely by Coke given the majority of their revenues are derived overseas. Regardless of a supportive pricing environment, S&P soft drinks sector EPS growth has been trailing the broad market for the better part of the last ten years (fourth panel). Even with the recent drubbing the index has taken, it continues to sport a more than 20% premium to the broad market (bottom panel). Stay underweight. The ticker symbols for the stocks in this index are: BLBG: S5SOFD - PEP, KO, DPS, MNST.

Overweight S&P Biotech
Overweight…
Highlights Equities can continue to outperform bonds for a few months longer. The pro-cyclical equity sector stance that has worked well since last October can also continue for a few months longer. Overweight pro-cyclical Sweden versus pro-defensive Denmark. The caveat is that these short-term trends are unlikely to persist and will viciously reverse later in the year. European ‘soft’ luxury goods companies are an excellent structural investment opportunity. Take profits on the 75 percent rally in Litecoin and 50 percent rally in Ethereum. Feature Why should European investors care so much about China? The Chart of the Week provides one emphatic answer. For Europe’s $500 billion basic resources sector, the three most important things in the world are: China, China, and China. Through the past decade, the share price performance of the resource behemoths BHP, Anglo American, Rio Tinto, and Glencore have been joined at the hip to China’s short-term credit impulse (Chart I-2 and Chart I-3). Chart of the WeekFor European Basic Resources, The Three Most Important Things In the World Are: China, China, And China
For European Basic Resources, The Three Most Important Things In the World Are: China, China, And China
For European Basic Resources, The Three Most Important Things In the World Are: China, China, And China
Chart I-2BHP, Anglo American, And Rio Tinto Have Been Rallying For Several Months
BHP, Anglo American, And Rio Tinto Have Been Rallying For Several Months
BHP, Anglo American, And Rio Tinto Have Been Rallying For Several Months
Chart I-3BHP Is Joined At The Hip To China's Short-Term Credit Impulse
BHP Is Joined At The Hip To China's Short-Term Credit Impulse
BHP Is Joined At The Hip To China's Short-Term Credit Impulse
But China has a much deeper importance to Europe. According to Mario Draghi, the recent cycle in Europe is ‘made in China’. On the euro area’s domestic fundamentals, Draghi is upbeat, citing “supportive financing conditions, favourable labour market dynamics and rising wage growth”. Yet the economic data have continued to be weaker than expected. Why? Draghi blames a “slowdown in external demand” and specifically, vulnerabilities in emerging markets. He claims that as soon as there is clarity on the exports and the trade sector, much of the euro area’s weakness will wash out. Federal Reserve Chairman, Jay Powell presented a remarkably similar narrative to justify the recent pause in the Fed’s sequential rate hikes: “The U.S. economy is in a good place… but growth has slowed in some major foreign economies.” If Powell claims that the U.S. domestic economy is in a good place and Draghi points out that the euro area domestic fundamentals are fine, then the explanation for what has happened – and what will happen – can only come from one place: China. Optimistically, Draghi adds: “everything we know says that China’s government is actually taking strong measures to address the slowdown.” The good news is that we can independently corroborate Draghi’s optimism, at least in the near-term (Chart I-4). Chart I-4China's Short-Term Credit Impulse Is Up Sharply, And Commodities Have Rebounded
China's Short-Term Credit Impulse Is Up Sharply, And Commodities Have Rebounded
China's Short-Term Credit Impulse Is Up Sharply, And Commodities Have Rebounded
Why China Matters To Europe Chart I-5 shows the short-term credit impulses in the euro area, U.S., and China through the past twenty years. They are all expressed in dollars to allow an apples for apples comparison between the three major economies. The comparison reveals a fascinating transformation. The dominant short-term impulse – the one with the highest amplitude – charts the shift in global economic power and influence from Europe and the U.S. to China. Chart I-5The Shift In Global Economic Power From Europe And The U.S. To China
The Shift In Global Economic Power From Europe And The U.S. To China
The Shift In Global Economic Power From Europe And The U.S. To China
Before 2008, the short-term impulses in the euro area and the U.S. dominated. But the global financial crisis was a major turning point: the credit stimulus from China dwarfed the responses from the western economies. Then through 2009-12 the impulse oscillations from the three major economies took it in turns to dominate. For example, the 2011-12 global downturn was definitely ‘made in Europe’. However, since 2013 China has taken on the undisputed mantle of dominant impulse. Most recently, last year’s peak to trough decline in China’s short-term impulse amounted to $1 trillion, equivalent to a 1.5 percent drag on global GDP. By comparison, the declines in the euro area and the U.S. amounted to a much more modest $200 billion. Likewise, the recent rebound in the China’s short-term impulse, in dollar terms, has been much larger than the respective rebounds in the euro area and the U.S. Credit Impulses And Speeding Tickets Clients complain that they are confused by the conflicting messages from differently calculated credit impulses. So let’s digress for a moment to present a powerful analogy which should clear the confusion once and for all. Imagine you floored the accelerator pedal of your car (analogous to a huge stimulus). After a hundred metres or so, the stimulus would become very apparent. Your speed over that short sprint would have surged, and possibly have become illegal! But your average speed measured over the previous kilometre would have barely changed. Now imagine a police officer rightfully presents you with a speeding ticket. To protest your innocence, you argue that you couldn’t have floored the accelerator pedal because your average speed over the previous kilometre had barely changed! Clearly, you would never offer such a ludicrous defence for pushing the pedal to the metal. Yet when assessing the impact of an economic stimulus, it is commonplace to make the same mistake. The crucial point is that a stimulus – like flooring the accelerator pedal of your car – will barely move the needle for a longer-term rate of change, but it will become very apparent in a short-term rate of change. For this reason, financial markets never wait for the long-term rates of change to pick up. They always move up or down on the evolution of short-term rates of change. It follows that the credit impulse calculation that is most relevant is the one that provides the best explanatory power for the cycles that we actually observe in the economic and financial market data. As we described in our Special Report, “The Cobweb Theory And Market Cycles”, both the theory and evidence powerfully identify the 6-month credit impulse as the one with the best explanatory power for the oscillations that we actually observe in the economy and markets.1 For the sceptics, the charts in this report should finally dispel any lingering doubts. China’s 6-month impulse gives a spookily perfect explanation for the industrial commodity inflation cycle, and thereby the share price performance of the basic resources sector, as well as the other classically cyclical sectors (Chart I-6 and Chart I-7). Chart I-6China's Short-Term Impulse Perfectly Explains Industrial Commodity Inflation
China's Short-Term Impulse Perfectly Explains Industrial Commodity Inflation
China's Short-Term Impulse Perfectly Explains Industrial Commodity Inflation
Chart I-7Semiconductors Are A Modern Day Cyclical
Semiconductors Are A Modern Day Cyclical
Semiconductors Are A Modern Day Cyclical
The good news is that China’s short-term impulse has indisputably been in a mini-upswing in recent months, and this is the reason that the classical cyclical sectors have simultaneously rebounded or, at the very least, stabilised. The bad news is that the shelf-life of such mini-upswings averages no more than eight months or so. Intuitively, this is because just as you cannot accelerate your car indefinitely, it is likewise impossible to stimulate credit growth indefinitely. The investment conclusion is that the pro-cyclical equity sector stance that has worked well since last October can continue for a few months longer. This sector stance necessarily impacts regional and country allocation. For example, it is still right to be overweight pro-cyclical Sweden versus pro-defensive Denmark (Chart I-8 and Chart I-9). Chart I-8Overweight Pro-Cyclical Sweden Versus Denmark...
Overweight Pro-Cyclical Sweden Versus Denmark...
Overweight Pro-Cyclical Sweden Versus Denmark...
Chart I-9...And Versus Norway
...And Versus Norway
...And Versus Norway
From an asset allocation perspective, it means that equities can continue to outperform bonds for the time being. But the caveat is that these short-term trends are unlikely to persist, and most likely, they will viciously reverse later in the year. Stay tuned for the signal to switch. Stay Structurally Overweight ‘Soft’ Luxuries A common question we get concerns the European luxury goods sector: is it, just like the basic resources sector, a direct play on China’s growth cycle? The answer is no. Recently, the connection between the fortunes of ‘soft’ luxury goods brands like LVMH, Hermes, and Kering and China’s growth cycle has been weak (Chart I-10). Broadly, this is also true for ‘hard’ luxury brands – for example, luxury watches – like Richemont (Chart I-11). Chart I-10European 'Soft' Luxuries Are No Longer A China Play...
European 'Soft' Luxuries Are No Longer A China Play...
European 'Soft' Luxuries Are No Longer A China Play...
Chart I-11...Neither Are European 'Hard' Luxuries
...Neither Are European 'Hard' Luxuries
...Neither Are European 'Hard' Luxuries
As we highlighted in Buying European Clothes: An Investment Megatrend, the much bigger driver for the ‘soft’ luxury brands is the structural increase in female labour participation rates, and the feminisation of consumer spending. We expect this trend to persist for the next decade.2 Hence, we are happy to buy and hold the European clothes and accessories companies with a dominant or significant exposure to women’s clothes and/or accessories; provided they have a top-end brand (or brands) giving pricing power, and mitigating the very strong deflation in clothes prices. In summary, while European basic resources are a good tactical investment opportunity, European ‘soft’ luxury goods companies are an excellent structural investment opportunity. Fractal Trading System* We are delighted to report that the fractal trading system perfectly identified the sharp recent rebound in cryptocurrencies. Our long Litecoin and Ethereum position has hit its 60 percent profit target with Litecoin up 75 percent and Ethereum up 50 percent since trade initiation on December 19. Additionally, long industrials versus utilities has also hit its profit target. With no new trades this week, the fractal trading system now has five open positions. For any investment, excessive trend following and groupthink can reach a natural point of instability, at which point the established trend is highly likely to break down with or without an external catalyst. An early warning sign is the investment’s fractal dimension approaching its natural lower bound. Encouragingly, this trigger has consistently identified countertrend moves of various magnitudes across all asset classes. Chart I-12
Litecoin Is Oversold On A 65-Day Horizon
Litecoin Is Oversold On A 65-Day Horizon
The post-June 9, 2016 fractal trading model rules are: When the fractal dimension approaches the lower limit after an investment has been in an established trend it is a potential trigger for a liquidity-triggered trend reversal. Therefore, open a countertrend position. The profit target is a one-third reversal of the preceding 13-week move. Apply a symmetrical stop-loss. Close the position at the profit target or stop-loss. Otherwise close the position after 13 weeks. Use the position size multiple to control risk. The position size will be smaller for more risky positions. * For more details please see the European Investment Strategy Special Report “Fractals, Liquidity & A Trading Model,” dated December 11, 2014, available at eis.bcaresearch.com Dhaval Joshi, Senior Vice President Chief European Investment Strategist dhaval@bcaresearch.com Footnote 1 Please see the European Investment Strategy Special Report “The Cobweb Theory And Market Cycles” January 11, 2018 available at eis.bcaresearch.com 2 Please see the European Investment Strategy Special Report “Buying European Clothes: An Investment Megatrend” December 6, 2018 available at eis.bcaresearch.com Fractal Trading System Recommendations Asset Allocation Equity Regional and Country Allocation Equity Sector Allocation Bond and Interest Rate Allocation Currency and Other Allocation Closed Fractal Trades Trades Closed Trades Asset Performance Currency & Bond Equity Sector Country Equity Indicators Bond Yields Chart II-1Indicators To Watch - Bond Yields
Indicators To Watch - Bond Yields
Indicators To Watch - Bond Yields
Chart II-2Indicators To Watch - Bond Yields
Indicators To Watch - Bond Yields
Indicators To Watch - Bond Yields
Chart II-3Indicators To Watch - Bond Yields
Indicators To Watch - Bond Yields
Indicators To Watch - Bond Yields
Chart II-4Indicators To Watch - Bond Yields
Indicators To Watch - Bond Yields
Indicators To Watch - Bond Yields
Interest Rate Chart II-5Indicators To Watch - Interest Rate Expectations
Indicators To Watch - Interest Rate Expectations
Indicators To Watch - Interest Rate Expectations
Chart II-6Indicators To Watch - Interest Rate Expectations
Indicators To Watch - Interest Rate Expectations
Indicators To Watch - Interest Rate Expectations
Chart II-7Indicators To Watch - Interest Rate Expectations
Indicators To Watch - Interest Rate Expectations
Indicators To Watch - Interest Rate Expectations
Chart II-8Indicators To Watch - Interest Rate Expectations
Indicators To Watch - Interest Rate Expectations
Indicators To Watch - Interest Rate Expectations
...Pharmas Pain
...Pharmas Pain
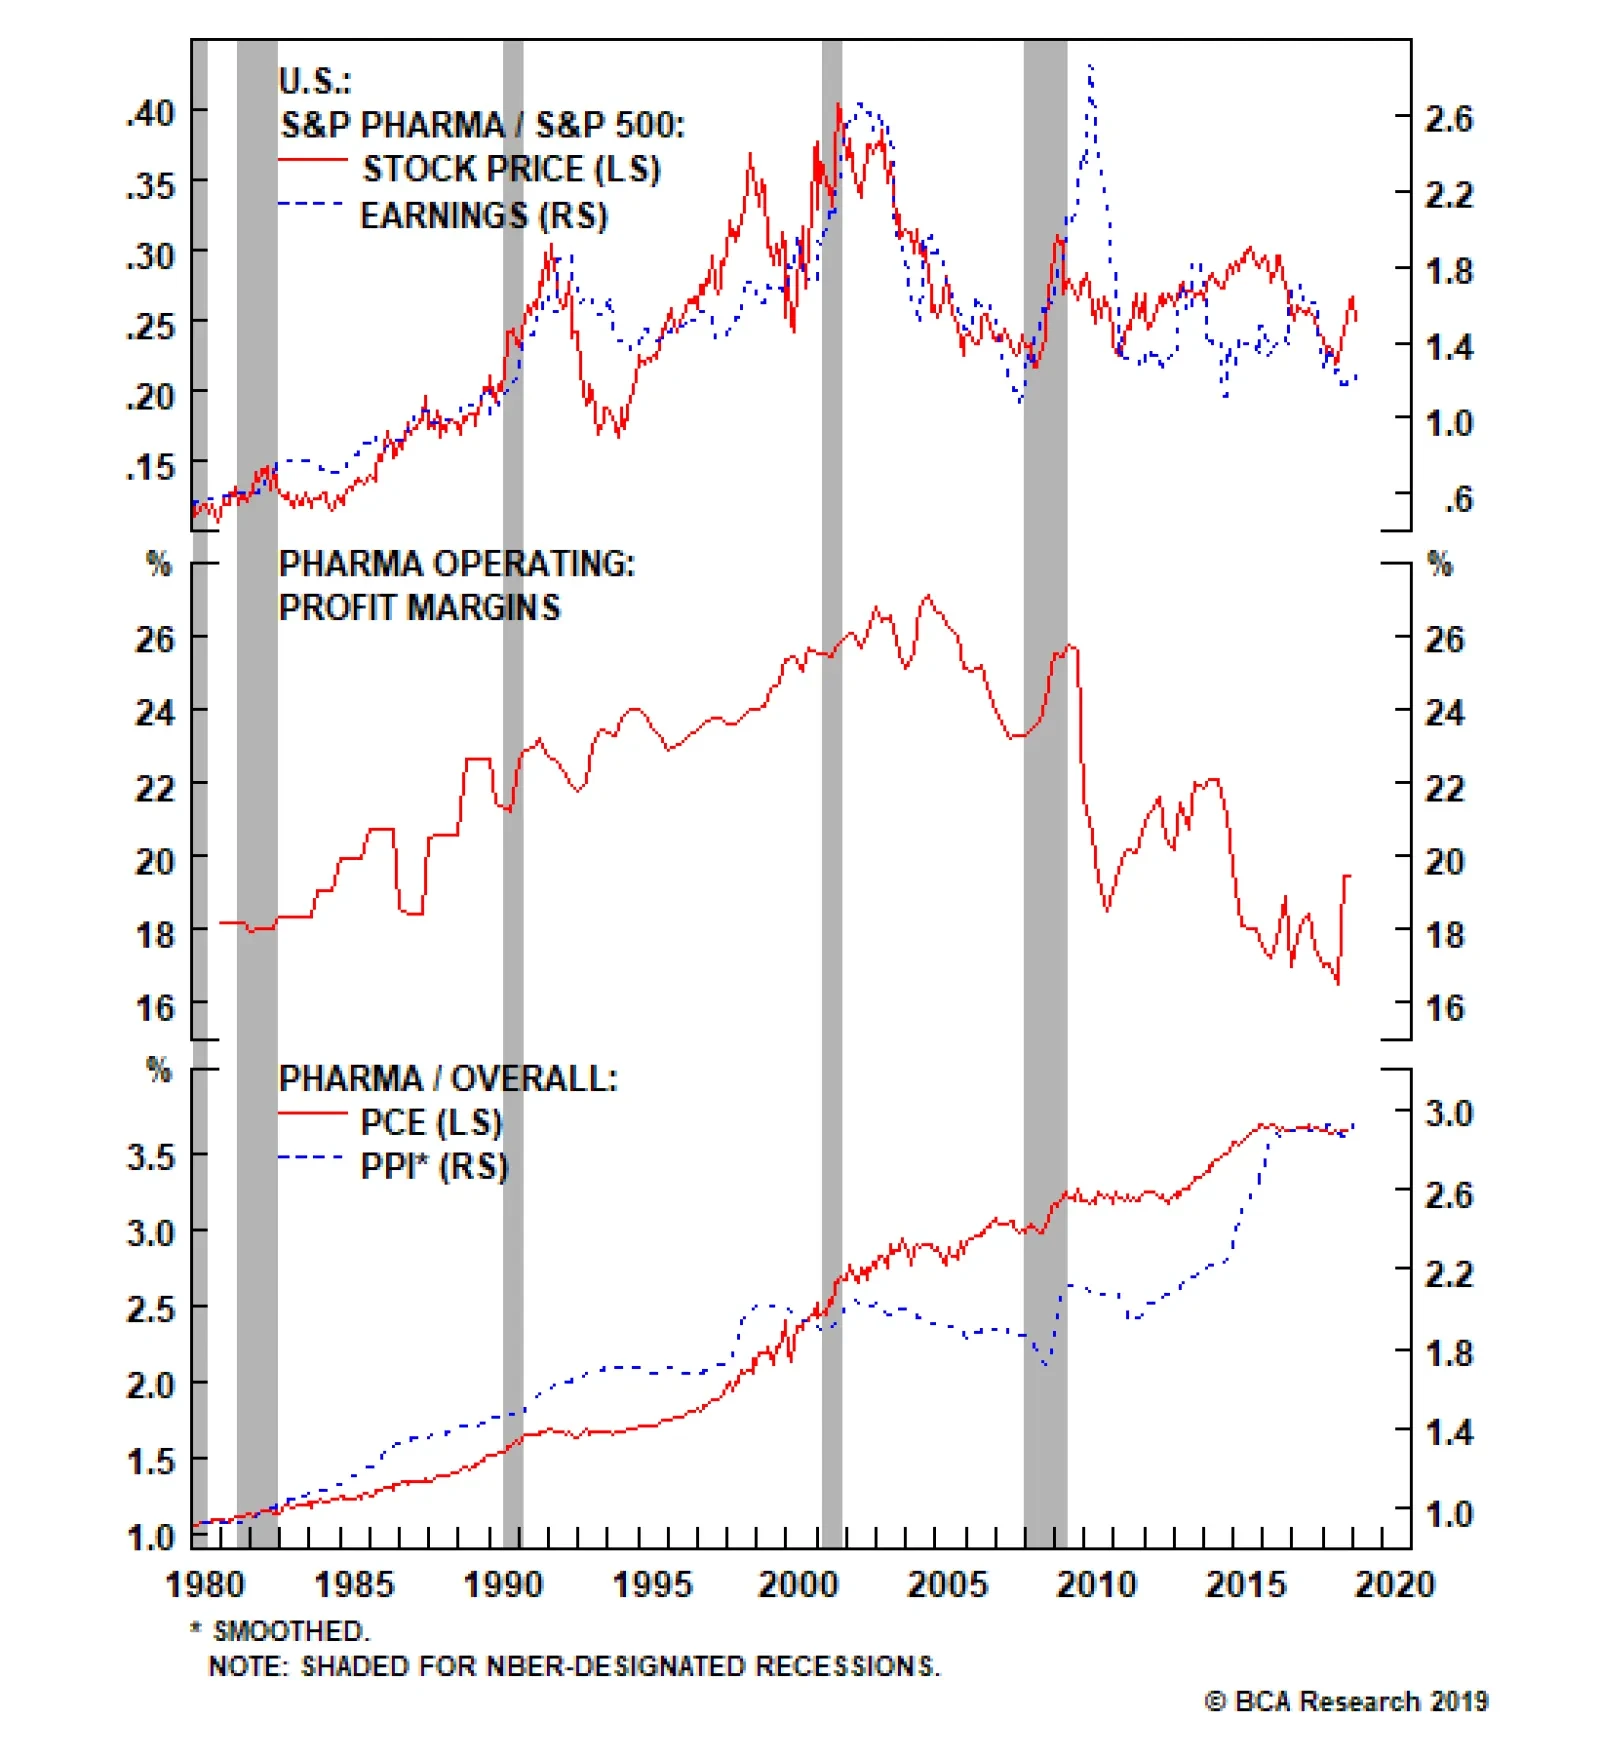
Underweight In mid-2017, we went underweight the S&P pharma index and booked healthy gains roughly a year later when we lifted exposure to neutral. Since then, Big Pharma has enjoyed a reprieve on the back of congressional inaction and the fact that the Trump Administration’s drug pricing wrath was less severe than initially feared. However, the time has come to trim the S&P pharma index to underweight. The top panel shows that pharmaceutical companies have been nearly uninterruptedly raising prices for the past four decades. Higher selling prices have been synonymous with higher profits and thus higher share prices. However, profit margins crested in the midst of the late-1990’s M&A boom and have never reclaimed their previous zenith (middle panel). Neither have relative share prices. Worryingly, pharma prices have hit a wall during the past four years and can barely keep up with overall inflation, despite still being opaque (bottom panel). As both Democrats and Republicans are united to bring down health care costs in general and drug prices in particular, pharma profits will likely suffer a secular downdraft. The implication is that, as pharma revenues erode they will deal a blow to profits. Consequently, the outlook for relative share prices is dim. Bottom Line: We trimmed the S&P pharma index to underweight yesterday; please see our Weekly Report for more details. The ticker symbols for the stocks in this index are: BLBG: S5PHAR – JNJ, PFE, MRK, LLY, BMY, ZTS, AGN, MYL, NKTR, PRGO.
Biotechs Gain Is...
Biotechs Gain Is...
Overweight Biotech stocks have been the center of attention recently as the BMY/CELG deal put the whole sector in play, and yesterday we boosted exposure to overweight in the S&P biotech index. We doubt the merger mania is over and we continue to believe that more mega deals are in store, either intra or inter-industry, with Big Pharma hungry and in a hurry to replenish their drug pipeline. In our Weekly Report, we highlight a number of positive catalysts that can propel the S&P biotech index higher but surprisingly, the sell-side community does not share our enthusiasm. Relative profit growth is forecast to be nil in the next year. In the coming five years, biotech stocks are expected to trail the overall market’s profit growth by 4%/annum (second panel, Chart 8). This is extremely pessimistic and a first in the 24-year history of the I/B/E/S data set, and it is contrarily positive. Relative revenue growth forecasts are also grim for the upcoming 12 months and both revenue and profit forecasts present low hurdles to overcome (third panel). Meanwhile, from a valuation perspective, the S&P biotech index trades at a 25% discount to the SPX forward P/E and well below the historical mean (bottom panel). Bottom Line: We lifted the S&P biotech index to overweight yesterday; please see our Weekly Report for more details. The ticker symbols for the stocks in this index are: BLBG: S5BIOT – ABBV, AMGN, GILD, BIIB, CELG, VRTX, REGN, ALXN, INCY.
Highlights Portfolio Strategy The path of least resistance is higher for the broad equity market on the back of a reflationary impulse and a less dogmatic Fed. Now that the SPX forward EPS bar has been lowered to the ground, upward surprises loom, especially if the third catalyst we have been highlighting in recent research materializes: a positive resolution to the U.S./China trade spat. The recent M&A fever, a less dogmatic Fed that has suppressed the 10-year Treasury yield and a pick up in the U.S. credit impulse can serve as catalysts to unlock excellent value in the S&P biotech index. Upgrade to overweight. A profit margin squeeze on the back of soft pharma pricing power, weak operating conditions and a race to buy out biotech stocks to build up drug pipelines warn that the derating phase has just began for the S&P pharma index. Downgrade to underweight. Recent Changes Boost the S&P biotech index to overweight today. Trim the S&P pharma index to underweight today. Table 1
Reflating Away
Reflating Away
Featured The S&P 500 has been flirting with its 200 day moving average and once it categorically clears this hurdle there are high odds that previous resistance will turn into support. The next important level is 2,800, as we highlighted in recent research, a level where the SPX failed numerous times last year.1 Encouragingly, the character of the market has changed from December’s extreme daily weakness to this year’s significant daily resilience. As we first posited on January 18, while everyone is looking for a retest to re-enter the equity market, we already had the retest in December and are now in a slingshot recovery eerily similar to the 2016 and 1998 episodes.2 Importantly, what has changed since the post-December Fed meeting carnage is that the bond market has completely priced out Fed hikes for 2019 and the 10-year Treasury yield is 15bps lower. Chart 1 highlights this reflationary backdrop for U.S. stocks. Our proprietary Reflation Gauge (RG, comprising oil prices, interest rates and the U.S. dollar) is probing levels last hit in 2012. Historically, our RG and equity momentum have been joined at the hip and the current message is to expect a rebound in the latter. Chart 1Heed The Reflation Message
Heed The Reflation Message
Heed The Reflation Message
The latest ISM manufacturing survey also corroborates the signal from our RG. The jump in the ISM new orders-to-inventories ratio underscores that the rebound in stocks has further to run (bottom panel, Chart 1). Granted, a lot rests on EPS and in order for stocks to propel to fresh all-time highs later this year, as we expect, profits will have to deliver. On that front, despite recent steep downward EPS revisions across the board, we believe the level of quarterly EPS will hit fresh all-time highs in the back half of the year, carrying stocks into uncharted territory (Chart 2). As a reminder, BCA’s view remains that the U.S. will avoid recession in 2019. Chart 2Joined At The Hip
Joined At The Hip
Joined At The Hip
One key profit driver that has put pressure on recent earnings releases and will continue to weigh on internationally-exposed P&Ls is the greenback. With a delayed effect, the first two quarters of this year should bear the brunt of last year’s steep U.S. dollar climb, but that effect will reverse in the back half of 2019. Not only is the greenback inversely correlated with the SPX, but also with the global manufacturing PMI (trade-weighted U.S. dollar shown inverted and advanced, Chart 3). Chart 3Dollar The Reflator...
Dollar The Reflator...
Dollar The Reflator...
Thus, the greenback is a key macro variable that we are closely monitoring. On that front, global U.S. dollar based liquidity is one of the most important determinants/drivers of global growth. The longer U.S. dollar liquidity gets drained, the more downward pressure it will put on SPX momentum and SPX EPS (Chart 4). Once U.S. dollar based liquidity starts to get replenished at the margin, it can serve as a catalyst for a global growth recovery. A Fed tightening cycle pause and recent acknowledgment that the balance sheet asset roll off is important and the Fed stands ready to tweak it, are a net positive for at least a trough in global U.S. dollar liquidity. Chart 4...But Watch Global Dollar Liquidity
...But Watch Global Dollar Liquidity
...But Watch Global Dollar Liquidity
Adding it up, the path of least resistance is higher for the broad equity market on the back of a reflationary impulse and a less dogmatic Fed. Now that the SPX forward EPS bar has been lowered to the ground, upward surprises loom, especially if the third catalyst we have been highlighting in recent research materializes: a positive resolution to the U.S./China trade spat.3 This week we make a couple of subsurface changes to a defensive sector; these changes do not alter our recommended benchmark allocation to the overall sector. Biotech’s Gain Is... Biotech stocks have been the center of attention recently as the BMY/CELG deal put the whole sector in play, and today we are boosting exposure to overweight in the S&P biotech index. We doubt the merger mania is over and we continue to believe that more mega deals are in store, either intra or inter-industry, with Big Pharma hungry and in a hurry to replenish their drug pipeline. While this is not the sole reason for an above benchmark allocation, 50-60% M&A deal premia are a boon for investors (Chart 5). Chart 5M&A Frenzy
M&A Frenzy
M&A Frenzy
From a long-term macro perspective biotech stocks have been the primary beneficiaries of the 35-year bond bull market. In other words, the multi-decade grind lower in the U.S. Treasury yield has been synonymous with biotech outperformance (10-year U.S. Treasury yield shown inverted, Chart 6). Chart 6Biotech Equities And Rates Move In Opposite Direction
Biotech Equities And Rates Move In Opposite Direction
Biotech Equities And Rates Move In Opposite Direction
The Fed’s recent monetary policy U-turn is a welcome development and these high growth stocks will benefit from the 55bps fall in the 10-year Treasury yield since the early-November peak. In addition, another macro tailwind is working in the S&P biotech index’s favor. The resurgent U.S. credit impulse is unambiguously bullish for this health care index that excels when margin debt availability is rising and liquidity is plentiful (bottom panel, Chart 7). Chart 7Revving Credit Impulse Says Buy Biotech Stocks
Revving Credit Impulse Says Buy Biotech Stocks
Revving Credit Impulse Says Buy Biotech Stocks
Surprisingly, the sell-side community does not share our enthusiasm on any of these positive catalysts. Relative profit growth is forecast to be nil in the next year. In the coming five years, biotech stocks are expected to trail the overall market’s profit growth by 4%/annum (middle panel, Chart 8). This is extremely pessimistic and a first in the 24-year history of the I/B/E/S data set, and it is contrarily positive. Relative revenue growth forecasts are also grim for the upcoming 12 months and both revenue and profit forecasts present low hurdles to overcome (fourth panel, Chart 8). Chart 8Analysts Have Thrown In The Towel
Analysts Have Thrown In The Towel
Analysts Have Thrown In The Towel
With regard to technicals and valuations, investors are doubtful that biotech stocks can stage a playable turnaround. Cyclical momentum remains moribund, printing below the zero line. Meanwhile, the S&P biotech index trades at a 25% discount to the SPX forward P/E and well below the historical mean (second & bottom panels, Chart 8). Chart 9 shows that biotech stocks are also cheap on a relative dividend yield basis. The S&P biotech index has been so oversold that it now sports a dividend yield higher than the S&P 500. Nevertheless, there is one key risk we are closely monitoring. Biotech initial public offerings are at all-time highs, with private equity and venture capital funds rushing for the exit doors. This is worrisome as it offsets the supply reduction owing to the M&A fever and has historically coincided with biotech relative share price peaks (Chart 10). Chart 9Compelling Relative Value
Compelling Relative Value
Compelling Relative Value
Chart 10Watch This Risk
Watch This Risk
Watch This Risk
Netting it all out, the recent M&A fever, a less dogmatic Fed that has suppressed the 10-year Treasury yield and a pick up in the U.S. credit impulse can serve as catalysts to unlock excellent value in the S&P biotech index. Bottom Line: Boost the S&P biotech index to overweight today. The ticker symbols for the stocks in this index are: BLBG: S5BIOT – ABBV, AMGN, GILD, BIIB, CELG, VRTX, REGN, ALXN, INCY. …Pharma’s Pain In mid-2017 we went underweight the S&P pharma index and booked healthy gains roughly a year later when we lifted exposure to neutral. Since then, Big Pharma has enjoyed a reprieve on the back of congressional inaction and the fact that the Trump Administration’s drug pricing wrath was less severe than initially feared. However, the time has come to trim the S&P pharma index to underweight. Chart 11 shows that pharmaceutical companies have been nearly uninterruptedly raising prices for the past four decades. Higher selling prices have been synonymous with higher profits and thus higher share prices. Chart 11Margin Trouble
Margin Trouble
Margin Trouble
But, something happened in the new millennium. Relative performance peaked as pharma embarked on a mega M&A boom in the late-1990s with the Pfizer/Warner Lambert deal breaking all-time industry M&A records. Why? Because profit margins crested and have never reclaimed their previous zenith (top and middle panels, Chart 11). Neither have relative share prices. Worryingly, pharma prices have hit a wall during the past four years and can barely keep up with overall inflation, despite still being opaque (bottom panel, Chart 11). As both Democrats and Republicans are united to bring down health care costs in general and drug prices in particular, pharma profits will likely suffer a secular downdraft. The implication is that, as pharma revenues erode they will deal a blow to profits. Consequently, the outlook for relative share prices is dim. Importantly, pharma executives have not been frugal enough to offset the soft pricing power backdrop. Headcount has been expanding consistently since 2012 and a wide gap has opened up relative to industry selling price inflation, akin to the one in the mid-2000s that suppressed relative share prices (Chart 12). Chart 12Pricing Power Pressure
Pricing Power Pressure
Pricing Power Pressure
Similar to the M&A boom of the late-1990s, there has been a global pharma M&A race with multiple deal announcements in the past few months, underscoring that the industry is not standing still. As Big Pharma CEOs compete to outdo their peers and buy drug pipelines mostly in the biotech space (Chart 5), they will continue to degrade the industry balance sheet (third panel, Chart 12). Our strategy is to overweight the hunted (biotech) and avoid the hunters (Big Pharma). On the operating front, a supply check reveals that pharma wholesale and manufacturing inventories are growing, whereas shipments are on the verge of contraction. Pharma industrial production has petered out and industry productivity gains are waning (Chart 13). This deteriorating operating backdrop will weigh on relative profits. Chart 13Deteriorating Operating Metrics...
Deteriorating Operating Metrics...
Deteriorating Operating Metrics...
With regard to the macro front, a vibrant U.S. economy – with the ISM manufacturing survey ticking higher and the labor market firing on all cylinders – suggests that defensive pharma relative profits will resume their downtrend (bottom panel, Chart 13). Tack on the U.S. dollar’s reversal since the November peak and defensive pharma equities will remain under pressure (second panel, Chart 14). Chart 14...But EPS Bar Is On The Floor
...But EPS Bar Is On The Floor
...But EPS Bar Is On The Floor
Nevertheless, there are three risks to our negative S&P pharma view. First, the M&A fever dies down and there are no additional purchases of biotech outfits. Second, Congress and the President drag their feet and fail to agree on new hawkish pharma pricing legislation. Finally, sell-side analysts have thrown in the towel and maybe most of the bad news is reflected in bombed out relative profit and sales growth estimates (third & fourth panels, Chart 14). In sum, a profit margin squeeze on the back of soft pharma pricing power, weak operating conditions and a race to buy out biotech stocks to build up drug pipelines warn that the derating phase (bottom panel, Chart 14) has just began for the S&P pharma index. Downgrade to underweight. Bottom Line: Trim the S&P pharma index to underweight. The ticker symbols for the stocks in this index are: BLBG: S5PHAR – JNJ, PFE, MRK, LLY, BMY, ZTS, AGN, MYL, NKTR, PRGO. Health Care Remains In The Neutral Column Despite these two subsurface health care sector moves, our overall exposure to the S&P health care sector remains intact at neutral. Please look forward to reading our upcoming research where we will be updating the S&P managed health care, S&P health care facilities and S&P health care equipment subsectors. Anastasios Avgeriou, Vice President U.S. Equity Strategy anastasios@bcaresearch.com Footnotes 1 Please see BCA U.S. Equity Strategy Weekly Report, “Trader’s Paradise” dated January 28, 2019, available at uses.bcaresearch.com. 2 Please see BCA U.S. Equity Strategy Insight Report, “Don’t Bet On A Retest” dated January 18, 2019, available at uses.bcaresearch.com. 3 Please see BCA U.S. Equity Strategy Weekly Report, “Dissecting 2019 Earnings” dated January 22, 2019, available at uses.bcaresearch.com. Current Recommendations Current Trades Size And Style Views Favor value over growth Favor large over small caps
Hospitals Are Facing Margin Pressure
Hospitals Are Facing Margin Pressure
Neutral The S&P health care facilities index was an exceptionally solid performer last year as investors sought safe harbor from the headwinds to global trade in wholly domestic stocks. This outperformance belied some deeper issues on the operating front. Hospitals’ pricing power is currently accelerating at the slowest rate since the GFC, which bodes ill for revenue growth (second panel). Tack on spiking labor costs (third panel) and the EPS growth prospects of this defensive sector appear at serious risk. However, there are a number of potential offsets to this weak picture. The first is the much lower write-offs that hospitals can expect given the generationally low unemployment rate. A second lies in declining hospital construction (bottom panel) which could serve to both bolster free cash flow despite weakening operating earnings as well as reverse the fall in pricing power if supply is constrained. Regardless of the operating picture, the S&P health care facilities index is unlikely to move dramatically in either direction without a resolution to the current trade war, either positive or negative. Net, we reiterate our neutral stance on the S&P health care facilities index. The ticker symbols for the stocks in this index are: BLBG: S5HCFA - UHS, HCA.
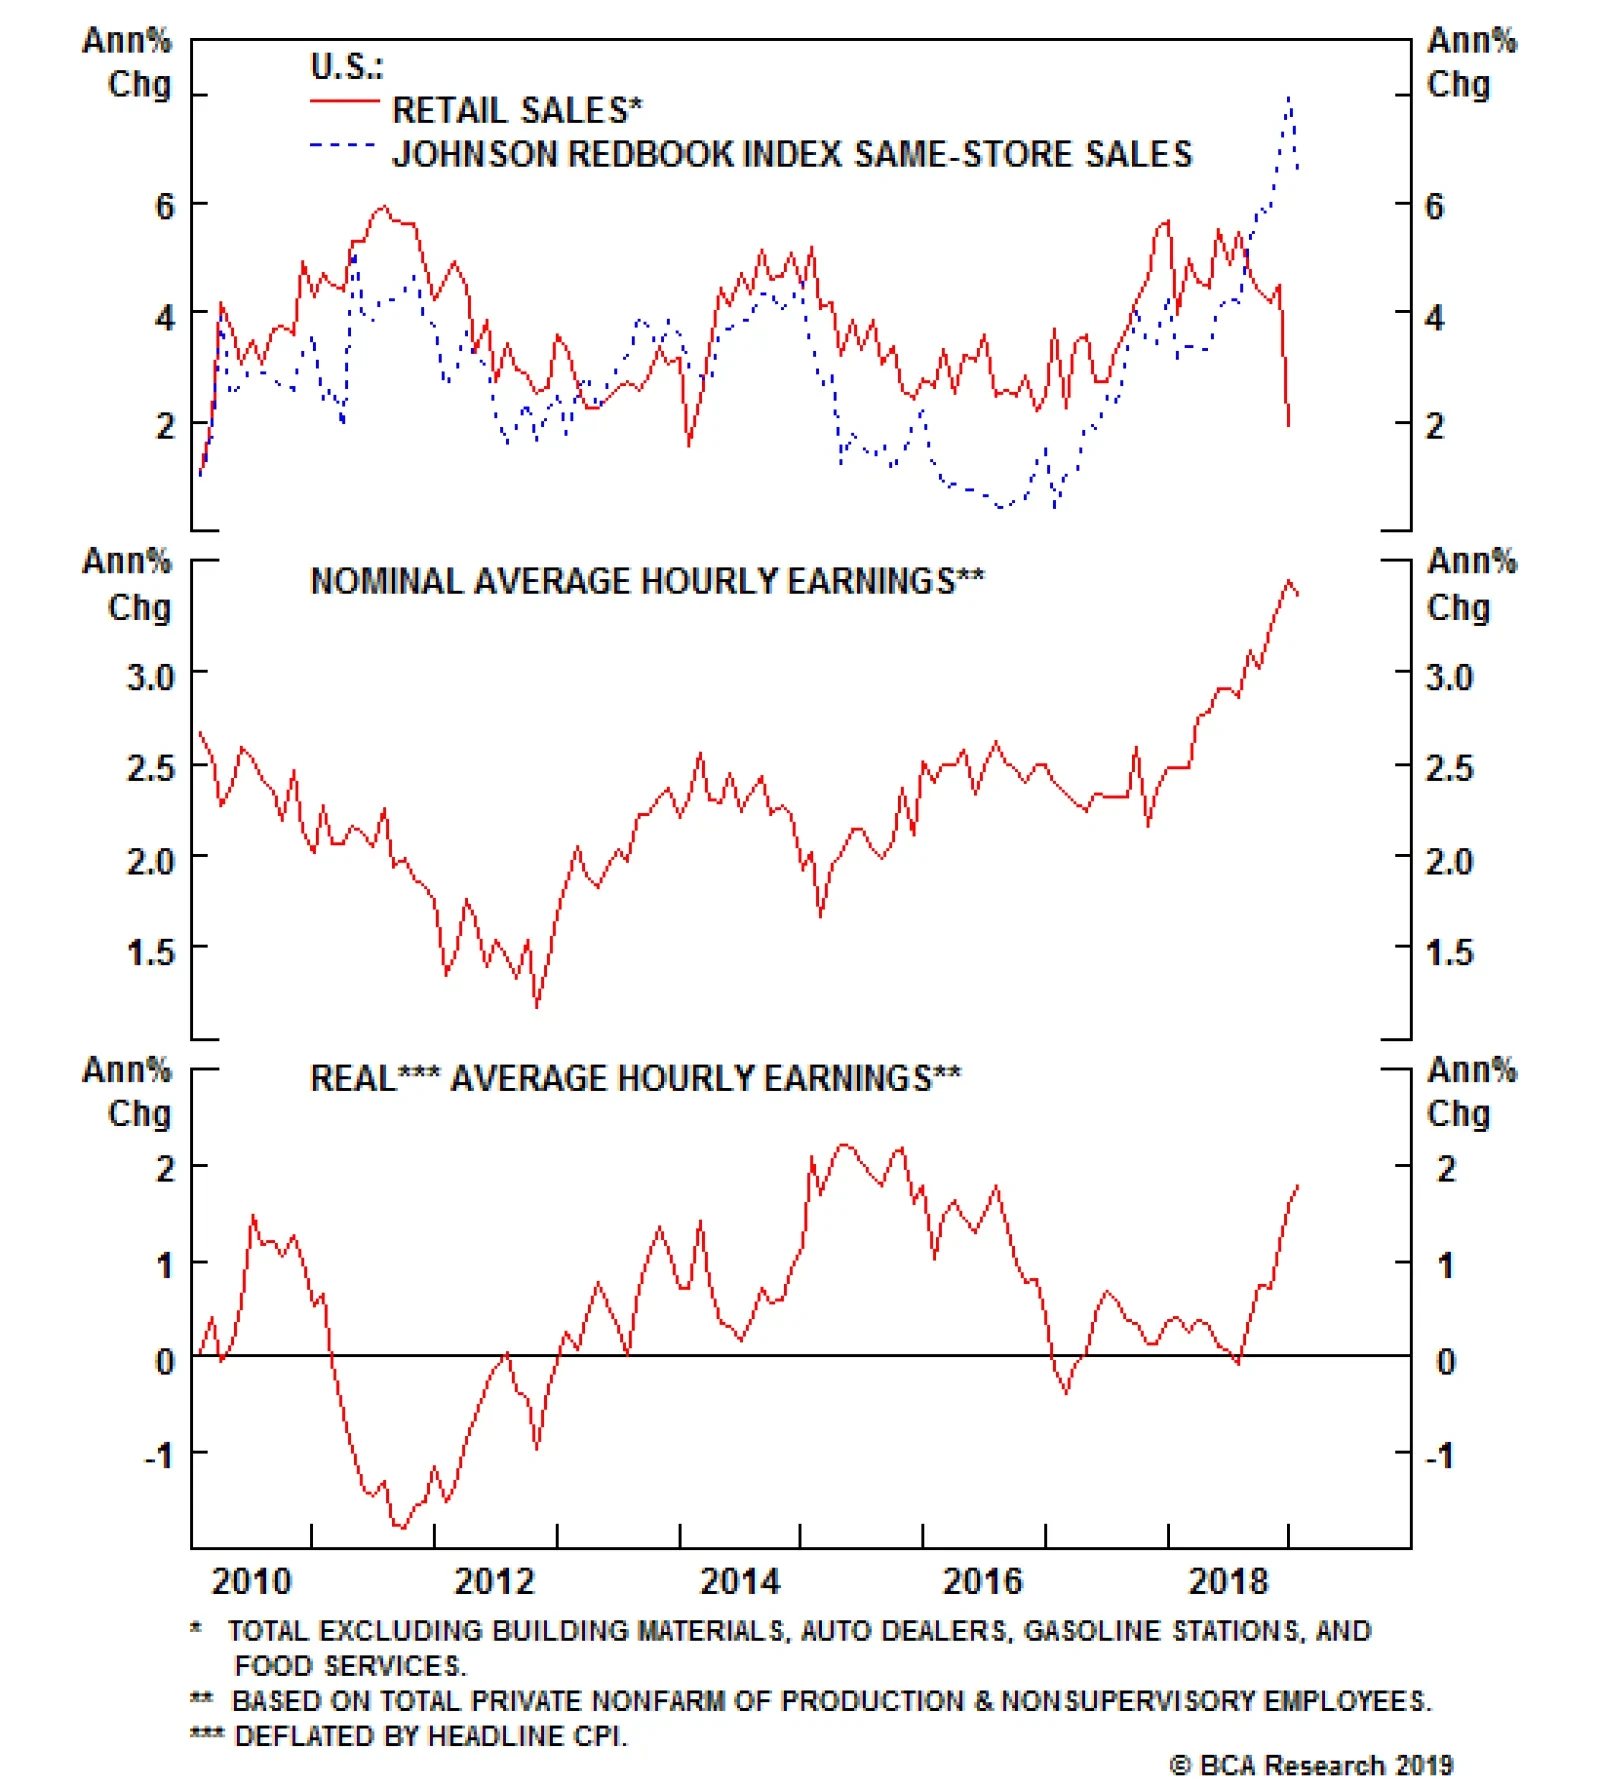
This stunningly poor retail sales number is obviously worrisome, especially as the control group, which enters in the calculation of GDP, fell sharply as well. This catastrophic dataset, along with a poor industrial production reading this morning, caused the…
Highlights In their current form and size, perpetual bonds issuance and the central bank bills swap program are unlikely game-changers for the banking system in China. However, this mechanism constitutes monetization of banks’ capital and bad assets, i.e., recapitalization of banks, by the PBoC via quantitative easing. Hence, this scheme can be presently viewed as a bazooka that has not yet been loaded by the government. If the authorities pursue this program on a large scale without forcing banks to acknowledge and write off bad assets, banks would regain power to expand their balance sheets, fostering a cyclical economic recovery. Nevertheless, the growth model based on continuous “out of thin air” money and credit expansion inevitably leads to falling productivity growth and rising inflation. Therefore, the economic outcome over the course of several years would be stagflation, which is profoundly bearish for the currency. Feature The Chinese authorities recently launched a Central Bank Bills Swap (CBS) program to boost liquidity and facilitate issuance of commercial banks’ perpetual bonds. Box I-1 on pages 12-13 elaborates on the scheme and provides more detail about the program. Under the CBS program, Chinese banks can buy each other’s perpetual bonds, then exchange these bonds for central bank bills and pledge those bills at the People Bank of China (PBoC) to receive funding. Insurance companies are also allowed to purchase perpetual bonds, but they cannot pledge them with the central bank for funding. What are the macro implications of this program? Can the government use this scheme to recapitalize the banking system? Does the CBS program amount to quantitative easing? Will it be sufficient to boost credit growth in China in 2019? We have conditional answers to these questions – i.e., they all depend on the extent to which the scheme is actually utilized by the authorities. On the one hand, the CBS program could potentially become a proverbial bazooka used by the government to recapitalize the banking system via the PBoC monetizing banks’ bad assets. By doing so, the PBoC would be expanding its balance sheet by injecting excess reserves into the banking system – i.e., quantitative easing. Consequently, it could help banks accelerate credit and money growth, in turn helping the economy. The long-run collateral damage in this scenario, however, would be an RMB depreciation. On the other hand, the authorities could limit the usage of the scheme via various regulatory approvals and norms. In such a case, the impact of the program on money/credit growth and the real economy as well as on the exchange rate would be limited. In other words, it might end up being no more than a tool to help the four large banks meet BIS's TLAC requirements. At the moment, there is not enough information to determine whether the program will be a game changer for the banking system in China, leading to a surge in credit and broader economic recovery. Both total assets and broad credit growth among banks remain very weak for now (Chart I-1). In other words, it is a bazooka that has not been loaded, and may never be loaded because of the potential for seriously negative ramifications over the long term. Chart I-1Chinese Banks: Total Assets And Broad Credit Growth
Chinese Banks: Total Assets And Broad Credit Growth
Chinese Banks: Total Assets And Broad Credit Growth
Consequently, we maintain our view that China’s growth will continue to disappoint in the first half of 2019, and that China-related plays, including many emerging markets (EM), remain at risk of a renewed selloff. Bank Recapitalization? In theory, the issuance of perpetual bonds along with the CBS program can be used to recapitalize the banking system. Each bank can buy perpetual bonds issued by other banks up to 10% of their core Tier-1 capital. These banks can get cheap financing from the PBoC by swapping these perpetual bonds with central bank bills, and then pledging those bills at the central bank to get funding. Hence, under this scheme, the PBoC will be financing purchases of perpetual bonds, which means the monetary authorities will indirectly be funding banks’ recapitalization. It is an “open secret” that Chinese banks would be considerably undercapitalized if they were forced to recognize non-performing assets. The non-performing loan (NPL) ratio currently stands at 1.9%, and the special-mention loans ratio is at 3.2%; and the sum of both is at 5.1% of total loans (Chart I-2, top panel). NPL provisions presently amount to 3.4% of total loans. Chart I-2Chinese Banks Are Massively Under-Provisioned
Chinese Banks Are Massively Under-Provisioned
Chinese Banks Are Massively Under-Provisioned
When expressed as a share of total risk-weighted assets, the aggregate NPLs and special-mention loans are equal to 4.2% (Chart I-2, bottom panel). At 2.8% of risk-weighted assets, NPL provisions are extremely inadequate. Assuming non-performing assets turn out to be 10% of total risk-weighted assets, some 40% of banks' capital would be wiped out, according to our simulation presented in Table I-1. This is after accounting for existing provisions and assuming a 20% recovery rate of non-performing assets.
Chart I-
Provided that risk-weighting assigns a zero weight to banks’ claims on the government, a 50% risk weight to claims on households and a 100% weight to claims on companies, the assumption of 10% of non-performing assets in total risk-weighted assets is reasonable. This is especially the case when the enormous credit boom of the past 10 years is taken into consideration. As a result, in this scenario the capital adequacy ratio (CAR) will drop from its current level of 13.8% to 9.4%. This will bring the CAR below the regulatory minimum of 11%. To raise the CAR to the regulatory minimum of 11%, the banking system would require RMB 2 trillion of capital. This is greater than the maximum potential demand for perpetual bonds that we estimate to be up to RMB 1.4 trillion. To estimate this number, we assumed all banks purchase perpetual bonds in amounts equal to 5% of their core Tier-1 capital and all insurance companies buy perpetual bonds in an amount equal to 5% of assets. This is not an underestimation of potential demand for perpetual bonds since there are currently limitations on banks’ ability to issue and purchase these bonds as elaborated in Box I-1 on pages 12-13. In short, it is not clear if perpetual bond issuance and the CBS will be sufficient to undertake full recapitalization of the banking system and allow banks to accelerate their balance sheet expansion to finance an economic recovery. Bottom Line: In their current form and shape, perpetual bonds and the CBS program are unlikely to be a game-changer for the banking system in China. However, if the authorities eliminate limitations and change regulatory norms, the scheme could potentially be used to recapitalize China’s banking system. This is why this scheme can presently be viewed as a bazooka that has not yet been loaded by the government. Does CBS Represent QE? Its Impact On Liquidity And Money Supply The CBS program is a form of quantitative easing (QE). It will expand the PBoC’s balance sheet and banking system liquidity (excess reserves at the central bank), as elaborated in Box I-1 and Diagram I-1 on pages 12-14. If pursued on a large scale, this scheme would constitute monetization of banks’ capital and their bad assets by the central bank. The mechanism is already in place, but the extent to which authorities will use it to recapitalize banks remains unclear. Even though the CBS program will expand banking system liquidity – i.e., excess reserves at the central bank – it will not – however - affect broad money supply. The basis is simple: Banks’ excess reserves at the central bank are not part of the broad money supply in any country. Banks use excess reserves to settle payments between one another and with the central bank. Banks do not lend out excess reserves. Further, only a central bank can create excess reserves, and it does so “out of thin air.” In brief, excess reserves rather than corporate and individual deposits constitute genuine banking system liquidity. Barring lending to or buying assets from non-banks – which does not typically occur outside of QE programs – central banks do not create broad money or deposits.1 Money/deposits, the ultimate purchasing power for economic agents, is created by commercial banks “out of thin air,” as we have discussed and illustrated in our series of reports on money, credit and savings.2 Having adequate capital and liquidity as well as positive risk appetite, banks can expand their balance sheets, i.e., originate loans and buy various securities. When banks make loans or purchase assets from non-banks, they simultaneously create deposits and new purchasing power. Chart I-3 demonstrates that in recent years, excess reserves in China’s banking system have been flat, yet banks’ assets and the supply of money has expanded tremendously. The opposite can also occur: Banks’ excess reserves can mushroom, but banks may actually be reluctant to grow their balance sheets. This was the case after the Lehman crisis with U.S. banks and in the wake of the European debt crisis with euro area banks. Chart I-3China: Excess Reserves And Broad Money
China: Excess Reserves And Broad Money
China: Excess Reserves And Broad Money
Finally, we have elaborated at great length in our past reports that China’s money and credit excesses do not stem from its high household savings rate. Rather, like any credit bubble in any country, China’s leverage is due to the creation of credit/money “out of thin air.”2 Bottom Line: Perpetual bond issuance and the CBS program will expand the banking system’s excess reserves, but not broad money supply. Besides, it is not certain that excess reserves will accelerate loan growth. Credit origination by banks depends on many other factors such as banks’ willingness to expand their risk assets, loan demand and the regulatory regime and norms. Deleveraging Has Not Yet Started One cannot discuss the potential for a monetary bazooka in China without an update on the status of deleveraging. The fact is that deleveraging in China has not even begun: Credit is still expanding faster than nominal GDP growth. The most common way to measure leverage/debt is to compare it with the cash flow that is used to service debt. Nominal GDP is a measure of cash flow in an economy from a macro perspective. The debt-to-asset ratio is a poor measure of leverage because asset valuations are often subjective: Assets are valued by debtors themselves. Besides, apart from distressed credit investors, one does not want to be a creditor to a country or company that has to sell assets to service its debt. Stock and bond prices of debtor countries or companies tailspin when the latter have to sell assets to service debt. The top panel of Chart I-4 illustrates that China’s enterprise and household domestic credit/debt is still expanding at an annual rate of close to 10% at a time when nominal GDP growth has slowed to 8%. Chart I-4China: Deleveraging Has Not Even Begun
China: Deleveraging Has Not Even Begun
China: Deleveraging Has Not Even Begun
Consistently, the debt to GDP ratio has not declined at all (Chart I-4, bottom panel). In this context, a rhetorical question is in order: Should China ramp up money/credit growth and monetize banks’ NPLs, given that deleveraging has yet to take place? Economic Ramifications Of Deploying The Bazooka What would be the economic ramifications if the Chinese authorities once again promote and allow unrelenting money/credit expansion “out of thin air” to bail out zombie banks and companies? Cyclically: If the authorities compel banks to acknowledge NPLs and write them off as and when the PBoC finances their recapitalization, banks may not be in a position to accelerate loan growth. This scenario entails that credit growth and hence cyclical sectors in China would remain weak for a while. In contrast, if the authorities pursue recapitalization of banks without forcing them to acknowledge and write off bad assets, banks would regain their power to expand their balance sheets, fostering a cyclical economic recovery. Structurally (in the long term): The growth model based on continuous “out of thin air” money and credit expansion inevitably breeds economic inefficiencies, falling productivity growth and rising inflation. In short, the economic outcome over the course of several years would be stagflation. Chart I-5 illustrates that China’s ICOR (incremental capital-to-output ratio) is rising, or inversely that the output-to-capital ratio is falling. This entails worsening economic efficiency and slowing productivity growth. Chart I-5Symptoms Of Rising Inefficiencies
Symptoms Of Rising Inefficiencies
Symptoms Of Rising Inefficiencies
Chart I-6 shows a potential stylized roadmap for the Chinese economy in the years ahead if the credit and money bubbles are inflated further without corporate restructuring, bankruptcies, the imposition of hard budget constraints and meaningfully improved capital/credit allocation. The red line represents potential GDP growth, and the dotted red line is our projection.
Chart I-6
In any economy, the potential growth rate is equal to the sum of growth rates of the labor force and productivity. China’s labor force is no longer expanding and will begin shrinking in the coming years (Chart I-7). Hence, going forward, the sole source of potential GDP growth in China will be productivity growth. Productivity growth has been slowing and will continue to do so if structural market-oriented reforms are not implemented (Chart I-8, top panel). Besides, the industrialization ratio has already risen a lot (Chart I-8, bottom panel). Chart I-7China: No Tailwind From Labor Force
China: No Tailwind From Labor Force
China: No Tailwind From Labor Force
Chart I-8China: Productivity Is Slowing
China: Productivity Is Slowing
China: Productivity Is Slowing
With the potential GDP growth rate in China declining, future fiscal and credit stimulus may lead to higher nominal – but not real – growth. The latter will be constrained by a slowing rate of potential real GDP growth. Higher nominal but weaker potential (real) growth entails rising inflation. The combination of higher inflation along with the need to maintain very low nominal interest rates to assist debtors is bearish for the currency. In such a scenario, there will be intensifying depreciation pressure on the yuan from the tremendous overhang of RMBs in the banking system (Chart I-9). The PBoC’s foreign exchange reserves of $3 trillion will not be sufficient to backstop the enormous amount of RMB (money) supply of RMB 210 trillion – which is equivalent to US$30 trillion (Chart I-10). Chart I-9Helicopter Money In China
Helicopter Money In China
Helicopter Money In China
Chart I-10PBoC FX Reserves Are Equal To 10% Of Broad Money Supply
PBoC FX Reserves Are Equal To 10% Of Broad Money Supply
PBoC FX Reserves Are Equal To 10% Of Broad Money Supply
If broad money supply continues to expand at an annual rate of close to 9-10% or above, downward pressure on the yuan will escalate immensely, and the Chinese authorities will have no choice but to close the capital account completely and also heavily regulate current account transactions. Bottom Line: If the authorities do not restrain the PBoC’s financing of perpetual bond issuance via the CBS and in the interim do not force banks to write off bad assets, the upshot will be the monetization of banks’ bad assets by the PBoC. This will constitute the ultimate socialist put for banks and zombie debtors, as well as for the entire economy. Business cycle swings, bankruptcies and deflation are inherent features of a market-driven/capitalist economy. A socialist put via promoting unlimited money and credit creation entails long-term stagflation – lower productivity growth and rising inflation. This is very bearish for the currency. Investment Conclusions To be sure, the above analysis suggests that the bazooka has not been loaded and the Chinese economy is not about to stage an imminent recovery. BCA’s Emerging Markets Strategy team maintains its bearish stance on China-related plays worldwide. We are closely monitoring China’s money and credit aggregates as well as indicators from the real economy to gauge when China’s business cycle will revive. So far, these indicators continue to point south. EM risk assets and currencies have recently been boosted by the Federal Reserve’s dovish turn. But as we argued in last week’s report, this will prove short-lived. Global trade, China’s growth and commodities prices are the key drivers of EM financial markets, not the Fed. Provided our negative outlook for these three factors due to the ongoing slowdown in China, we continue to recommend a negative stance on EM in absolute terms, and underweighting EM stocks and credit versus their U.S. peers. The dollar’s weakness stemming from the downshift in U.S. interest rate expectations is running out of steam. Chart I-11 shows that the broad trade-weighted dollar is trying to find support at its 200-day moving average. Conversely, the EM stocks index and copper prices are struggling to break above their 200-day moving averages (Chart I-11, middle and bottom panels). Chart I-11Dollar And EM / Commodities: Mirror Images
Dollar And EM / Commodities: Mirror Images
Dollar And EM / Commodities: Mirror Images
We believe the dollar is poised for a breakout, and EM and copper are due for a breakdown. Arthur Budaghyan, Senior Vice President Emerging Markets Strategy arthurb@bcaresearch.com Lin Xiang, Research Analyst linx@bcaresearch.com Box 1 Issuance Of Perpetual Bonds And CBS Program The authorities are promoting the issuance of perpetual bonds and the CBS program as a scheme for the country’s big-four banks to raise capital to meet BIS ’s Total Loss-absorbing Capacity (TLAC) requirements for globally systemically important banks. Limitations and other details on the perpetual bonds issuance and CBS program: 24 out of 30 banks listed on the A-share market are presently qualified to issue perpetual bonds as their assets exceed RMB 200 billion, a threshold established by the PBoC. Perpetual bonds will boost the Tier-1 capital of issuing banks. Banks are allowed to purchase perpetual bonds issued by other banks in amounts up to 10% of their core Tier-1 capital. Only primary dealers (46 banks and 2 brokers) can exchange qualified perpetual bonds they hold for PBoC bills, with a maximum exchange period of three years. The incentive for banks to purchase perpetual bonds will for now be low because these bonds consume large amounts of capital. The risk weights for these perpetual bonds ranges between 150-250%. How Does It Work? As Diagram I-1 on page 14 illustrates, when Bank B purchases perpetual bonds from Bank A, the former transfers excess reserves to the latter. The amount of outstanding deposits, i.e., money supply, is not affected at all. Hence, there is no direct impact on the broad money supply.
Chart I-
Banks do not require deposits to make loans and buy securities. Banks need excess reserves at the central bank to pay for or settle payments with other banks. When Bank B transfers excess reserves to Bank A, the aggregate amount of excess reserves in the banking system does not change. Bank B can swap these perpetual bonds with central bank bills, and then pledge these bills at the PBoC to get excess reserves. As it does so, Bank B will replenish its excess reserves. Consequently, the amount of excess reserves in the banking system will expand, as will the PBoC’s balance sheet. Overall, the issuance of perpetual bonds and CBS swaps lead to both bank recapitalization and banking system liquidity (excess reserves) expansion. Why has the PBoC decided to fund the issuance of perpetual bonds? Without PBoC funding, demand for perpetual bonds might be very low, and yields on them could spike. Higher yields could lure away capital from other corporate bonds, producing higher borrowing costs in credit markets. On the positive side, the monetary authorities will not only recapitalize a number of large banks but will also do so by capping borrowing costs in the credit markets and injecting more liquidity into the banking system. On the negative side, yields of these perpetual bonds will not be determined by the market. Rather they will be artificially suppressed by potential open-ended PBoC funding. This will preserve China’s inefficient credit allocation system and misallocation of capital in general. In a market economy, the authorities will typically force banks to raise capital in securities markets or privately. More issuance, especially when it comes from many banks simultaneously, typically pushes down the prices of bank stocks and bonds. The basis is securities issuance often dilutes existing shareholders and is also negative for bondholders. This threat of dilution and losing money incentivizes existing shareholders and bondholders of a bank to impose discipline on the bank’s management. Consequently, banks would be better run and capital allocation would be more efficient than it would otherwise be in a system where such oversight and incentives are absent. In brief, the market mechanism deters banks from risky and speculative behavior and contributes to the long-term health of the banking system, as well as the efficiency of capital allocation in the real economy. By allowing banks to purchase each other’s bonds, and with the PBoC financing it, China is not imposing the much-needed market discipline on bank shareholders, bondholders and by extension, bank management. This does not promote efficient capital allocation and higher productivity growth in the long run. Footnotes 1 Money supply is the sum of all deposits in the banking system. Hence, we use terms money and deposits interchangeably. 2 Please see the Emerging Markets Strategy Special Report “Misconceptions About China's Credit Excesses”, dated October 26, 2016, Special Report “China's Money Creation Redux And The RMB?”, dated November 23, 2016, Special Report “Do Credit Bubbles Originate From HIgh National Savings?”, dated January 18, 2017, Special Report “The True Meaning Of China's Great 'Savings Wall'”, dated December 20, 2017 Special Report “Is Investment Constrained By Savings? Tales Of China and Brazil”, dated March 22, 2018, available at www.bcaresearch.com Equity Recommendations Fixed-Income, Credit And Currency Recommendations