Sectors
Stay Neutral S&P Health Care
Stay…

Highlights Stay tactically overweight to equities for the time being. Close the overweight to industrial commodities versus equities. The financials, basic resources, and industrials equity sectors can continue to outperform for a few months longer. EM can also continue to outperform DM for a few months longer. Overweight Germany’s DAX versus German bunds. The second half of the year is going to be much tougher than the first half. Feature Chart of the WeekPessimism Was Overdone: The Classical Cyclicals And EM Are Rebounding
Pessimism Was Overdone: The Classical Cyclicals And EM Are Rebounding
Pessimism Was Overdone: The Classical Cyclicals And EM Are Rebounding
Locked In An Intimate Embrace Last week, we highlighted a frustrating truth: for the past 16 months the broad equity market has been on a journey to nowhere. Yet the journey has been far from boring. There have been exciting detours of 10-15 percent in both directions, albeit these moves have been short-lived, lasting no more than three months at a time. The same truth applies to the broad bond market: for the past sixteen months the global long bond yield – defined here as the average of the yields on the 30-year German bund yield and 30-year T-bond – has also ended up going nowhere. On this journey too, there have been exciting detours of up to 50 basis points in both directions, but these moves have also lasted no more than three months before retracing. It follows that for the past 16 months, the strategic allocation to equities, bonds and cash has had zero impact on investment performance, but the tactical allocation to the asset classes has had a huge impact. Yet here’s the thing: the sharp tactical moves in the bond market and in the stock market have been intimately embraced. When the global long bond yield has approached the top of its range, it has catalysed a sharp sell-off in equities; and when the bond yield has approached the bottom of its range, it has catalysed a sharp rally in equities (Chart I-2). In fact, over the past 16 months, asset allocation has boiled down to a very simple trading rule based on the global long bond yield: above 2.2 percent, sell equities; below 1.95 percent, buy equities. Today, the yield stands at 1.85 percent, suggesting a tactically overweight stance to equities. Chart I-2The Sharp Tactical Moves In The Bond Market And Stock Market Are Intimately Connected
The Sharp Tactical Moves In The Bond Market And Stock Market Are Intimately Connected
The Sharp Tactical Moves In The Bond Market And Stock Market Are Intimately Connected
The Persistent Trends Are In Sectors Some investors cannot shift their portfolios quickly enough to exploit the tactical opportunities in the markets. They need trends that persist for at least six months to a year. The good news is that these more persistent trends do exist, but to find them you have to look at equity sectors, and specifically the classically cyclical sectors (Chart of the Week). The financials and basic resources sectors were in strong relative downtrends through most of 2018; but for the last four months these classically cyclical sectors have flipped into very clear uptrends (Chart I-3 and Chart I-4). The same is true for industrials, albeit the end of the downtrend has happened more recently (Chart I-5). Chart I-3Financials Are Rebounding
Financials Are Rebounding
Financials Are Rebounding
Chart I-4Basic Resources Are Rebounding
Basic Resources Are Rebounding
Basic Resources Are Rebounding
Chart I-5Industrials Are Rebounding
Industrials Are Rebounding
Industrials Are Rebounding
For the avoidance of doubt, technology is not a classically cyclical sector because the sales of technology products – particularly to consumers – are relatively insensitive to short-term fluctuations in the economy. In fact, the relative performance of technology is an almost perfect mirror-image of financials (Chart I-6). Chart I-6The Technology Sector Is Not A Classical Cyclical
The Technology Sector Is Not A Classical Cyclical
The Technology Sector Is Not A Classical Cyclical
Neither is the chemicals sector a classical cyclical. Given that raw material prices are an input cost for chemical manufacturers, the chemicals sector can underperform when raw material prices are rising in a cyclical up-oscillation (Chart I-7). It follows that the three true classically cyclical sectors are: financials, basic resources and industrials. Chart I-7The Chemicals Sector Is Not A Classical Cyclical
The Chemicals Sector Is Not A Classical Cyclical
The Chemicals Sector Is Not A Classical Cyclical
What if your investment process does not allow you to invest in sectors and benefit from their well-defined and longer trends? The good news is that you can play these same trends through regional and country stock market indexes. We refer readers to previous reports for the details, but the crucial message is that regional and country relative performances stem from nothing more than the stock markets’ defining sector skews combined with sector relative performances.1 This revelation of what truly drives regional and country relative performance is bittersweet. It is sweet because it simplifies an investment process that can be very complicated. But it is also bitter because it highlights that the investment industry is still replete with unnecessary layers of complexity. Still, just to drive home the point, we would like the charts to do the talking. The relative performance of financials, the relative performance of Italy’s MIB, and the relative performance of Emerging Markets (EM) versus Developed Markets (DM) are all effectively one and the same story (Chart I-8 and Chart I-9). Chart I-8One And The Same Story: Financials And Italy...
One And The Same Story: Financials And Italy...
One And The Same Story: Financials And Italy...
Chart I-9...And Financials And EM Versus DM
...And Financials And EM Versus DM
...And Financials And EM Versus DM
What Are The Markets Telling Us, And Do We Agree? Another very common question we get is: what is our forecast for economic growth and profits growth? For example, two questions on everyone’s lips right now are: can Germany avoid a technical recession, and what is our forecast for Germany’s growth from here? These are indeed important questions, but for investors they are not the most important questions. Financial markets are a discounting mechanism. So for investors, the most important question should always be: what is discounted in the current market price, and is that too optimistic or too pessimistic? Over-optimism and over-pessimism on the economy are especially important for the classically cyclical sectors because their profits have a very high operational gearing to their sales: a small change in the sales outcome has a huge impact on the profit outcome and, therefore, the price. If the price is discounting a booming economy and what actually transpires is that the economy grows modestly, then a seemingly benign outcome of respectable growth will paradoxically cause the price to slump. Conversely, if the price is discounting a very pessimistic outcome and what actually transpires is anything better than the ultra-pessimism, then even a bad outcome will paradoxically cause the price to soar. In this regard, the recent underperformance of Germany’s DAX versus German bunds is at an extreme not far from that during the euro sovereign debt crisis in 2011-12 (Chart I-10). So the important question for investors is: will the actual economic outcome transpire to be as extreme as that? Our answer is that the extreme underperformance of the DAX versus bunds is discounting an overly pessimistic outcome, and on that basis the correct stance is to be overweight the DAX versus bunds. Chart I-10Overly Pessimistic: The DAX Versus Bunds
Overly Pessimistic: The DAX Versus Bunds
Overly Pessimistic: The DAX Versus Bunds
Turning to the classical cyclicals, these sectors have rebounded because their embedded assumptions for growth reached peak pessimism in October. Since then, the pessimism has abated at the margin because of improving short-term impulses from Chinese stimulus, lower global bond yields, and sharply lower energy prices. Given that positive (and negative) impulse phases reliably tend to last for six to eight months, our expectation is that this tailwind for the classical cyclical sectors – financials, basic resources, and industrials – can continue for a few months longer. Which means that the outperformance of EM versus DM can also continue for a few months longer. In terms of asset allocation, long industrial commodities versus equities worked very powerfully at the end of last year, but the relative merits of the two asset classes are now more evenly balanced. Hence, we are now closing this position in profit. Finally, our major concern is for later in the year when the aforementioned improving short-term impulses will inevitably fade, and even potentially reverse. Bear in mind that the impulses arise from the short-term changes in credit flows, bond yields, and the oil price. It follows that to recreate these positive impulses for later in the year, bond yields and/or the oil price have to keep falling. This is not our base case, so enjoy the positive impulses while they last! As the year progresses the investment environment is going to get much tougher. Fractal Trading System* The sharp underperformance of the Nikkei 225 versus the Hang Seng is at the limit of tight liquidity that has signaled all of the recent trend reversals in this relative position. Accordingly, this week’s recommended trade is to go long the Nikkei 225 versus the Hang Seng. Set a profit target of 4.5 percent with a symmetrical stop-loss. We now have seven open positions. For any investment, excessive trend following and groupthink can reach a natural point of instability, at which point the established trend is highly likely to break down with or without an external catalyst. An early warning sign is the investment’s fractal dimension approaching its natural lower bound. Encouragingly, this trigger has consistently identified countertrend moves of various magnitudes across all asset classes. Chart I-11
Long Nikkei 225 Vs. Hang Seng
Long Nikkei 225 Vs. Hang Seng
The post-June 9, 2016 fractal trading model rules are: When the fractal dimension approaches the lower limit after an investment has been in an established trend it is a potential trigger for a liquidity-triggered trend reversal. Therefore, open a countertrend position. The profit target is a one-third reversal of the preceding 13-week move. Apply a symmetrical stop-loss. Close the position at the profit target or stop-loss. Otherwise close the position after 13 weeks. Use the position size multiple to control risk. The position size will be smaller for more risky positions. * For more details please see the European Investment Strategy Special Report “Fractals, Liquidity & A Trading Model,” dated December 11, 2014, available at eis.bcaresearch.com Dhaval Joshi, Senior Vice President Chief European Investment Strategist dhaval@bcaresearch.com Footnote 1 Please see the European Investment Strategy Weekly Report “Oil, Banks, And Bonds: The Oddities Of 2018”, dated November 29, 2018 available at eis.bcaresearch.com Fractal Trading System Recommendations Asset Allocation Equity Regional and Country Allocation Equity Sector Allocation Bond and Interest Rate Allocation Currency and Other Allocation Closed Fractal Trades Trades Closed Trades Asset Performance Currency & Bond Equity Sector Country Equity Indicators Bond Yields Chart II-1Indicators To Watch - Bond Yields
Indicators To Watch - Bond Yields
Indicators To Watch - Bond Yields
Chart II-2Indicators To Watch - Bond Yields
Indicators To Watch - Bond Yields
Indicators To Watch - Bond Yields
Chart II-3Indicators To Watch - Bond Yields
Indicators To Watch - Bond Yields
Indicators To Watch - Bond Yields
Chart II-4Indicators To Watch - Bond Yields
Indicators To Watch - Bond Yields
Indicators To Watch - Bond Yields
Interest Rate Chart II-5Indicators To Watch - Interest Rate Expectations
Indicators To Watch - Interest Rate Expectations
Indicators To Watch - Interest Rate Expectations
Chart II-6Indicators To Watch - Interest Rate Expectations
Indicators To Watch - Interest Rate Expectations
Indicators To Watch - Interest Rate Expectations
Chart II-7Indicators To Watch - Interest Rate Expectations
Indicators To Watch - Interest Rate Expectations
Indicators To Watch - Interest Rate Expectations
Chart II-8Indicators To Watch - Interest Rate Expectations
Indicators To Watch - Interest Rate Expectations
Indicators To Watch - Interest Rate Expectations
Containers & Packaging Stocks Surprise In Q4
Containers & Packaging Stocks Surprise In Q4
Overweight The S&P containers & packaging index has been outperforming so far this year after its largest constituent stocks handily beat earnings estimates in this past quarter. Encouragingly, relative performance has bounced off long-term support (top panel). Revenue growth was a common theme in the Q4 print which is corroborated by the resilience in consumer spending on food & beverage (middle panel), the key source of end-demand for the sector. With input costs well under control (bottom panel), earnings estimates have understandably leaped higher. Importantly, changes in consumer spending and the relative valuation of containers & packaging stocks have typically moved in lockstep (middle panel), though this relationship broke down somewhat in the past three years as bullish investor sentiment has rewarded other sectors at the expense of this niche materials index. Still, with recovering profitability and relative valuations at a 30% discount to the broad market (roughly at GFC levels), the S&P containers & packaging index is due for a rerating; stay overweight. The ticker symbols for the stocks in this index are: BLBG: S5CONP - IP, WRK, BLL, PKG, SEE, AVY.
Highlights China’s recently released pro-auto-consumption policy will lead to a moderate 5-8% recovery in auto sales/production this year. However, the impact from the stimulus will be much less than the previous two episodes in 2009 and 2016. The value of Chinese auto sales is likely to increase by RMB 200 billion to 350 billion, which is about 0.2-0.4% of the country’s nominal GDP in 2018. New-energy cars will continue to gain market share with supportive policies. Meanwhile, domestic brand car manufacturers will likely benefit most from the upcoming recovery in the Chinese auto market, while American car producers will benefit the least. We recommend preparing to go long Chinese auto stocks in the domestic market in absolute terms, subject to the terms of a trade agreement with the U.S. In addition, we continue to overweight domestic consumer discretionary stocks versus the benchmark, and versus domestic consumer staples. Feature China is the world’s largest car producer and consumer – its domestic sales account for about 30% of global auto sales (Chart 1, top panel). The country experienced a 3% contraction in auto sales and production through last year, the first year of negative annual growth in 28 years. The contraction rapidly accelerated into the double digits over the past few months (Chart 1, bottom panel). Chart 1Chinese Auto Industry: Policy Stimulus = Recovery In 2019
Chinese Auto Industry: Policy Stimulus = Recovery In 2019
Chinese Auto Industry: Policy Stimulus = Recovery In 2019
As the auto sector is an important driver of China’s economic growth, whenever the industry has shown signs of weakness, the central government has typically implemented a series of supportive policies designed to stimulate the domestic auto market. The authorities successfully did this in 2009-2010 and 2016-2017. Late last month, they again announced a set of pro-auto-consumption policies. The question going forward is how effective these measures will be in boosting auto sales. We believe the recovery will be rather moderate compared with the 2009-2010 and 2016-2017 episodes. Chances are that the growth of auto sales and production will recover to 5-8% in 2019. As a result, we recommend preparing to go long Chinese auto stocks in absolute terms, subject to the terms of a trade agreement with the U.S. Cyclical And Secular Forces Shaping Auto Sales A comparison of the current auto market to the one that prevailed in 2009 and 2016 is helpful to gauge the extent of the strength of the pending auto sales recovery expected this year. Box 1 shows the recently released pro-auto-consumption plan by the Chinese government, which focuses on six aspects, including promoting auto replacement, NEV sales, auto sales in rural areas, pick-up truck sales, development of the second-hand car market, and auto sales in cities that have restricted auto sales policies. BOX 1: China’s Stimulus Package For Domestic Auto Industry The recently released pro-auto-consumption plan by the Chinese government includes: Promoting auto replacement: Providing subsidies to consumers who scrap their older, higher-polluting cars for new, lower-emission or zero-emission cars; Encouraging NEV sales: Providing subsidies to advanced NEV sales and giving more privileges to new energy trucks; Promoting auto sales in rural areas: Providing subsidies to rural residents who scrap their tricycles to buy a truck with cylinder capacity equal or less than 3.5 tons, or a passenger car with cylinder capacity equal or less than 1.6L; Promoting pick-up truck sales: Widening access areas within cities for pick-up trucks; Accelerating the development of the second-hand car market: Allowing second-hand car trades across different cities and provinces; Loosening auto sales restrictions in cities that have restricted auto sales policies. Regarding the amount of subsidies, the government did not provide details. Putting it all together, we believe that this time the impact from the stimulus will be much more muted than the previous two episodes in 2009 and 2016. First, there is no sales tax reduction measure in this round of stimulus. The most important driver for the auto market recovery in 2009 and 2016 was a sales tax reduction in passenger cars with cylinder capacity equal to or less than 1.6L from 10% to 5% (Chart 2). However, this time, there is no such cut. While the government is maintaining zero sales tax on new energy vehicles (NEV), the sales tax on all automobiles remains at 10% this year. Chart 2The Lessons From The 2009 And 2016 Episodes
The Lessons From The 2009 And 2016 Episodes
The Lessons From The 2009 And 2016 Episodes
Second, domestic pent-up demand for automobiles is much lower than it was in both 2009 and 2016. The car ownership rate, defined as the number of passenger cars per 1000 households, has risen significantly to 453 in 2018 (Chart 3). This means that nearly half of Chinese households already own at least one car as of 2018. In comparison, the car ownership rate was only 91 in 2008 and 318 in 2015. Chart 3Less Pent-Up Demand For Autos In 2019 Than Before
Less Pent-Up Demand For Autos In 2019 Than Before
Less Pent-Up Demand For Autos In 2019 Than Before
Third, Chinese households’ debt levels have surged in the past few decades, constraining their ability to purchase cars and other goods (Chart 4, top panel). While many investors compare the cross-country household debt burden relative to GDP, Chinese household debt has already risen to nearly 120% of households’ disposable income, surpassing the U.S. (Chart 4, bottom panel). Chart 4Increasing Households' Debt Burden Constrains Ability To Buy A Car
Increasing Households' Debt Burden Constrains Ability To Buy A Car
Increasing Households' Debt Burden Constrains Ability To Buy A Car
Fourth, while the recent stimulus packages aim to promote auto sales in rural areas, the difficulty of getting auto loans is much higher for the average rural household than for the average urban household, as the former generally have much lower income levels. In addition, peer-to-peer lending, which has become a major source of auto loans in recent years due to lower lending standards compared with banks, has collapsed since last year (Chart 5). With tightening regulations, the difficulty of acquiring auto loans through peer-to-peer lending is currently higher than before. Chart 5Rising Difficulty To Get An Auto Loan
Rising Difficulty To Get An Auto Loan
Rising Difficulty To Get An Auto Loan
Lastly, there has been a structural decline in consumers’ willingness to buy cars due to increasing traffic congestion, limited parking space and more advanced public transportation. Moreover, more mature car rental markets and the rising use of car-sharing services have also helped reduce the need to buy a car, to some extent. This is a major difference from 2009-2010 and 2016. In Chart 6, both falling households’ marginal propensity to consume and declining consumption loan growth suggest a decreasing willingness to consume among Chinese consumers. Chart 6Chinese Consumers: Falling Willingness To Consume
Chinese Consumers: Falling Willingness To Consume
Chinese Consumers: Falling Willingness To Consume
With all the aforementioned cyclical and structural forces in place, the impact on domestic auto sales from the recent stimulus package will be smaller in 2019 than in 2009 and 2016. That said, these policies will still be supportive, and likely sufficient to lift auto sales from contraction back to positive growth this year. Estimating the magnitude of the impact remains challenging, however, due to lingering uncertainty about the size of government subsidies. Based on all six measures listed in Box 1, the scale of subsidies provided by the government will be the major determinant for auto sales growth in China in 2019. In general, the bigger the subsidies, the stronger the push on auto sales. In 2009, both the central government and local government provided subsidies for stimulating auto sales. This time, while the financing sources could still be both central and local governments, local governments’ ability to finance auto consumption stimulus is diminishing due to their much higher debt levels and weaker revenues from land sales than in the past. For now, our view is that the impact from the stimulus will be much less significant than the previous two episodes in 2009 and 2016. Auto sales growth was 4.7% and 3% in 2015 and 2017, respectively. With recently announced stimulus, we expect the growth will be higher than in those years. Bottom Line: We expect that the growth of Chinese auto sales/production volumes will rebound to 5-8% this year, much slower than the 45% growth seen in 2009 and 14% growth in 2016. With a similar growth rate in value terms, Chinese auto sales are likely to increase by RMB 200 to 350 billion, which is about 0.2-0.4% of the country’s 2018 nominal GDP. The Winners And Losers At 5-8%, growth will be equivalent to a 1.5-2 million-unit increase in domestic auto sales. This will lead to a similar increase in auto production, as most cars are domestically produced. In terms of fuel use, automobiles can be classified as gasoline cars, diesel cars and new-energy cars. Chart 7 shows that gasoline cars currently hold 84% market share.
Chart 7
Chart 8
In terms of brand, automobiles can be categorized as Chinese brands, Japanese brands, German brands, American brands, Korean brands and others. Chart 8 shows their market structure, with Chinese brands currently accounting for 42% of total market share. As the Chinese auto market is set to have a moderate recovery this year, which kinds of cars will benefit most, and which will benefit least? Even though China plans to gradually reduce its subsidies on NEVs to zero in 2021, several factors suggest that NEVs will still be the biggest winner, taking more market share from both gasoline and diesel cars. The government is aiming to increase the NEV market share from 4.5% currently to 20% by 2025. Assuming total sales rise to 32 million units in 2025 from current levels of 28 million (about 2% annual growth), this would imply that NEV sales will surge to 6.4 million units from 1.3 million currently, which is equal to 26% annual growth over the next seven years (Chart 9). Chart 9NEV Sales: Plenty Of Upside
NEV Sales: Plenty Of Upside
NEV Sales: Plenty Of Upside
In addition to governments continuing subsidies, the sales tax on NEVs will be held at zero until the end of 2020, a big advantage over non-NEV vehicles, which carry the 10% sales tax. In addition, in cities that have license restrictions on car sales or have time or area restrictions on on-road autos, NEVs are not constrained by such policies, which is an attractive privilege for car buyers to consider. For example, in Shanghai, it costs over 80,000 RMB to buy a license plate for a non-NEV car if the potential buyer is lucky enough to be selected by random draw. In comparison, buying a NEV allows the buyer to have a free license plate. Current NEVs can achieve recharge mileage of 300-450 kilometers, with a price of RMB 100,000 to RMB 150,000 per unit. While the recharge mileage is sufficient for most daily use, prices are no longer substantially higher than prices for traditional gasoline or diesel cars. Major global and local NEV producers are expanding their production in China. For example, Tesla last month started building its mega electric car manufacturing plant in Shanghai, which will initially produce 250,000 cars per year, and eventually ramp up to half a million. This will be about five times the number of vehicles the company currently produces in the U.S. Most NEVs that have been sold in China are Chinese-brand NEVs. However, with China further opening up its auto sector and allowing more foreign NEV producers to invest and produce cars in China, Chinese NEV producers will face increasing competition and may lose some market share to foreign NEV producers. Meanwhile, Chinese NEV-related supportive policies will likely benefit both local and foreign NEV producers as the government is determined to develop the domestic NEV market and encourage NEV sales. That said, local producers will still enjoy slightly more favorable policies than foreign ones. Given that the government is promoting smaller-engine passenger car sales in rural areas and encouraging the replacement of old diesel cars with NEVs, sales and production of gasoline cars may also increase slightly, while diesel cars are likely to rise the least. In terms of brand, Chinese and American brands lost share to Japanese and German brands last year. We believe Chinese brands will benefit most from this year’s government-led auto market recovery for two reasons (Chart 10, top panel): Chart 10Chinese Brands Will Benefit Most From This Year’s Policy Stimulus
Chinese Brands Will Benefit Most From This Year’s Policy Stimulus
Chinese Brands Will Benefit Most From This Year’s Policy Stimulus
The authorities will likely favor local brand producers in terms of benefitting from the subsidies they give to car buyers. In addition, local brand cars in general have lower prices than foreign brands, which could be the most attractive feature for price-sensitive rural residents. In the meantime, as the government encourages local auto replacement, this may benefit Japanese and German brands (Chart 10, second and third panels), as buyers with replacement needs will likely upgrade their cars to ones of higher quality and better reputation. Among American cars, while we are positive on American NEV car sales in China, we still expect American cars to continue to lose market share due to weakening sales of American non-NEV car sales (Chart 10, bottom panel). American cars are generally more expensive than Chinese-brand cars, and they are often perceived as slightly lower quality than either Japanese or German brands. Moreover, the ongoing trade dispute may bias Chinese buyers against buying an American car. Bottom Line: We believe NEV producers and Chinese-brand car producers will benefit most from this year’s government-led auto market recovery. Investment Implications There are several important conclusions that stem from our research. First, while rebounding auto production will likely lift demand for many metals, housing construction is artificially supporting demand and is set to decelerate over the coming year (Chart 11). Consequently, we do not believe that accelerating auto production alone is a license to be long industrial metals over the coming year. Chart 11Weakening Property Market Weighs More On Commodity Market
Weakening Property Market Weighs More On Commodity Market
Weakening Property Market Weighs More On Commodity Market
Second, within the equity space, we recommend that global investors prepare to go long domestic auto stocks on an absolute basis after the outcome of the U.S.-China trade talks emerges later this month. Rebounding auto production will likely lead to a cyclical improvement in auto producer earnings, which in combination with deeply oversold conditions bodes well for the 6-12 month outlook (Chart 12). Chart 12Look To Long Domestic Auto Stocks In An Absolute Term
Look To Long Domestic Auto Stocks In An Absolute Term
Look To Long Domestic Auto Stocks In An Absolute Term
U.S. negotiators are seeking increased access to the Chinese auto market, which implies that the outcome of the negotiations carries some event risk for domestic producers (particularly if China’s concessions on this front turn out to be large). But our sense is that we are likely to recommend an outright long position favoring domestic automakers barring a trade deal with deeply negative implications for domestic producer market share. Third, our bullish bias towards Chinese auto producers and our constructive outlook for the home appliance market supports two of our existing trades favoring consumer discretionary stocks. Chart 13 highlights that production and sales volume for several home appliance products is depressed, and stands to benefit from a flurry of policy announcements late last month that were intended to support the industry. Chart 13Home Appliances: Rebound Soon On Stimulus As Well
Home Appliances: Rebound Soon On Stimulus As Well
Home Appliances: Rebound Soon On Stimulus As Well
Both auto producers and home appliance manufacturers belong to the consumer discretionary sector, and we recommend maintaining a long domestic consumer discretionary position versus both the domestic benchmark and relative to consumer staples (both trades were initiated on November 141). While domestic consumer discretionary stocks are expensive vs. the domestic benchmark on a P/B basis (Chart 14), the sector’s relative P/E ratio is trading at the very low end of its historical range and the trade has eked out modest positive gains since initiation. Chart 14Remain Overweighting Consumer Discretionary Sector
Remain Overweighting Consumer Discretionary Sector
Remain Overweighting Consumer Discretionary Sector
Our long discretionary / short staples trade has faired much worse, down 11% since initiation due to a significant rally in consumer staples stocks (rather than losses in the discretionary sector). We recommend that investors stick with the trade over the coming 6-12 months despite the loss, as Chart 15 highlights that the discretionary / staples trade could not be more extreme in terms of relative performance or valuation. Our bet is that this trade will reverse course in 2019, for a meaningful period, in response to a cyclical tailwind from policy. Chart 15Stay Long Discretionary / Short Staples
Remain Overweighting Consumer Discretionary Sector
Remain Overweighting Consumer Discretionary Sector
Ellen JingYuan He, Associate Vice President Emerging Markets Strategy EllenJ@bcaresearch.com Footnotes 1 Please see BCA Research’s China Investment Strategy Special Report “Chinese Household Consumption: Full Steam Ahead?”, published November 14, 2018. Available at cis.bcaresearch.com. Cyclical Investment Stance Equity Sector Recommendations
Stay Overweight S&P Financials
…
As Good As It Gets For Financials
As Good As It Gets For Financials
Overweight In Monday’s Cyclical Indicator Update, we highlight our cyclical portfolio bent, driven by three core catalysts that we think will take U.S. equities higher. These are: a definitively more dovish Fed, which would help restrain the greenback, a continuation of the earnings juggernaut and a positive U.S./China trade resolution. One cyclical sector that looks particularly attractive is S&P financials. The divergence between the directions for our cyclical macro indicator (CMI) and our valuation indicator (VI) for financials has reached stunning levels. The CMI is accelerating into pre-GFC territory as credit quality, loan growth and unemployment are all in the sweet spot while the VI has fallen to two standard deviations below fair value. Our technical indicator (TI) sends a signal that financials are modestly oversold though this relatively neutral message does not diminish the most bullish signal in our cyclical indicator’s history. Bottom Line: We reiterate our overweight recommendation for S&P financials. Please see Monday’s Cyclical Indicator Update for more details on this as well as our cyclical indicator updates on the other GICS1 sectors and our large cap/small cap style preference.
Key Portfolio Highlights The S&P 500 has started 2019 with a bang as dovish cooing from the Fed has proven a tonic for equities. While we have not entirely retraced the path to the early-autumn highs, our strategy of staying cyclically exposed, based on our view of an absence of a recession in 2019, has proven a profitable one as investor capitulation reached extreme levels (Charts 1 & 2). Chart 1Capitulation
Capitulation
Capitulation
Chart 2Selling Is Exhausted
Selling Is Exhausted
Selling Is Exhausted
Importantly, risk premia have been deflating as the end-of-year spike in volatility has subsided and junk spreads have narrowed from the fear-induced heights in December (Chart 3). Chart 3Risk Premia Renormalization
Risk Premia Renormalization
Risk Premia Renormalization
Nevertheless, in order for the reflex rebound since the late-December lows to morph into a durable rally, the macro/policy backdrop has to turn from a headwind to a tailwind. We are closely monitoring three potential positive catalysts: A definitively more dovish Fed, which would help restrain the greenback A continuation of the earnings juggernaut A positive U.S./China trade resolution With respect to the first of these, the S&P 500 convulsed following the December 19 Fed meeting and suffered a cathartic 450 point peak-to-trough fall two months ago. The Fed likely made a policy error, and Fed Chair Powell’s resolve is getting tested as has happened with every Chair since Volcker (Charts 4 & 5). Chart 4Powell's Resolve Getting Tested
Powell's Resolve Getting Tested
Powell's Resolve Getting Tested
Chart 5Fed Policy Mistake
Fed Policy Mistake
Fed Policy Mistake
The rising odds of a pause in the Fed tightening cycle, at least for the first half of the year, will likely serve as a welcome respite for equities. Our second catalyst has been gaining steam through the Q4 earnings season which has seen continuation of the double-digit earnings growth of the prior three quarters. Our earnings model points to a moderation of earnings growth in the year to come, in line with sell-side expectations (Chart 6). Our 2019 year-end target remains 3,000 for the SPX, based on $181 2020 EPS and a 16.5x multiple.1 This represents a 6% EPS CAGR, assuming 2018 EPS ends near $162. Chart 6EPS Growth > 0
EPS Growth > 0
EPS Growth > 0
Chart 7
In Chart 7, we show that financials, health care and industrials are responsible for 61% of the SPX’s expected profit growth in 2019 while technology’s contribution has fallen to a mere 7.2%. While the risk of disappointment encompases financials, health care and industrials, there are high odds that tech surprises to the upside as it has borne the brunt of recent negative earnings revisions (Charts 8 & 9). Chart 8Earnings Revisions...
Earnings Revisions...
Earnings Revisions...
Chart 9...Really Weigh On Tech
...Really Weigh On Tech
...Really Weigh On Tech
Lastly, the negativity surrounding the slowdown in China is likely fully reflected in the market (Chart 10), implying an opportunity for a break out should a positive resolution to the U.S./China trade spat be delivered. China’s reflation efforts suggests that the Chinese authorities remain committed to injecting liquidity into their economy (Chart 11). Chart 10China Slowdown Baked In The Cake
China Slowdown Baked In The Cake
China Slowdown Baked In The Cake
Chart 11Reflating Away
Reflating Away
Reflating Away
Already, the PBOC balance sheet, with over $5.5tn in assets, is expanding anew. Empirical evidence suggests that SPX momentum and the ebb and flow of the PBOC balance sheet are joined at the hip, and the current message is positive (Chart 12). All of these underlie our style preferences for cyclicals over defensives2 and international large caps over domestically-geared small caps. Chart 12Heed The PBoC Message
Heed The PBoC Message
Heed The PBoC Message
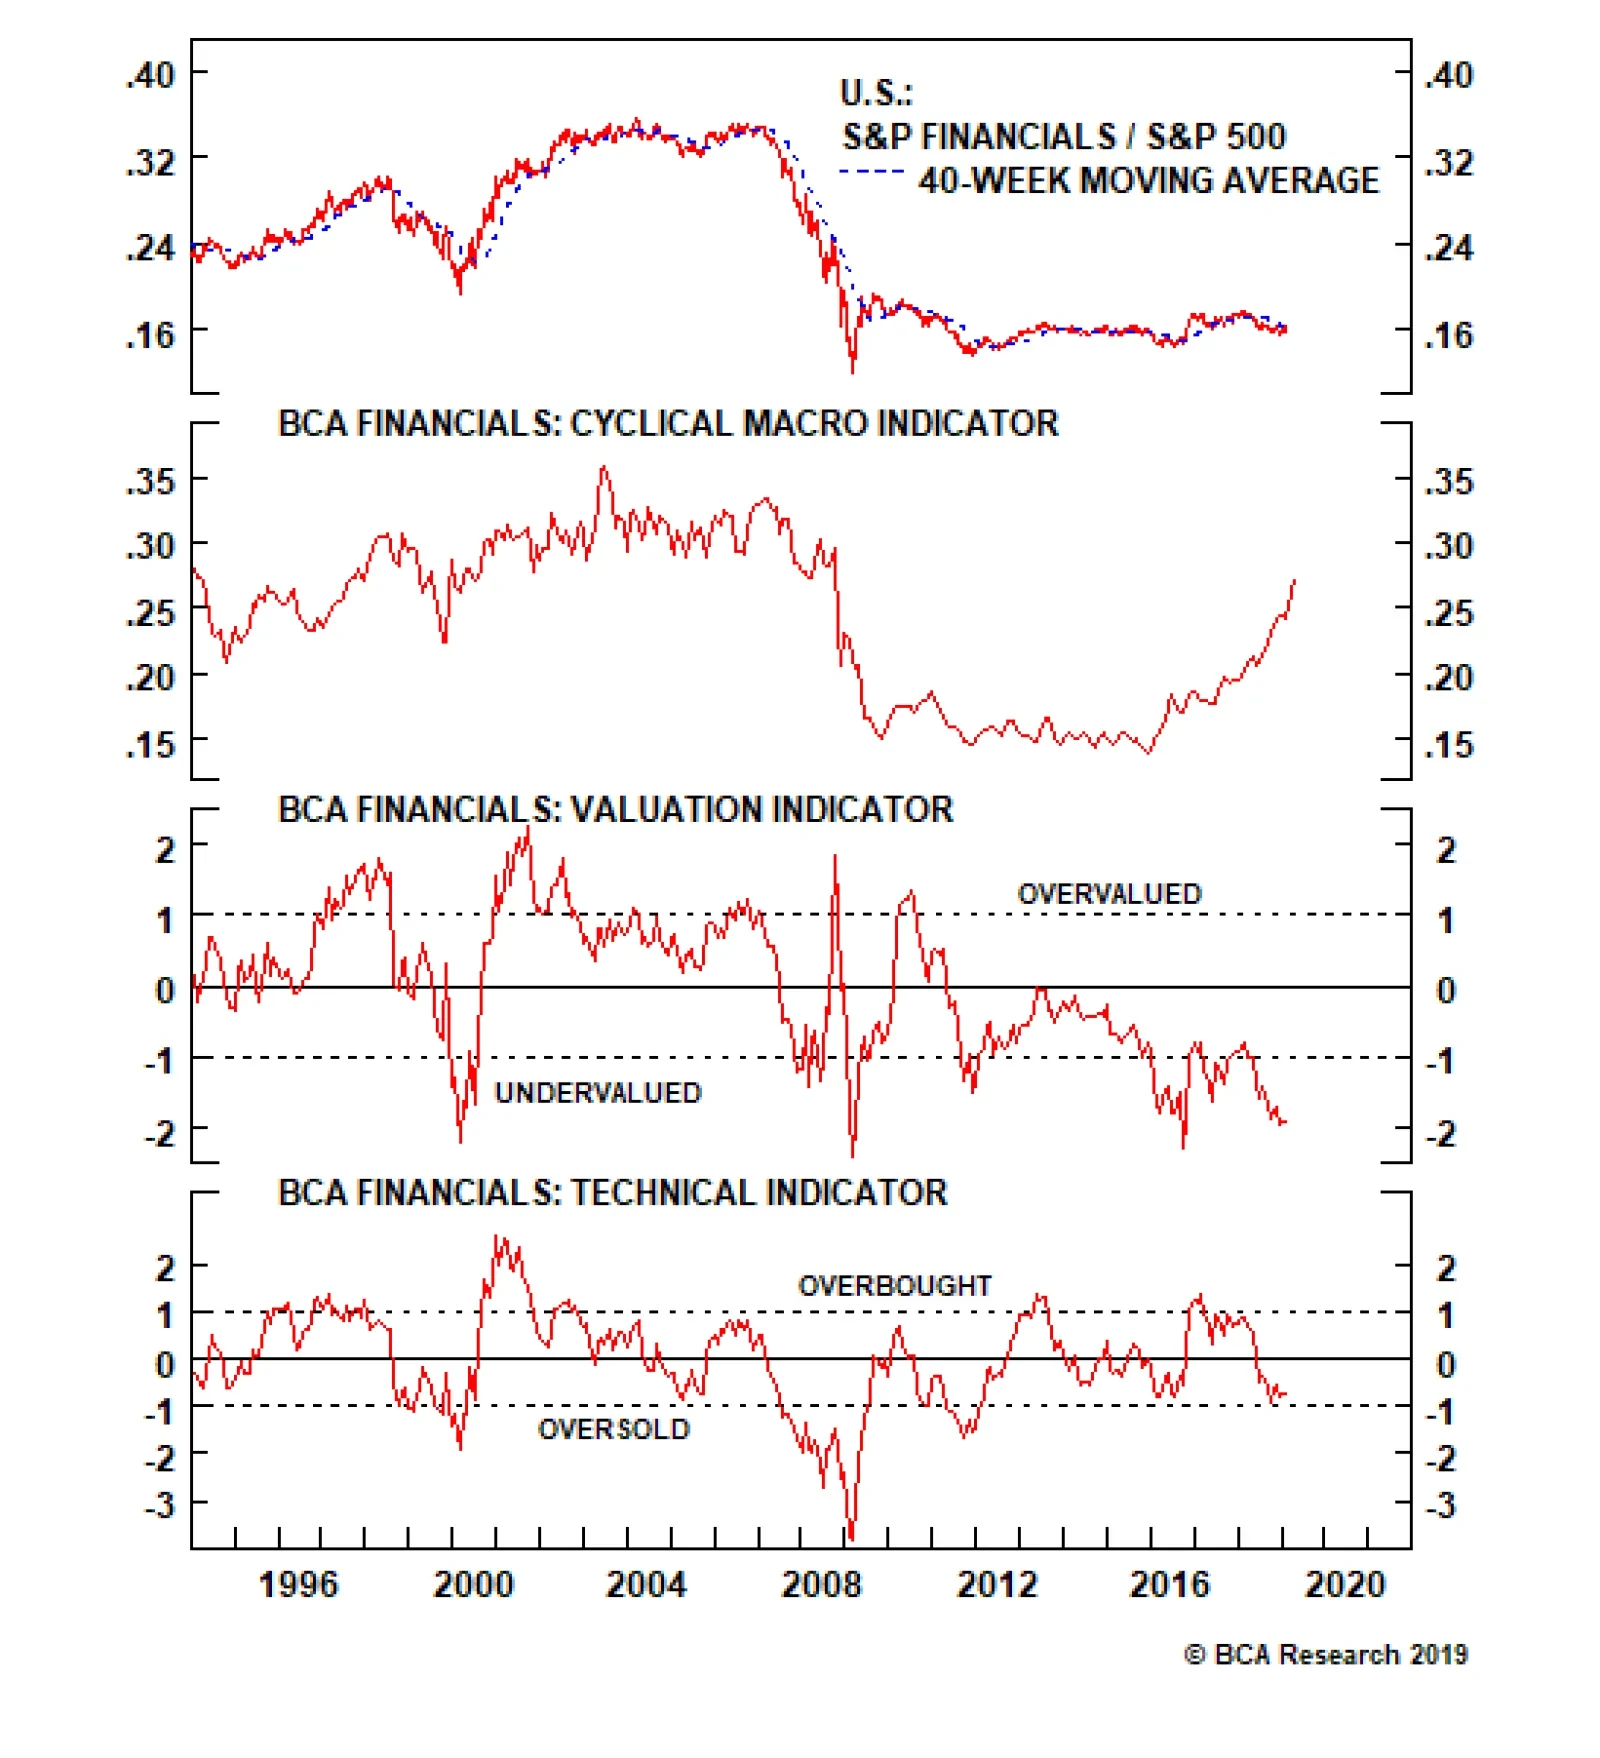
Chris Bowes, Associate Editor chrisb@bcaresearch.com S&P Financials (Overweight) The divergence between the directions for our CMI and valuation indicator (VI) for S&P financials has reached stunning levels, with the former accelerating into pre-GFC territory and the latter falling to two standard deviations below fair value. Our technical indicator (TI) is sending a relatively neutral message, though this does not diminish the most bullish signal in our cyclical indicator’s history (Chart 13). Chart 13S&P Financials (Overweight)
S&P Financials (Overweight)
S&P Financials (Overweight)
The ongoing strength of the U.S. economy is the driver of such a positive indicator, particularly with respect to the key S&P banks sub index. Our total loans & leases growth model and BCA’s C&I loan growth model (second & bottom panels, Chart 14) are in positive territory. The latter is significant given that C&I loans are the single biggest credit category in bank loan books. Importantly, C&I loans have gone vertical recently topping the 10.5% growth mark despite softening capex intentions and CEO confidence. Further, multi-decade highs in consumer confidence are offsetting the Fed’s tightening cycle and suggest that consumer loans, another key lending category, will also gain traction (third panel, Chart 14). In the context of the generationally high employment rate, the implied lower defaults should drive amplified profit improvement from this credit growth. We reiterate our overweight recommendation. Chart 14Loan Growth Drives Profits
Loan Growth Drives Profits
Loan Growth Drives Profits
S&P Industrials (Overweight) The still-solid domestic footing has maintained our industrials CMI close to its cyclical highs, which are also some of the most bullish in the history of the indicator. However, stock prices have not responded accordingly and our VI has descended mildly from neutral to undervalued. Our TI sends a much more definitive message and stands at a full standard deviation into oversold territory (Chart 15). Chart 1515. S&P Industrials (Overweight)
15. S&P Industrials (Overweight)
15. S&P Industrials (Overweight)
While their cyclical peers S&P financials are almost exclusively a domestic play, S&P industrials have been weighed down by trade flare ups for most of the past year (bottom panel, Chart 16). Accordingly, much of the benefit of positive domestic capex indicators and the more tangible capital goods orders maintaining a supportive trajectory has failed to show up in relative EPS growth (second & third panels, Chart 16), though the latter has recently hooked much higher. Chart 16Industrial Earnings Growth Has Recovered
Industrial Earnings Growth Has Recovered
Industrial Earnings Growth Has Recovered
S&P Materials (Overweight) Our materials CMI has made a turn, rising off its lowest level in 20 years. This has coincided with our VI bouncing off its cyclical low, though it remains in undervalued territory. The signal is shared by our TI which has only recently recovered from a full standard deviation into the oversold zone, a level that has historically presaged S&P materials rallies (Chart 17). Chart 17S&P Materials (Overweight)
S&P Materials (Overweight)
S&P Materials (Overweight)
When we upgraded the S&P materials sector to overweight earlier this year, we noted that China macro dominates the direction of U.S. materials stocks. On the monetary front, the Chinese monetary easing cycle continues unabated and the near 150bps year-over-year drop in the 10-year Chinese Treasury yield will soon start to bear fruit (yield change shown inverted and advanced, bottom panel, Chart 18). The renminbi also moves in lockstep with relative share prices. The apparent de-escalation in the U.S./China trade tensions has boosted the CNY/USD and is signaling that a playable reflation trade is in the offing in the S&P materials sector (top panel, Chart 18). Chart 18Chinese Data Drives Materials Performance
Chinese Data Drives Materials Performance
Chinese Data Drives Materials Performance
S&P Energy (Overweight) Our energy CMI has moved horizontally for the past six quarters, though this followed a snap-back recovery from the extremely depressed levels of 2016 and 2017. Meanwhile both our VI and TI have descended steeply into buying territory with the former approaching two standard deviations below fair value (Chart 19). Chart 19S&P Energy (Overweight)
S&P Energy (Overweight)
S&P Energy (Overweight)
As with the CMI, the relative share price ratio for the S&P energy index has moved laterally since our mid-summer 2017 upgrade to overweight. Interestingly, the integrated oil & gas energy subindex neither kept up with the steep oil price advance until the end of September, nor with the recent drubbing in crude oil prices (top panel, Chart 20). Put differently, oil majors never discounted sustainably higher oil prices, and are also refraining from extrapolating recent oil prices weakness far into the future. Chart 2020. The Stage Is Set For A Recovery In Crude Prices
20. The Stage Is Set For A Recovery In Crude Prices
20. The Stage Is Set For A Recovery In Crude Prices
Nevertheless, the roughly 30% per annum growth in U.S. crude oil production is unsustainable and, were production to remain near all-time highs and move sideways in 2019, then the growth rate would fall back to the zero line. Such a paring back in the growth rate would likely balance the oil market and pave the way for an oil price recovery (oil production shown inverted, bottom panel, Chart 20). This echoes BCA’s Commodity & Energy Strategy service, which continues to forecast higher oil prices into 2019, a forecast which should set the stage for a sustainable rebound next year in S&P energy profits, the opposite of what analysts currently expect (Chart 7). S&P Consumer Staples (Overweight) An improving macro environment is reflected in our consumer staples CMI that has vaulted higher in recent months. However, the strong recent relative outperformance has also shown up in our VI which, though still in undervalued territory, has recovered significantly. Our TI has fully recovered and now sends a neutral message (Chart 21). Chart 21S&P Consumer Staples (Overweight)
S&P Consumer Staples (Overweight)
S&P Consumer Staples (Overweight)
The surging S&P household products sector has been carrying the S&P consumer staples index on its back as solid pricing efforts have been dragging results and forward guidance higher. While household product sales have been enjoying a multi-year growth phase (second panel, Chart 22), it has largely been driven by volumes. However, the recent resurgence in pricing power (third panel, Chart 22) has given volume gains an added kick, pushing sales further. Meanwhile, exports have continued their two-year ascent despite the tough currency environment and the upshot is that relative EPS growth will likely remain upbeat (bottom panel, Chart 22). In light of challenged EM consumer spending growth, this signal is very encouraging. Chart 22Household Products Is Carrying Staples
Household Products Is Carrying Staples
Household Products Is Carrying Staples
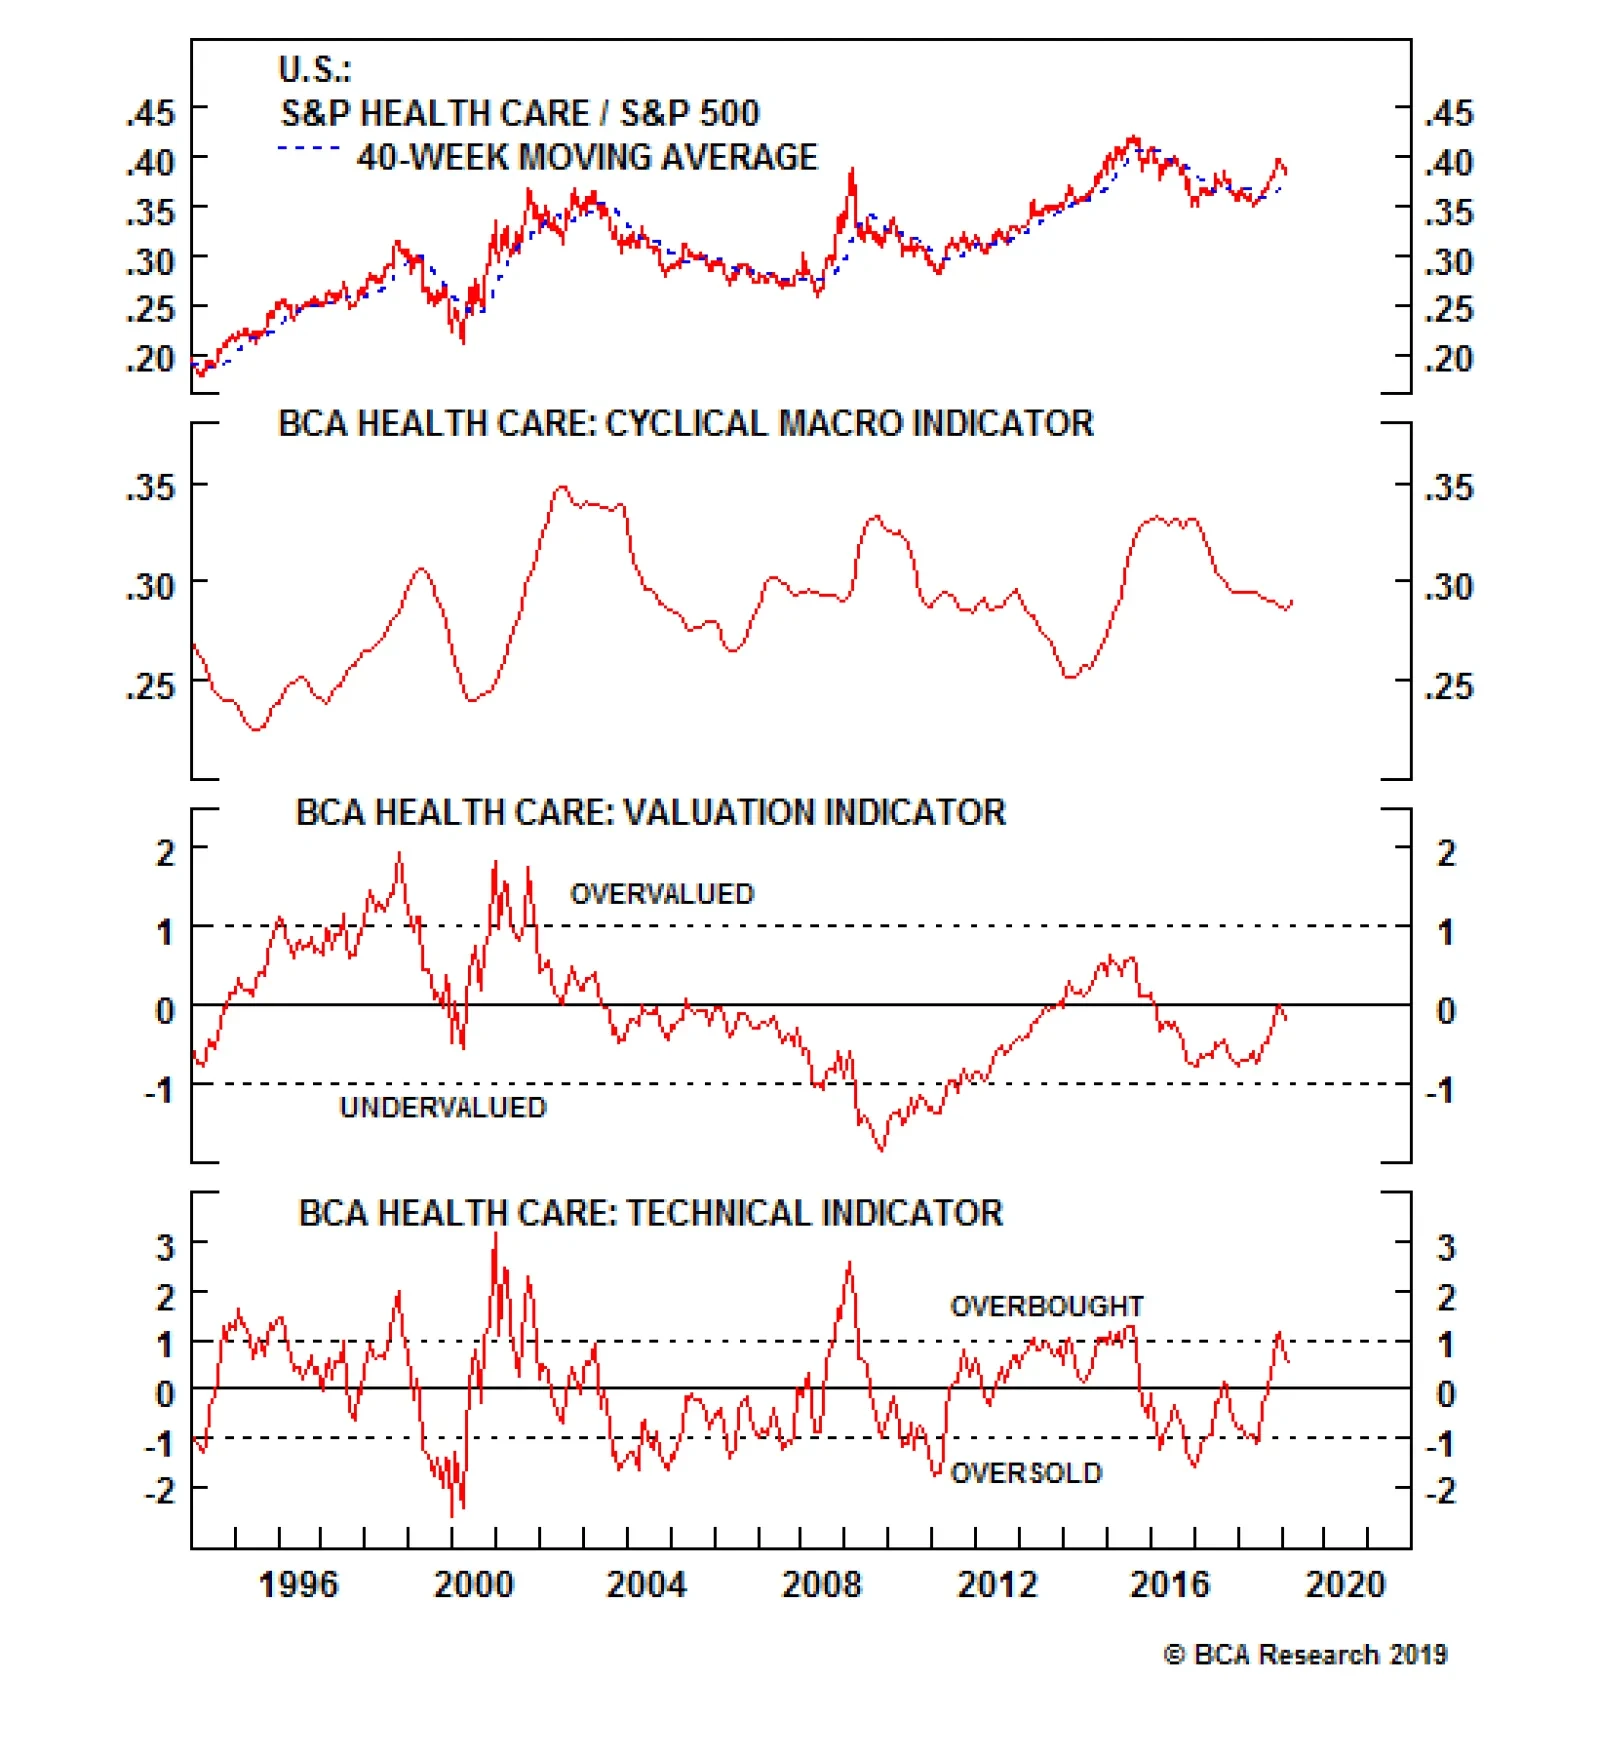
S&P Health Care (Neutral) Our health care CMI has been treading water recently. Further, a recovery in pharma stocks has taken our VI from undervalued to a neutral position, while our TI sends a distinctly bearish message as health care stocks have been overbought (Chart 23). Chart 23S&P Health Care (Neutral)
S&P Health Care (Neutral)
S&P Health Care (Neutral)
Healthcare stocks have outperformed in the back half of 2018. Recently a merger mania that has swept through the pharma and biotech spaces has underpinned relative share prices. The last three months have seen an explosion of deals, including the largest biopharma deal ever (Bristol-Myers Squibb buying Celgene for approximately $90 billion) with other global deals falling not too far behind (Takeda buying Shire for $62 billion mid-last year). Such exuberance has clearly confirmed that merger premia are alive and well in the S&P pharma index. It is not merely rising premia that have taken pharma higher either. Pricing power has entered the early innings of a recovery (top panel, Chart 24) while the key export channel points to increasingly bright days ahead (second panel, Chart 24). However, the rise of regulatory pressure from the Trump administration may cause better pricing to prove fleeting. Chart 24Merger Mania In Pharma
Merger Mania In Pharma
Merger Mania In Pharma
Further, pharma’s consolidation phase has come at a cost to sector leverage ratios that have dramatically expanded (bottom panel, Chart 24). Such profligacy may come to haunt the sector should the pricing power recovery falter. S&P Technology (Neutral) Our technology CMI has been moving laterally for the better part of the last three years, though the S&P technology index has ignored the macro headwinds and soared higher over that time. Our VI remains on the overvalued side of neutral, despite the recent tech selloff while our TI has been retrenching into oversold territory (Chart 25). Chart 25S&P Technology (Neutral)
S&P Technology (Neutral)
S&P Technology (Neutral)
Until the end of last year, we maintained a barbell portfolio within the sector by recommending an overweight position in the late-cyclical and capex-driven technology hardware, storage & peripherals and software indexes while recommending an underweight position in the early-cyclical semi and semi equipment indexes. However, we recently upgraded the niche semi equipment to overweight for three reasons. First, trade policy uncertainty has dealt a blow to this tech subindex. Not only are 90% of sales foreign sourced, but a large chunk is also China-related sales. Second, emerging market financial indicators are showing some signs of life, underscoring that semi equipment demand may turn out to be marginally less grim than currently anticipated (second panel, Chart 26). Third, long term semi equipment EPS growth estimates have recently collapsed to a level far below the broad market, indicating that the sell side has thrown in the towel on this niche sector (third panel, Chart 26). Chart 26A Bottom In Semi Equipment
A Bottom In Semi Equipment
A Bottom In Semi Equipment
Overall, and despite our more bullish view on semi equipment, we continue to recommend a neutral weighting in S&P technology. S&P Utilities (Underweight) Our utilities CMI has recovered recently, bouncing off its 25-year low, driven by the modest easing in interest rates, (Chart 27). This has also manifested in a recovery in the S&P utilities index as this fixed income proxy has reacted to the recent fall in Treasury yields (change in yields shown inverted, top panel, Chart 28) and jump in natural gas prices. Further, utilities are typically seen as a domestic defensive play and the recent trade troubles have made utilities soar in a flight to safety. Chart 27S&P Utilities (Underweight)
S&P Utilities (Underweight)
S&P Utilities (Underweight)
We think the tailwinds lifting utilities are transitory and likely to shift to headwinds. First, one of our key themes for the back half of the year is rising interest rates; a move higher in yields will have a predictably negative impact on these high-dividend paying equities. Second, a flight to safety looks fleeting; the ISM manufacturing new orders index usually moves inversely in lock step with utilities and the most recent message is negative for the S&P utilities index (ISM manufacturing new orders index shown inverted, second panel, Chart 28). Meanwhile, S&P utilities earnings estimates have continued to trail the broad market, having taken a significant step down this year (third panel, Chart 28). Chart 28Rising Rates In Late-2019 Will Be A Headwind For Utilities
Rising Rates In Late-2019 Will Be A Headwind For Utilities
Rising Rates In Late-2019 Will Be A Headwind For Utilities
Our VI and TI share this bearish message as the VI is deeply overvalued and the TI is in overbought territory (Chart 27). S&P Real Estate (Underweight) Our real estate CMI has recently started to turn up, though this is off the near decade-low set last year and remains deeply depressed relative to history (Chart 29). This is principally the result of the backup in interest rates since late last year and the lift they have given to the sector, which has been a relative outperformer over the past six months (top panel, Chart 30). Much like the S&P utilities sector in the previous section, and in the context of BCA’s higher interest rate view, we continue to avoid this sector. Chart 29S&P Real Estate (Underweight)
S&P Real Estate (Underweight)
S&P Real Estate (Underweight)
Along with the modest reprieve in borrowing rates, multi family construction continues unabated (second panel, Chart 30), likely driven by all-time highs in CRE prices (third panel, Chart 30). In the absence of an outright contraction in construction, recent weakening in occupancy (bottom panel, Chart 30) will likely prove deflationary to rents, and thus profit prospects. Chart 30Falling Occupancy Will Hurt REIT Profits
Falling Occupancy Will Hurt REIT Profits
Falling Occupancy Will Hurt REIT Profits
Our VI suggests that REITs are modestly overvalued, though the recent outperformance has driven our TI to an overbought condition (Chart 29). S&P Consumer Discretionary (Underweight) Our consumer discretionary CMI has ticked up recently, pushed higher by resiliency in consumer data. However, the S&P consumer discretionary index has clearly responded, pushing against 40-year highs relative to the S&P 500 and taking our VI to two standard deviations above fair value (Chart 31). Much of this should be attributed to Amazon (roughly 30% of the S&P consumer discretionary index) and their exceptional 12% outperformance relative to the broad market over the past year. Chart 31S&P Consumer Discretionary (Underweight)
S&P Consumer Discretionary (Underweight)
S&P Consumer Discretionary (Underweight)
While we have an underweight recommendation on the S&P consumer discretionary index, we have varying intra-segment preferences, highlighted by the recent inception of a pair trade going long homebuilders and short home improvement retailers (HIR). Housing starts and building permits are extremely sensitive to interest rates, depend on first time home buyers and move in lockstep with the homeownership rate. Currently, interest rates are easing, the homeownership rate is coming out of its GFC funk and first time home buyers are slated to make a comeback this spring selling season. This is a boon for homebuilders at the expense of HIR (top & middle panels, Chart 32). Further, the price of lumber is a key determinant of relative profitability: lumber represents an input cost to homebuilders whereas it is an important selling item in Big Box building & supply retailers that make a set margin on it. The recent drubbing in lumber prices should ease margin pressures on homebuilders but eat into HIR profits (momentum in lumber prices shown inverted and advanced in bottom panel, Chart 32). Chart 32Long Homebuilders / Short Home Improvement Retailers
Long Homebuilders / Short Home Improvement Retailers
Long Homebuilders / Short Home Improvement Retailers
S&P Communication Services (Underweight) As the newly-minted communication services has little more than four months of existence, we do not have adequate history to create a cyclical macro indicator. However, we have created Chart 33 with a number of valuation indicators, though we caution that they too are less reliable than the other indicators presented in the preceding pages, owing to a dearth of history. Chart 33S&P Communication Services (Underweight)
S&P Communication Services (Underweight)
S&P Communication Services (Underweight)
Rather, we refer readers to our still-fresh initiation of coverage on the sector3 and look forward to being able to deliver something more substantive in the future. Size Indicator (Favor Large Vs. Small Caps) Our size CMI has been hovering near the boom/bust line, as it has for most of the last two years (Chart 34). Despite the neutral CMI reading, we downgraded small caps in the middle of last year,4 and moved to a large cap preference, based on the diverging (and unsustainable) debt levels of small caps vs. their large cap peers (bottom panel, Chart 35). This size bias remains a high conviction call for 2019. Chart 34Favor Large Vs. Small Caps
Favor Large Vs. Small Caps
Favor Large Vs. Small Caps
Macro data too has turned against small caps. Recent NFIB surveys have shown that small business optimism has continued to fall through the end of the year, albeit from a very high level (top panel, Chart 35). This has coincided with the continued slide of small cap stocks relative to their large cap peers. Chart 35Small Caps Have A Big Balance Sheet Problem
Small Caps Have A Big Balance Sheet Problem
Small Caps Have A Big Balance Sheet Problem
Further, the percentage of small businesses with planned labor compensation increases continues to set new all-time highs and deviates substantially from the national trend (second panel, Chart 35). This divergence becomes more worrying when plotted against those same firms increasing prices (third panel, Chart 35), which has trailed for some time and recently flattened. The inference is that margin pressure is intensifying and likely to continue for the foreseeable future. In the context of the absence of small cap balance sheet discipline during the past five years, ongoing large cap outperformance seems ever more likely. Footnotes 1 Please see BCA U.S. Equity Strategy Weekly Report, “ Catharsis,” dated January 14, 2019, available at uses.bcaresearch.com. 2 Please see BCA U.S. Equity Strategy Weekly Report, “ Don't Fight The PBoC,” dated February 4, 2019, available at uses.bcaresearch.com. 3 Please see BCA U.S. Equity Strategy Daily Insight, “New Lines Of Communication,” dated October 1, 2018, available at uses.bcaresearch.com. 4 Please see BCA U.S. Equity Strategy Daily Insight, “Small Caps Have A Big Balance Sheet Problem,” dated May 10, 2018, available at uses.bcaresearch.com.
Regional Consolidation Should Help Propel Bank Stocks
Regional Consolidation Should Help Propel Bank Stocks
Overweight In a recent Weekly Report,1 we highlighted four reasons to stay overweight banks that more than counter the risk of a 10/2 yield curve inversion. These are: vibrant and broad-based bank credit growth, pristine credit quality, pent up bank buyback demand and a V-shaped recovery in bank ROE. Further, despite the headwind a flat yield curve represents to net interest margins, ultra low deposit rates provide a healthy margin offset (bottom panel). Yesterday gave us a fifth reason to remain overweight banks; a looming consolidation phase of the multitudinous smaller regional banks. BB&T Corp. announced it was buying SunTrust Banks Inc. in a deal valued at about $66 billion to create a firm with approximately $442 billion in assets, making it the sixth-largest U.S. bank. Unusually, both stocks rallied on this merger announcement which should send a confirming message to other regional players that increased scale to compete with much larger peers will be welcomed by shareholders. Bottom Line: Investors should cheer the return of M&A premia to this still-discounted sector, particularly when returns on equity are soaring (second panel). Stay overweight. The ticker symbols for the stocks in this index are: BLBG: S5BANKX – WFC, JPM, BAC, C, USB, PNC, BBT, STI, MTB, FITB, CFG, RF, KEY, HBAN, CMA, ZION, PBCT, SIVB, FRC,. Footnotes 1 Please see BCA U.S. Equity Weekly Report, “Dissecting 2019 Earnings” dated January 22, 2019, available at uses.bcaresearch.com.
Steel Fundamentals Make A Compelling Case
Steel Fundamentals Make A Compelling Case
Overweight Since our upgrade to overweight mid-last month,1 steel stocks have been outperforming as operating metrics have continued to fire on all cylinders. New orders have been soaring in the past two years as end demand has proven exceptionally resilient and the new orders/inventories ratio clearly demonstrates the industry’s struggles to keep pace with the market’s demand for their products (second panel). The resulting increase in activity has pushed industry capacity utilization to post-GFC highs (third panel). With solid demand in place and constrained capacity, a firm pricing environment seems assured and the focus turns to costs. On that front, the news is equally encouraging; iron ore prices have been modestly rising for much of the past four years but are at levels nearly half those of the previous period (bottom panel). Net, the earnings outlook for steel stocks stands on exceptionally positive footing; stay overweight. The ticker symbols for the stocks in the S&P 1500 steel index are: BLBG: S15STEL – NUE, STLD, RS, X, ATI, CMC, CRS, WOR, AKS, SXC, TMST, HAYN and ZEUS. Footnotes 1 Please see BCA U.S. Equity Strategy Weekly Report, “Catharsis” dated January 14, 2019, available at uses.bcaresearch.com.
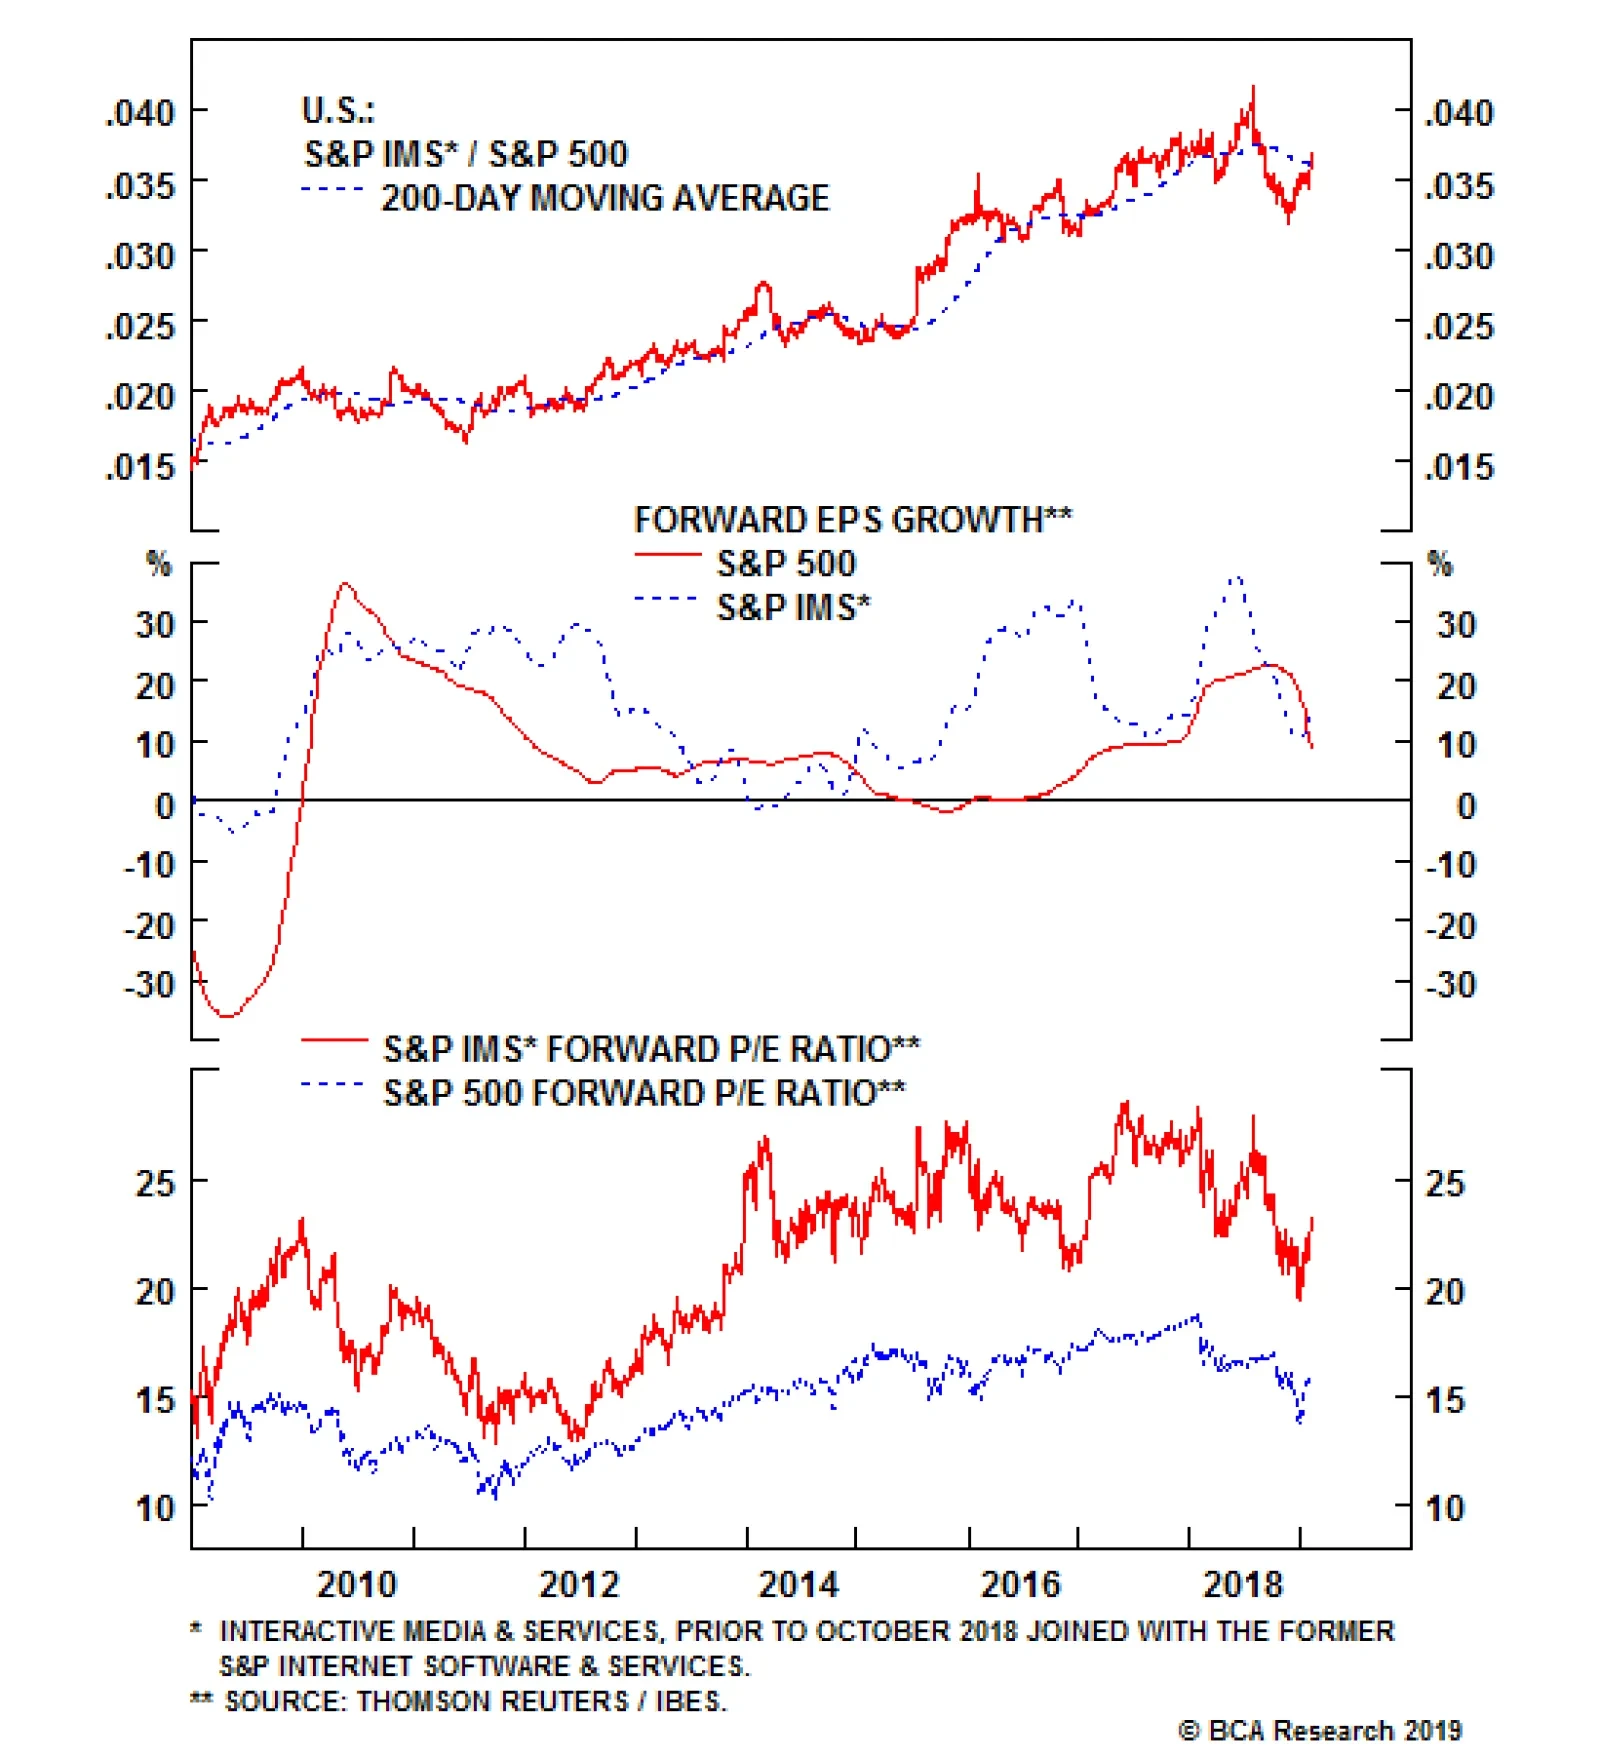
Risk/Reward Still Not There For Interactive Media & Services
…