Sectors

Overweight S&P 1500 Steel
…
Overweight S&P Materials
…

Overweight While steel stocks should have benefitted enormously from the U.S./China trade war and steel import tariffs, China macro dictates the fate of the S&P 1500 steel index. China’s waning fiscal and credit impulses have weighed heavily on U.S. steel stocks. Nevertheless, the recovering Li Keqiang index is sending a positive signal (second panel) and recent news of a mini fiscal package centered on high speed rail infrastructure spending is a step in the right direction (bottom panel). The U.S. dollar is another important macro variable driving U.S. steel stocks performance. The greenback’s steep appreciation since April 2018 has dealt a dual blow to domestic steel producers: not only is the underlying commodity quoted globally in U.S. dollars, but also FX translation losses have dented sector profitability. A pause in the Fed’s hiking cycle could catalyze a reversal of these headwinds. Bottom Line: In Monday’s Weekly Report, we lifted the S&P 1500 steel index from underweight to overweight and locked in gains of 2.3%. This move shifts the S&P materials sector into the overweight column; please see our Weekly Report for more details. The ticker symbols for the stocks in the S&P 1500 steel index are: BLBG: S15STEL – NUE, STLD, RS, X, ATI, CMC, CRS, WOR, AKS, SXC, TMST, HAYN and ZEUS.
Made Of Steel
Made Of Steel
Highlights Portfolio Strategy The budding recovery in Chinese infrastructure outlays and easing in monetary conditions, a pause in the U.S. dollar’s rally on the back of a more dovish Fed and improving domestic steel final-demand dynamics along with compelling valuations and technicals, all suggest it no longer pays to be bearish the S&P 1500 steel index. Boost to overweight. A marginally improving China monetary backdrop, a de-escalation in the U.S./China trade tussle, recovering EM market internals and a brightening profit backdrop, all signal that a re-rating phase looms in the S&P materials sector. Upgrade to a modest overweight. Recent Changes Boost the niche S&P 1500 Steel Index to overweight today. This move also lifts the S&P Materials Index to a modest overweight. Table 1
Catharsis
Catharsis
Feature The S&P 500 convulsed following the December 19th Fed meeting and suffered a cathartic 450 point peak-to-trough fall last month. The Fed likely made a policy error, and Fed Chair Powell’s resolve is getting tested as has happened with every Chair since Volcker (Chart 1).1 Chart 1Powell's Resolve Getting Tested
Powell's Resolve Getting Tested
Powell's Resolve Getting Tested
The top panel of Chart 2 shows that the 2018 peak in the SPX occurred one week prior to the September Fed meeting. That meeting, when the Fed raised rates for the third time that year, was the straw that broke the camel's back. Indeed, the bond market has been signaling that the U.S. economy has reached the neutral rate last year, as the 10-year UST yield stalled near the 3.10% mark on several occasions (middle panel, Chart 2). Chart 2Fed Policy Mistake
Fed Policy Mistake
Fed Policy Mistake
Our recent research also suggests that the Fed’s tightening cycle (from trough-to-peak) is now above the historical median and at least a pause is warranted.2 To put last year’s discount rate increases into further perspective, bottom panel of Chart 2 shows that a 100bps increase in the fed funds rate caused a roughly 30% collapse in the forward P/E. Not only is this multiple compression overdone, but prices also corrected 19% from peak-to-trough, likely paving the way for a smart recovery. Our running assumption remains that the U.S. economy will avoid recession this year and EPS will continue to expand. True, the yield curve inversions have widened beyond the 5/3 and 5/2 slopes to the 7/1, and we heed the bond market’s message (Chart 3). However, as we highlighted last month, yield curve inversions occur before stock market peaks. Keep in mind that the most important yield curve slope, the 10/2, has not yet inverted. The upshot is that the SPX has yet to peter out for the cycle.3 Chart 3Yield Curve Inversion Is Spreading
Yield Curve Inversion Is Spreading
Yield Curve Inversion Is Spreading
With regard to our end-2019 SPX target we are revising our base case scenario to 3,000 (from 3,150 previously),4 based on a 2020 EPS revision to $181 (from $191 previously),5 but we are sustaining the multiple at 16.5 times (Table 2). Assuming 2018 EPS end near $162, this represents a 6% EPS CAGR, in line with the still mid-single digit expansion signal from our EPS growth model (Chart 4). Table 2SPX EPS & Multiple Sensitivity
Catharsis
Catharsis
Chart 4EPS Growth Model Still Expects Mid-Single Digit Expansion
EPS Growth Model Still Expects Mid-Single Digit Expansion
EPS Growth Model Still Expects Mid-Single Digit Expansion
Adding it up, stocks hit rock bottom late-last year and a pause in the Fed tightening cycle, at least for the first half of the year, will likely serve as a welcome catalyst; any positive news on the trade tussle front with China will also act as a tonic for stocks, especially beaten down deep cyclicals. This week we are upgrading a U.S./China trade war GICS1 sector victim to a modest overweight position, via boosting a niche deep cyclical sub-index to an above benchmark allocation. Made Of Steel We are booking gains of 2.3% in the niche S&P 1500 steel index and boosting it from underweight all the way to an overweight stance. Beyond the contrary buy signal that bombed out technicals and depressed valuations are sending (Chart 5), there are high odds that relative profit outperformance is in the early innings. Chart 5Steel Is A Steal
Steel Is A Steal
Steel Is A Steal
While U.S. steel stocks should have benefitted enormously from the U.S./China trade war and steel import tariffs, China macro dictates the fate of the S&P 1500 steel index. China’s waning fiscal and credit impulses have weighed heavily on U.S. steel stocks (top panel, Chart 6). Chinese authorities have been trying to engineer a soft landing, but the Chinese manufacturing PMI has now dipped below the boom/bust line (middle panel, Chart 6). Chart 6Mixed China Signals...
bca.uses_wr_2019_01_14_c6
bca.uses_wr_2019_01_14_c6
Nevertheless, the recovering Li KEQIANG index is sending a positive signal (bottom panel, Chart 6). In addition, recent news of a mini fiscal package centered on high speed rail infrastructure spending is a step in the right direction. Historically, Chinese infrastructure outlays and relative share prices have been joined at the hip (middle panel, Chart 7). Chart 7...But Monetary And Fiscal Taps Are Opening
...But Monetary And Fiscal Taps Are Opening
...But Monetary And Fiscal Taps Are Opening
On the monetary front, the easing in the banks’ reserve-requirement-ratio (RRR), albeit with a delayed effect, should also aid infrastructure spending uptake (RRR shown inverted, bottom panel, Chart 7). Similarly, the steepening in the Chinese yield curve underscores that easing financial conditions are conducive to a pickup in capital outlays (top panel, Chart 7). The U.S. dollar is another important macro variable driving U.S. steel stocks performance. The greenback’s steep appreciation since April 2018 has dealt a dual blow to domestic steel producers: not only is the underlying commodity quoted globally in U.S. dollars, but also FX translation losses have dented sector profitability. Despite the grim U.S. dollar news, there is light at the end of the tunnel. Were the Fed to pause its hiking cycle, at least in the front half of the year, the greenback’s advance may go on hiatus. Importantly, J.P. Morgan’s EM FX index is staging a comeback and steel prices are holding their own (top and bottom panels, Chart 8). Chart 8Bright Profit Drivers
Bright Profit Drivers
Bright Profit Drivers
On the domestic front, news is also encouraging. Ever since President Trump came into power, blast furnaces have been running around the clock. Industry resource utilization rates are in a V-shaped recovery since 2016 and only recently returned to levels last seen prior to the Great Recession (middle panel, Chart 8). Steel new order growth is running at a healthy clip and is even surpassing inventory accumulation. This bright demand backdrop is a boon for steelmaking earnings (Chart 9). Chart 9Domestic Operating Backdrop...
Domestic Operating Backdrop...
Domestic Operating Backdrop...
With regard to the domestic demand front, while automobile sales have been flirting with the zero growth line for the better part of the past three years, non-residential construction has been a primary beneficiary from the easing in fiscal policy (bottom panel, Chart 10). Fiscal thrust will continue to goose the U.S. economy in 2019, according to the IMF’s October 2018 World Economic Outlook update, and a new infrastructure spending bill, however modest, will, at the margin, buoy steel profits. Finally, according to the Fed’s latest Senior Loan Officer Survey, bankers are far from constricting the flow of credit toward the key end-demand segments, autos and commercial real estate. Chart 10...And Domestic Demand Will Buoy Steel Profits
...And Domestic Demand Will Buoy Steel Profits
...And Domestic Demand Will Buoy Steel Profits
In sum, compelling valuations and technicals, the budding recovery in Chinese infrastructure outlays and easing in monetary conditions, a pause in the U.S. dollar’s rally on the back of a more dovish Fed and improving domestic steel final-demand dynamics, all suggest that it no longer pays to be bearish the S&P 1500 steel index. Bottom Line: Lift the S&P 1500 steel index from underweight to overweight and lock in gains of 2.3%. The ticker symbols for the stocks in the S&P 1500 steel index are: BLBG: S15STEL – NUE, STLD, RS, X, ATI, CMC, CRS, WOR, AKS, SXC, TMST, HAYN and ZEUS. Time To Dip Into Materials Raising the S&P 1500 steel index to an above benchmark allocation shifts the S&P materials sector into the overweight column. China macro dominates the direction of U.S. materials stocks. On the monetary front, the easing cycle continues unabated and the near 150bps year-over-year drop in the 10-year Chinese Treasury yield will soon start to bear fruit (yield change shown inverted and advanced, bottom panel, Chart 11). Chart 11Buy Materials As China's Monetary Spigots Are Loosening
Buy Materials As China's Monetary Spigots Are Loosening
Buy Materials As China's Monetary Spigots Are Loosening
The renminbi also moves in lockstep with relative share prices. The apparent de-escalation in the U.S./China trade tensions has boosted the CNYUSD and is signaling that a playable reflation trade is in the offing in the S&P materials sector (top panel, Chart 11). Beyond the budding recovery in some key Chinese data (bottom panel, Chart 12), the troughing in emerging markets (EM) currencies versus the greenback also suggests that U.S. materials stocks have put in a bottom (top panel, Chart 12). Chart 12Shifting EM Internals Are A Boon For Materials
Shifting EM Internals Are A Boon For Materials
Shifting EM Internals Are A Boon For Materials
The EM stock outperformance compared with the global benchmark (second panel, Chart 12) along with EM market internals corroborate the EM FX message. In more detail, EM Latin American equities have been significantly outperforming EM Asian bourses. This real time proxy of commodity producers versus consumers has been an excellent indicator of relative share prices and the current message is to expect more relative gains in the S&P materials sector (third panel, Chart 12). On the earnings front, while last year’s trade dispute related collapse in relative share prices is signaling profit trouble in the coming months, our EPS growth model (comprising the U.S. dollar, interest rates and commodity prices) has ticked up. Similar to the 2012 and 2016 lows, there are good odds that our model is picking up a soft landing in profits (second panel, Chart 13). Chart 13Profit Growth Model Has Troughed
Profit Growth Model Has Troughed
Profit Growth Model Has Troughed
S&P materials sub-sector EPS breadth has slingshot higher compared with the overall market and relative long-term EPS growth forecasts are trying to bottom near the 2016 nadir (third & bottom panels, Chart 13). With regard to the sector’s financial health, materials’ indebtedness profile remains in recovery mode, still in the aftermath of the late-2015/early-2016 manufacturing recession with net debt-to-EBITDA in a free fall and a steeply accelerating interest coverage ratio. Capital outlays are also expanding smartly and are now on an even keel with sales growth (Chart 14). Given this improvement in corporate health, there are low odds of debt-related materials sector deflation. Chart 14Clean Bill Of Corporate Health
Clean Bill Of Corporate Health
Clean Bill Of Corporate Health
Taking the pulse of investor sentiment toward this niche deep cyclical sector reveals that technical conditions are as oversold as can be; in fact our Technical Indicator sits at one standard deviation below the historical mean, a level that has preceded previous recovery rallies (Chart 15). Chart 15Contrary Buy Alert: Under-owned...
Contrary Buy Alert: Under-owned...
Contrary Buy Alert: Under-owned...
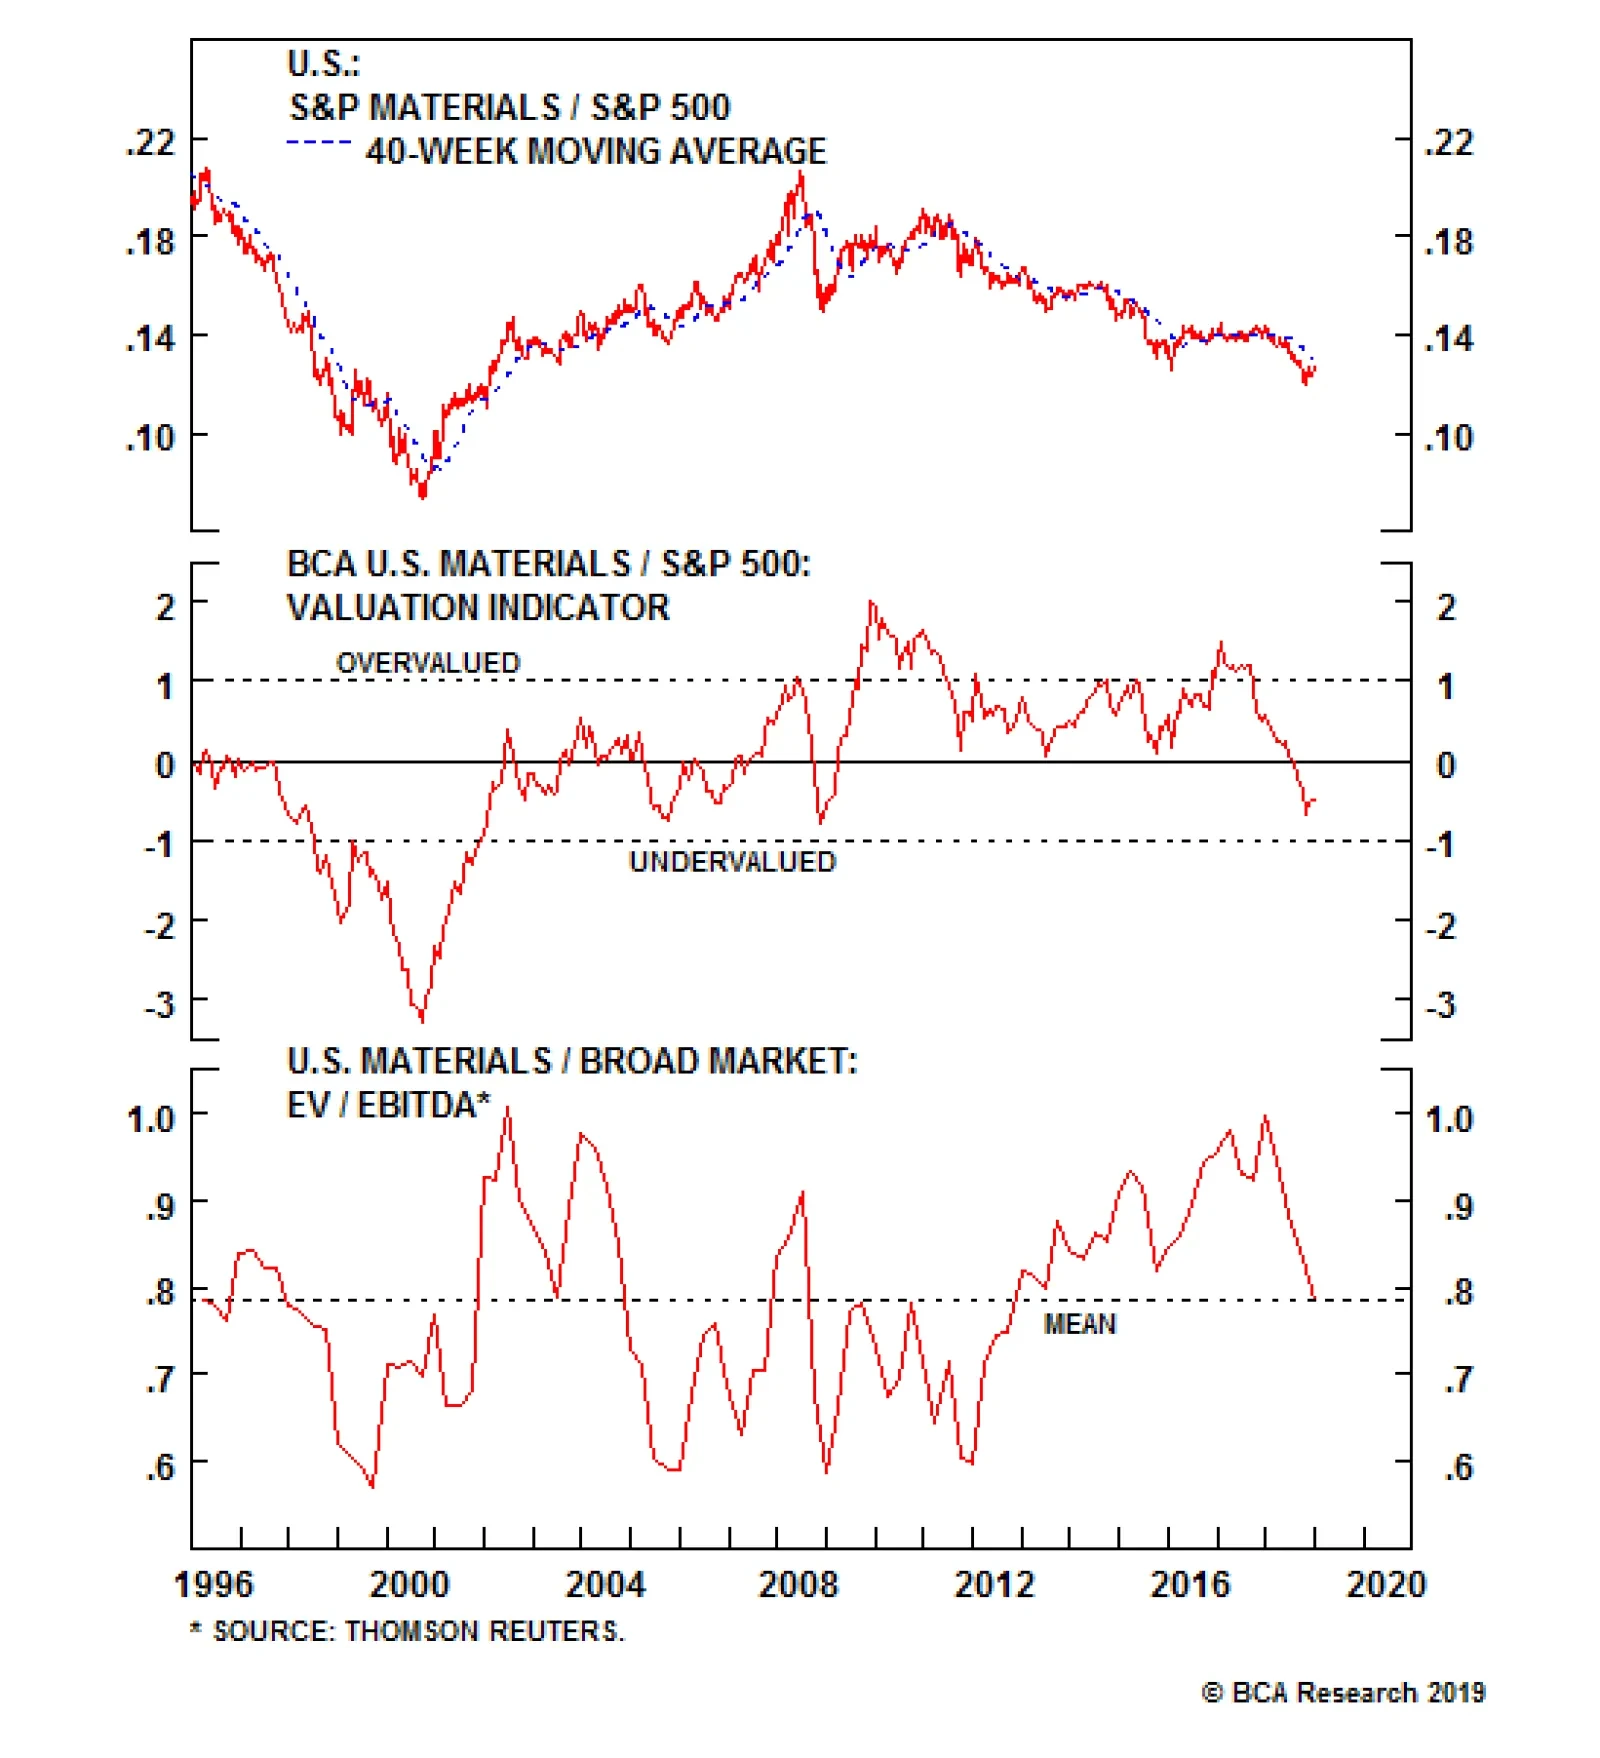
Finally, according to our Valuation Indicator, relative valuations have crumbled to the lowest level since the GFC, and even relative EV/EBITDA has also corrected to the historical mean (Chart 16). Chart 16...And Unloved
...And Unloved
...And Unloved
Netting it out, a marginally improving China monetary backdrop along with a de-escalation in the U.S./China trade tussle, recovering EM market internals and a brightening profit backdrop, all signal that a re-rating phase looms in the S&P materials sector. Bottom Line: Lift the S&P materials sector to a modest overweight position. Anastasios Avgeriou, Vice President U.S. Equity Strategy anastasios@bcaresearch.com Footnotes 1 Please see BCA U.S. Equity Strategy Weekly Report, “Will The Market Test Powell?” dated November 13, 2017, available at uses.bcaresearch.com. 2 Please see BCA U.S. Equity Strategy Weekly Report, “Manic Market” dated November 19, 2018, available at uses.bcaresearch.com. 3 Please see BCA U.S. Equity Strategy Weekly Report, “Signal Vs. Noise” dated December 17, 2018, available at uses.bcaresearch.com. 4 Please see BCA U.S. Equity Strategy Weekly Report, “Lifting SPX Target” dated April 30, 2018, available at uses.bcaresearch.com. 5 Ibid. Current Recommendations Current Trades Size And Style Views Favor value over growth Favor large over small caps
Underweight (High-Conviction) The flattening of both fixed residential investment and existing home sales (bottom panel) have given us cause for concern with respect to home improvement retailers (HIR). While we remain bullish on the domestic housing market, HIR have seen huge valuation gains over the past four years (top panel), which the softer data fail to justify. In the context of lumber prices that have fallen from their parabolic highs (third panel), at least a slowing of top line growth seems inevitable. Our earnings model captures these factors as well as higher mortgage rates, all of which have driven our HIR earnings model into outright deflation (bottom panel). Even if this proves to be overly pessimistic, it should at least drive higher equity risk premiums in the sector, taking some wind out of the inflated valuation. Bottom Line: Valuations in HIR are not supported by softening demand data, revenue headwinds and rising interest rates. We reiterate our high-conviction underweight recommendation. The ticker symbols for the stocks in this index are: BLBG: S5HOMI - HD, LOW.
Home Improvement Retail Is Set For A Down-Leg
Home Improvement Retail Is Set For A Down-Leg
Highlights All of our recent investment recommendations have performed very strongly but have further to go: 1. Own a combination of European banks plus U.S. T-bonds. 2. Overweight EM versus DM. 3. Overweight European versus U.S. equities. 4. Overweight Italian assets versus European assets. 5. Overweight the JPY. Feature Chart of the WeekBank Outperformance Corroborates A Growth Rebound
Bank Outperformance Corroborates A Growth Rebound
Bank Outperformance Corroborates A Growth Rebound
2019 will be the investment mirror-image of 2018. Last year started with growth fading and inflation on the cusp of picking up, both in Europe and around the world. This year has started with the European and global economies in the mirror-image configuration: growth likely to rebound, albeit modestly, and inflation set to fade (Chart I-2). Chart I-2Why 2019 Is The Mirror-Image Of 2018
Why 2019 Is The Mirror-Image Of 2018
Why 2019 Is The Mirror-Image Of 2018
However, as 2019 unfolds, the configuration will reverse, requiring a flip from a pro-cyclical to a pro-defensive investment tilt later in the year. This contrasts with 2018 which started pro-defensive and ended pro-cyclical. In this regard, the economic and investment shape of 2019 will be the mirror-image of 2018. Growth To Rebound, Inflation To Fade A tell-tale sign of a growth rebound is the recent outperformance of banks. Around the world, yield curves have flattened – or even inverted – meaning that banks’ net interest margins have compressed. This compression of bank profit margins is normally bad news for bank equities. Yet banks have been outperforming, not just in Europe but globally (Chart I-3). If margins are compressing, the plausible explanation for outperformance would be an improved outlook for asset growth, reflecting both a reduction in bad debt provisioning and a pick-up in bank credit growth. Chart I-3Banks Have Been Outperforming Since October
Banks Have Been Outperforming Since October
Banks Have Been Outperforming Since October
Independently and reassuringly, our proprietary credit impulse analysis supports this thesis (Chart of the Week). Six-month credit impulses have been rebounding not only in Europe, but also in the United States and very impressively in China (Chart I-4). Chart I-46-Month Credit Impulses Have Rebounded Everywhere
6-Month Credit Impulses Have Rebounded Everywhere
6-Month Credit Impulses Have Rebounded Everywhere
At the same time, inflation is set to disappoint as the recent near-halving of the crude oil price feeds into both headline and core consumer price indexes. With central banks now promising even greater “dependence on the incoming data”, this unfolding dynamic will force them to temper any hawkish intentions and rhetoric, limiting the extent of upside in bond yields. In this configuration, the combination of European banks plus U.S. T-bonds which we first recommended in November is still appropriate (Chart I-5). The position is up 3 percent in little more than a month and has further to go.1 Chart I-5Own A Combination Of Banks And Bonds
Own A Combination Of Banks And Bonds
Own A Combination Of Banks And Bonds
Europe’s largest economy, Germany, should benefit from another support to growth. Last year, the auto sector – a major engine of the German economy – spluttered as it absorbed the new WLTP emissions testing standard. Through the middle of 2018 German motor vehicle exports suffered a €20 billion hit which shaved 0.6 percent from Germany’s €3.4 trillion economy (Chart I-6). Now, if auto exports stabilize, this drag will disappear. And if auto exports recover to the pre-WLTP level after this one-off and temporary shock, Germany will receive a 0.6% mirror-image boost to growth.2 Chart I-6German Auto Exports Suffered A WLTP Hit
German Auto Exports Suffered A WLTP Hit
German Auto Exports Suffered A WLTP Hit
Regional Allocation Is Always And Everywhere About Sectors The European equity earnings cycle is tightly connected with global growth oscillations (Chart I-7). The simple reason is that the European equity market is over-exposed to classically growth-sensitive sectors such as banks and industrials. Chart I-7The European EPS Cycle Is Tightly Connected With Global Growth Oscillations
The European EPS Cycle Is Tightly Connected With Global Growth Oscillations
The European EPS Cycle Is Tightly Connected With Global Growth Oscillations
The emerging market earnings cycle is also connected with global growth oscillations (Chart I-8) because emerging markets have a very high exposure to banks. But the much less understood reason is that emerging markets have a near-zero exposure to healthcare (Table I-1). In sharp contrast, the U.S. equity earnings cycle has almost no connection with global growth oscillations (Chart I-9) because the U.S. equity market is over-exposed to technology and healthcare, neither of which are classically cyclical sectors. Chart I-8The EM EPS Cycle Is Also Connected With Global Growth Oscillations...
The EM EPS Cycle Is Also Connected With Global Growth Oscillations...
The EM EPS Cycle Is Also Connected With Global Growth Oscillations...
Chart I-9...But The U.S. EPS Cycle Is Not Connected With Global Growth Oscillations
...But The U.S. EPS Cycle Is Not Connected With Global Growth Oscillations
...But The U.S. EPS Cycle Is Not Connected With Global Growth Oscillations
Chart I-
Hence the allocation to emerging market (EM) versus developed market (DM) equities, and to Europe versus the U.S. reduce to simple equity sector calls. A quick glance at Chart I-10 and Chart I-11 will reveal two fundamental and inescapable truths: Chart I-10EM Outperforms DM When Global Banks Outperform Healthcare
EM Outperforms DM When Global Banks Outperform Healthcare
EM Outperforms DM When Global Banks Outperform Healthcare
Chart I-11European Equities Outperform U.S. Equities When Global Banks Outperform Technology
11. European Equities Outperform U.S. Equities When Global Banks Outperform Technology
11. European Equities Outperform U.S. Equities When Global Banks Outperform Technology
EM outperforms DM when global banks outperform global healthcare. European equities outperform U.S. equities when global banks outperform global technology. But is this just about so-called ‘beta’? No, banks can outperform in a rising market by going up more or, as recently, in a falling market by going down less. So this is always and everywhere about head-to-head sector relative performances. My colleague Arthur Budaghyan, our chief emerging market strategist, remains steadfastly pessimistic on the structural outlook for EM versus DM. We agree with Arthur, albeit we arrive at the structural conclusion from a completely different perspective. To reiterate, for EM to outperform DM global banks must outperform global healthcare. However, over an extended period this will prove to be an extremely tall order. As detailed in European Banks: The Case For And Against, blockchain is a long-term extinction threat to banks’ business models and profitability. Whereas healthcare is still a major growth sector as people focus more spending on improving the quality and quantity of their lifespans.3 Nevertheless, from a purely tactical perspective, the growth up-oscillation phase that started in October can continue for a little while longer allowing the recent countertrend moves to persist – especially as the recent decline in bond yields could further spur credit growth in the near term. So for the moment stay overweight: EM versus DM. European equities versus U.S. equities. Italian assets versus European assets. Bargain Basement Currencies Another of my colleagues Doug Peta, our chief U.S. strategist, has coined a lovely metaphor: “you cannot get hurt falling out of a basement window”. The metaphor beautifully captures the asymmetry when you are near the floor or ‘zero-bound’. Doug uses it to explain that small contributors to an economy have a limited capacity to damage economic growth because they cannot fall very far. We think the metaphor applies equally to interest rates when they are at or near their lower bound, which is to say, in the basement. This begs the obvious question: if interest rates are in the basement, then what is it that cannot get hurt much? The answer is: the exchange rate. The payoff profile for exchange rates just tracks expected long-term interest rate differentials. This means that when the expected interest rate is in or near the basement, the currency possesses a highly attractive payoff profile called positive skew. In essence, for any central bank already at the realistic limit of ultra-loose policy – such as the BoJ and ECB – policy rate expectations are effectively in the basement. They cannot go significantly lower. In contrast, policy rate expectations for the Federal Reserve are somewhere between the seventh and twelfth storey of the building (Chart I-12). From which you can get seriously hurt if you fall out of the window! Chart I-12You Cannot Get Hurt Falling Out Of A Basement Window
You Cannot Get Hurt Falling Out Of A Basement Window
You Cannot Get Hurt Falling Out Of A Basement Window
The upshot is that currency investors should always own at least one currency whose interest rate is in the basement against one whose interest rate is high up in the building, susceptible to fall out at some point, and get seriously hurt. The near term complication is the risk, albeit low, of a no-deal Brexit which would hurt European economies and currencies to a greater or lesser extent. Until the Brexit fog shows some signs of clearing, we would prefer the currency whose interest rate is in the basement to be a non-European currency. So for the moment, our favourite major currency remains the JPY. Dhaval Joshi, Senior Vice President Chief European Investment Strategist dhaval@bcaresearch.com Fractal Trading System* We are pleased to report that the 50:50 combination of Litecoin and Ethereum has surged by 42 percent in just two weeks! Also, long EUR/NZD achieved its 2.5 percent profit target and is now closed. This week’s trade is in line with the recommendation in the main body of this report to become pro-cyclical. Go long global industrials versus global utilities with a profit target of 3 percent and a symmetrical stop-loss. For any investment, excessive trend following and groupthink can reach a natural point of instability, at which point the established trend is highly likely to break down with or without an external catalyst. An early warning sign is the investment’s fractal dimension approaching its natural lower bound. Encouragingly, this trigger has consistently identified countertrend moves of various magnitudes across all asset classes. Chart I-13
Long Global Industrials Vs. Global Utilities
Long Global Industrials Vs. Global Utilities
The post-June 9, 2016 fractal trading model rules are: When the fractal dimension approaches the lower limit after an investment has been in an established trend it is a potential trigger for a liquidity-triggered trend reversal. Therefore, open a countertrend position. The profit target is a one-third reversal of the preceding 13-week move. Apply a symmetrical stop-loss. Close the position at the profit target or stop-loss. Otherwise close the position after 13 weeks. Use the position size multiple to control risk. The position size will be smaller for more risky positions. * For more details please see the European Investment Strategy Special Report “Fractals, Liquidity & A Trading Model,” dated December 11, 2014, available at eis.bcaresearch.com Footnotes 1 The European banks position is relative to the broader equity market, and the recommended combination is 25 cents in the banks and 75 cents in the bonds. 2 German auto net exports and GDP are quoted at annualized rates. The Worldwide Harmonized Light Vehicle test Procedure (WLTP) is a new standard for auto emissions that took effect on September 1, 2018. 3 Please see the European Investment Strategy Special Report “European Banks: The Case For And Against”, November 8, 2018 available at eis.bcaresearch.com. Fractal Trading System Recommendations Asset Allocation Equity Regional and Country Allocation Equity Sector Allocation Bond and Interest Rate Allocation Currency and Other Allocation Closed Fractal Trades Trades Closed Trades Asset Performance Currency & Bond Equity Sector Country Equity Indicators Bond Yields Chart II-1Indicators To Watch - Bond Yields
Indicators To Watch - Bond Yields
Indicators To Watch - Bond Yields
Chart II-2Indicators To Watch - Bond Yields
Indicators To Watch - Bond Yields
Indicators To Watch - Bond Yields
Chart II-3Indicators To Watch - Bond Yields
Indicators To Watch - Bond Yields
Indicators To Watch - Bond Yields
Chart II-4Indicators To Watch - Bond Yields
Indicators To Watch - Bond Yields
Indicators To Watch - Bond Yields
Interest Rate Chart II-5Indicators To Watch - Interest Rate Expectations
Indicators To Watch - Interest Rate Expectations
Indicators To Watch - Interest Rate Expectations
Chart II-6Indicators To Watch - Interest Rate Expectations
Indicators To Watch - Interest Rate Expectations
Indicators To Watch - Interest Rate Expectations
Chart II-7Indicators To Watch - Interest Rate Expectations
Indicators To Watch - Interest Rate Expectations
Indicators To Watch - Interest Rate Expectations
Chart II-8Indicators To Watch - Interest Rate Expectations
Indicators To Watch - Interest Rate Expectations
Indicators To Watch - Interest Rate Expectations
Highlights Our leading indicator for China’s old economy continues to point to slower growth over the coming months, which is consistent with the bearish message from China’s housing market and forward-looking export indicators. We would caution investors against interpreting the recent relative outperformance of Chinese stocks as a basis to become cyclically bullish, as it has largely reflected a “catchup” selloff in global stocks. We remain tactically overweight, in recognition of the fact that investors may bid up Chinese stocks on positive signs that a trade deal may be in sight. Onshore corporate bond spreads remain wide relative to pre-2017 levels, suggesting that it is too early to expect easier liquidity conditions to significantly improve domestic economic conditions. Feature Tables 1 and 2 on pages 2 and 3 highlight key developments in China’s economy and its financial markets over the past month. On the growth front, the primary trend for China’s old economy remains down, although measures of freight remain supported by trade front-running activity (which will wane over the coming months). Our Li Keqiang leading indicator continues to suggest that economic activity will slow from current levels, a conclusion that is reinforced by recent developments in the housing market and December’s PMI release. Table 1The Trend In Domestic Demand, And The Outlook For Trade, Remains Negative
Monitoring The (Weak) Pulse Of The Data
Monitoring The (Weak) Pulse Of The Data
Table 2Financial Market Performance Summary
Monitoring The (Weak) Pulse Of The Data
Monitoring The (Weak) Pulse Of The Data
From an investment strategy perspective, we remain tactically overweight Chinese investable stocks versus the global benchmark in recognition of the fact that investors may bid up Chinese stocks on positive signs that a trade deal may be in sight. However, China’s recent outperformance has been passive in nature (i.e. reflecting declining global stocks), suggesting that Chinese stocks have simply been the winner of an “ugly contest” over the past few months. This is hardly a basis to be cyclically long, and we continue to recommend that investors remain neutral for now. In reference to Tables 1 and 2, we provide several detailed observations concerning developments in China’s macro and financial market data below: Bloomberg’s measure of the Li Keqiang index (LKI) fell in November for the third month in a row, although our Alternative LKI has risen due to a pickup in freight transport turnover. We showed in our December 5 Weekly Report that trade front-running has clearly boosted economic activity since Q1 of 2018,1 implying that freight volume growth is set to decelerate in the months ahead. Our Li Keqiang leading indicator ticked lower in December, after having risen non-trivially in the third quarter of 2018 (Chart 1). The December decline was caused by a pullback in the monetary conditions components of the indicator, which in turn was caused by the recent rise in CNY-USD. This echoes a point that we have made in previous reports, that the improvement in our leading indicator last year was not broad-based and that it does not yet herald a positive turning point for China’s old economy. Chart 1The Q3 Rise In Our Leading Indicator Was Not Broad-Based
The Q3 Rise In Our Leading Indicator Was Not Broad-Based
The Q3 Rise In Our Leading Indicator Was Not Broad-Based
The October housing market slowdown that we highlighted in our November 21 Weekly Report continued into December,2 with floor space started and sold decelerating further (Chart 2). The latter, which typically leads the former, has returned to negative territory which, in conjunction with weaker Pledged Supplementary Lending from the PBOC, does not bode well for housing over the coming few months. House price appreciation remains strong outside of tier 1 cities, but a peak in our price diffusion indexes signals slower price gains are likely over the coming months. Chart 2China's Housing Market Activity Continues To Weaken
China's Housing Market Activity Continues To Weaken
China's Housing Market Activity Continues To Weaken
On the trade front, nominal Chinese US$ import and export growth is now trending lower, confirming the negative signal provided by China’s manufacturing PMIs over the past few months. Notably, the new export orders components of both the official and Caixin PMIs declined in December, despite the tariff ceasefire that emerged during the G20 meeting at the end of November, suggesting that export growth is set to slow further in the first quarter of 2019. In relative US$ terms, Chinese investable stocks rose nearly 10% versus the global benchmark from mid-October until the end of 2018. However, as Chart 3 shows, this outperformance was entirely passive in nature, as Chinese stocks have not been trending higher in absolute terms. Chart 3Recent Equity Outperformance Has Been Passive, Not Active
Recent Equity Outperformance Has Been Passive, Not Active
Recent Equity Outperformance Has Been Passive, Not Active
We remain tactically overweight Chinese investable stocks; the Chinese market remains deeply oversold in absolute terms, and signs of a potential trade deal over the coming few weeks may significantly improve global investor sentiment towards the country’s bourse. However, we would caution investors against interpreting the recent relative outperformance as a basis to become cyclically bullish, as it has largely reflected a “catchup” selloff in global stocks. The underperformance of Chinese health care stocks over the past two months has been stunning, with investable health care having fallen nearly 30% in relative terms since mid-November (Chart 4). However, this decline appears to have been caused by a sector-specific event (a massive profit margin squeeze due to a new government generic drug procurement program), and does not seem to imply anything about the outlook for Chinese consumers. Chart 4A Stunning, Idiosyncratic, Collapse In Health Care Stocks
A Stunning, Idiosyncratic, Collapse In Health Care Stocks
A Stunning, Idiosyncratic, Collapse In Health Care Stocks
Despite the recent collapse in the health care sector, Chinese consumer discretionary (CD) stocks remain the largest losers within the investable universe, having declined over 40% in US$ terms over the past 12 months. The next twelve months may look quite different for CD, especially if China’s efforts to stimulate consumer spending succeed. The recent changes to the global industrial classification system (GICS) mean that Alibaba (China’s largest e-commerce retailer) is now included in the sector with a significant weight, overwhelming the heavy influence that auto producers used to wield. Auto stocks have struggled in the past due to China’s pollution controls, weak auto sales, and pledges to open up the auto sector (which would be negative for the market share of domestic firms). We will be watching over the coming several months for a pickup in retail goods spending combined with a technical breakout in relative performance as a sign to overweight Chinese consumer discretionary stocks relative to the investable index. Chinese interbank rates have fallen substantially over the past month (Chart 5), in response to additional efforts by the PBOC to boost liquidity in the financial system. Whether the additional liquidity (and lower borrowing rates) will feed into materially stronger credit growth remains to be seen, as we have presented evidence in past reports showing that China’s monetary policy transmission mechanism is impaired.2 Chart 5More Liquidity Has Lowered Interbank Rates
More Liquidity Has Lowered Interbank Rates
More Liquidity Has Lowered Interbank Rates
Chinese onshore corporate bond spreads have creeped modestly higher since early-November, although by a small magnitude. While we remain optimistic that onshore defaults over the coming year will be less intense than many investors believe, onshore corporate bond spreads have been one of the more successful leading indicators of economic growth in China over the past two years, and remain wide by historical standards. This suggests that it is too early to expect easier liquidity conditions to significantly improve domestic economic conditions. While it is too early to call a durable bottom, the gap between CNY-USD and its 200-day moving average is steadily closing (Chart 6). The recent (modest) uptrend has been caused by two factors: 1) cautious optimism about the possibility of a durable trade deal with the U.S., and 2) retreating U.S. interest rate expectations. We would expect further weakness if the trade ceasefire collapses and President Trump moves forward with the previously-announced tariffs, but also a sizeable rally if a deal is negotiated. Chart 6A Tentative, But Noteworthy Improvement
A Tentative, But Noteworthy Improvement
A Tentative, But Noteworthy Improvement
Jonathan LaBerge, CFA, Vice President Special Reports jonathanl@bcaresearch.com Footnotes 1 Please see China Investment Strategy Weekly Report “2019 Key Views: Four Themes For China In The Coming Year”, dated December 5, 2018, available at cis.bcaresearch.com. 2 Please see China Investment Strategy Weekly Report “Trade Is Not China's Only Problem”, dated November 21, 2018, available at cis.bcaresearch.com. Cyclical Investment Stance Equity Sector Recommendations
Neutral The pharma space has been exploding with merger mania as the largest pharma deal ever (Bristol-Myers Squibb buying Celgene for approximately $90 billion) was followed up by Eli Lilly acquiring Loxo Oncology for nearly $8 billion. These fall on the back of other notable global deals including GlaxoSmithKline buying Tesaro for $5.1 billion last month and Takeda buying Shire for $62 billion mid-last year. Such exuberance has clearly confirmed that merger premia are alive and well in the S&P pharma index. It is not merely rising premia that have taken pharma higher either. Pricing power has entered the early innings of a recovery (top panel) while the key export channel points to increasingly bright days ahead (second panel). However, pharma’s consolidation phase has come at a cost to sector leverage ratios that have dramatically expanded (bottom panel). The $33.5 billion loan taken on by Bristol-Myers Squibb to fund the cash portion of their acquisition and Eli Lilly’s all-cash offer are unlikely to help this ratio, regardless of a rosier EBITDA outlook. Bottom Line: Things are looking up for pharma but an expensive consolidation cycle will stretch balance sheets; stay neutral. The ticker symbols for the stocks in the S&P pharma index are: BLBG: S5PHAR - JNJ, PFE, MRK, BMY, AGN, LLY, ZTS, MYL, PRGO, NKTR.
Size Is The Prescription But Beware The Dosage
Size Is The Prescription But Beware The Dosage
Populism > Profits: Watch Out Tech
…
Overweight (downgrade alert) The S&P tech hardware, storage & peripherals (THSP) index has been falling from its late-summer peak, caused first by weak quarterly guidance from Apple (which comprises close to 90% of the index) and since worsened by last week’s announcement that softness from the key China market would see revenues miss even that lowered bar. This hardly seems surprising in the context of currencies that have not performed to Apple’s benefit as the decline in the RMB (shown inverted in the bottom panel) would mean that even if unit sales held flat, translation would see a fall in Chinese sales. Further, growth in Asian exports and sentiment on Apple’s earnings are tied at the hip (second panel); with a trade war compounding a clearly softer Chinese consumer, a step down in earnings estimates seems logical. Still, the news is not all bad as the core domestic market remains resilient. U.S. consumer spending on electronics is at a multi-year high (third panel) and the currency headwinds to top line growth should prove to be tailwinds to margins, considering the imported content of Apple’s products. Bottom Line: We view the recent pullback in the S&P THSP index as the reset button being pressed and accordingly we reiterate our overweight recommendation. However, we note our existing downgrade alert on the index;1 further deterioration in China would be a likely catalyst to trigger such a move. The ticker symbols for the stocks in this index are: BLBG: S5CMPE - HPQ, WDC, STX, XRX, AAPL, HPE, NTAP. 1 Please see BCA U.S. Equity Strategy Insight Report, “The Falling Apple And The Law Of Gravity,” dated November 13, 2018, available at uses.bcaresearch.com.
Chinese Sales Fall Flat For Apple
Chinese Sales Fall Flat For Apple