Sectors

Dear Client, I have been on the road visiting clients in St. Louis, Minneapolis, and Chicago this week. Instead of our regular Weekly Report, we are sending you a Special Report on European bank stocks written by my colleague Xiaoli Tang from our Global Asset Allocation service. In advance of the holiday season, we will be publishing next week’s report summarizing our key views for 2019 on Tuesday morning. Best regards, Peter Berezin, Chief Global Strategist Highlights Euro area bank profits are driven more by economic growth than monetary factors. This growth link explains the close correlation between the relative performance of banks within the euro area and the relative performance between euro area and U.S. equities. It also highlights the importance of euro area banks to global asset allocators. Euro area banks now have attractive valuations, which are offset however by a lackluster profit outlook. Long-term investors should avoid banks in the region. Investors with a more tactical mandate and much nimbler style could use our valuation indicators to “time” their entry and exit into banks as a short-term trade. Feature Banks in the euro area have underperformed the region’s broader market by about 50% since March 2009, when global equities reached their financial crisis lows. In the same period, the overall euro area equity index also underperformed U.S. equities by about 50% in common-currency terms. In fact, the relative performance of euro area banks to the euro area broad market has been joined at the hip with the relative performance of euro area equities vs. U.S. equities over the past decade (Chart 1, panel 1). Getting the bank view right in the euro area is therefore an important input into our country allocation decision between U.S. and euro area equities. Chart 1Is It Time To Buy Euro Area Banks?
Is It Time To Buy Euro Area Banks?
Is It Time To Buy Euro Area Banks?
With a more than 50% discount to the broad market in terms of price-to-book (P/B), banks are now looking very cheap. However, banks in the euro area have always traded at a discount to the broader market on an absolute basis. Currently the relative P/B reading of 0.45 is only slightly lower than the 3-year average of 0.47 – still higher than the lower band of the valuation range (Chart 1, panel 2). The relative dividend yield also gives similar information (Chart 1, panel 3). Historically, when the relative P/B discount hits the lower band and the relative dividend yield hits the upper band, a rebound in relative return performance could be expected. In order to support sustainable outperformance, however, banks need to have sustained profitability. In this Special Report, we delve into the fundamental factors that affect a bank’s profit outlook such as capital position, loan growth and non-performing loan situation to determine if banks in the euro area are cheap for a reason, or are about to embark on a period of sustainable outperformance. What Drives Bank Share Performance? According to research published in BCA’s Global Asset Allocation Special Report on July 27, 2017,1 it is clear that return on equity (ROE) has historically been closely correlated with the performance of bank shares, especially on a relative-to-the-broad-market basis (Chart 2, panel 1). Chart 2Euro Area Bank Performance Drivers
Euro Area Bank Performance Drivers
Euro Area Bank Performance Drivers
The recovery of ROE has so far been tepid. This is largely a result of deleveraging in the banking system and very low asset utilization, because both return on assets and net profit margins have recovered strongly (Chart 2, panels 2 and 3). Since the Global Financial Crisis (GFC), euro area banks have steadily reduced leverage to a multi-decade low, while asset utilization has been in a downtrend since the 1990s – even though this ratio seems to have been stabilizing over the past few years. Profit margins reached a historical high of 12.7% in Q4/2006, then collapsed during the GFC and reached a low of 0.34% in Q3/2009. The subsequent rebound in profit margins was short-circuited by the euro debt crisis, causing net profit margins to plummet into negative territory, reaching a historical low of -7.6% in Q3/2012. They have recovered strongly since, reaching 9.8% in Q3/2018, not far from the 2006 peak margin level. As such, banks have to increase their leverage and asset utilization in order to generate higher ROE. This also means they need to increase their asset base and take on more risk. Do banks in the euro area have the ability to do so? Capital Adequacy Vs. Deleveraging The capital adequacy ratio (CAR), the ratio of a bank’s regulatory capital to its risk-weighted assets, measures a bank’s ability to absorb shocks. As shown in Chart 3, banks in all countries have steadily increased this ratio since the GFC. Banks in Ireland, the Netherlands and Finland have the highest CAR values, but they have all come down from their respective peak levels. On the other hand, Spanish, Italian and Portuguese banks have the lowest CAR readings, though they are still improving. French banks stand out because their capital adequacy ratio has been in a steady uptrend with the least volatility. Chart 3Improving Capital Position, But...
Improving Capital Position, But...
Improving Capital Position, But...
Looking at CAR alone, however, could be misleading when trying to gauge a bank’s capital situation. In fact, the generally rising capital adequacy ratio has mainly been achieved through the reduction of risk-weighted assets in all countries except France (Chart 4). Chart 4...With Massive Leverage
...With Massive Leverage
...With Massive Leverage
French banks’ risk-weighted assets have been more or less stable since 2006, with a small decline into 2015 and a gradual increase since. Belgian banks have also experienced similar asset growth as French banks over the past few years, though that is after massive deleveraging occurred between 2007 and 2014 (Chart 4, panel 1). Both Spanish and Italian banks tried to grow assets in 2014 after several years of deleveraging, but the attempt was short-lived as both resumed asset reduction, starting in 2015 (Chart 4, panel 2). Dutch banks seem to have stabilized their asset base since 2014, while Irish banks, which cut half their asset base between 2010 and 2014, have continued to deleverage, albeit at a much slower pace (Chart 4, panel 3). The deleveraging process in Portuguese and Finish banks has been ongoing since 2010, and it seems that the painful deleveraging process may have come to a stage of stabilization (Chart 4, panel 4). In terms of regulatory capital, the numerator of the capital adequacy ratio, French banks again stand out with a steadily increasing regulatory capital base, while Dutch banks have also grown their regulatory capital base at a similar pace. The regulatory capital bases in Spanish, Italian and Belgian banks, however, have been oscillating over the past decade, while Portuguese and Irish banks’ regulatory capitals have declined significantly (Chart 5). Chart 5Regulatory Capital Growth: No Synchronization
Regulatory Capital Growth: No Synchronization
Regulatory Capital Growth: No Synchronization
Another indicator of bank resilience, the ratio of non-performing-loans (NPLs) net of provision relative to capital, measures if a bank can write off all of its bad loans and remain solvent. How do all the banks measure up in this aspect? Even though banks in all countries now have good readings (less than 100%), both Italy and Portugal were under severe stress until only a few years ago. Despite significant improvement since, banks in these two countries still have high levels of bad loans relative to capital compared to banks in other countries in the region (Chart 6). Chart 6Bad Loans Are Well Provisioned
Bad Loans Are Well Provisioned
Bad Loans Are Well Provisioned
Loan Quality Vs. Quantity The ratio of NPLs-to-gross loans provides potentially useful insights into the quality of assets. NPL ratios in France, Germany, Belgium, Austria, and Finland are all less than 5%, while those in Italy, Portugal and Ireland are higher than 10%, and Spain is in between (Chart 7). Since the peak around 2015, the NPL ratios in all countries other than Finland have come down. Compared to levels before 2006, however, bad loan ratios are still high. Chart 7NPL Ratio
NPL Ratio
NPL Ratio
In addition, despite the improvement in asset quality, banks have not aggressively grown their loan books. Only banks in France and Finland have been consistently lending to their respective private sectors – along with German banks, albeit at a lesser pace. Lending to the private sector in Spain, Portugal and Ireland has in fact contracted by 40%-50% since 2008, while loan growth from banks in Italy, Austria and the Netherlands has basically been flat since the GFC, as shown in Chart 8. Chart 8Bank Loans To Private Sector
Bank Loans To Private Sector
Bank Loans To Private Sector
Exposure To Emerging Markets Banks in the euro area are known to have a strong presence in the emerging markets. As shown in panel 1 of Chart 9, Spanish banks have more than doubled their lending to emerging markets (EM) since 2006; even after a reduction over the past two years, loans to EM still account for over 16% of total lending. This stands in stark contrast to their domestic lending, which has contracted sharply since peaking in early 2009 (Chart 8, panel 3). Portuguese banks share similar patterns to Spanish banks in terms of loan growth to EM and domestically, however, their absolute amounts have been much smaller (Chart 8, panel 3 and Chart 9, panel 2). Dutch banks shrank their loan books to EM right after the GFC but have been gradually building them back up since 2011, while Austrian banks have been steadily reducing the pace of their lending to EM (Chart 9, panels 3 and 4). Chart 9Bank Exposure To EM
Bank Exposure To EM
Bank Exposure To EM
After the turbulence earlier this year in Turkey and Argentina, BCA’s Global Investment Strategy and Foreign Exchange Strategy services identified six countries (Argentina, Turkey, Colombia, Brazil, Mexico, and Chile) as the most vulnerable to catching the “Turkish Flu,” based on the following factors: current account balance, net international investment position, external debt, external debt-service obligation, external funding requirements, private-sector savings/investment, private-sector debt, government budget balance, government debt, foreign ownership of local-currency bonds, and inflation2 (Table 1).
Chart
The vulnerability of Latin America highlights the poor performance of Spanish banks, given their heavy exposure to the region. For example, Banco Santander, the largest Spanish bank and also the largest component in the euro area bank index, has aggressively expanded into Latin America to beef up asset utilization and return on assets. However, loan quality from Latin America has been much lower, as evidenced by the much-higher percentage of bad loan provisions from the region compared to its share of loans. Currently, loans to Latin America account for about 18% of total lending, yet bad loan provisions account for about 42% of total provisions (Chart 10). Chart 10Banco Santander: More Like An EM Bank
Banco Santander: More Like An EM Bank
Banco Santander: More Like An EM Bank
Exposure To Italian Government Debt The fiscal budget saga in Italy has been a negative factor impacting euro area assets, especially Italian banks. Italian banks have been large buyers of Italian government debt securities, reaching over 400 billion euros at the peak and accounting for about a quarter of total debt securities. Following the European Central Bank’s quantitative easing program (QE) that started in March 2015, Italian banks’ share of government debt holdings subsequently dropped to about 18% by the end of 2017. In 2018, however, Italian banks purchased more government bonds to a level of 393.8 billion euros as of September 2018, or about 20% of the overall debt securities outstanding – only a tad lower than the peak level before the QE program (Chart 11). Chart 11Italian Debt By Type Of Investor
Italian Debt By Type Of Investor
Italian Debt By Type Of Investor
Now the ECB’s QE program is expected to come to an end soon. With government debt securities holdings accounting for 24% of tier 1 capital in Italian banks, (Chart 12), investors should pay close attention to the “Doom Loop,” i.e. when weakening government bonds threaten to topple the banks that own those bonds, the banks are forced to unload the bond holdings, which in turn pushes the government into additional fiscal stress. Chart 12The Doom Loop
The Doom Loop
The Doom Loop
Moreover, Italian banks are not the only banks in the euro area which are exposed to Italian government debt. According to the European Banking Authority’s 2017 Transparency Exercise, French and Spanish banks held 44 billion euros and 29 billion euros of Italian debt, respectively. For example, the largest French bank, BNP Paribas (BNP), which is the second-largest component by market cap in the euro area bank index, has gradually added more Italian government debt securities since 2015 (when the ECB started buying Italian bonds) following a large reduction in 2011 (Chart 13).
Chart 13
Investment Implications The euro area banks and diversified financial sector indices are currently mostly dominated by Spain (30%), France (25%) and Italy (15%), which all have grown at the expense of the German banks over the past two decades (Chart 14). Chart 14Euro Area Bank Index: High Concentration
Euro Area Bank Index: High Concentration
Euro Area Bank Index: High Concentration
From a fundamental perspective, only French banks have both good-quality assets with decent and steady loan growth; the largest weight – Spanish banks – has experienced negative loan growth domestically while expanding aggressively to emerging markets up until 2017. Some may argue that exposure to Italian debt and emerging markets may have already been fully priced in, given the massive underperformance of the banks. This may well be true, and there could be a short-term bounce in bank stocks, given the attractive valuation metrics. For long-term investors, however, such a bounce may not be captured easily. We suggest long-term investors stay away from euro area banks, in line with our regional equity view of favoring the U.S. over the euro area. Why? Because cheap valuations are offset by lackluster profit outlook at a time when growth is slowing and monetary policy is becoming less accommodative (Charts 15A and 15B). Relative earnings growth for both banks and diversified financials are closely tied to the euro area PMI, the leading indicator for economic growth (Charts 15A and 15B, panel 2). This growth link explains why the banks’ relative performance in the euro area has such a close correlation with the performance of euro area equities relative to their U.S. peers. Chart 15APoor Profit Outlook For Banks
Poor Profit Outlook For Banks
Poor Profit Outlook For Banks
Chart 15BPoor Profit Outlook For Diversified Financials
Poor Profit Outlook For Diversified Financials
Poor Profit Outlook For Diversified Financials
For investors with a more tactical mandate and much nimbler style, however, Chart 1 could be used as a guide to “time” an entry and exit to the industry: go overweight when the relative price-to-book reaches the lower band and relative dividend yield reaches the upper band, and vice versa. Xiaoli Tang, Associate Vice President xiaoliT@bcaresearch.com Appendix 1 Euro Area Bank Indexes Different index providers have different classifications and compositions for banks, based on their different respective index methodologies.3, 4 GAA uses the MSCI All Country Equity index as its global equity benchmark. As such, whenever possible, we use the MSCI indexes in our research work. When data is not available from MSCI, however, we also use the Datastream Thomson Reuters (Datastream) index. In this Special Report, we have combined the MSCI “Bank Index” and “Diversified Financials Index” into one Aggregate Bank Index for one reason: MSCI reclassified Deutsche Bank as a “diversified financial” from a “bank” in 2003. Appendix Table 1 and Appendix Table 2 show the comparisons between the Datastream Bank Index and the MSCI Aggregate Bank Index. Even though Datastream includes 16 countries and MSCI includes only eight countries, both indexes are quite concentrated in Spain, France, Italy and the Netherlands. These four countries account for 77.4% of the Datastream Bank Index with 34 stocks, while they account for 78.8% of the MSCI aggregate bank index with 19 stocks. What’s more, the top five stocks are the same in both indexes, but they account for half of the MSCI Aggregate Bank Index and only 42% of the Datastream Bank Index.
Image
Image
Consequently, while the two indexes are quite similar, users should be aware of the differences. For example, since March 2009, the MSCI Aggregate Bank index has underperformed the broader index by 48%, but Datastream banks have underperformed the broad index by 55%, as shown in Appendix Chart 1.
Image
Footnotes 1 Please see Global Asset Allocation Special Report, “What Drives Bank Share Performance?” dated July 27, 2017 available at gaa.bcaresearch.com. 2 Please see Global Investment Strategy Weekly Report, “Hot Dollar, Cold Turkey,” dated August 17, 2018, available at gis.bcaresearch.com. 3 Please see https://www.msci.com/eqb/methodology/meth_docs/MSCI_GIMIMethodology_Nov2018.pdf 4 Please see http://www.datastream.jp/wp/wp-content/uploads/2017/02/DatastreamGlobalEquityIndicesUGissue05.pdf
Highlights On the bright side, Malaysia’s structural backdrop is improving notably, especially in the semiconductors segment. Yet the cyclical growth outlook remains downbeat. While we are maintaining a market-weight allocation to Malaysian equities within an EM equity portfolio, we are putting this bourse on our upgrade watch list. As a play on the ameliorating structural outlook, we recommend an overweight position in Malaysian small-cap stocks relative to the EM universe – both the small-cap and overall equity benchmarks. Feature Malaysian stocks have performed quite poorly in recent years: the equity index, in U.S. dollars, is close to its 2016 lows in absolute terms, and relative to the emerging markets (EM) benchmark, it is not far from the lows of last decade (Chart I-1). Chart I-1Malaysian Stocks & Commodities Prices: Tight Relationship
Malaysian Stocks & Commodities Prices: Tight Relationship
Malaysian Stocks & Commodities Prices: Tight Relationship
Odds are that a structural bottom in this bourse’s relative performance versus the EM index may have been reached. Hence, we are putting Malaysian equities on our upgrade watch list while maintaining a market-weight allocation due to tactical considerations. On the negative side, the past credit excesses have not been recognized and provisioned for by Malaysian commercial banks. The latter account for a notable 34% of the MSCI Malaysia index, and they will be a drag on this bourse's performance. Absolute performance also still hinges on global growth, commodities prices and the overall direction of Asian/EM markets. We are still negative on these parameters. Critically, there are various signs indicating an ameliorating structural backdrop in Malaysia. The country is undergoing notable improvements in the semiconductor sector, thereby reducing its dependence on commodities and increasing its exposure to a high-value industry. To capitalize on this theme of an improving structural backdrop, we are recommending an overweight position in Malaysian small-cap stocks relative to the EM universe – both the small-cap and overall equity benchmarks. Shifting Away From Commodities And Toward Electronics Parting Ways With Commodities Malaysia and its financial markets have been very exposed to commodities prices over the past 15 years or so (Chart I-1, top panel). Nevertheless, the country seems to be shifting away from its considerable reliance on the resource sector and moving into other value-added segments: in particular, semiconductors and technology. Such a structural shift – if successful – would be an extremely positive development as it would lead to rising productivity gains and higher per capita income growth. In short, the country would be able to achieve higher rates of sustainable non-inflationary growth, feeding into a sustainable bull market in Malaysian equities. Several points are noteworthy in this regard: The real output of crude and petroleum products as well as palm oil are declining sharply relative to the economy’s real total output (Chart I-2). Chart I-2Malaysia's Commodities Output Is Falling In Importance
Malaysia's Commodities Output Is Falling In Importance
Malaysia's Commodities Output Is Falling In Importance
Exports volumes of palm oil, crude oil and natural gas have all been falling relative to Malaysia’s total overseas shipment volumes (Chart I-3). Chart I-3Commodities Export Volumes Are Declining In Relative Terms
Commodities Export Volumes Are Declining In Relative Terms
Commodities Export Volumes Are Declining In Relative Terms
Crude oil, gas, and palm oil now account for 4%, 5%, and 7% of total exports in value terms, respectively. Crucially, not only is the importance of commodities in the overall Malaysian economy diminishing in volume terms, it is also falling in nominal terms due to low resource prices. For instance, net export revenues from fuel (i.e. crude oil, petroleum and natural gas) have fallen from US$18 billion in 2013 to US$5 billion today (Chart I-4, top panel). Chart I-4Commodities' Net Export Revenues Are Also Diminishing
Commodities' Net Export Revenues Are Also Diminishing
Commodities' Net Export Revenues Are Also Diminishing
Meanwhile, net exports of palm oil (and other plant-based fats) have dropped from US$20 billion to US$10 billion (Chart I-4, bottom panel). Improvement In High-Value-Added Manufacturing There are also some positive structural signs taking place in the Malaysian economy that are signaling an improvement in productivity and competitiveness: Malaysian export volumes of machinery and transport equipment are expanding in absolute terms as well as relative to overall export volumes (Chart I-5, top and middle panels). Chart I-5Malaysia's Machinery Exports Are Rocking
Malaysia's Machinery Exports Are Rocking
Malaysia's Machinery Exports Are Rocking
Remarkably, Malaysian aggregate export volumes are quickly regaining lost global market share (Chart I-5, bottom panel). Further, the ratio of exports to imports has hit a structural bottom and is slowly picking up in volume terms (Chart I-6). Chart I-6Malaysian Overall Exports Are Regaining Lost Market Share
Malaysian Overall Exports Are Regaining Lost Market Share
Malaysian Overall Exports Are Regaining Lost Market Share
This suggests some improvements in the competitiveness of domestic industries is slowly underway. Meanwhile, Malaysian high-skill and technology intensive exports as a share of global high-tech exports seem to have made a major bottom in U.S. dollar terms and will begin to rise (Chart I-7). Chart I-7Bottom In Malaysia's High-Tech Global Share?
Bottom In Malaysia's High-Tech Global Share?
Bottom In Malaysia's High-Tech Global Share?
Advanced education enrollment is high and improving – and is only outpaced by Korea and China in emerging Asia (Chart I-8). Importantly, Malaysia has among the best demographics of mainstream developing countries. The working age population as a share of the total population will continue to be high all the way to 2040. Chart I-8Malaysians Like Going To School
Malaysians Like Going To School
Malaysians Like Going To School
Malaysian expenditures on R&D have also been on the rise, outpacing a lot of other countries in the region (Chart I-9, top panel). R&D expenditures in Malaysia could also be catching up to Singapore’s (Chart I-9, bottom panel). Chart I-9Malaysia's Expenditure On R&D Is Rising
Malaysia's Expenditure On R&D Is Rising
Malaysia's Expenditure On R&D Is Rising
In line with these positives, net FDIs into Malaysia have been rising briskly (Chart I-10). Importantly, these investments have been driven by European companies, meaning the latter are transferring valuable technological know-how to Malaysia. Chart I-10Net FDIs Are Rising
Net FDIs Are Rising
Net FDIs Are Rising
The Malaysian ringgit is cheap (Chart I-11) and has reached almost two-decade lows against many Asian currencies. This makes Malaysia increasingly more competitive. Chart I-11The Ringgit Is Cheap
The Ringgit Is Cheap
The Ringgit Is Cheap
Finally, our colleagues from the Geopolitical Strategy team believe that the recently elected Pakatan Harapan government will improve governance and transparency, which had significantly deteriorated under Najib Razak’s rule. A Marriage To Electronics Malaysia is attempting to reestablish itself as a major semiconductor hub in the region. Remarkably, after declining for 15 years, semiconductor exports are finally rising as a share of GDP (Chart I-12) and Malaysian semiconductor exports are outperforming those of its neighbors. Chart I-12Malaysian Semiconductor Exports Are Booming
Malaysian Semiconductor Exports Are Booming
Malaysian Semiconductor Exports Are Booming
The Malaysian government since 2010, has identified the semiconductor sector as a key area for development and prosperity. In turn, it has been introducing programs and setting up institutions to support the industry. The 2019 budget reinforces the government’s priority to develop the sector. Several anecdotal observations confirm that Malaysia is moving up the value chain in the semiconductor industry, and is going beyond simple testing and assembly: Growing the semiconductor cluster: The Malaysian Institute of Microelectronic Systems (MIMOS) has established a shared services platform for advanced analytical services in the semiconductor industry to provide support to Malaysian semiconductor companies. The Economic Industrial Design Centre (EIDC) is also providing support to SMEs in order to enhance their efficiency. Similarly, the Semiconductor Fabrication Association of Malaysia (SFAM) has been partnering with local universities to enhance their engineering programs and offer training, internships and research opportunities for students. Developing home-grown semiconductors: In 2015, Malaysian public institutions in partnership with private companies developed the Green Motion Controller (GMS), an integrated circuit that reduces energy consumption. This semiconductor is an energy efficient controller that carries applications in hybrid cars and air conditioners, among other things. Nanotechnology: NanoMalaysia – a nanotechnology commercialization agency – is providing services to SMEs and start-ups to help increase their competitiveness by enabling them to upgrade to more efficient production methods. Light-emitting Diode (LED) manufacturing: Malaysia is becoming a hub for the manufacturing of energy efficient LED chips. This is the result of OSRAM’s – a German light manufacturer – large investment in a high-tech production facility. There are early signs already that the above developments are beginning to bear results. Chart I-13 shows that the difference between exports and imports of semiconductors (in U.S. dollars) have been surging. This shows Malaysia is able to add greater value to the semiconductors it imports and then re-exports. Chart I-13Malaysia Adds Value To The Semis It Imports
Malaysia Adds Value To The Semis It Imports
Malaysia Adds Value To The Semis It Imports
Bottom Line: Commodities are declining in importance to the Malaysian economy. Meanwhile, Malaysia’s structural backdrop is improving as the semiconductor and hardware technology segments are rising in prominence. Cyclical Weakness Despite the positive structural backdrop, Malaysia’s cyclical outlook remains challenging. Our view on commodities and global trade continues to be negative. Not only are commodities prices deflating but semiconductor prices are also falling, and their global shipments are weakening (Chart I-14). Chart I-14Cyclical Weakness In Global Semiconductor Cycle
Cyclical Weakness In Global Semiconductor Cycle
Cyclical Weakness In Global Semiconductor Cycle
The epicenter of the global trade slowdown, however, will be in Chinese construction activity. Consequently, industrial resources prices are more vulnerable than electronics in this global growth downturn. The above deflationary forces would negatively shock Asia’s growth outlook, and consequently Malaysian growth as well: The top panel of Chart I-15 shows that Malaysian narrow money growth has already rolled over decisively and is foreshadowing weaker bank loan growth. Chart I-15Malaysian Domestic Growth Set To Weaken
Malaysian Domestic Growth Set To Weaken
Malaysian Domestic Growth Set To Weaken
Slower bank loan growth will weaken purchasing power and impact domestic consumption. The middle panel of Chart I-15 shows that car sales – having surged this summer because of the abolishment of the GST – are weakening anew. Malaysian companies and banks have among the largest foreign currency debt loads (Table I-1). We expect more currency depreciation in Malaysia, as we do in EM overall. This will make foreign currency debt more expensive to service, and consequently dampen companies’ and banks’ appetites for expansion. Table I-1Malaysia's External Debt Breakdown
Malaysia: Structural Improvements Despite Cyclical Weaknesses
Malaysia: Structural Improvements Despite Cyclical Weaknesses
Finally, the real estate sector remains depressed. Property volume sales are contracting and have dropped to 2008 levels, and housing construction approvals are slumping (Chart I-16). Chart I-16Malaysia's Property Sector Is Depressed
Malaysia's Property Sector Is Depressed
Malaysia's Property Sector Is Depressed
While this means that cleansing has been taking place in the property sector, the banking sector has not recognized NPLs and remains the weakest link in the Malaysian economy. Specifically, the top panel of Chart I-17 illustrates that the NPLs in the banking system still stand at a mere 1.5%. This is in spite of the fact that since 2009, non-financial private sector credit to GDP has risen significantly. Therefore, the true level of NPLs is probably considerably higher. Chart I-17Malaysian Banks Are Under-Provisioned
Malaysian Banks Are Under-Provisioned
Malaysian Banks Are Under-Provisioned
Further, Malaysian banks have been lowering provisions to boost profits (Chart I-17, bottom panel). This is unsustainable. As growth weakens, Malaysian banks will see their NPLs rise and will need to raise provisions. Chart I-18 demonstrates that if provisions rise by 20%, bank operating earnings will contract and bank share prices would fall. Chart I-18Malaysian Banks' Share Prices Will Fall
Malaysian Banks' Share Prices Will Fall
Malaysian Banks' Share Prices Will Fall
Bottom Line: Malaysia’s cyclical growth outlook is still feeble, with the banking system being the weakest link. Banks’ large weight in the equity index makes this bourse still vulnerable in the coming months. Optimal Macro Policy Mix Fiscal Consolidation… Fiscal policy is set to be tighter as per the Malaysian government budget announced on November 2 and its preference to pursue fiscal consolidation to reduce the deficit. The budget projects only a slight increase in expenditures in 2019, which means it will likely slowdown from 8% currently (Chart I-19). Chart I-19Government Expenditure Growth Will Soften
Government Expenditure Growth Will Soften
Government Expenditure Growth Will Soften
The government will also recognize public-sector liabilities not presently shown on its balance sheet and strengthen both transparency and administrative efficiency. Critically, the budget also includes strategies to support the entrepreneurial part of the economy. Overall, this budget bodes very well for the structural outlook. Yet it will not support growth cyclically. …To Be Offset By Easy Monetary Policy Despite continued currency weakness, the Malaysian monetary authorities will not be in a hurry to raise interest rates to defend the ringgit. This is in contrast with other central banks in the region like Indonesia and the Philippines. This is presently an optimal policy mix for Malaysia and is positive for the stock market’s relative performance versus its counterparts in many other EMs. Malaysia’s structural inflation is low: core inflation hovers around zero. Therefore, the central bank will neither raise interest rates nor sell its foreign exchange reserves to defend the currency. Both currency depreciation and low interest rates are needed to mitigate the downturn in exports as well as offset fiscal consolidation. In the meantime, the ringgit is unlikely to depreciate in a sudden and vicious manner but rather will likely fall gradually. First, the current account will remain in surplus, even as global trade contracts. The basis is that if Malaysian exports fall, imports will simultaneously follow. The country imports a lot of intermediate goods to then process and re-export. Second, Malaysia is unlikely to witness pronounced capital flight as occurred in 2015. The new government has increased confidence in the economy among both locals and foreigners. In addition, net portfolio investments have been negative for a while. This means that a large amount of foreign capital has exited already, reducing the risk of further outflows. What’s more, foreign ownership of local currency bonds has fallen from 33% in June 2016 to 24% today. Moreover, at 28% of market cap, foreign ownership of equities is among the lowest in EM. These also limit potential foreign selling. Bottom Line: Policymakers are adopting a wise policy mix for the economy at the current juncture: tight fiscal and easy monetary policies. This is structurally positive, even if it does not preclude cyclical weakness. Investment Conclusions Weighing structural positives versus the cyclical growth weakness and the unhealthy banking system, we are maintaining a market-weight allocation to Malaysian stocks within the EM universe, but are placing this bourse on our upgrade watch list. We need to see a selloff in bank stocks before we upgrade it to overweight. Within Malaysian equities, we recommend shorting/underweighting banks and going long/overweighting small cap stocks. To capitalize on Malaysia’s improving structural growth outlook, we recommend buying Malaysian small caps, but hedging positions by shorting the EM aggregate or small-cap indexes. The ringgit is poised to depreciate further versus the U.S. dollar along with other EM/Asian currencies. We continue to short the ringgit versus the greenback. With respect to sovereign credit and local government bonds, dedicated portfolios should currently have a market-weight allocation. The negative cyclical growth outlook is offset by the right macro policy mix and improving growth potential. Ayman Kawtharani, Associate Editor ayman@bcaresearch.com Equity Recommendations Fixed-Income, Credit And Currency Recommendations
Underweight The S&P utilities index has been on a roll recently as this fixed income proxy has reacted to the recent fall in Treasury yields (change in yields shown inverted, top panel) and jump in natural gas prices. Further, utilities are typically seen as a domestic defensive play and the recent trade troubles and stock market carnage have made utilities soar in a flight to safety. We think the tailwinds lifting utilities are transitory and likely to shift to headwinds. First, one of our key themes for the year ahead is rising interest rates; a move higher in yields will have a predictably negative impact on these high-dividend paying equities. Second, a flight to safety looks fleeting; the ISM manufacturing new orders index usually moves inversely in lock step with utilities and the most recent message is negative for the S&P utilities index (ISM manufacturing new orders index shown inverted, second panel). Meanwhile, S&P utilities earnings estimates have continued to trail the broad market, having taken a significant step down this year (third panel). As a result, sector valuations have spiked (bottom panel), leaving the S&P utilities index prone to a shock. Net, we reiterate our underweight recommendation.
Utilities Are Still A Sell
Utilities Are Still A Sell
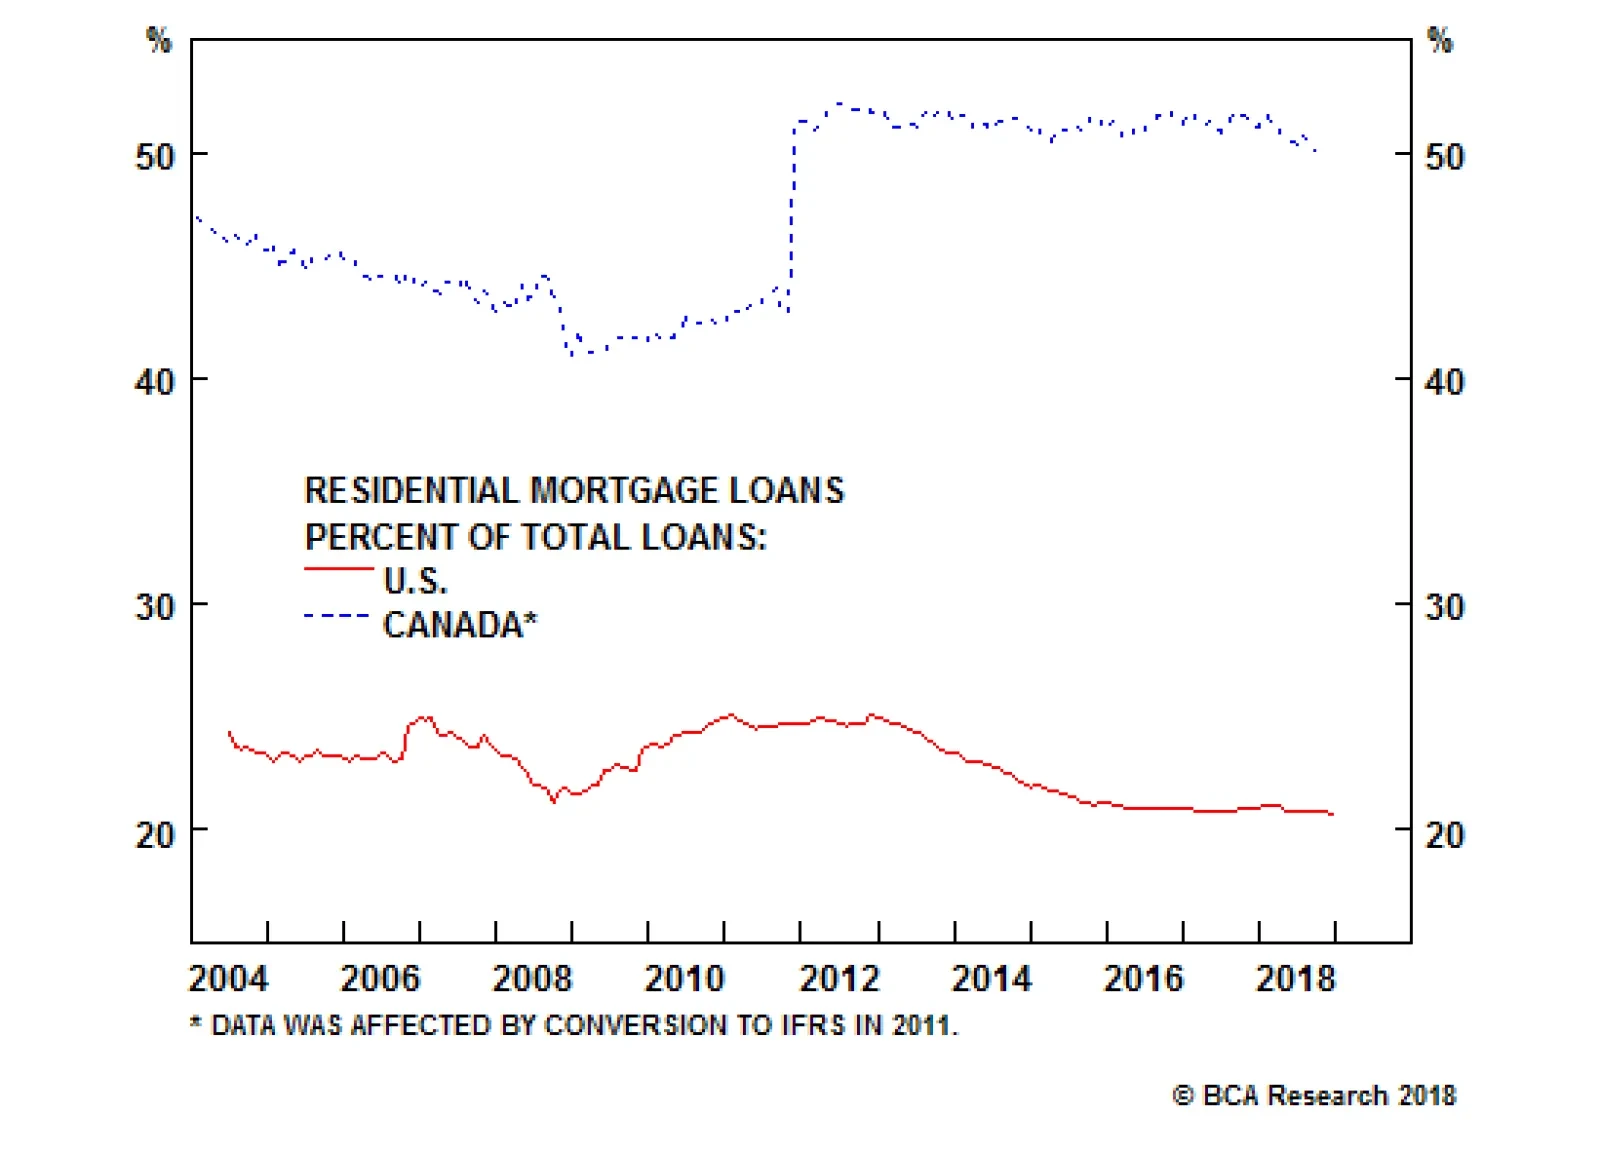
The health of a country’s financial sector is a critical part of its ability to grow. The clear differences between the Spanish and Italian economy since the euro area crisis illustrates that point. Spain handled its banking problems quicker than Italy did,…
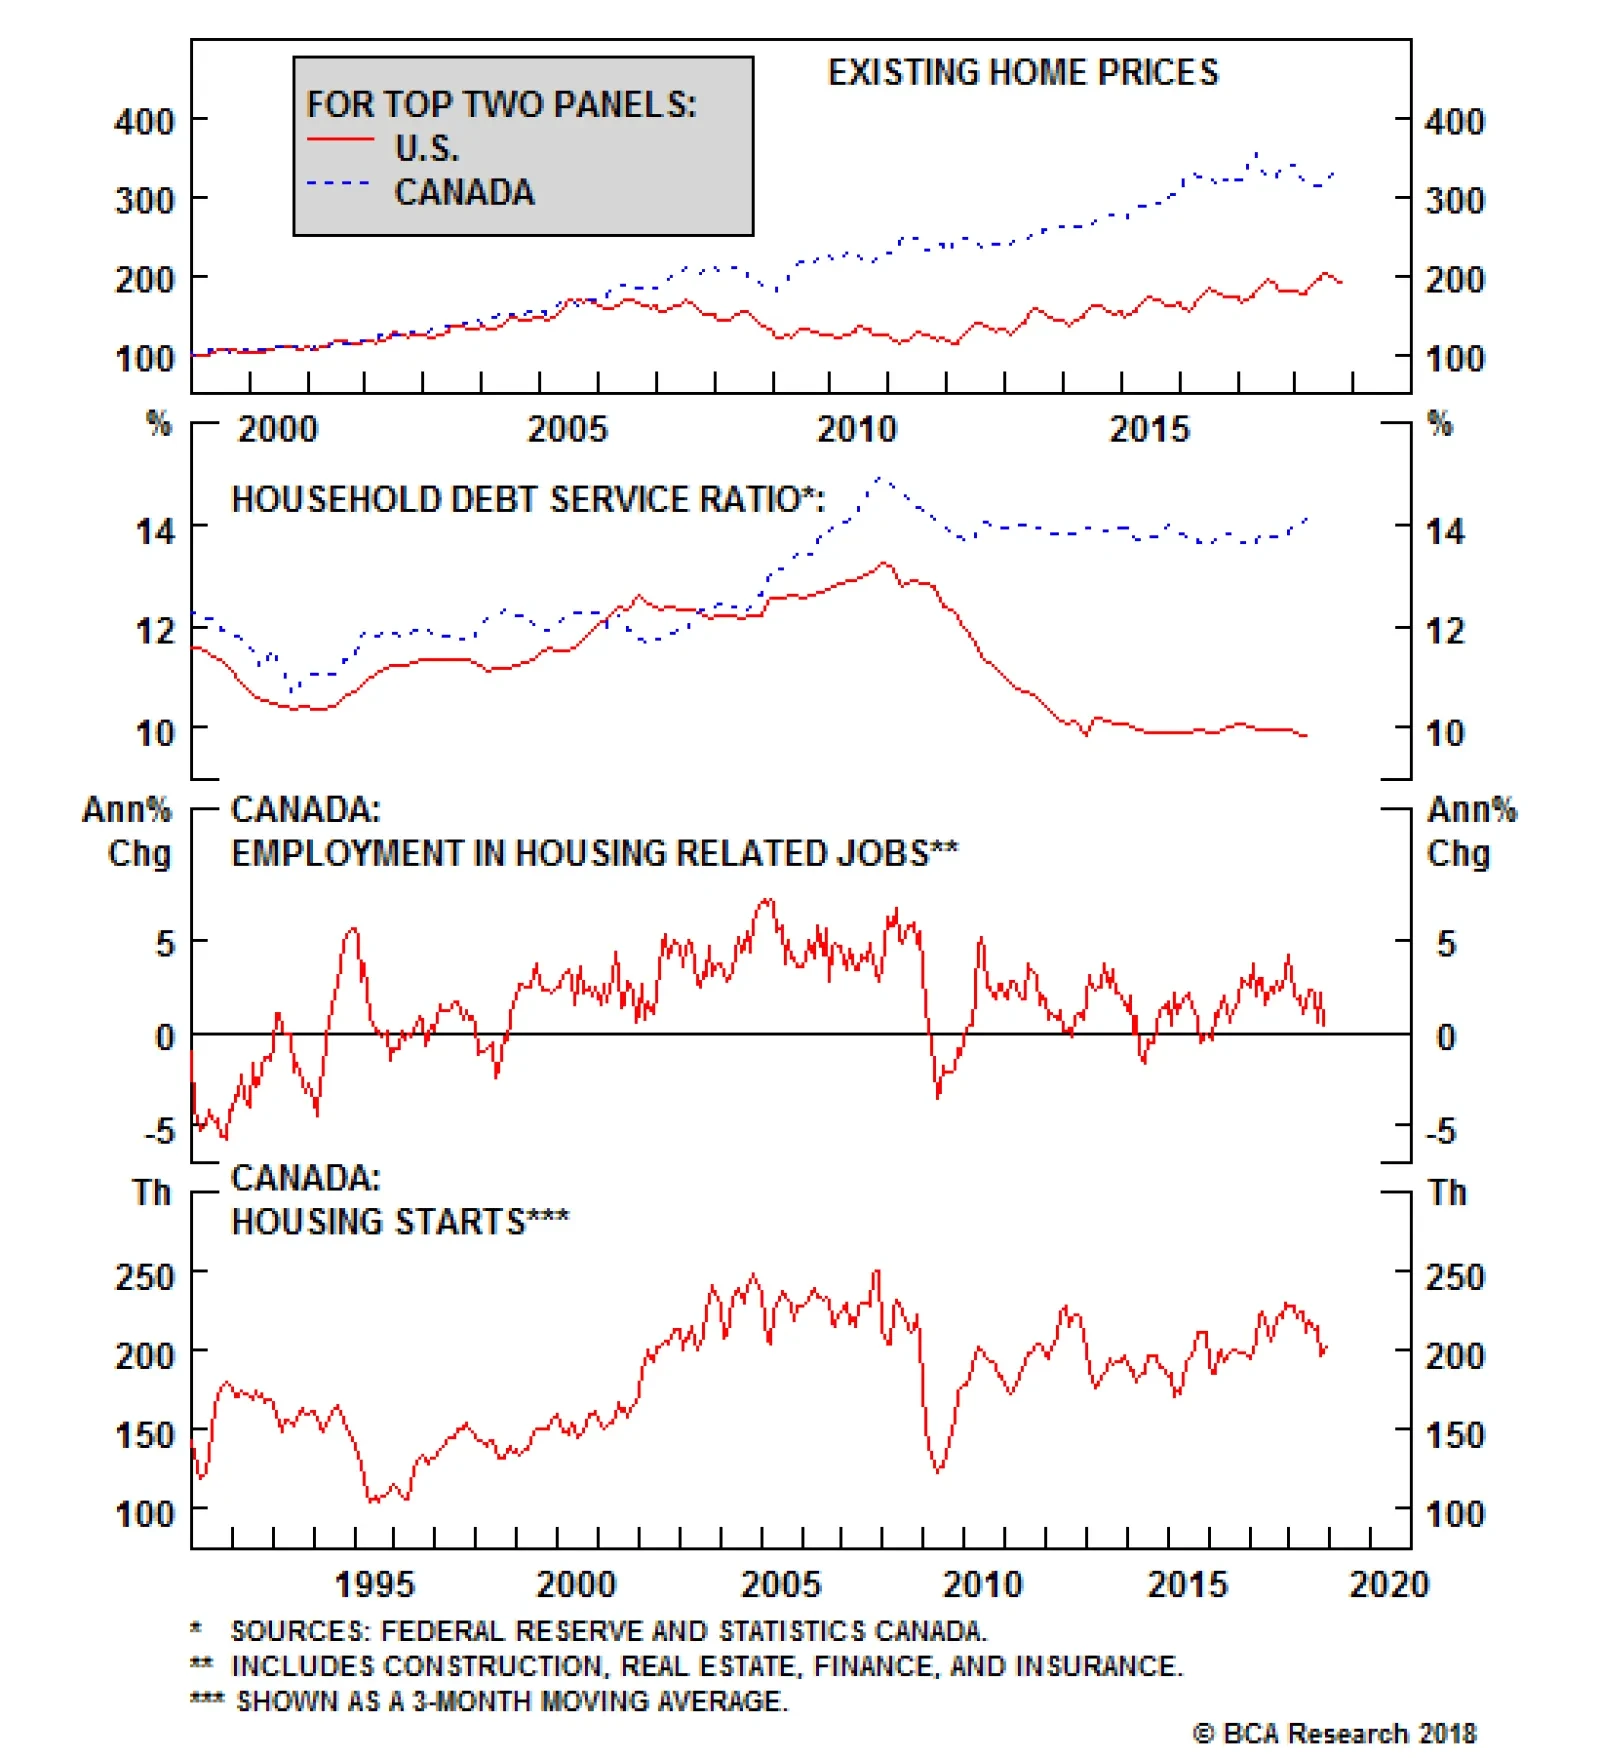
According to excellent research from Ed Leamer on the role of housing in post-war U.S. business cycles, nine of 11 recessions were preceded by substantial problems in housing, and in seven of 11 recessions residential investment was the greatest contributor…
Rebuilding From The Basement
Rebuilding From The Basement
Overweight After reaching their post-GFC highs in the middle of 2017, the S&P homebuilders index put in a seven-year bottom in October, though has since recovered to roughly the level where we upgraded to overweight.1 The fall came as homebuilder sentiment gave up some of its optimism (second panel), driven largely by higher mortgage rates and the resulting lower affordability (third panel). However, we believe the market priced in faltering homebuilder optimism well before the industry itself. Anecdotally, Toll Brothers (TOL, notably not a member of the S&P homebuilders index but a major homebuilder nonetheless) recently delivered quarterly results where new orders fell for the first time in four years, including a precipitous 39% decline in California, their biggest market, and offered guidance below analyst expectations. This glum news was met by a market that took the stock higher that day. Our inference is that negativity is fully priced in to this index and with the overall housing market index squarely above the 50 boom/bust line (second panel) and earnings growth expectations coming back to reality (bottom panel), the S&P homebuilders index is set to continue its recovery. We reiterate our overweight recommendation. The ticker symbols for the stocks in this index are: BLBG: S5HOME - DHI, LEN, PHM. 1 Please see BCA U.S. Equity Strategy Weekly Report, “Indurated” dated September 24, 2018, available at uses.bcaresearch.com.
Highlights So What? The tech war will continue to disrupt the trade truce. Why? The U.S. and China have legitimate national security concerns about each other’s tech policies. The 90-day trade talks cannot succeed without some compromises on tech issues. Chinese structural reforms could also reduce U.S. concerns over tech transfer. Feature The fanfare over President Donald Trump’s tariff ceasefire, agreed at the G20 summit on December 1, has already proved short-lived. We know now that on the same day President Trump sat down with Chinese President Xi Jinping to negotiate the truce, Canadian authorities arrested Meng Wanzhou, the chief financial officer of Huawei, under a U.S. warrant. Huawei is the world’s biggest telecoms equipment maker, second-biggest smartphone maker, and one of China’s high-tech champions. So far the controversial arrest – which prompted Beijing to make representations to the U.S. ambassador – has not derailed the trade truce. China’s Commerce Ministry has announced that tariffs will be eased and imports of American goods will increase. The CNY-USD has climbed upwards despite a rocky global backdrop in financial markets (Chart 1). Chart 1Currency Part Of The Trade Truce?
Currency Part Of The Trade Truce?
Currency Part Of The Trade Truce?
Nevertheless, Meng’s arrest calls attention to our chief reason for skepticism about the ability of the U.S. and China to conclude a substantive trade deal. In essence, “trade war” is a misnomer for a broader strategic conflict that is centered on the military-industrial balance rather than the trade balance. Trade War? Tech War! The historian Paul Kennedy, in his bestselling The Rise and Fall of the Great Powers, argued that the history of competition between nations is determined by economic and technologically advanced industrial production.1 Eighteenth-century Britain defeated France; Ulysses S. Grant defeated Robert E. Lee; and the U.S., the allies, and Russia defeated Nazi Germany and Imperial Japan. This thesis helps to explain why China’s recent technological acceleration has provoked a more aggressive reaction from the U.S. than its general economic rise over the past four decades. For example, while China is rapidly catching up to the U.S. in research and development spending, it is only spending about half as much as the U.S. relative to its overall economy (Chart 2). If it comes to match the U.S.’s ratio then it will overwhelm it in real R&D investment, at least in dollar value. And R&D is just one of many factors showing that China is eroding the U.S.’s global dominance. Chart 2The U.S. Has Some Competition
The U.S. Has Some Competition
The U.S. Has Some Competition
In September, an inter-agency U.S. government task force initiated by President Trump’s Executive Order 13806 sought to assess the strength of the U.S. defense industrial base and resilience of its supply chains.2 The conclusion was that the U.S.’s military-industrial base is suffering from a series of macro headwinds that need to be addressed urgently. The report cited key domestic issues, such as the erosion of the U.S. manufacturing sector (Chart 3). It argued that the country is rapidly losing the ability to source its defense needs from home, develop human capital for future needs, and surge capabilities in a national emergency. Chart 3Decline Of The U.S. Manufacturing Base
Decline Of The U.S. Manufacturing Base
Decline Of The U.S. Manufacturing Base
However, foreign competition, specifically “Chinese economic aggression,” also holds a central place in the report. The obvious risk is U.S. overreliance on singular Chinese sources for critical inputs, as highlighted during the 2010 rare earth embargo, when Beijing halted exports of these metals to Japan during a flare-up of their maritime-territorial dispute in the East China Sea (Chart 4). Chart 4China’s Rare Earth Supply Chain Leverage
U.S.-China: The Tech War And Reform Agenda
U.S.-China: The Tech War And Reform Agenda
The authors’ point is not simply that China’s near-monopoly of rare earths remains a threat to the U.S. supply chain, but that Beijing’s willingness to leverage its advantageous position in the supply chain to coerce its neighbors could be used in other areas. After all, Washington’s reliance on China is rapidly extending to industrial goods that are critical for U.S. defense supply chains, such as munitions for missiles. But Washington’s greatest fear is China’s move into higher-end manufacturing and information technology – and hence the flare-up in tensions over ZTE and Huawei this year. Bottom Line: Technological sophistication and economic output determine which nations rise and which fall over the course of history. While the U.S. can accept China’s eventually surpassing it in economic output, it cannot accept China’s technological superiority. This would translate into military and strategic supremacy over time. Semiconductors: The Next Battlefront While the U.S. lacks a national industrial policy, Beijing has made a concerted effort to promote indigenous production and innovation. The obvious example is Beijing’s state-backed ascent to the top of the global solar panel market. More broadly, China’s export growth has been fastest in the categories of goods where the U.S. has the greatest competitive advantage (Chart 5). Again, the U.S. concern is not market share in itself, but China’s ability to compete as an economically advanced “great power.” Chart 5China’s Comparative Advantage Threatens U.S. Global Market Share
U.S.-China: The Tech War And Reform Agenda
U.S.-China: The Tech War And Reform Agenda
Semiconductors are rapidly becoming the next major battleground, as China is trying to build its domestic industry and the U.S. is considering a new slate of export controls that could constrict the flow of computer chips to China.3 Semiconductors are critical as the building blocks of the next generation of technologies. The semiconductor content of the world’s electronic systems is ever rising. Breakthroughs such as artificial intelligence and the Internet of Things (IoT) promise to create a huge boost in demand for chips in the coming decades. China’s predicament is that the U.S. and its allies control 95% of the global semiconductor market (Chart 6), and yet China is the world’s largest importer, making up about a third of all imports, and its largest consumer (Chart 7). This is a dangerous vulnerability that China has been working to mitigate. Back in 2014 Beijing launched a $100-$150 billion semiconductor development program and has more or less stuck with it. The Made in China 2025 program projects that China will produce 70% of its demand for integrated circuits by 2030 (Chart 8). Chart 6China’s Chip Makers Are Still Small Fry
U.S.-China: The Tech War And Reform Agenda
U.S.-China: The Tech War And Reform Agenda
Chart 7China Accounts For 60% Of Global Semiconductor Demand
U.S.-China: The Tech War And Reform Agenda
U.S.-China: The Tech War And Reform Agenda
While China-domiciled chip companies have a long way to go, they are rising rapidly, and China has already become a big player in global semiconductor equipment manufacturing (18% market share to the U.S.’s 11%). Chart 8Made In China 2025 Targets
U.S.-China: The Tech War And Reform Agenda
U.S.-China: The Tech War And Reform Agenda
The problem for the U.S. is that semiconductors are one area where China runs a large trade deficit. Indeed, the U.S.’s share of China’s market is somewhat larger than the U.S. share of the global market, suggesting that the U.S. has not yet gotten shut out of the market (Chart 9). Chart 9U.S. Chips Still Have An Edge In China
U.S.-China: The Tech War And Reform Agenda
U.S.-China: The Tech War And Reform Agenda
Moreover, 60% of U.S. semi imports from China and 70% of exports are with “related parties,” i.e. U.S. corporate subsidiaries operating in China. The U.S.’s highly competitive semiconductor industry is the most exposed to the imposition of tariffs (Chart 10). This may explain why so many exemptions were granted to the U.S. Trade Representative’s third tariff schedule: out of $37 billion in semi-related Chinese imports to face tariffs, $22.9 billion were given waivers.4 Chart 10Tariffs Are Harmful To U.S. Chip Makers
U.S.-China: The Tech War And Reform Agenda
U.S.-China: The Tech War And Reform Agenda
The Barack Obama administration, initially faced with China’s disruptive entrance into this sector, determined that the U.S.’s best response would be to “win the race by running faster.” A council on science and technology warned that the U.S. would have to make extensive investments in STEM education, job retraining, manufacturing upgrades, research and development, international collaboration, and export promotion in order to stay ahead.5 However, these initiatives proved to be either too rhetorical (due to policy priorities and gridlock in Washington) or too slow-in-coming to make a difference in light of China’s rapid state-directed investments under the Xi Jinping administration. The Trump administration has obviously taken a more punitive approach. Trump originally focused on China’s alleged currency manipulation and criticized its large trade surpluses with the United States, but his focus has evolved since taking office. Under the influence of U.S. Trade Representative Robert Lighthizer – who is now heading up the 90-day talks – Trump’s complaints have given way to a Section 301 investigation into forced technology transfers, intellectual property theft, and indigenous innovation. This investigation eventually provided the justification for imposing tariffs on $250 billion worth of Chinese imports. Over this time period, it has become clear that there is considerable consensus across the U.S. government, on both sides of the aisle, to take a more aggressive approach with China that includes tariffs, sanctions, foreign investment reviews, and potentially new export controls. Significantly, the high-tech conflict has escalated separately from the trade war: it operates on a different timeline and according to a different set of interests. For example: The ZTE affair: The Commerce Department’s denial order against telecoms equipment maker ZTE came on April 15, even as the U.S. and China were trying (ultimately failing) to negotiate a trade deal to head off the Section 301 tariffs. CFIUS reforms: The U.S. Congress proceeded throughout the summer on its efforts to modernize the Committee on Foreign Investment in the United States, culminating in the Foreign Investment Risk Review Modernization Act (FIRRMA). The Treasury Department released its implementing rules for the law in October, which will take effect even as trade negotiations get underway. The secretive body’s major actions have always been to block deals with China or related to China (Table 1). Table 1U.S. Foreign Investment Reviews Usually Hit China
U.S.-China: The Tech War And Reform Agenda
U.S.-China: The Tech War And Reform Agenda
Chipmaker sanctions: The U.S. Department of Justice indicted Chinese chipmaker Fujian Jinhua Integrated Circuit despite the November diplomatic “thaw” between the two countries in preparation for the G20 summit.6 This action occurred even as top American and Chinese diplomats and generals engaged in talks intended to simmer down strategic tensions in the South China Sea and elsewhere. New export controls: Despite the 90-day trade talks scheduled through March 1, the U.S. government is currently holding public hearings on whether to expand U.S. export controls to cover a range of emerging technologies. These hearings, to conclude on December 19, are being held pursuant to the Export Control Reform Act signed into law in August along with the CFIUS reform. Most recently, the arrest of Meng Wanzhou, the CFO of Huawei, falls into this trend – casting doubt on the viability of the tariff ceasefire and forthcoming trade talks. The incident highlights how the pace, scale, and momentum of the tech conflict are substantial and will be difficult to reverse. Furthermore, the U.S. is building alliances with like-minded Western countries in order to encourage a unified embargo of Huawei, ZTE, and potentially other Chinese tech companies. In particular the U.S. and its allies are trying to block Chinese companies out of their upcoming 5G networks. The U.S. banned Huawei back in 2012, but it fears that allied countries – particularly those that host U.S. military bases – will have their commercial networks compromised by Huawei.7 5G will enable superfast connections that form the basis of the Internet of Things. If Huawei is embedded in 5G networks, it could theoretically gain unprecedented penetration into Western society and industry. Since China’s Communist Party has prioritized the “fusion” of civilian capabilities with military,8 and since the country’s security forces and cyber regulators are authorized to have access to Chinese companies’ critical infrastructures and data at will, American government departments have been soliciting allied embassies not to adopt Huawei as a supplier despite its competitive pricing and customizability. Australia, New Zealand, and Japan have effectively banned Huawei from 5G for their own reasons; the U.K. and others are considering doing the same. The expansion of this coalition creates a difficult backdrop for negotiating a final trade deal by March 1. And yet the G20 ceasefire clearly improved the odds of such a deal. So what will break first, the tech war or the trade ceasefire? Bottom Line: The tech war is intensifying even as the trade war takes a pause. The large-scale U.S. mobilization of a coalition of states opposed to China’s growing presence is a bad sign for the 90-day talks, though so far they are intact. What A Deal Might Look Like To get a sense of whether the tech war will upend the trade talks, or vice versa, we need to consider what a final trade deal that includes the U.S.’s technological demands would look like. It is significant that on November 20, the eve of the G20 summit, U.S. Trade Representative Lighthizer released a report updating the findings of his Section 301 investigation.9 Lighthizer’s position matters because he is leading the 90-day talks and a critical swing player within the administration.3 Lighthizer’s report is essentially the guideline for the U.S. position in the 90-day talks. It makes the following key claims: China has not altered its abusive and discriminatory trade practices since the Section 301 investigation was concluded. These practices include grave accusations of cyber-theft and industrial espionage. The report also argues that China’s state-driven campaign to acquire tech through mergers and acquisitions is ongoing, despite the drop in Chinese mergers and acquisitions in the United States over 2017-18 (Chart 11). The reason, the USTR alleges, is that China tightened controls on investment in real estate and other non-strategic sectors (essentially capital flight from China), whereas Chinese investment to acquire sensitive technology in Silicon Valley is still intense and is being carried out increasingly through venture capital deals (Chart 12). Chart 11M&A No Longer China’s Best Way To Get Tech...
U.S.-China: The Tech War And Reform Agenda
U.S.-China: The Tech War And Reform Agenda
Chart 12...Now Venture Capital Deals Offer A Better Way
U.S.-China: The Tech War And Reform Agenda
U.S.-China: The Tech War And Reform Agenda
China’s concessions so far are “incremental” and in some cases deceptive. For instance, China’s propaganda outlets have de-emphasized the “Made in China 2025” program even though the government is continuing apace with this program, as well as other state-subsidized industrial programs that utilize stolen tech, such as the “Strategic Emerging Industries” (SEI) policy. Not only has China maintained certain targets for domestic market share in key technologies, but modifications to the program have in some cases increased these targets, such as in the production of “new energy vehicles” (Chart 13). Other concessions, such as on foreign investment equity caps, are similarly unsatisfactory thus far, according to the USTR. For instance, China’s pledge gradually to allow foreigners to operate wholly owned foreign ventures in the auto sector is said to arrive too late to benefit foreign car manufacturers, who have already spent decades building relationships under required joint ventures. Chart 13The Opposite Of U.S.-China Compromise
U.S.-China: The Tech War And Reform Agenda
U.S.-China: The Tech War And Reform Agenda
Trade partners share the U.S.’s concerns and are taking actions to address the same problems. In addition to the aforementioned actions on the 5G, the EU is developing foreign investment review procedures for the first time. Foreign industry groups share the U.S. business lobby’s fear of China’s forced tech transfers. Ultimately, Lighthizer’s report shows both that a trade deal is possible and that it will be extremely difficult to achieve: Possible, because while the report touches on deep structural factors underlying China’s practices, it emphasizes technical issues. Since these issues can often be adjusted by degree, there is ostensibly room to bargain. Difficult, because the main takeaway of the report is that the U.S. is giving China an ultimatum to stop cyber theft and industrial espionage. At minimum, the U.S. will demand assurances that China’s military, intelligence, and cyber agencies will rein in their hacking, spying, and tech acquisition campaigns. Other disputes are more susceptible to tradeoffs, but it will be hard for the U.S. to compromise on a list of grievances that so plainly enumerates national security violations. Can China really compromise on aspects of its Made in China 2025 industrial plan? Possibly. What China cannot compromise on is technological advancement in general, since its future economic sustainability and prosperity depend on it. So China may not accept getting shut out of investment opportunities in Silicon Valley. But if the 2025 plan provokes foreign sanctions, then it interferes with China’s technological advance, and hence can be compromised in order to achieve China’s true end. It makes sense for China and the U.S. to focus on the above tech issues – that is, for the “structural” part of the trade talks – as opposed to any macroeconomic structural demands that are more difficult to pull off at a time when China’s credit cycle is exceedingly weak and the economy is slowing. For instance, on China’s currency, while the U.S. will have to have some kind of agreement, and China has already shown it will allow some appreciation to appease the U.S., China is highly unlikely to agree to a dramatic, Plaza Accord-style currency appreciation. Therefore the negotiators will have to accept a nominal agreement on currency practices, perhaps as an addendum as was done with the U.S.-Korea trade renegotiation. As for other strategic tensions, China is continuing to support the Trump administration’s diplomatic efforts with North Korea. Therefore the U.S. is unlikely to get much traction on its demand that China remove missiles from the South China Sea. But unlike cyber theft and corporate hacking, the South China Sea could conceivably be set aside for the purposes of a short-term trade deal and left for later rounds of negotiations, much as Trump’s border wall with Mexico was set aside during the NAFTA renegotiation. Bottom Line: The U.S. is demanding that China (1) rein in its hacking and spying (2) shift its direct investment to less tech-sensitive sectors (3) adjust its Made in China targets to allow for more foreign competition (4) lower foreign investment equity restrictions. Our sense, from looking at these demands, is that a trade deal is possible. But given the underlying strategic rivalry, and the intensity of the tech conflict, we think it is more likely that the tech war will ultimately derail the trade talks than vice versa. China’s Reform And Opening Up Turns 40 Finally, a word about China’s reforms, which are no longer discussed much by investors, given that many of the ambitious pro-market reforms outlined at the 2013 Third Plenum flopped. This month marks the 40th anniversary of China’s “Reform and Opening Up” policies under Deng Xiaoping. The original Third Plenum, the third meeting of the 11th Central Committee at which Deng launched his sweeping policy changes, occurred on December 18-22, 1978. In the coming days, General Secretary Xi Jinping will commemorate the anniversary with a speech. Various party media outlets have been celebrating reform and opening up over the past few months. We have no interest in adding to the hype. But we do wish to highlight the interesting overlap in the deadline for the trade talks, March 1, with the annual meeting of China’s legislature, when new policy initiatives are rolled out. To conclude a substantive trade deal, China needs to make at least a few structural concessions. And to satisfy the Trump administration, these concessions will have to be implemented, not merely promised, since the administration has argued consistently that past dialogues have gone on forever without tangible results. The surest way to achieve such a compromise would be to strike a trade deal and then begin implementation at the appropriate time in China’s own political calendar, which would be the March NPC session – right after the 90-day negotiation period ends. What kind of structural changes might China make? Of the four points outlined above, the one that is likely to get the most traction is lifting foreign venture equity caps (Table 2). This would be substantive because it would remove an outstanding structural barrier to foreign market access – China’s prohibitive FDI environment – while depriving China of a means of pressuring firms into conducting technology transfers. It would also have the added benefit of attracting investment that could push up the renminbi. Table 2China’s Foreign Investment Equity Caps
U.S.-China: The Tech War And Reform Agenda
U.S.-China: The Tech War And Reform Agenda
In this context, we will watch very carefully both for progress in the 90-day talks and for any new and concrete proposals within President Xi’s upcoming economic statements. This includes the annual Central Economic Work Conference as well as the 40th anniversary of the historic Third Plenum. Bottom Line: The basis for a substantial U.S.-China trade deal would be Chinese structural changes to grant the U.S. (and others) greater market access for investment and a safer operating environment for foreign intellectual property. While we remain pessimistic, the reform agenda is important to watch. Investment Conclusions We continue to believe that a final trade deal between the U.S. and China is not likely forthcoming – at least not in the 90-day timeframe. The difficulty of working out a deal with the tech issues above should support this baseline view. Nevertheless, given that there is a possible path forward, and given that Chinese tech stocks are heavily oversold, is now a good time for investors to buy? Our view is no, on a cyclical 6-12 month horizon. Relative to the MSCI China investable index, tech stocks are not so badly beaten down as they first appear (Chart 14). The incredible earnings performance of this sector over the past five years has rolled over lately, as reflected in trailing earnings-per-share. This is true relative to U.S. tech stocks and the global equity market as well (Chart 15). Chart 14China's Tech Selloff In Line With Market
China's Tech Selloff In Line With Market
China's Tech Selloff In Line With Market
Chart 15Tech Earnings Rolled Over Pre-Tariffs
Tech Earnings Rolled Over Pre-Tariffs
Tech Earnings Rolled Over Pre-Tariffs
Since this is a decline in trailing earnings, it does not stem from the trade war, but rather from internal factors like consumer sentiment and retail sales (given the large weights of consumer-related firms like Alibaba and Tencent in this sector). Relative to global tech stocks, Chinese tech has definitely become less expensive after the recent selloff. But they are still not cheap (Chart 16). Given the headwinds outlined above – the fact that the tech war is more likely to derail the trade talks than the trade talks are likely to resolve the tech war – we think it is too early to bottom-feed. Chart 16Tech Stocks Not All That Cheap
Tech Stocks Not All That Cheap
Tech Stocks Not All That Cheap
In short, U.S.-China tensions are rising when looked at from the perspective of, first, China’s aggressive state-backed industrial programs and technological acquisition and, second, the U.S.’s emerging technological protectionism and alliance formation. Two long-term implications can be drawn: First, many of the United States’ complaints stem not only from China taking advantage of its economic openness, but also from the U.S.’s low-regulation environment and opposition to state-driven industrial policy. The U.S. will not have much luck demanding that China stop pouring billions of dollars of government funds into its nascent industries; it will deprive its own emerging sectors of funds if it prevents Chinese investment into Silicon Valley. In other words, the U.S. will have to become less open and more heavily regulated. The CFIUS reforms and the proposed export controls highlight this trend. In addition, any escalation of tensions will likely result in Chinese reprisals against U.S. companies. The U.S. tech sector is the marginal loser (Table 3). Table 3S&P Tech Companies With Large China Exposure
U.S.-China: The Tech War And Reform Agenda
U.S.-China: The Tech War And Reform Agenda
Second, while it is often believed that China is playing “the long game,” the government’s technological acquisition policies suggest a very short-term modus operandi. The allegations of widespread and flagrant use of tech company employees by intelligence agencies, and gross cyber intrusions, if true, imply that China is making a mad dash for technology even at the risk of alienating its trading partners and driving them into a coalition against it. Since no government can overlook the national security implications of such practices, China will continue to suffer from foreign sanctions and embargoes, until it convinces foreign competitors it has changed its ways. As a result, China’s tech and industrial sectors are the marginal losers. The big picture is that the U.S. is setting up a “firewall” of rules and regulations to protect its knowledge and innovation, and China is frantically “downloading” as much data as possible before the firewall is fully operational. This dynamic will be difficult to reverse given that the overall context is one of rising suspicion and strategic distrust. Matt Gertken, Vice President Geopolitical Strategy mattg@bcaresearch.com Jonathan LaBerge, CFA, Vice President Special Reports jonathanl@bcaresearch.com Footnotes 1 The Rise and Fall of the Great Powers: Economic Change and Military Conflict from 1500-2000 (Random House, 1988). 2 Please see “Assessing and Strengthening the Manufacturing and Defense Industrial Base and Supply Chain Resiliency of the United States,” Interagency Task Force in Fulfillment of Executive Order 13806, September 2018, available at media.defense.gov. 3 Please see U.S. Bureau of Industry and Security, “Review of Controls for Certain Emerging Technologies,” Department of Commerce, November 19, 2018, available at www.federalregister.gov. 4 Please see Dan Kim, "Semiconductor Supply Chains and International Trade,” SEMI ITPC, November 5, 2018. 5 Please see President’s Council of Advisors on Science and Technology, “Ensuring Long-Term U.S. Leadership In Semiconductors,” Report to the President, January 2017, available at obamawhitehouse.archives.gov. 6 Please see Department of Justice, “PRC State-Owned Company, Taiwan Company, and Three Individuals Charged With Economic Espionage,” Office of Public Affairs, November 1, 2018, available at www.justice.gov. 7 Please see Stu Woo and Kate O’Keeffe, “Washington Asks Allies To Drop Huawei,” Wall Street Journal, November 22, 2018, available at www.wsj.com. 8 Please see Lorand Laskai, “Civil-Military Fusion and the PLA’s Pursuit of Dominance in Emerging Technologies,” China Brief 18:6, April 9, 2018, available at Jamestown.org. 9 Please see Office of the United States Trade Representative, “Update Concerning China’s Acts, Policies, And Practices Related To Technology Transfer, Intellectual Property, And Innovation,” dated November 20, 2018, available at ustr.gov.
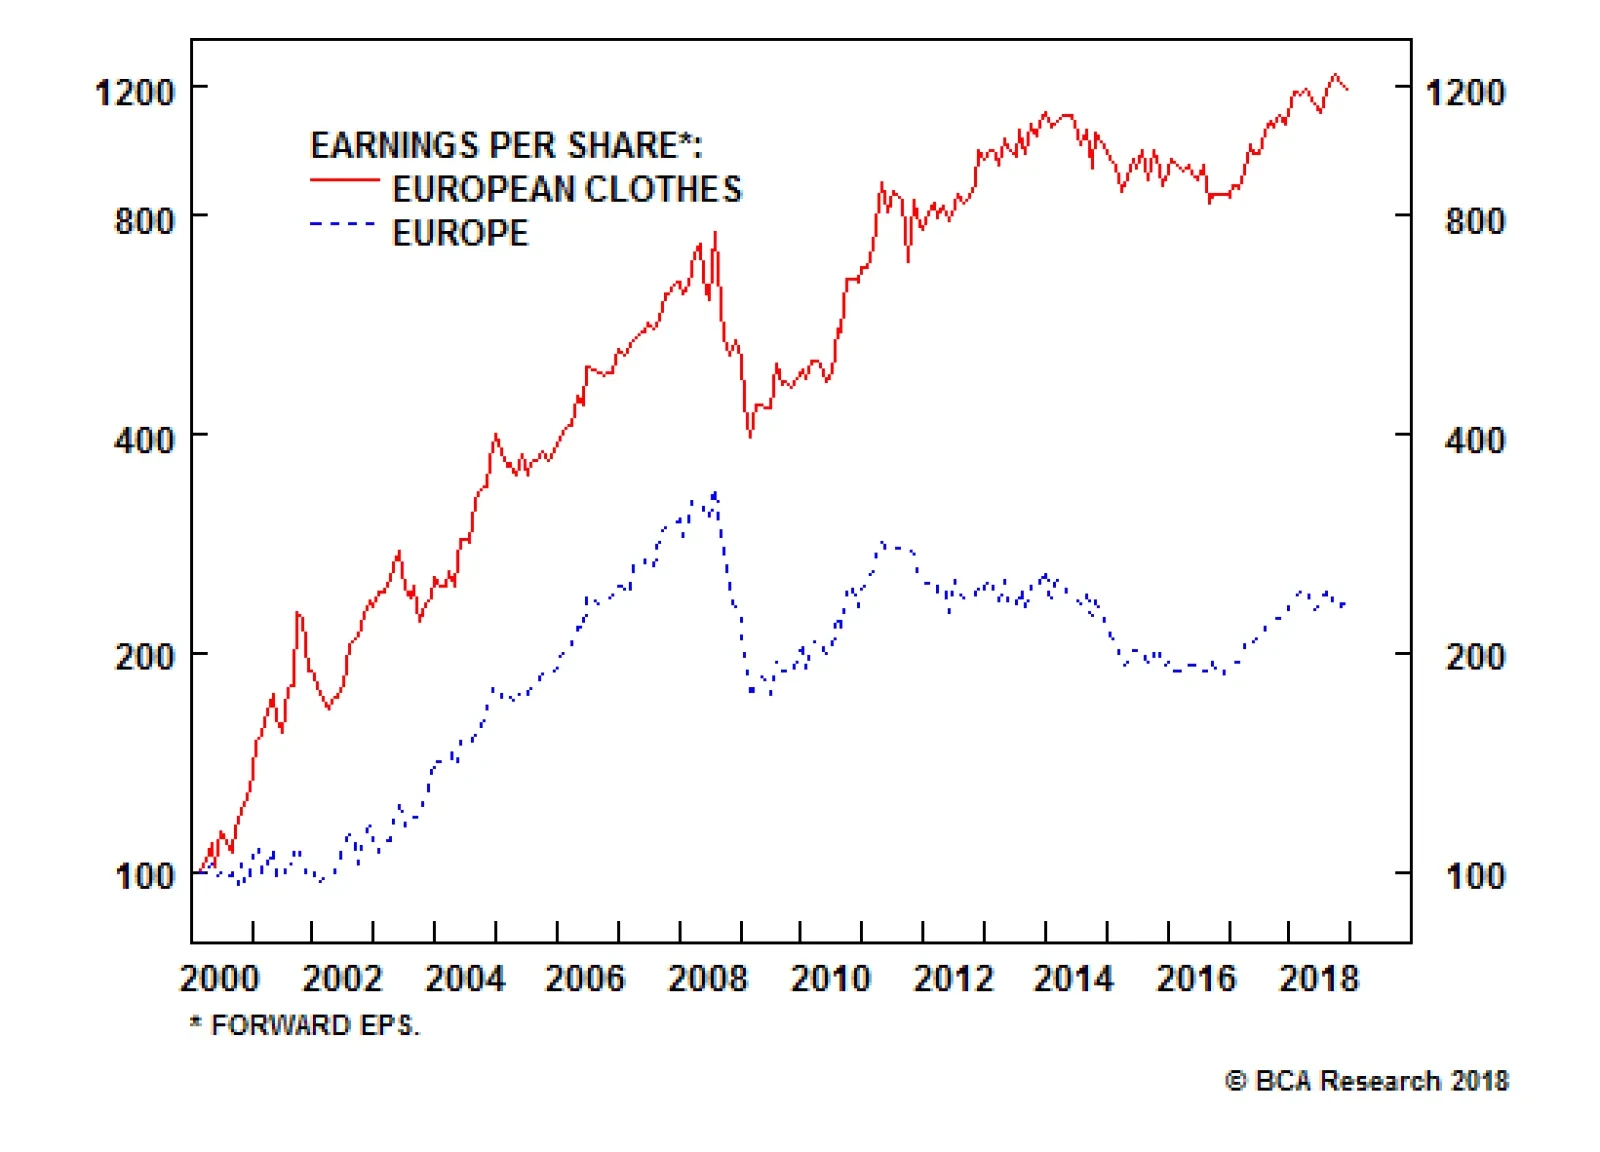
Since the turn of the millennium, the clothing and accessories sector’s profits are up by a thousand percent. Our European investment strategists argue that this megatrend has further to run, as its principle driver is still very much in place: Consumption…
Highlights Downside risks to EM assets remain substantial. Stay put. EM stocks, credit and currencies will underperform their DM counterparts in the first half of 2019. The key and necessary condition for a new secular EM bull market to emerge is the end of abundant financing. The latter is imperative to compel corporate restructuring, bank recapitalization as well as structural reforms. The cyclical EM outlook hinges on China’s business cycle. The slowdown in China is broad-based and will deepen. The slowdown in China/EM will likely lead to global trade contraction. The latter is negative for global cyclicals yet bullish for the U.S. dollar. Feature As we head into 2019, the past decade is shaping up to be a lost one for emerging markets (EM) assets. In particular: EM stocks have underperformed DM markets substantially since the end of 2010 (Chart I-1). In absolute terms, EM share prices are at the same level as they were in early 2010. Chart I-1EM Equities Have Been Underperforming DM For Eight Years
EM Equities Have Been Underperforming DM For Eight Years
EM Equities Have Been Underperforming DM For Eight Years
EM currencies have depreciated substantially since 2011, and the EM local currency bond index (GBI-EM) on a total-return basis has produced zero return in U.S. dollar terms since 2010 (Chart I-2). Chart I-2A Lost Decade For Investors In EM Local Currency Bonds?
A Lost Decade For Investors In EM Local Currency Bonds?
A Lost Decade For Investors In EM Local Currency Bonds?
Finally, EM sovereign and corporate high-yield bonds have not outperformed U.S. high-yield corporate bonds on an excess-return basis. Will 2019 witness a major reversal of such dismal EM performance? And if so, will it be a structural or cyclical bottom? The roots underneath this lost decade for EM stem neither from trade wars nor from Federal Reserve tightening. Therefore, a structural bottom in EM financial markets is contingent neither on the end of Fed tightening nor the resolution of current trade tussles. We address the issues of Fed tightening and trade wars below. A Lost Decade: Causes And Remedies What led to a lost decade for EM was cheap and plentiful financing. When the price of money is low and financing is abundant, companies and households typically rush to borrow and spend unwisely. Capital is misallocated and, consequently, productivity and real income growth disappoint – and debtors’ ability to service their debts worsens. This is exactly what has happened in EM, as easy money splashed all over developing economies since early 2009. There have been three major sources of financing for EM: Source 1: Chinese Banks Chinese banks have expanded their balance sheets by RMB 198 trillion to RMB 262 trillion (or the equivalent of $28.8 trillion) over the past 10 years (Chart I-3, top panel). When commercial banks expand their balance sheets by lending to or buying an asset from non-banks, they create deposits (money). Consistently, the broad money supply has expanded by RMB 175 trillion to RMB 234 trillion (or the equivalent of $25.5 trillion). Chart I-3Enormous Boom In Chinese Banks' Assets And Money Supply
Enormous Boom In Chinese Banks' Assets And Money Supply
Enormous Boom In Chinese Banks' Assets And Money Supply
Notably, the People’s Bank of China (PBoC) has increased commercial banks’ excess reserves by RMB 1.5 trillion to RMB 2.8 trillion (or the equivalent of $0.22 trillion) (Chart I-3, bottom panel). Hence, the meaningful portion of money supply expansion has been due to the money multiplier – money created by mainland banks – not a provision of excess reserves by the PBoC (Chart I-4). Chart I-4Attribution Of Rise In Money Supply To Excess Reserves And Money Multiplier
Attribution Of Rise In Money Supply To Excess Reserves And Money Multiplier
Attribution Of Rise In Money Supply To Excess Reserves And Money Multiplier
Not only has such enormous money creation by commercial banks generated purchasing power domestically, but it has also boosted Chinese companies’ and households’ purchases of foreign goods and services. The Middle Kingdom’s imports of goods and services have grown to $2.5 trillion compared with $3.2 trillion for the U.S. (Chart I-5). China’s spending has boosted growth considerably in many Asian, Latin American, African, Middle Eastern, and even select advanced economies. Chart I-5Imports Of Goods And Services: China And The U.S.
Imports Of Goods And Services: China And The U.S.
Imports Of Goods And Services: China And The U.S.
Source 2: DM Central Banks’ QE By conducting quantitative easing, the central banks of several advanced economies have crowded out investors from fixed-income markets, incentivizing them to search for yield in EM. The Fed, the Bank of England, the European Central Bank and the Bank of Japan have in aggregate expanded their balance sheets by $10 trillion (Chart I-6). Chart I-6Quantitative Easing In DM
Quantitative Easing In DM
Quantitative Easing In DM
This has led to massive inflows of foreign portfolio capital into EM, and reflated asset prices well beyond what was warranted by their fundamentals. Specifically, since January 2009, foreign investors have poured $1.5 trillion on a net basis into the largest 15 developing countries excluding China, Taiwan and Korea (Chart I-7, top panel). For China, net foreign portfolio inflows amounted to $560 billion since January 2009 (Chart I-7, bottom panel). Chart I-7Cumulative Foreign Portfolio Inflows Into EM And China
Cumulative Foreign Portfolio Inflows Into EM And China
Cumulative Foreign Portfolio Inflows Into EM And China
Source 3: EM Ex-China Banks EM ex-China began expanding their balance sheets aggressively in early 2009, originating new money (local currency) and thereby creating purchasing power. This was especially the case between 2009 and 2011. Since that time, money creation by EM ex-China banks has decelerated substantially due to periodic capital outflows triggering currency weakness and higher borrowing costs. Out of these three sources, China’s money/credit cycles remain the primary driver of EM. The mainland’s imports from developing economies serves as the main nexus between China and the rest of EM. Essentially, Chinese money and credit drive imports, influencing growth and corporate profits in the EM universe (Chart I-8). Chart I-8China's Credit Cycle Leads Its Imports
China's Credit Cycle Leads Its Imports
China's Credit Cycle Leads Its Imports
In turn, EM business cycle upturns attract international capital. Meanwhile, credit creation by local banks in EM ex-China – primarily in economies with high inflation or current account deficits – is a residual factor. In these countries, domestic credit creation is contingent on a healthy balance of payments and a stable exchange rate. The latter two, in turn, transpire when exports to China and international portfolio capital inflows are improving. The outcome of easy financing is over-borrowing and capital misallocation. The upshot of the latter is usually lower efficiency and productivity growth. Not surprisingly, productivity growth in both China and EM ex-China has decelerated considerably since 2009 (Chart I-9). EM return on assets has dropped a lot in the past 10 years and is now on par with levels last seen during the 2008 global recession (Chart I-10). Chart I-9Falling Productivity Growth In EM And China =...
Falling Productivity Growth In EM And China =...
Falling Productivity Growth In EM And China =...
Chart I-10... = Low Profit Margins And Low Return On Capital
... = Low Profit Margins And Low Return On Capital
... = Low Profit Margins And Low Return On Capital
Accordingly, the ability to service debt by EM companies has deteriorated considerably in the past decade – the ratios of cash flows from operations to both interest expenses and net debt have dropped (Chart I-11). Chart I-11EM: Deteriorating Ability To Service Debt
EM: Deteriorating Ability To Service Debt
EM: Deteriorating Ability To Service Debt
These observations offer unambiguous confirmation that money has been spent inefficiently – i.e., misallocated. Credit booms and capital misallocations warrant a period of corporate restructuring and banking sector recapitalization. Without this, a new cycle cannot emerge. A secular bull market in equities and exchange rates arises when productivity growth and hence income-per-capita growth accelerates, and return on capital begins to climb. This is not yet the case for most developing economies. The end of cheap and abundant financing is imperative to compel corporate restructuring, bank recapitalization as well as structural reforms. These are necessary conditions to create the foundation for a new secular bull market. Ironically, the best remedy for an addiction to easy money is a period of tight money. For example, U.S. share prices would not be as high as they currently are if the U.S. did not go through the Lehman crisis. This 10-year bull market in U.S. equities was born from the ashes of the Lehman crisis. Vanished financing and the private sector’s tight budgets in 2008-‘09 compelled corporate restructuring as well as a focus on efficiency and return on equity. Has EM financing become scarce and tight? Cyclically, China’s money creation and credit flows have slowed, pointing to a cyclical downturn in EM share prices and commodities (please see below for a more detailed discussion). International portfolio flows to EM have also subsided since early this year. There has been selective corporate restructuring post the 2015 commodities downturn, including in the global/EM mining and energy sectors, China steel and coal industries as well as among Russian and Brazilian companies. However, there are many economies and industries where corporate restructuring, bank recapitalization and structural reforms have not been undertaken. Yet from a structural perspective, China’s money and credit growth remain elevated and excesses have not been purged. Besides, international portfolio flows to EM have had periodic “stop-and-gos” but have not yet retrenched meaningfully (refer to Chart I-7 on page 4). Consequently, structural overhauls and corporate restructuring in China/EM have by and large not yet occurred – in turn negating the start of a new secular bull market. Bottom Line: Conditions for a structural bull market in EM/China are not yet present. EM/China: A Cyclical Bottom Is Not In Place From a cyclical perspective, China is an important driving force for the majority of EM economies, and its deepening growth slowdown will continue to weigh on EM growth and global trade. In fact, odds are that global trade will contract in the first half of 2019: In China, tightening of both monetary policy as well as bank and non-bank regulation from late 2016 has led to a deceleration in money and credit growth. The latter has, with a time, lag depressed growth since early this year. Policymakers have undertaken some stimulus since the middle of this year, but it has so far been limited. Stimulus also works with a time lag. Besides, even though the broad money impulse has improved, the credit and fiscal spending impulse remains in a downtrend (Chart I-12). Therefore, there are presently mixed signals from money and credit. Chart I-12China's Stimulus Leads EM And Commodities
China's Stimulus Leads EM And Commodities
China's Stimulus Leads EM And Commodities
As illustrated in Chart I-12, the bottoms in the money and combined credit and fiscal spending impulses, in July 2015, preceded the bottom in EM and commodities by six months and their peak led the top in financial markets by about 15 months in January 2018. Besides, in 2012-‘13, the rise in the money and credit impulses did not do much to help EM stocks or industrial commodities prices. Hence, even if the money as well as credit and fiscal impulses bottom today, it could take several more months before the selloff in EM financial markets and commodities prices abates. Additionally, the ongoing regulatory tightening of banks and non-bank financial institutions will hinder these institutions' willingness and ability to extend credit, despite lower interest rates. We discussed in a recent report that both the effectiveness of the monetary transmission mechanism and the time lag between policy easing and a bottom in the business cycle are contingent on the money multiplier (creditors' willingness to lend, and borrowers' readiness to borrow) and the velocity of money (the marginal propensity to spend among households and companies). Growth in capital spending in general and construction in particular have ground to a halt (Chart I-13). Chart I-13China: Weak Capital Spending
China: Weak Capital Spending
China: Weak Capital Spending
Not only has capital spending decelerated but household consumption has also slowed since early this year, as demonstrated in the top panel of Chart I-14. Chart I-14China: A Broad-Based Slowdown
China: A Broad-Based Slowdown
China: A Broad-Based Slowdown
Finally, mainland imports are the main channel in terms of how China’s growth slowdown transmits to the rest of the world. Not surprisingly, EM share prices and industrial metals prices correlate extremely well with the import component of Chinese manufacturing PMI (Chart I-15). Chart I-15China's Imports And EM And Commodities
China's Imports And EM And Commodities
China's Imports And EM And Commodities
Bottom Line: The slowdown in China is broad-based, and our proxies for marginal propensity to spend by households and companies both point to further weakness (Chart I-14, middle and bottom panels). Constraints And Chinese Policymakers’ Dilemma Given the ongoing slowdown in the economy, why are Chinese policymakers not rushing to the rescue with another round of massive stimulus? First, policymakers in China realize that the stimulus measures of 2009-‘10, 2012-‘13 and 2015-‘16 led to massive misallocations of capital and fostered both inefficiencies and speculative excesses in many parts of the economy – the property markets being among the main culprits. Indeed, policymakers recognize that easy money does not foster productivity growth, which is critical to the long-term prosperity of any nation. For China to grow and prosper in the long run, the economy’s addiction to easy financing should be curtailed. Second, policymakers are currently facing a dilemma. The real economy is saddled with enormous debt and is slowing. This warrants lower interest rates – probably justifying bringing down short-term rates close to zero. Yet, despite enforcing capital controls, it seems the exchange rate has been correlated with China’s interest rate differential with the U.S. since early 2010 (Chart I-16). Given the ongoing growth slowdown and declining return on capital in China, there are rising pressures for capital to exit the country. Notably, the PBoC’s foreign exchange reserves of $3 trillion are only equivalent to 10-14% of broad money supply (i.e., all deposits in the banking system) (Chart I-17). Chart I-16Chinese Currency And Interest Rates
Chinese Currency And Interest Rates
Chinese Currency And Interest Rates
Chart I-17China: Foreign Currency Reserves Are Very Low Compared To Money Supply/Deposits
China: Foreign Currency Reserves Are Very Low Compared To Money Supply/Deposits
China: Foreign Currency Reserves Are Very Low Compared To Money Supply/Deposits
The current interest rate differential is only 33 basis points. If the PBoC guides short-term rates lower and the Fed stays on hold or hikes a few more times, the spread will drop to zero or turn negative. Based on the past nine-year correlation, the narrowing interest rate spread suggests yuan depreciation. This will weigh on EM and probably even global risk assets. In a scenario where policymakers prioritize defending the yuan’s value, they may not be able to reduce borrowing costs and assist indebted companies and households. As a result, the downtrend in the real economy would likely worsen. Consequently, EM and global growth-sensitive assets will drop further. Given the constraints Chinese policymakers are facing, reducing interest rates and allowing the yuan to depreciate further is the least-bad outcome. Yet this will rattle Asian and EM currencies and risk assets. What About The Fed And Trade Wars? The Fed and EM: Fed policy and U.S. interest rates are relevant to EM, but they are of secondary importance. The primary driver of EM economies are their own domestic fundamentals as well as global trade – not just U.S. growth. Historically, the correlation between EM risk assets and the fed funds rate has been mixed, albeit more positive than negative (Chart I-18). On this chart, we have shaded the five periods over the past 38 years when EM stocks rallied despite a rising fed funds rate. Chart I-18The Fed And EM Share Prices: A Historical Perspective
The Fed And EM Share Prices: A Historical Perspective
The Fed And EM Share Prices: A Historical Perspective
There were only two episodes when EMs crashed amid rising U.S. interest rates: the 1982 Latin American debt crisis and the 1994 Mexican Tequila crisis. Yet it is vital to emphasize that these crises occurred because of poor EM fundamentals – elevated foreign currency debt levels, negative terms-of-trade shocks, large current account deficits and pegged exchange rates. Dire EM fundamentals also prevailed before the Asian/EM crises of 1997-1998. However, these late-1990s crises occurred without much in the way of Fed tightening or rising U.S. bond yields. Trade Wars: China’s current growth slowdown has not originated from a decline in its exports. In fact, Chinese aggregate exports and those to the U.S. have been growing at a double-digit pace, largely due to the front running ahead of U.S. import tariffs. More importantly, China’s exports to the U.S. and EU account for 3.8% and 3.2% of its GDP, respectively (Chart I-19). Total exports amount to 20% of GDP, with almost two-thirds of that being shipments to developing economies. This compares with capital spending that makes up 42% of GDP and household consumption of 38% of GDP. Hence, capital expenditures and household spending are significantly larger than shipments to the U.S. Chart I-19Structure Of Chinese Economy
Structure Of Chinese Economy
Structure Of Chinese Economy
There is little doubt that the U.S.-China confrontation has affected consumer and business sentiment in China. Nevertheless, the slowdown in China has - until recently - stemmed from domestic demand, not exports. Investment Recommendations It is difficult to forecast whether the current EM down leg will end with a bang or a whimper. Whatever it is, the near-term path of least resistance for EM is to the downside. “A bang” scenario – where financial conditions tighten substantially and for an extended period – would likely compel corporate and bank restructuring as well as structural reforms. Therefore, it is more likely to mark a structural bottom in EM financial markets. “A whimper” scenario would probably entail only moderate tightening in financial conditions. Thereby, it would not foster meaningful corporate restructuring and structural reforms. Hence, such a scenario might not mark a secular bottom in EM stocks and currencies. In turn, the EM cyclical outlook hinges on China’s business cycle. If and when Chinese policymakers reflate aggressively, the mainland business cycle will revive, producing a cyclical rally in EM risk assets. At the moment, Chinese policymakers are behind the curve. With respect to investment strategy, we continue to recommend: Downside risks to EM assets remain substantial. Stay put. EM stocks, credit and currencies will underperform their DM counterparts in the first half of 2019. The slowdown in China/EM will likely lead to global trade contraction. The latter is negative for global cyclicals yet bullish for the U.S. dollar. For dedicated EM equity portfolios, our overweights are: Brazil, Mexico, Chile, Colombia, Russia, central Europe, Korea and Thailand. Our underweights are: South Africa, Peru, Indonesia, India, the Philippines and Hong Kong stocks. We are neutral on the remaining bourses. In the currency space, we continue to recommend shorting a basket of the following EM currencies versus the U.S. dollar: ZAR, CLP, IDR, MYR and KRW. The latter is a play on RMB depreciation. The full list of our recommendation across EM equity, fixed-income, currency and credit markets is available on pages 14-15. Arthur Budaghyan, Senior Vice President Emerging Markets Strategy arthurb@bcaresearch.com Equity Recommendations Fixed-Income, Credit And Currency Recommendations
Underweight (High-Conviction) In our initiation of coverage on the S&P interactive media & services index,1 we highlighted a renewed regulatory focus as a key risk that offset the revenue & profit growth vigor of this group, comprised almost entirely of Alphabet (Google) and Facebook. Tack on the inverse correlation these growth stocks have with interest rates (top panel) and that caused us to lower our recommendation on Monday. Increasing regulatory efforts on technology will be a key theme next year, one we explored this past summer. Our conclusion was that both antitrust (particularly in the case of Alphabet) and privacy regulation (particularly in the case of Facebook) added significant risk to these near monopolies; calls for legislating both have dramatically amplified. This communication services sub-index is particularly prone to such a risk when it already trades at close to a 40% valuation premium to the broad market (middle panel). Adding insult to injury is the PEG ratio that is trading at a 60% premium to the broad market (bottom panel). In the face of the Fed’s sustained tightening cycle these extreme growth stocks are vulnerable to massive gravitational pull. Net, we have downgraded our recommendation to underweight and include this index in the high-conviction underweight list for 2019; please see Monday’s Weekly Report for more details. The ticker symbols in the stocks in this index are: S5INMS – GOOGL, GOOG, FB, TWTR and TRIP. 1 Please see BCA U.S. Equity Strategy Special Report, “New Lines Of Communication,” dated October 1, 2018, available at uses.bcaresearch.com.
Logging Off Interactive Media And Services
Logging Off Interactive Media And Services