Sectors

Restaurants - Dine And Dash
Restaurants - Dine And Dash
Underweight The S&P restaurants index has had an exceptional month, following surprisingly healthy results from both McDonalds and Starbucks, which collectively represent approximately 80% of the index. We think the move is short-sighted and we would be sellers into the strength. The positive results at these restauranteurs would typically be reflected in outsized forward earnings growth estimates. However, this is not the case; as shown in the second panel, estimates for the S&P restaurants index are falling behind the broad market. Given the index’s rise without a corresponding earnings lift, the valuation multiple has soared and is now at a level 50% higher than the market (third panel). Meanwhile, the index has been dining out on an unhealthy diet of debt and balance sheets are stretched to extreme levels (bottom panel). In the absence of an unlikely surge of cash flow, particularly given the headwinds an appreciating U.S. dollar represents, a painful cycle of belt-tightening lies ahead. Bottom Line: Tepid earnings growth, high valuations and bulging leverage are a recipe for stock price declines in the S&P restaurants index; stay underweight. The ticker symbols for the stocks in this index are: BLBG: S5REST - MCD, SBUX, YUM, DRI, CMG.
Highlights On a 6-month horizon, go long a combination of banks and high quality 10-year bonds. The recommended combination is 25 cents in the banks and 75 cents in the bonds. The preferred banks are European or euro area and the preferred bonds are U.S. T-bonds. Stay short oil and gas versus financials. During December, use any sharp sell-offs in sterling to buy the pound… …and to downgrade the FTSE100 to underweight. Feature Chart of the WeekBanks And Bond Yields Were Connected At The Hip... Until This Year
Banks And Bond Yields Were Connected At The Hip... Until This Year
Banks And Bond Yields Were Connected At The Hip... Until This Year
Back in June, in Oddities In The 1st Half, Opportunities In The 2nd Half we pointed out two striking oddities in financial market behaviour. One oddity was the sharp decoupling of crude oil from industrial commodity prices (Chart I-2). It is highly unusual for crude oil to outperform copper by 50 percent in the space of just six months. We argued that such an extreme deviation would have to correct one way or another. Which of course it did… Chart I-2Crude Oil Abruptly Decoupled From Industrial Commodities... Then Abruptly Recoupled
Crude Oil Abruptly Decoupled From Industrial Commodities... Then Abruptly Recoupled
Crude Oil Abruptly Decoupled From Industrial Commodities... Then Abruptly Recoupled
The other oddity was the abrupt decoupling of bank equity performance from bond yields (Chart I-3 and Chart of the Week). Bank equity prices and bond yields are usually connected at the hip. The tight connection exists because higher bond yields tend to signal stronger economic growth, either real or nominal. Stronger growth should be good for banks as it is associated with both accelerating credit growth and lower provisions for non-performing loans. Chart I-3Banks Decoupled From Bond Yields... But Will Recouple
Banks Decoupled From Bond Yields... But Will Recouple
Banks Decoupled From Bond Yields... But Will Recouple
On the back of these two striking oddities, we recommended a compelling trade: short oil and gas versus financials. This trade is now in profit and has further to run, but today we want to introduce a new trade: go long a combination of banks and bonds. Explaining The Oddities Of 2018 The underperformance of banks from February through September was entirely consistent with similar underperformances in the other classically growth-sensitive sectors – industrials, and basic materials as well as the decline in industrial commodity prices (Chart I-4). Furthermore, these underperformances started well before any inkling of a trade war. This suggests that the cyclical sector underperformances were correctly reflecting a common or garden down-oscillation in global growth. Chart I-4Oil And Gas Was The Odd Man Out
Oil And Gas Was The Odd Man Out
Oil And Gas Was The Odd Man Out
Oil was a striking oddity because its supply dynamics, rather than its demand dynamics, were dominating its price action, at one point lifting its year-on-year inflation rate to 70 percent for Brent and 80 percent for WTI. Part of this surge in year-on-year inflation was also to do with the ‘base effect’, the dip in the oil price to $45 in the summer of 2017. The base effect shouldn’t really bother markets. After all, most people do not consciously compare a price today with the price precisely a year ago. The problem is that central banks do compare a price today with the price precisely a year ago in their inflation targets. Clearly, when oil price inflation was running at 80 percent, it was underpinning headline CPI inflation, central bank reaction functions, and thereby bond yields. Hence, the two striking oddities – oil abruptly decoupling from industrial commodities (Chart I-5) and bond yields abruptly decoupling from banks – are two sides of the same coin. From February through September, bond yields were taking their cue, at least partly, from the rising price of oil, given its major impact on headline inflation and on central bank reaction functions. Whereas banks, industrials, and industrial commodity prices were taking their cue from fading global growth and industrial activity. Chart I-5It Is Highly Unusual For Oil To Outperform Copper By 50% In Six Months
It Is Highly Unusual For Oil To Outperform Copper By 50% In Six Months
It Is Highly Unusual For Oil To Outperform Copper By 50% In Six Months
A Banks Plus Bonds Combination Could Be A Win-Win The oddities of 2018 are now correcting. With the oil price sharply lower, its year-on-year inflation rate has plunged to -10 percent (Chart I-6). Furthermore, as we have pointed out in recent reports, the sharp deceleration in global credit growth from February through September has clearly arrested and even reversed. The upshot is that banks and bond yields will recouple, one way or the other. Chart I-6Oil Inflation Down from 70% To -10%
Oil Inflation Down from 70% To -10%
Oil Inflation Down from 70% To -10%
Most likely, global growth will rebound somewhat and the beaten-down bank equity prices have considerable scope for recovery (Chart I-7), while the restraint on headline CPI inflation will keep bond yields in check. Indeed, as President Trump recently tweeted: Chart I-7Global Growth Will Rebound, So Will Banks
Global Growth Will Rebound, So Will Banks
Global Growth Will Rebound, So Will Banks
“Inflation down, are you listening Fed!” But if we are wrong and growth disappoints, bank equities are already beaten-down while a further downdraft in inflation will pull down bond yields. Either way, on a six month horizon a combination of banks and high quality 10-year bonds should be a win-win strategy. Given the different betas of the two investments, the recommended combination is 25 cents in the banks and 75 cents in the bonds. The preferred banks are European or euro area and the preferred bonds are U.S. T-bonds. Focus On Sectors And Currencies The remainder of this report is a reminder that successful macro investing requires the application of the Pareto Principle, also known as 80:20 rule. In macro investing, the vast majority of performance outcomes, ‘the 80’, are explained by a very small number of drivers, ‘the 20’. We find that the vast majority of a region’s or a country’s stock market relative performance is explained just by its distinguishing sector fingerprint combined with its currency (Chart I-8 - Chart I-12). Chart I-8Euro Stoxx 600 Vs. MSCI Emerging Markets = Global Healthcare In Euros Vs. Global Technology In Dollars
Euro Stoxx 600 Vs. MSCI Emerging Markets = Global Healthcare In Euros Vs. Global Technology In Dollars
Euro Stoxx 600 Vs. MSCI Emerging Markets = Global Healthcare In Euros Vs. Global Technology In Dollars
Chart I-9Euro Stoxx 50 Vs. S&P 500 = Global Banks In Euros Vs. Global Technology In Dollars
Euro Stoxx 50 Vs. S&P 500 = Global Banks In Euros Vs. Global Technology In Dollars
Euro Stoxx 50 Vs. S&P 500 = Global Banks In Euros Vs. Global Technology In Dollars
Chart I-10FTSE 100 Vs. S&P 500 = Global Oil And Gas In Pounds Vs. Global Technology In Dollars
FTSE 100 Vs. S&P 500 = Global Oil And Gas In Pounds Vs. Global Technology In Dollars
FTSE 100 Vs. S&P 500 = Global Oil And Gas In Pounds Vs. Global Technology In Dollars
Chart I-11FTSE 100 Vs. Nikkei 225 = Global Oil And Gas In Pounds Vs. Global Industrials In Yen
FTSE 100 Vs. Nikkei 225 = Global Oil And Gas In Pounds Vs. Global Industrials In Yen
FTSE 100 Vs. Nikkei 225 = Global Oil And Gas In Pounds Vs. Global Industrials In Yen
Chart I-12FTSE 100 Vs. Euro Stoxx 50 = Global Oil And Gas In Pounds Vs. Global Banks In Euros
FTSE 100 Vs. Euro Stoxx 50 = Global Oil And Gas In Pounds Vs. Global Banks In Euros
FTSE 100 Vs. Euro Stoxx 50 = Global Oil And Gas In Pounds Vs. Global Banks In Euros
Major stock markets comprise of multinational companies whose sales and profits are internationally diversified. But each major stock market has a distinguishing ‘long’ sector in which it contains up to a quarter of its total market capitalisation, as well as a distinguishing ‘short’ sector in which it has a significant under-representation. The combination of this long sector and short sector gives each equity index its distinguishing fingerprint (Table I-1): FTSE100 = long energy, short technology. Eurostoxx50 = long banks, short technology. Nikkei225 = long industrials, short banks and energy. S&P500 = long technology, short materials. MSCI Emerging Markets = long technology, short healthcare. Table I-1Each Major Stock Market Has A Distinguishing Fingerprint
Oil, Banks, And Bonds: The Oddities Of 2018
Oil, Banks, And Bonds: The Oddities Of 2018
The other important factor is the currency. The FTSE100 oil and gas stock, BP, receives its revenue and incurs its costs in multiple major currencies, such as euros and dollars. In other words, BP’s global business is currency neutral. But BP’s stock price is quoted in London in pounds. Hence, if the pound strengthens, the company’s multi-currency profits will decline relative to the stock price and weigh it down. Conversely, if the pound weakens, it will lift the BP stock price. This means that the domestic economy can impact its stock market through the currency channel. Albeit it is a counterintuitive relationship: a strong economy via a strong currency hinders the stock market; a weak economy via a weak currency helps the stock market. What does all of this mean for our European country allocation right now? From a sector perspective, a stance that is short oil and gas versus financials penalises the FTSE100 versus the Eurostoxx50, given the FTSE100’s oil and gas fingerprint and the Eurostoxx50’s banks fingerprint. Against this, a weakening pound would support the FTSE100. Given that Theresa May’s Brexit agreement will meet stiff resistance when it comes to Parliament in the second week of December, the point of maximum risk for the pound is still ahead of us. But as we argued last week, we ultimately expect relief for the pound as: either the Article 50 process is extended, or the U.K. moves into a transition period within a negotiated Brexit.1 Hence, during December, use any sharp sell-offs in sterling to buy the pound, and to downgrade the FTSE100 to underweight. Dhaval Joshi, Senior Vice President Chief European Investment Strategist dhaval@bcaresearch.com Fractal Trading Model* This week we note that this year’s sell-off in Italian equities is technically very stretched. Therefore, in a continued de-escalation of the budget spat between Italy and the EU, Italian equities would be ripe for a strong countertrend burst of outperformance. On this basis, our recommended trade is long MIB versus the Eurostoxx with a profit target of 5% and a symmetrical stop-loss. For any investment, excessive trend following and groupthink can reach a natural point of instability, at which point the established trend is highly likely to break down with or without an external catalyst. An early warning sign is the investment’s fractal dimension approaching its natural lower bound. Encouragingly, this trigger has consistently identified countertrend moves of various magnitudes across all asset classes. Chart I-13
Long MIB Vs. Euro Stoxx
Long MIB Vs. Euro Stoxx
The post-June 9, 2016 fractal trading model rules are: When the fractal dimension approaches the lower limit after an investment has been in an established trend it is a potential trigger for a liquidity-triggered trend reversal. Therefore, open a countertrend position. The profit target is a one-third reversal of the preceding 13-week move. Apply a symmetrical stop-loss. Close the position at the profit target or stop-loss. Otherwise close the position after 13 weeks. Use the position size multiple to control risk. The position size will be smaller for more risky positions. * For more details please see the European Investment Strategy Special Report “Fractals, Liquidity & A Trading Model,” dated December 11, 2014, available at eis.bcaresearch.com Footnote 1 Please see the European Investment Strategy Weekly Report “DM Versus EM, And Two European Psychodramas”, November 22, 2018 available at eis.bcaresearch.com. Fractal Trading Model Recommendations Asset Allocation Equity Regional and Country Allocation Equity Sector Allocation Bond and Interest Rate Allocation Currency and Other Allocation Closed Fractal Trades Trades Closed Trades Asset Performance Currency & Bond Equity Sector Country Equity Indicators Bond Yields Chart II-1Indicators To Watch - Bond Yields
Indicators To Watch - Bond Yields
Indicators To Watch - Bond Yields
Chart II-2Indicators To Watch - Bond Yields
Indicators To Watch - Bond Yields
Indicators To Watch - Bond Yields
Chart II-3Indicators To Watch - Bond Yields
Indicators To Watch - Bond Yields
Indicators To Watch - Bond Yields
Chart II-4Indicators To Watch - Bond Yields
Indicators To Watch - Bond Yields
Indicators To Watch - Bond Yields
Interest Rate Chart II-5Indicators To Watch - Interest Rate Expectations
Indicators To Watch - Interest Rate Expectations
Indicators To Watch - Interest Rate Expectations
Chart II-6Indicators To Watch - Interest Rate Expectations
Indicators To Watch - Interest Rate Expectations
Indicators To Watch - Interest Rate Expectations
Chart II-7Indicators To Watch - Interest Rate Expectations
Indicators To Watch - Interest Rate Expectations
Indicators To Watch - Interest Rate Expectations
Chart II-8Indicators To Watch - Interest Rate Expectations
Indicators To Watch - Interest Rate Expectations
Indicators To Watch - Interest Rate Expectations
Highlights Turkish commercial banks have been ramping up purchases of local currency government bonds. Given that commercial banks create new money “out of thin air” when they buy assets from non-bank entities, should investors interpret this phenomenon positively or negatively? Under the backdrop of a severe recession, we view this phenomenon as a stabilizing factor that can provide moderate relief - a painkiller rather than a poison. Meanwhile, record-wide net interest rate spreads as well as rising purchases of government bonds yielding around 20% are positive for banks’ earnings amid an otherwise dismal economic outlook. To express a selective positive bias toward this depressed and still fundamentally challenged market versus other EMs, we recommend a relative equity trade: long Turkish banks / short EM banks, currency unhedged. Feature On August 15, 2018, we upgraded our stance on Turkish markets from underweight to neutral and closed our shorts in the currency and bank stocks after having been bearish/underweight for several years.1 Our rationale was that Turkish equity and currency valuations had become cheap, and its financial markets oversold. Yet we stated that the adjustment in interest rates and ensuing economic slowdown were still pending – preventing us from going overweight. Are Turkish interest rates now sufficiently high to put a floor under the currency? In other words, is monetary demagoguery – relentless bank lending promoted by the authorities amid high inflation – a thing of the past?2 At first glimpse, the answer appears to be no. Turkish banks have been aggressively buying local currency government bonds – at a time when foreigners have been selling their holdings (Chart I-1). Chart I-1Turkish Banks Have Been Buying Local Government Bonds
Turkish Banks Have Been Buying Local Government Bonds
Turkish Banks Have Been Buying Local Government Bonds
As we demonstrate in Box I-1 on page 9, commercial banks in all countries create new money when they purchase any asset, including any security, from non-bank entities. One can argue that the Turkish banks’ creation of money “out of thin air” holds the potential to trigger renewed currency depreciation. Furthermore, banks’ financing of the government depresses government bond yields, bringing down market-determined local currency interest rates. On the other hand, there is also evidence that banks have drastically curtailed financing to the real economy, which is causing a severe collapse in domestic demand. This has already squeezed imports and has started to narrow the current account deficit - a necessary condition for macro and exchange rate stabilization (Chart I-2). As such, it seems Turkey’s necessary macro adjustment is already under way. Chart I-2Turkey: Current Account Deficit Is Narrowing
Turkey: Current Account Deficit Is Narrowing
Turkey: Current Account Deficit Is Narrowing
These two dynamics – (1) banks financing the government by creating money “out of thin air” and (2) banks inhibiting financing to households and companies – are conflicting. While many economists refer to this phenomenon as a crowding out of the private sector by the government, we disagree with this analytical framework. Please refer to Box I-1 on page 9 for a more detailed discussion. Our assessment of these dynamics is as follows: In the current context of rapidly shrinking domestic demand, banks’ financing of the government is a mitigating factor in the ongoing macro adjustment. Commercial banks’ financing of the public sector via bond purchases caps market-determined interest rates and allows the government to spend, therefore diminishing the blow to the real economy. Consequently, the expansion of Turkish banks’ purchases of government bonds is a silver lining in an otherwise harsh macro adjustment. So long as this phenomenon is not prolonged indefinitely and does not cause the currency to plunge anew, it is an acceptable strategy for both banks and the government. In fact, it could form a fertile ground for Turkish banks’ stock prices to start rising from the ashes, at least relative to other emerging markets. Fiscal Deficit Financing By Banks: Poison Or Painkiller? Diagnosing a patient in critical condition and prescribing the right medicine is a complex task. Assessing monetary conditions in a financial crisis-stricken economy and determining the correct policy mix is no different. While monetary tightening may be the right medicine for some parts of the economy, monetary easing can be appropriate for others parts. In fact, this is what is currently happening in Turkey. There is a dichotomy occurring between monetary easing for the government (in the local currency bond market) and monetary tightening for companies and households. Chart 3 demonstrates that local currency broad money growth now slightly exceeds bank loan growth. One of the reasons for this is that banks are literally creating money by purchasing government securities. With a low likelihood of default and a yield of 20%, government securities are currently attractive for Turkish banks. On the surface, government deficit financing via money creation by banks might seem like a recipe for higher inflation. Yet, we have to put this phenomenon in the context of current cyclical economic conditions in Turkey. The economy is on the precipice of a major recession which will likely produce a major deflationary shockwave. Money and credit growth in real terms is negative (Chart I-3, bottom panel). In addition, government expenditures in real terms are now contracting, suggesting that fiscal policy is tight (Chart I-4). Furthermore, government debt levels are low – total public debt stands at 31% of GDP. This means that fiscal expansion is a lever that authorities can and should be using. Chart I-3Turkey: Money And Loan Growth Are Negative In Real Terms
Turkey: Money And Loan Growth Are Negative In Real Terms
Turkey: Money And Loan Growth Are Negative In Real Terms
Chart I-4Turkey: Fiscal Policy Is Tight
Turkey: Fiscal Policy Is Tight
Turkey: Fiscal Policy Is Tight
Hence, we infer that banks’ financing of government expenditures are not excessive from a macro perspective; particularly when considering the currently heightened recessionary crosscurrents. Bottom Line: The expansion of Turkish banks’ purchases of government bonds are capping local bond yields and, on the margin, allowing the government to support the economy. Given the backdrop of a severe recession, we view this as a stabilizing factor – a painkiller rather than a poison. Monetary Tightening In The Real Economy Commercial banks have substantially tightened financing to companies and households. Interest rates on bank loans to businesses and consumers have risen much more than the central bank’s policy rate. The former are now 850 basis points higher than the latter (Chart I-5, top panel). Chart I-5Turkey: Tight Monetary Conditions In The Real Economy
Turkey: Tight Monetary Conditions In The Real Economy
Turkey: Tight Monetary Conditions In The Real Economy
In real terms (deflated by core CPI), commercial bank loan interest rates are now 8% (Chart I-5, bottom panel). High real bank loan rates charged to households and companies will cause domestic demand to collapse – despite a real policy rate at zero. Provided economic activity is already shrinking, it will be difficult for debtors to achieve a hurdle real rate of 8%. This is already producing a collapse in loan demand and a material retrenchment in consumer and business spending. A statistical regression of economic activity variables on the change in borrowing costs demonstrates that the Turkish economy is in for a severe recession across all sectors, with capital expenditures being the hardest hit (Chart I-6). Chart I-6Turkey: The Recession Will Be Severe
Turkey: The Recession Will Be Severe
Turkey: The Recession Will Be Severe
A cheapened currency and high borrowing costs are the correct medicine for the nation’s deep economic imbalances – i.e. its large and persistent current account deficits. In fact, the real economy has already been adjusting: the current account excluding oil is starting to narrow (refer to Chart I-2 on page 2). This together with cheap valuations may help put a floor under the lira (Chart I-7). Chart I-7The Turkish Lira Is Cheap
The Turkish Lira Is Cheap
The Turkish Lira Is Cheap
Bottom Line: Interest rates on bank loans have increased much more than the central bank policy rate and are sufficiently high in real terms, foreshadowing a severe, but necessary, domestic demand contraction. Go Long Turkish Banks / Short EM Banks There appears to be a relative tactical opportunity to go long Turkish banks while shorting EM banks. Relative share prices in dollar terms between Turkish and EM banks are at an all-time low (Chart I-8). Odds are that Turkish banks will outperform for the time being. Chart I-8Long Turkish Banks / Short EM Banks
Long Turkish Banks / Short EM Banks
Long Turkish Banks / Short EM Banks
Not only are Turkish banks charging a large spread on loans relative to the policy rate, they are also enjoying a wide net interest rate spread – lending rates minus deposit rates. In fact, Turkish banks’ net interest rate spread is presently the highest in recorded history (Chart I-9, top panel). This is very positive for banks’ net interest margins (NIM) – net interest income as percent of loans - and earnings (Chart I-9, bottom panel). Chart I-9Turkish Banks' Margins Are Widening
Turkish Banks' Margins Are Widening
Turkish Banks' Margins Are Widening
In addition, banks’ purchases of government bonds allows them to expand their balance sheets and earn a yield that is around 20%. Given the government’s low credit risk, this is also positive for banks’ profits. On the negative side, non-performing loans (NPLs) are set to surge. Therefore, any investment consideration should take into account banks’ equity erosion due to surging NPLs. Turkish banks are presently extremely under-provisioned, as illustrated in Chart I-10. Yet their share prices have already plunged substantially, discounting a higher level of NPLs than banks have acknowledged and provisioned for. Chart I-10Turkey: NPLs Are Set To Surge
Turkey: NPLs Are Set To Surge
Turkey: NPLs Are Set To Surge
We have performed a credit stress test for the Turkish banking system. The scenario analysis shown in Table I-1 illustrates that banks’ share prices are already pricing in a significant amount of bad news regarding the NPL cycle. For example, in a scenario where the non-performing credit assets (NPCA) ratio rises to 20% from its current 3.5% level, bank stocks would be fairly valued at current levels. Table I-1Credit Stress Test For Turkish Banks
Turkish Monetary Demagoguery: A Thing Of The Past?
Turkish Monetary Demagoguery: A Thing Of The Past?
Considering that the NPL-to-total-loan ratio reached 18% after the 2001 currency crisis, we believe 20% is a reasonable estimate. The key difference between now and the 2001 crisis is that woes in 2001 were related to unsustainable government debt, while Turkey’s present problems stem from excessive private debt. This valuation part of the stress test assumes that the fair value for the price-to-book value (PBV) ratio adjusted for all credit losses is 1.3 - the average PBV ratio for EM banks since 2011. In short, banks’ stock prices are currently trading close to their fair value assuming 20% NPCA (Table I-1). In all scenarios, we assume a recovery rate of 40%. In terms of structural valuations, using our model for the cyclically-adjusted P/E (CAPE) ratio, Turkish banks are currently trading at two standard deviations below their fair value in absolute terms, and two-and-half standard deviations relative to the other EM banks (Chart I-11). Chart I-11Turkish Bank Stocks Are Cheap
Turkish Bank Stocks Are Cheap
Turkish Bank Stocks Are Cheap
Given that we expect an additional selloff in EM risk assets, Turkish bank stocks will likely relapse in absolute terms. This is why we recommend a market-neutral bet. In short, we expect more downside in the share price of EM banks than in Turkish ones for now. Investment Conclusions Given our overarching negative view on emerging markets as a whole, we are reluctant to be bullish on Turkish risk assets in absolute terms. The basis behind why we are not upgrading our stance on Turkey’s overall stock index is as follows: Non-financials companies are about to experience severe profit shrinkage as the recession deepens. Conversely, contraction in banks’ earnings will be mitigated by a very wide NIM and an increased financing of the government at yields above 20%. In addition, we expect EM currencies and high-yielding local bonds to resume their selloff, and corporate and sovereign credit spreads to widen. Given Turkey has historically been a high-beta market, it is difficult to bet on its financial markets outperforming EM peers in a bear market. Finally, the recent rebound in Turkish markets was from quite oversold levels and is currently facing its first technical resistance (Chart I-12). Chart I-12The Lira And Local Government Bonds Are Facing Their First Technical Resistance
The Lira And Local Government Bonds Are Facing Their First Technical Resistance
The Lira And Local Government Bonds Are Facing Their First Technical Resistance
Overall, we continue to recommend a neutral allocation to Turkey for EM dedicated equity investors, as well as local currency bond and credit portfolios. Nevertheless, to express a selective positive bias toward this depressed market versus other EMs, we recommend a relative equity trade: Long Turkish banks / short EM banks, currency unhedged. Stephan Gabillard, Senior Analyst stephang@bcaresearch.com Box 1 How Banks Create Money By Purchasing Assets From A Non-Bank Entity We demonstrate, in a stylized example, how a commercial bank (Bank 1) creates a new deposit in the banking system – which consists of two banks (Bank 1 and Bank 2) - when it purchases a bond from an investor (Investor A) that is a non-bank. For simplicity, we presume that this is the only transaction in the banking system on that day. All numbers we cite here are local currency values and all transactions take place in local currency. We assume at the beginning of Day 1 that both Bank 1 and Bank 2 each have excess reserves (ERs) of 1000 and existing deposits of 1000 (Figure I-1). Hence, the overall banking system ERs amount to 2000 and total deposits are equal to 2000. Figure I-1Begining Of Day 1 Balance Sheet & Transactions
Turkish Monetary Demagoguery: A Thing Of The Past?
Turkish Monetary Demagoguery: A Thing Of The Past?
As Bank 1 purchases a bond at the price of 300 from Investor A, the following balance sheet accounting entries take place (these entries are shown in red in Figure I-1): Bank 1 acquires a bond and its assets now include a bond valued at 300. Investor A has an account at Bank 2, so to pay for this purchase Bank 1 transfers 300 from its ERs to Bank 2’s ERs account at the central bank. Bank 1 ERs decline by 300. Hence, its assets and liabilities have not changed – it has just swapped 300 in ERs with 300 in bond (Figure I-1). Bank 2 credits Investor A’s deposit account by 300. Hence, Investor A received a deposit valued at 300 that it previously did not have. This is a new deposit for the whole banking system that was created “out of thin air”. Bank 2’s ERs and hence its total assets have risen by 300. This rise in Bank 2’s assets is balanced by the increase of its deposit by 300 (Figure I-2). In brief, this deposit is nothing more than an accounting entry to balance Bank 2’s assets and liabilities. Yet, deposits represent money and give their holders purchasing power. Figure I-2End Of Day 1 Balance Sheet
Turkish Monetary Demagoguery: A Thing Of The Past?
Turkish Monetary Demagoguery: A Thing Of The Past?
Assuming that during the day there was no other transaction in this banking system, the latter’s ERs have remained unchanged at 2000 yet its total deposits have risen from 2000 to 2300. A new deposit worth 300 was created without the central bank providing any funding (new ERs) to the banking system. Money supply is the sum of all deposits in the banking system and commercial banks create deposits “out of thin air” when they lend to non-banks or purchase assets from non-banks. As such, banks do not need to reduce private sector lending to fund the government. In other words, no “crowding out” of the private sector needs to take place for banks to buy government bonds. Footnotes 1 Please see Emerging Markets Strategy Special Alert "Turkey: Booking Profits On Shorts," dated August 15, 2018, the link available on page 14. 2 Please see Emerging Markets Strategy Special Report "Turkey's Monetary Demagoguery," dated June 1, 2016, available at ems.bcaresearch.com Equity Recommendations Fixed-Income, Credit And Currency Recommendations
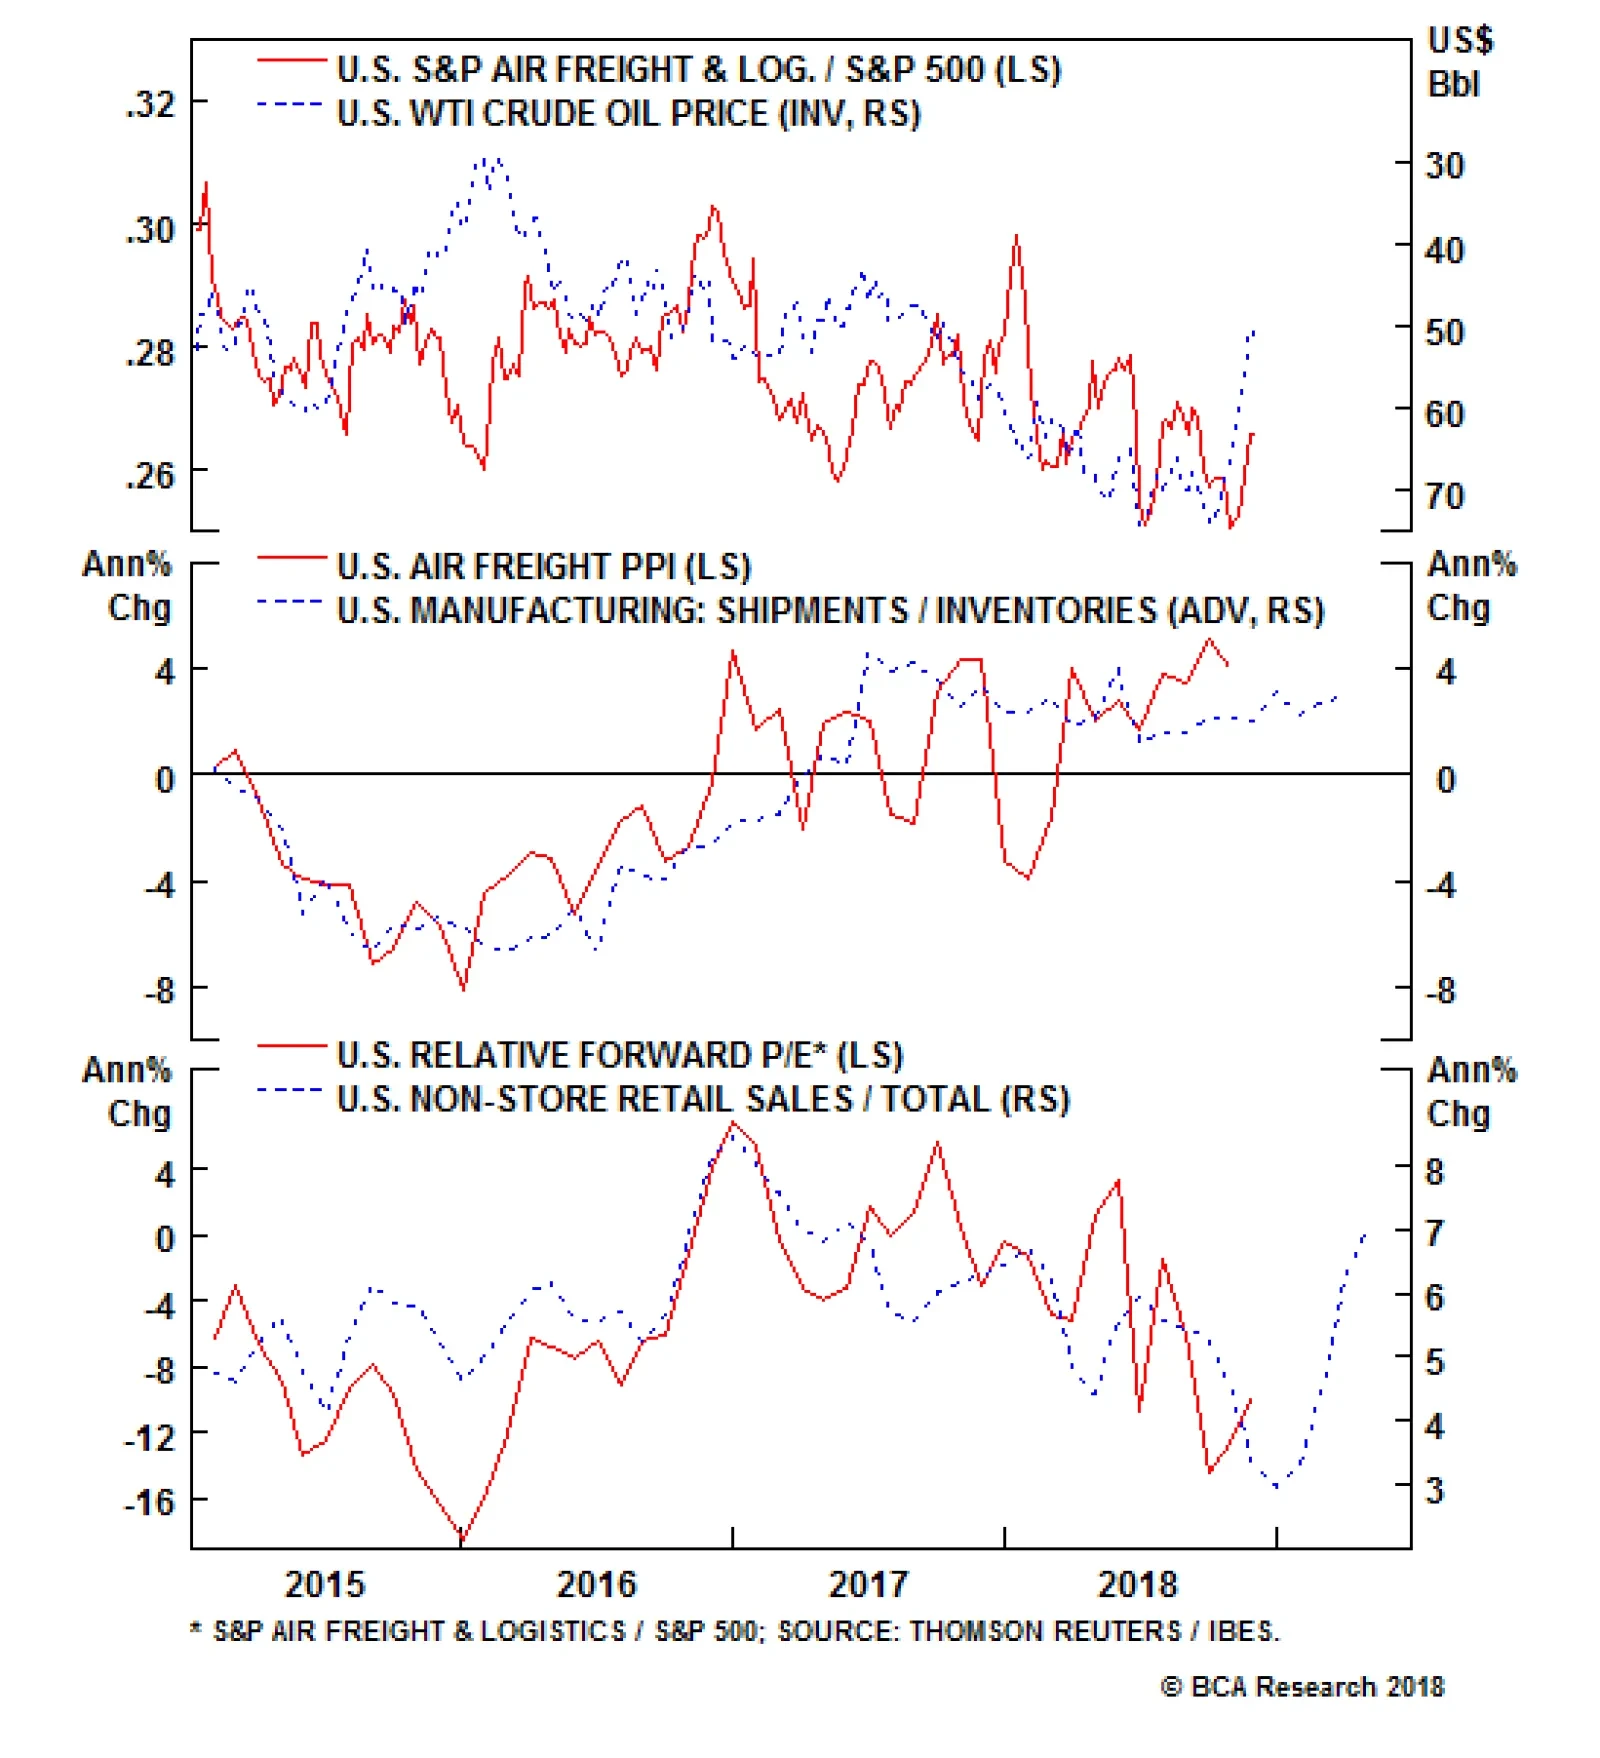
Air Freight & Logistics: We Have Liftoff
…
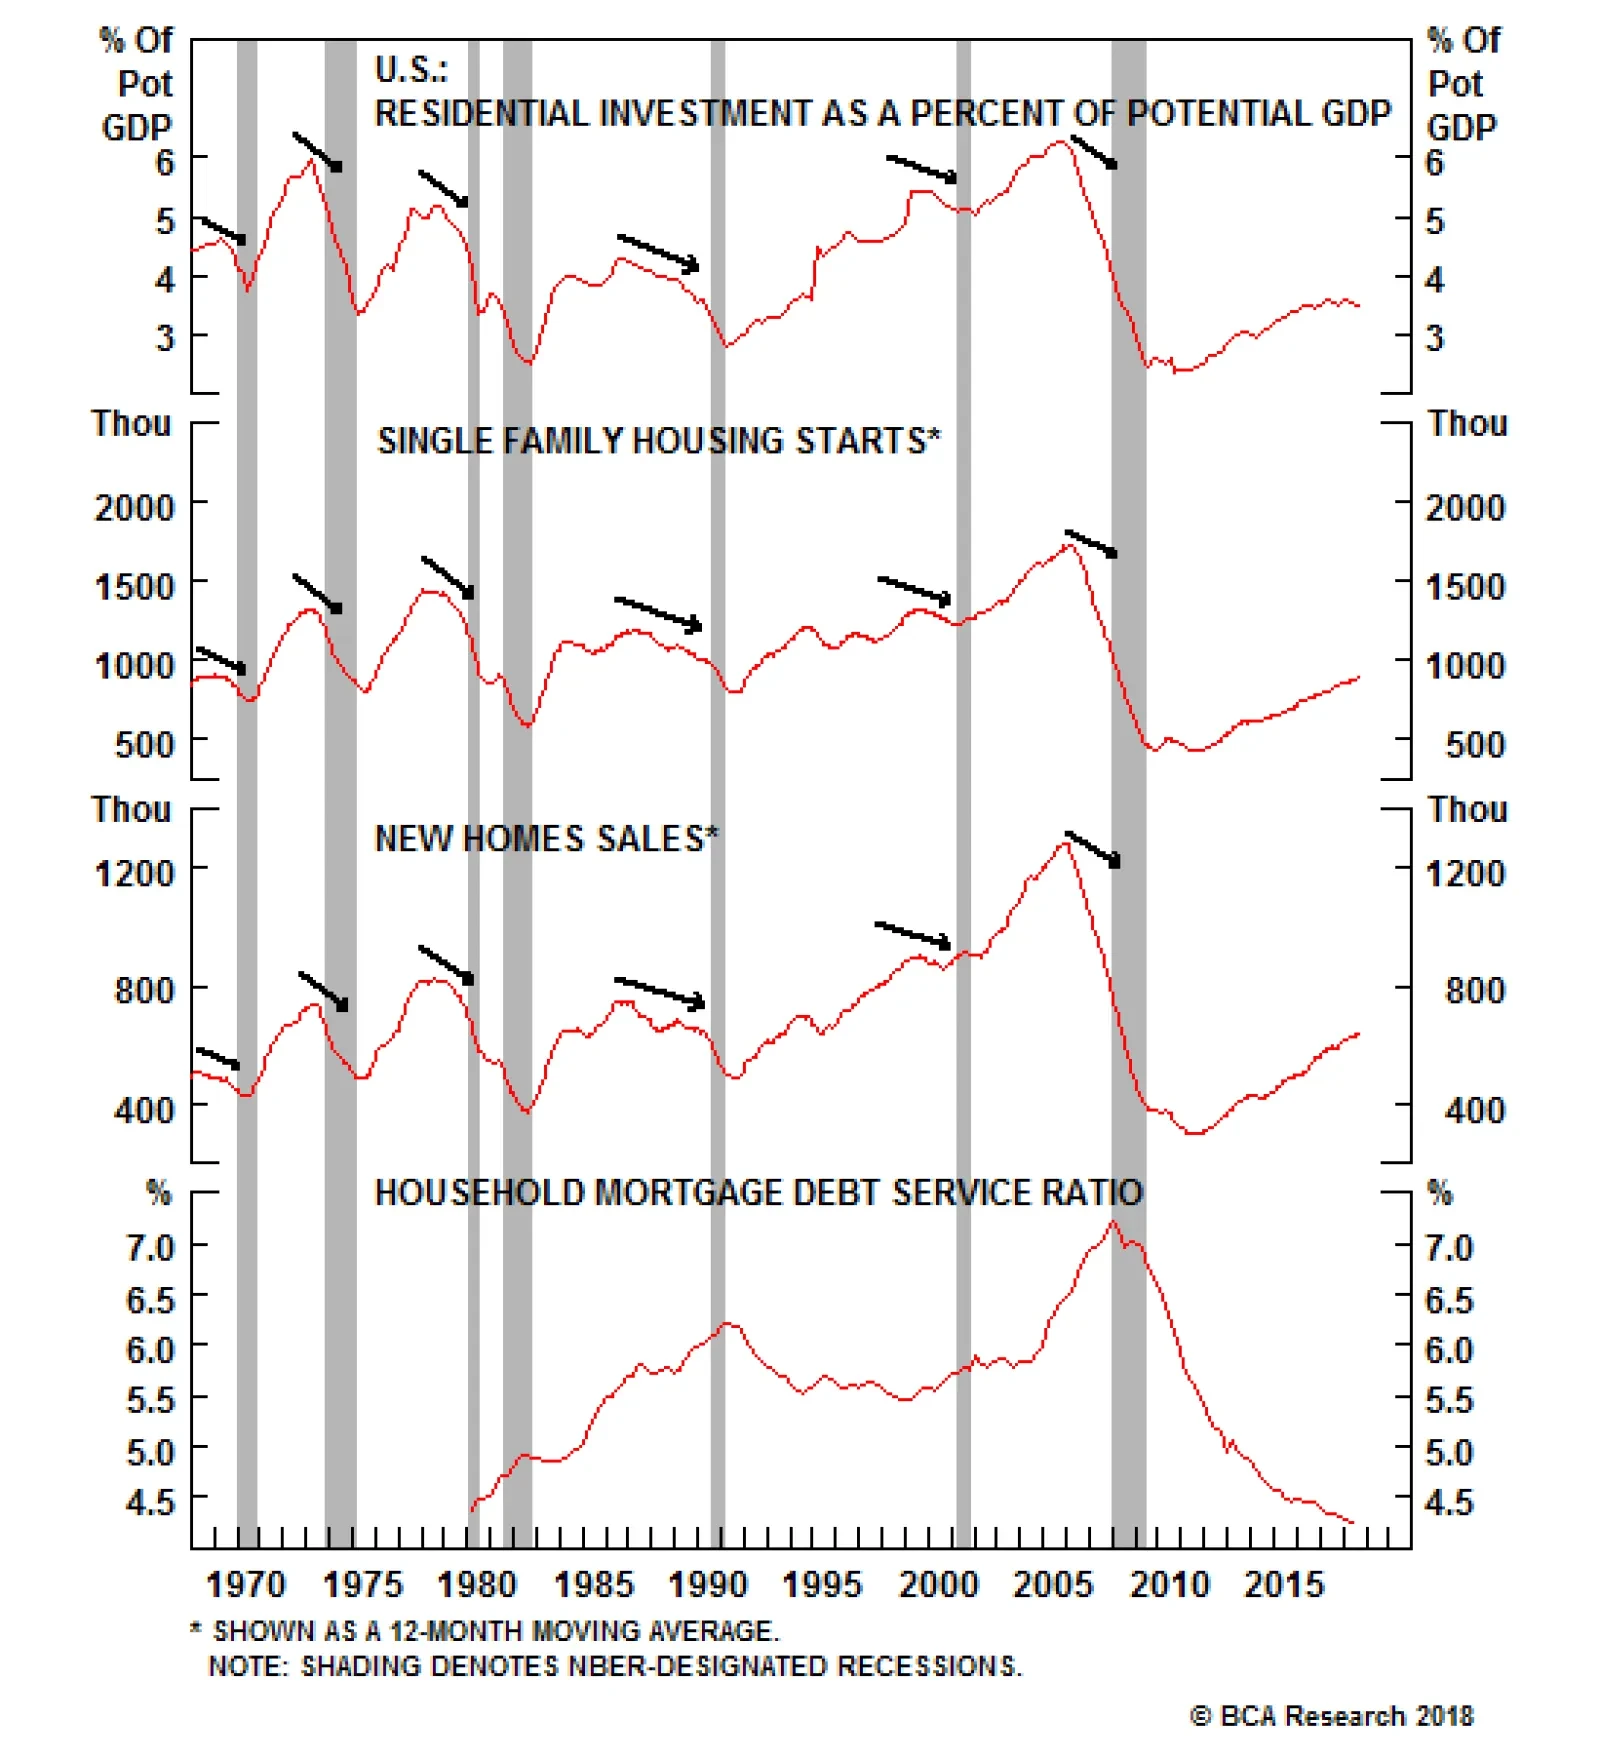
The above chart shows the three most important indicators of the housing market in our view. Residential investment as a share of potential GDP, the 12-month moving average of single family housing starts and the 12-month moving average of new home sales. At…
Overweight (High-conviction) Air freight & logistics stocks have been bouncing along the bottom for the better part of the past year and have formed a base that should serve as a launch board higher in the coming months. Energy costs comprise a large chunk of freight services input costs and the recent drubbing in oil markets will boost margins especially on the eve of the busiest season for courier delivery services (top panel). On that front, there are high odds that this holiday sales season will be another record setting one, especially given that corporations have paid out bonuses and shared part of the lowering in corporate taxes and also wage inflation is underpinning discretionary incomes. Keep in mind that the accelerating domestic manufacturing shipments-to-inventories ratio confirms that demand for hauling services is upbeat. The implication is that rising demand for freight services will buoy industry profits and lift stock prices out of their recent funk (middle panel). While the U.S./China trade tussle and the greenback are clear risks to our sanguine S&P air freight & logistics transportation subindex and have been intense headwinds for the sector, they are already reflected in depressed valuations (bottom panel). Bottom Line: We reiterate our high-conviction overweight status in the S&P air freight & logistics index; please see last week’s Weekly Report for more details. The ticker symbols for the stocks in this index are: BLBG: S5AIRF - FDX, UPS, EXPD and CHRW.
We Have Liftoff
We Have Liftoff
Mr. X and his daughter, Ms. X, are long-time BCA clients who visit our office toward the end of each year to discuss the economic and financial market outlook. This report is an edited transcript of our recent conversation. Mr. X: I have been eagerly looking forward to this meeting given the recent turbulence in financial markets. Our investments have done poorly in the past year and, with hindsight, I wish I had followed my instincts to significantly cut our equity exposure at the end of 2017, although we did follow your advice to move to a neutral stance in mid-2018. I remain greatly troubled by economic and political developments in many countries. I have long believed in open and free markets and healthy political discourse, and this all seems under challenge. As always, there is much to talk about. Ms. X: Let me add that I also am pleased to have this opportunity to talk through the key issues that will influence our investment strategy over the coming year. As I am sure you remember, I was more optimistic than my father about the outlook when we met a year ago but things have not worked out as well as I had hoped. In retrospect, I should have paid more attention to your view that markets and policy were on a collision course as that turned out to be a very accurate prediction. When I joined the family firm in early 2017, I persuaded my father that we should have a relatively high equity exposure and that was the correct stance. However, this success led us to maintain too much equity exposure in 2018, and my father has done well to resist the temptation to say “I told you so.” So, we are left with a debate similar to last year: Should we move now to an underweight in risk assets or hold off on the hope that prices will reach new highs in the coming year? I am still not convinced that we have seen the peak in risk asset prices as there is no recession on the horizon and equity valuations are much improved, following recent price declines. I will be very interested to hear your views. BCA: Our central theme for 2018 that markets and policy would collide did turn out to be appropriate and, importantly, the story has yet to fully play out. The monetary policy tightening cycle is still at a relatively early stage in the U.S. and has not even begun in many other regions. Yet, although it was a tough year for most equity markets, the conditions for a major bear market are not yet in place. One important change to our view, compared to a year ago, is that we have pushed back the timing of the next U.S. recession. This leaves a window for risk assets to show renewed strength. It remains to be seen whether prices will reach new peaks, but we believe it would be premature to shift to an underweight stance on equities. For the moment, we are sticking with our neutral weighting for risk assets, but may well recommend boosting exposure if prices suffer further near-term weakness. We will need more clarity about the timing of a recession before we consider aggressively cutting exposure. Mr. X: I can see we will have a lively discussion because I do not share your optimism. My list of concerns is long and I hope we have time to get through them all. But first, let’s briefly review your predictions from last year. BCA: That is always interesting to do, although sometimes rather humbling. A year ago, our key conclusions were that: The environment of easy money, low inflation and healthy profit growth that has been so bullish for risk assets will start to change during the coming year. Financial conditions, especially in the U.S., will gradually tighten as decent growth leads to building inflationary pressures, encouraging central banks to withdraw stimulus. With U.S. equities at an overvalued extreme and investor sentiment overly optimistic, this will set the scene for an eventual collision between policy and the markets. The conditions underpinning the bull market will erode only slowly which means that risk asset prices should continue to rise for at least the next six months. However, long-run investors should start shifting to a neutral exposure. Given our economic and policy views, there is a good chance that we will move to an underweight position in risk assets during the second half of 2018. The U.S. economy is already operating above potential and thus does not need any boost from easier fiscal policy. Any major tax cuts risk overheating the economy, encouraging the Federal Reserve to hike interest rates and boosting the probability of a recession in 2019. This is at odds with the popular view that tax cuts will be good for the equity market. A U.S. move to scrap NAFTA would add to downside risks. For the second year in a row, the IMF forecasts of economic growth for the coming year are likely to prove too pessimistic. The end of fiscal austerity has allowed the Euro Area economy to gather steam and this should be sustained in 2018. However, the slow progress in negotiating a Brexit deal with the EU poses a threat to the U.K. economy. China’s economy is saddled with excessive debt and excess capacity in a number of areas. Any other economy would have collapsed by now, but the government has enough control over banking and other sectors to prevent a crisis. Growth should hold above 6% in the next year or two, although much will depend on how aggressively President Xi pursues painful reforms. The market is too optimistic in assuming that the Fed will not raise interest rates by as much as indicated in their “dots” projections. There is a good chance that the U.S. yield curve will become flat or inverted by late 2018. Bonds are not an attractive investment at current yields. Only Greece and Portugal have real 10-year government bond yields above their historical average. Corporate bonds should outperform governments, but a tightening in financial conditions will put these at risk in the second half of 2018. The Euro Area and Japanese equity markets should outperform the U.S. over the next year reflecting their better valuations and more favorable financial conditions. Developed markets should outperform the emerging market index. Historically, the U.S. equity market has led recessions by between 3 and 12 months. If, as we fear, a U.S. recession starts in the second half of 2019, then the stock market would be at risk from the middle of 2018. The improving trend in capital spending should favor industrial stocks. Our other two overweight sectors are energy and financials. The oil price will be well supported by strong demand and output restraint by OPEC and Russia. The Brent price should average $65 a barrel over the coming year, with risks to the upside. We expect base metals prices to trade broadly sideways but will remain highly dependent on developments in China. Modest positions in gold are warranted. Relative economic and policy trends will favor a firm dollar in 2018. Unlike at the start of 2017, investors are significantly short the dollar which is bullish from a contrary perspective. Sterling is quite cheap but Brexit poses downside risks. The key market-relevant geopolitical events to monitor will be fiscal policy and mid-term elections in the U.S., and reform policies in China. With the former, the Democrats have a good chance of winning back control of the House of Representatives, creating a scenario of complete policy gridlock. A balanced portfolio is likely to generate average returns of only 3.3% a year in nominal terms over the next decade. This compares to average returns of around 10% a year between 1982 and 2017. As already noted, the broad theme that policy tightening – especially in the U.S. – would become a problem for asset markets during the year was supported by events. However, the exact timing was hard to predict. The indexes for non-U.S. developed equity markets and emerging markets peaked in late-January 2018, and have since dropped by around 18% and 24%, respectively (Chart 1). On the other hand, the U.S. market, after an early 2018 sell-off, hit a new peak in September, before falling anew in the past couple of months. The MSCI All-Country World index currently is about 6% below end-2017 levels in local-currency terms. Chart 1Our 'Collision Course' Theme For 2018 Played Out
Our 'Collision Course' Theme For 2018 Played Out
Our 'Collision Course' Theme For 2018 Played Out
We started the year recommending an overweight in developed equity markets but, as you noted, shifted that to a neutral position mid-year. A year ago, we thought we might move to an underweight stance in the second half of 2018 but decided against this because U.S. fiscal stimulus boosted corporate earnings and extended the economic cycle. Our call that emerging markets would underperform was on target. Although it was U.S. financial conditions that tightened the most, Wall Street was supported by the large cut in the corporate tax rate while the combination of higher bond yields and dollar strength was a major problem for many indebted emerging markets. Overall, it was not a good year for financial markets (Table 1). Table 1Market Performance
OUTLOOK 2019: Late-Cycle Turbulence
OUTLOOK 2019: Late-Cycle Turbulence
As far as the overall macro environment was concerned, we were correct in predicting that the IMF was too pessimistic on economic growth. A year ago, the IMF forecast that the advanced economies would expand by 2% in 2018 and that has since been revised up to 2.4% (Table 2). This offset a slight downgrading to the performance of emerging economies. The U.S., Europe and Japan all grew faster than previously expected. Not surprisingly, inflation also was higher than forecast, although in the G7, it has remained close to the 2% level targeted by most central banks. Table 2IMF Economic Forecasts
OUTLOOK 2019: Late-Cycle Turbulence
OUTLOOK 2019: Late-Cycle Turbulence
Despite widespread fears to the contrary, the data have supported our view that Chinese growth would hold above a 6% pace in 2018. Nevertheless, a slowdown currently is underway and downside risks remain very much in place in terms of excessive credit and trade pressures. Another difficult year lies ahead for the Chinese authorities and we will no doubt return to this topic later. As far as our other key forecasts are concerned, we were correct in our views that oil prices and the U.S. dollar would rise and that the market would be forced to revise up its predictions of Fed rate hikes. Of course, oil has recently given back its earlier gains, but we assume that is a temporary setback. On the sector front, our macro views led us to favor industrials, financials and energy, but that did not work out well as concerns about trade took a toll on cyclical sectors. Overall, there were no major macro surprises in 2018, and it seems clear that we have yet to resolve the key questions and issues that we discussed a year ago. At that time, we were concerned about the development of late-cycle pressures that ultimately would undermine asset prices. That story has yet to fully play out. It is hard to put precise timing on when the U.S. economy will peak and, thus, when asset prices will be at maximum risk. Nevertheless, our base case is that there likely will be a renewed and probably final run-up in asset prices before the next recession. Late-Cycle Challenges Mr. X: This seems like déjà-vu all over again. Since we last met, the cycle is one year older and, as you just said, the underlying challenges facing economies and markets have not really changed. If anything, things are even worse: Global debt levels are higher, inflation pressures more evident, Fed policy is moving closer to restrictive territory and protectionist policies have ratcheted up. If it was right to be cautious six months ago, then surely we should be even more cautious now. Ms. X: Oh dear, it does seem like a repeat of last year’s discussion because, once again, I am more optimistic than my father. Obviously, there are structural problems in a number of countries and, at some point, the global economy will suffer another recession. But timing is everything, and I attach very low odds to a downturn in the coming year. Meanwhile, I see many pockets of value in the equity market. Rather than cut equity positions, I am inclined to look for buying opportunities. BCA: We sympathize with your different perspectives because the outlook is complex and we also have lively debates about the view. The global equity index currently is a little below where it was when we met last year, but there has been tremendous intra-period volatility. That pattern seems likely to be repeated in 2019. In other words, it will be important to be flexible about your investment strategy. You both make good points. It is true that there are several worrying problems regarding the economic outlook, including excessive debt, protectionism and building inflation risks. At the same time, the classic conditions for an equity bear market are not yet in place, and may not be for some time. This leaves us in the rather uncomfortable position of sitting on the fence with regard to risk asset exposure. We are very open to raising exposure should markets weaken further in the months ahead, but also are keeping careful watch for signs that the economic cycle is close to peaking. In other words, it would be a mistake to lock in a 12-month strategy right now. Mr. X: I would like to challenge the consensus view, shared by my daughter, that the next recession will not occur before 2020, and might even be much later. The main rationale seems to be that the policy environment remains accommodative and there are none of the usual imbalances that occur ahead of recessions. Of course, U.S. fiscal policy has given a big boost to growth in the past year, but I assume the effects will wear off sharply in 2019. More importantly, there is huge uncertainty about the level of interest rates that will trigger economic problems. It certainly has not taken much in the way of Fed rate hikes to rattle financial markets. Thus, monetary policy may become restrictive much sooner than generally believed. I also strongly dispute the idea that there are no major financial imbalances. If running U.S. federal deficits of $1 trillion in the midst of an economic boom is not an imbalance, then I don’t know what is! At the same time, the U.S. corporate sector has issued large amounts of low-quality debt, and high-risk products such as junk-bond collateralized debt obligations have made an unwelcome reappearance. It seems that the memories of 2007-09 have faded. It is totally normal for long periods of extremely easy money to be accompanied by growing leverage and increasingly speculative financial activities, and I don’t see why this period should be any different. And often, the objects of speculation are not discovered until financial conditions become restrictive. Finally, there are huge risks associated with rising protectionism, the Chinese economy appears to be struggling, Italy’s banks are a mess, and the Brexit fiasco poses a threat to the U.K. economy. Starting with the U.S., please go ahead and convince me why a recession is more than a year away. BCA: It is natural for you to worry that a recession is right around the corner. The current U.S. economic expansion will become the longest on record if it makes it to July 2019, at which point it will surpass the 1990s expansion. Economists have a long and sad history of failing to forecast recessions. Therefore, a great deal of humility is warranted when it comes to predicting the evolution of the business cycle. The Great Recession was one of the deepest downturns on record and the recovery has been fairly sluggish by historic standards. Thus, it has taken much longer than usual for the U.S. economy to return to full employment. Looking out, there are many possible risks that could trip up the U.S. economy but, for the moment, we see no signs of recession on the horizon (Chart 2). For example, the leading economic indicator is still in an uptrend, the yield curve has not inverted and our monetary indicators are not contracting. Our proprietary recession indicator also suggests that the risk is currently low, although recent stock market weakness implies some deterioration. Chart 2Few U.S Recession 'Red Flags'
Few U.S Recession 'Red Flags'
Few U.S Recession 'Red Flags'
The buildup in corporate debt is a cause for concern and we are not buyers of corporate bonds at current yields. However, the impact of rising yields on the economy is likely to be manageable. The interest coverage ratio for the economy as a whole – defined as the profits corporations generate for every dollar of interest paid – is still above its historic average (Chart 3). Corporate bonds are also generally held by non-leveraged investors such as pension funds, insurance companies, and ETFs. The impact of defaults on the economy tends to be more severe when leveraged institutions are the ones that suffer the greatest losses. Chart 3Interest Costs Not Yet A Headwind
Interest Costs Not Yet A Headwind
Interest Costs Not Yet A Headwind
We share your worries about the long-term fiscal outlook. However, large budget deficits do not currently imperil the economy. The U.S. private sector is running a financial surplus, meaning that it earns more than it spends (Chart 4). Not only does this make the economy more resilient, it also provides the government with additional savings with which to finance its budget deficit. If anything, the highly accommodative stance of fiscal policy has pushed up the neutral rate of interest, giving the Fed greater scope to raise rates before monetary policy enters restrictive territory. The impetus of fiscal policy on the economy will be smaller in 2019 than it was in 2018, but it will still be positive (Chart 5). Chart 4The U.S. Private Sector Is Helping To Finance The Fiscal Deficit
The U.S. Private Sector Is Helping To Finance The Fiscal Deficit
The U.S. Private Sector Is Helping To Finance The Fiscal Deficit
Chart 5U.S. Fiscal Policy Still Stimulative In 2019
U.S. Fiscal Policy Still Stimulative In 2019
U.S. Fiscal Policy Still Stimulative In 2019
The risks to growth are more daunting outside the U.S. As you point out, Italy is struggling to contain borrowing costs, a dark cloud hangs over the Brexit negotiations, and China and most other emerging markets have seen growth slow meaningfully. The U.S., however, is a relatively closed economy – it is not as dependent on trade as most other countries. Its financial system is reasonably resilient thanks to the capital its banks have raised over the past decade. In addition, Dodd-Frank and other legislation have made it more difficult for financial institutions to engage in reckless risk-taking. Mr. X: I would never take a benign view of the ability and willingness of financial institutions to engage in reckless behavior, but maybe I am too cynical. Even if you are right that debt does not pose an immediate threat to the market, surely it will become a huge problem in the next downturn. If the U.S. federal deficit is $1 trillion when the economy is strong, it is bound to reach unimaginable levels in a recession. And, to make matters worse, the Federal Reserve may not have much scope to lower interest rates if they peak at a historically low level in the next year or so. What options will policymakers have to respond to the next cyclical downturn? Is there a limit to how much quantitative easing central banks can do? BCA: The Fed is aware of the challenges it faces if the next recession begins when interest rates are still quite low. Raising rates rapidly in order to have more “ammunition” for counteracting the downturn would hardly be the best course of action as this would only bring forward the onset of the recession. A better strategy is to let the economy overheat a bit so that inflation rises. This would allow the Fed to push real rates further into negative territory if the recession turns out to be severe. There is no real limit on how much quantitative easing the Fed can undertake. The FOMC will undoubtedly turn to asset purchases and forward guidance again during the next economic downturn. Now that the Fed has crossed the Rubicon into unorthodox monetary policy without generating high inflation, policymakers are likely to try even more exotic policies, such as price-level targeting. The private sector tends to try to save more during recessions. Thus, even though the fiscal deficit would widen during the next downturn, there should be plenty of buyers for government debt. However, once the next recovery begins, the Fed may feel increasing political pressure to keep rates low in order to allow the government to maintain its desired level of spending and taxes. The Fed guards its independence fiercely, but in a world of increasingly political populism, that independence may begin to erode. This will not happen quickly, but to the extent that it does occur, higher inflation is likely to be the outcome. Ms. X: I would like to explore the U.S.-China dynamic a bit more because I see that as one of the main challenges to my more optimistic view. I worry that President Trump will continue to take a hard line on China trade because it plays well with his base and has broad support in Congress. And I equally worry that President Xi will not want to be seen giving in to U.S. bullying. How do you see this playing out? BCA: Investors hoping that U.S. President Donald Trump and his Chinese counterpart Xi Jinping will reach a deal to end the trade war on the sidelines of the forthcoming G20 leaders' summit in Buenos Aires are likely to be disappointed. President Trump's fiscal policy is completely inconsistent with his trade agenda. Fiscal stimulus in a full-employment economy will suck in imports. It also forces the Fed to raise rates more aggressively than it otherwise would, leading to a stronger dollar. The result will be a larger U.S. trade deficit. Trump will not be able to blame Canada or Mexico for a deteriorating trade position because he just signed a trade agreement with them. The new USMCA agreement is remarkably similar to NAFTA, with the notable exception that it contains a clause barring Canada and Mexico from negotiating bilateral trade deals with China. This means Trump needs a patsy who will take the blame for America's burgeoning trade deficit and China will fill that role. For his part, President Xi knows full well that he will still be China’s leader when Trump is long gone. Giving in to Trump’s demands would hurt him politically. All this means that the trade war will persist. Mr. X: I see a trade war as a major threat to the economy, but it is not the only thing that could derail the economic expansion. Let’s explore that issue in more detail. The Economic Outlook Mr. X: You have shown in previous research that housing is often a very good leading indicator of the U.S. economy, largely because it is very sensitive to changes in the monetary environment. Are you not concerned about the marked deterioration in recent U.S. housing data? BCA: Recent trends in housing have indeed been disappointing, with residential investment acting as a drag on growth for three consecutive quarters. The weakness has been broad-based with sales, the rate of price appreciation of home prices, and builder confidence all declining (Chart 6). Even though the level of housing affordability is decent by historical standards, there has been a fall in the percentage of those who believe that it is a good time to buy a home. Chart 6Recent Softness In U.S. Housing
Recent Softness In U.S. Housing
Recent Softness In U.S. Housing
There are a few possible explanations for the weakness. First, the 2007-09 housing implosion likely had a profound and lasting impact on the perceived attractiveness of home ownership. The homeownership rate for people under 45 has remained extremely low by historical standards. Secondly, increased oversight and tighter regulations have curbed mortgage supply. Finally, the interest rate sensitivity of the sector may have increased with the result that even modest increases in the mortgage rate have outsized effects. That, in turn, could be partly explained by recent tax changes that capped the deduction on state and local property taxes, while lowering the limit on the tax deductibility of mortgage interest. The trend in housing is definitely a concern, but the odds of a further major contraction seem low. Unlike in 2006, the home vacancy rate stands near record levels and the same is true for the inventory of homes. The pace of housebuilding is below the level implied by demographic trends and consumer fundamentals are reasonably healthy. The key to the U.S. economy lies with business investment and consumer spending and these areas are well supported for the moment. Consumers are benefiting from continued strong growth in employment and a long overdue pickup in wages. Meanwhile, the ratio of net worth-to-income has surpased the previous peak and the ratio of debt servicing-to-income is low (Chart 7). Last year, we expressed some concern that the depressed saving rate might dampen spending, but the rate has since been revised substantially higher. Based on its historical relationship with U.S. household net worth, there is room for the saving rate to fall, fueling more spending. Real consumer spending has grown by 3% over the past year and there is a good chance of maintaining that pace during most of 2019. Chart 7U.S. Consumer Fundamentals Are Healthy
U.S. Consumer Fundamentals Are Healthy
U.S. Consumer Fundamentals Are Healthy
Turning to capital spending, the cut in corporate taxes was obviously good for cash flow, and surveys show a high level of business confidence. Moreover, many years of business caution toward spending has pushed up the average age of the nonresidential capital stock to the highest level since 1963 (Chart 8). Higher wages should also incentivize firms to invest in more machinery. Absent some new shock to confidence, business investment should stay firm during the next year. Chart 8An Aging Capital Stock
An Aging Capital Stock
An Aging Capital Stock
Overall, we expect the pace of U.S. economic growth to slow from its recent strong level, but it should hold above trend, currently estimated to be around 2%. As discussed earlier, that means capacity pressures will intensify, causing inflation to move higher. Ms. X: I share the view that the U.S. economy will continue to grow at a healthy pace, but I am less sure about the rest of the world. BCA: You are right to be concerned. We expected U.S. and global growth to diverge in 2018, but not by as much as occurred. Several factors have weighed on CEO confidence outside of the U.S., including trade wars, a strong dollar, higher oil prices, emerging market turbulence, the return of Italian debt woes, and a slowdown in the Chinese economy. The stress has shown up in the global manufacturing PMI, although the latter is still at a reasonably high level (Chart 9). Global export growth is moderating and the weakness appears to be concentrated in capex. Capital goods imports for the major economies, business investment, and the production of investment-related goods have all decelerated this year. Chart 9Global Manufacturing Slowdown
Global Manufacturing Slowdown
Global Manufacturing Slowdown
Our favorite global leading indicators are also flashing yellow (Chart 10). BCA’s global leading economic indicator has broken below the boom/bust line and its diffusion index suggests further downside. The global ZEW composite and the BCA boom/bust indicator are both holding below zero. Chart 10Global Growth Leading Indicators
Global Growth Leading Indicators
Global Growth Leading Indicators
Current trends in the leading indicators shown in Chart 11 imply that the growth divergence between the U.S. and the rest of the world will remain a key theme well into 2019. Among the advanced economies, Europe and Japan are quite vulnerable to the global soft patch in trade and capital spending. Chart 11Global Economic Divergence Will Continue
Global Economic Divergence Will Continue
Global Economic Divergence Will Continue
The loss of momentum in the Euro Area economy, while expected, has been quite pronounced. Part of this is due to the dissipation of the 2016/17 economic boost related to improved health in parts of the European banking system that sparked a temporary surge in credit growth. The tightening in Italian financial conditions following the government’s budget standoff with the EU has weighed on overall Euro Area growth. Softer Chinese demand for European exports, uncertainties related to U.S. trade policy and the torturous Brexit negotiations, have not helped the situation. Real GDP growth decelerated to close to a trend pace by the third quarter of 2018. The manufacturing PMI has fallen from a peak of 60.6 in December 2017 to 51.5, mirroring a 1% decline in the OECD’s leading economic indicator for the region. Not all the economic news has been bleak. Both consumer and industrial confidence remain at elevated levels according to the European Commission (EC) surveys, consistent with a resumption of above-trend growth. Even though exports have weakened substantially from the booming pace in 2017, the EC survey on firms’ export order books remains at robust levels (Chart 12). Importantly for the Euro Area, the bank credit impulse has moved higher.The German economy should also benefit from a rebound in vehicle production which plunged earlier this year following the introduction of new emission standards. Chart 12Europe: Slowing, But No Disaster
Europe: Slowing, But No Disaster
Europe: Slowing, But No Disaster
We interpret the 2018 Euro Area slowdown as a reversion-to-the-mean rather than the start of an extended period of sub-trend growth. Real GDP growth should fluctuate slightly above trend pace through 2019. Given that the Euro Area’s output gap is almost closed, the ECB will not deviate from its plan to end its asset purchase program by year end. Gradual rate hikes should begin late in 2019, assuming that inflation is closer to target by then. In contrast, the Bank of Japan (BoJ) is unlikely to change policy anytime soon. The good news is that wages have finally begun to grow at about a 2% pace, although it required extreme labor shortages. Yet, core inflation is barely positive and long-term inflation expectations are a long way from the 2% target. The inflation situation will have to improve significantly before the BoJ can consider adjusting or removing the Yield Curve Control policy. This is especially the case since the economy has hit a bit of an air pocket and the government intends to raise the VAT in 2019. Japan’s industrial production has stalled and we expect the export picture to get worse before it gets better. We do not anticipate any significant economic slack to develop, but even a sustained growth slowdown could partially reverse the gains that have been made on the inflation front. Ms. X: We can’t talk about the global economy without discussing China. You have noted in the past how the authorities are walking a tightrope between trying to unwind the credit bubble and restructure the economy on the one hand, and prevent a destabilizing economic and financial crisis on the other. Thus far, they have not fallen off the tightrope, but there has been limited progress in resolving the country’s imbalances. And now the authorities appear to be stimulating growth again, risking an even bigger buildup of credit. Can it all hold together for another year? BCA: That’s a very good question. Thus far, there is not much evidence that stimulus efforts are working. Credit growth is still weak and leading economic indicators have not turned around (Chart 13). There is thus a case for more aggressive reflation, but the authorities also remain keen to wean the economy off its addiction to debt. Chart 13China: No Sign Of Reacceleration
China: Credit Impulse Remains Weak
China: Credit Impulse Remains Weak
Waves of stimulus have caused total debt to soar from 140% of GDP in 2008 to about 260% of GDP at present (Chart 14). As is usually the case, rapid increases in leverage have been associated with a misallocation of capital. Since most of the new credit has been used to finance fixed-asset investment, the result has been overcapacity in a number of areas. For example, the fact that 15%-to-20% of apartments are sitting vacant is a reflection of overbuilding. Meanwhile, the rate of return on assets in the state-owned corporate sector has fallen below borrowing costs. Chart 14China: Debt Still Rising
China: Debt Still Rising
China: Debt Still Rising
Chinese exports are holding up well so far, but this might only represent front-running ahead of the implementation of higher tariffs. Judging from the steep drop in the export component of both the official and private-sector Chinese manufacturing PMI, exports are likely to come under increasing pressure over the next few quarters as the headwinds from higher tariffs fully manifest themselves (Chart 15). Chart 15Chinese Exports About To Suffer
Chinese Exports About To Suffer
Chinese Exports About To Suffer
The most likely outcome is that the authorities will adjust the policy dials just enough to stabilize growth sometime in the first half of 2019. The bottoming in China’s broad money impulse offers a ray of hope (Chart 16). Still, it is a tentative signal at best and it will take some time before this recent easing in monetary policy shows up in our credit impulse measure and, later, economic growth. A modest firming in Chinese growth in the second half of 2019 would provide a somewhat stronger demand backdrop for commodities and emerging economies that sell goods to China. Chart 16A Ray Of Hope From Broad Money
bca.bca_mp_2018_12_01_c16
bca.bca_mp_2018_12_01_c16
Ms. X: If you are correct about a stabilization in the Chinese economy next year, this presumably would be good news for emerging economies, especially if the Fed goes on hold. EM assets have been terribly beaten down and I am looking for an opportunity to buy. BCA: Fed rate hikes might have been the catalyst for the past year’s pain in EM assets, but it is not the underlying problem. As we highlighted at last year’s meeting, the troubles for emerging markets run much deeper. Our long-held caution on emerging economies and markets is rooted in concern about deteriorating fundamentals. Excessive debt is a ticking time bomb for many of these countries; EM dollar-denominated debt is now as high as it was in the late 1990s as a share of both GDP and exports (Chart 17). Moreover, the declining long-term growth potential for emerging economies as a group makes it more difficult for them to service the debt. The structural downtrend in EM labor force and productivity growth underscores that trend GDP growth has collapsed over the past three decades (Chart 17, bottom panel). Chart 17EM Debt A Problem Given Slowing Supply-Side...
EM Debt A Problem Given Slowing Supply-Side...
EM Debt A Problem Given Slowing Supply-Side...
Decelerating global growth has exposed these poor fundamentals. EM sovereign spreads have moved wider in conjunction with falling PMIs and slowing industrial production and export growth. And it certainly does not help that the Fed is tightening dollar-based liquidity conditions. EM equities usually fall when U.S. financial conditions tighten (Chart 18). Chart 18...And Tightening Financial Conditions
...And Tightening Financial Conditions
...And Tightening Financial Conditions
Chart 19 highlights the most vulnerable economies in terms of foreign currency funding requirements, and foreign debt-servicing obligations relative to total exports. Turkey stands out as the most vulnerable, along with Argentina, Brazil, Indonesia, Chile, and Colombia. In contrast, Emerging Asia appears to be in better shape relative to the crisis period of the late 1990s. Chart 19Spot The Outliers
OUTLOOK 2019: Late-Cycle Turbulence
OUTLOOK 2019: Late-Cycle Turbulence
The backdrop for EM assets is likely to get worse in the near term, given our view that the Fed will continue to tighten and China will be cautious about stimulating more aggressively. Our base case outlook sees some relief in the second half of 2019, but it is more of a “muddle-through” scenario than a V-shaped economic recovery. Mr. X: Perhaps EM assets could enjoy a bounce next year if the Chinese economy stabilizes, but the poor macro fundamentals you mentioned suggest that it would be a trade rather than a buy-and-hold proposition. I am inclined to avoid the whole asset class in 2019. Bond Market Prospects Ms. X: Let’s turn to fixed income now. I was bearish on bonds in 2018, but yields have risen quite a bit, at least in the United States. The Fed has lifted the fed funds rate by 100 basis points over the past year and I don’t see a lot of upside for inflation. So perhaps yields have peaked and will move sideways in 2019, which would be good for stocks in my view. BCA: Higher yields have indeed improved bond value recently. Nonetheless, they are not cheap enough to buy at this point (Chart 20). The real 10-year Treasury yield, at close to 1%, is still depressed by pre-Lehman standards. Long-term real yields in Germany and Japan remain in negative territory at close to the lowest levels ever recorded. Chart 20Real Yields Still Very Depressed
Real Yields Still Very Depressed
Real Yields Still Very Depressed
We called the bottom in global nominal bond yields in 2016. Our research at the time showed that the cyclical and structural factors that had depressed yields were at an inflection point, and were shifting in a less bond-bullish direction. Perhaps most important among the structural factors, population aging and a downward trend in underlying productivity growth resulted in lower equilibrium bond yields over the past couple of decades. Looking ahead, productivity growth could stage a mild rebound in line with the upturn in the growth rate of the capital stock (Chart 21). As for demographics, the age structure of the world population is transitioning from a period in which aging added to the global pool of savings to one in which aging is beginning to drain that pool as people retire and begin to consume their nest eggs (Chart 22). The household saving rates in the major advanced economies should trend lower in the coming years, placing upward pressure on equilibrium global bond yields. Chart 21Productivity Still Has Some Upside
Productivity Still Has Some Upside
Productivity Still Has Some Upside
Chart 22Demographics Past The Inflection Point
Demographics Past The Inflection Point
Demographics Past The Inflection Point
Cyclical factors are also turning against bonds. U.S. inflation has returned to target and the Fed is normalizing short-term interest rates. The market currently is priced for only one more rate hike after December 2018 in this cycle, but we see rates rising more than that. Treasury yields will follow as market expectations adjust. Long-term inflation expectations are still too low in the U.S. and most of the other major economies to be consistent with central banks’ meeting their inflation targets over the medium term. As actual inflation edges higher, long-term expectations built into bond yields will move up. The term premium portion of long-term bond yields is also too low. This is the premium that investors demand to hold longer-term bonds. Our estimates suggest that the term premium is still negative in the advanced economies outside of the U.S., which is not sustainable over the medium term (Chart 23). Chart 23Term Premia Are Too Low
Term Premia Are Too Low
Term Premia Are Too Low
We expect term premia to rise for two main reasons. First, investors have viewed government bonds as a good hedge for their equity holdings because bond prices have tended to rise when stock prices fell. Investors have been willing to pay a premium to hold long-term bonds to benefit from this hedging effect. But the correlation is now beginning to change as inflation and inflation expectations gradually adjust higher and output gaps close. As the hedging benefit wanes, the term premium should rise back into positive territory. Second, central bank bond purchases and forward guidance have depressed yields as well as interest-rate volatility. The latter helped to depress term premia in the bond market. This effect, too, is beginning to unwind. The Fed is letting its balance sheet shrink by about $50 billion per month. The Bank of England has kept its holdings of gilts and corporate bonds constant for over a year, while the ECB is about to end asset purchases. The Bank of Japan continues to buy assets, but at a much reduced pace. All this means that the private sector is being forced to absorb a net increase in government bonds for the first time since 2014 (Chart 24). Chart 25 shows that bond yields in the major countries will continue to trend higher as the rapid expansion of central bank balance sheets becomes a thing of the past. Chart 24Private Sector To Absorb More Bonds
OUTLOOK 2019: Late-Cycle Turbulence
OUTLOOK 2019: Late-Cycle Turbulence
Chart 25QE Unwind Will Weigh On Bond Prices
QE Unwind Will Weigh On Bond Prices
QE Unwind Will Weigh On Bond Prices
Ms. X: I’m not a fan of bonds at these levels, but that sounds overly bearish to me, especially given the recent plunge in oil prices. BCA: Lower oil prices will indeed help to hold down core inflation to the extent that energy prices leak into non-energy prices in the near term. Nonetheless, in the U.S., this effect will be overwhelmed by an overheated economy. From a long-term perspective, we believe that investors still have an overly benign view of the outlook for yields. The market expects that the 10-year Treasury yield in ten years will only be slightly above today’s spot yield, which itself is still very depressed by historical standards (Chart 26). And that also is the case in the other major bond markets. Chart 26Forward Yields Are Too Low
Forward Yields Are Too Low
Forward Yields Are Too Low
Of course, it will not be a straight line up for yields – there will be plenty of volatility. We expect the 10-year Treasury yield to peak sometime in 2019 or early 2020 in the 3.5%-to-4% range, before the next recession sends yields temporarily lower. Duration should be kept short at least until the middle of 2019, with an emphasis on TIPS relative to conventional Treasury bonds. We will likely downgrade TIPS versus conventionals once long-term inflation expectations move into our target range, which should occur sometime during 2019. The ECB and Japan will not be in a position to raise interest rates for some time, but the bear phase in U.S. Treasurys will drag up European and Japanese bond yields (at the very long end of the curve for the latter). Total returns are likely to be negative in all of the major bond markets in 2019. Real 10-year yields in all of the advanced economies are still well below their long-term average, except for Greece, Italy and Portugal (Chart 27). Chart 27Valuation Ranking Of Developed Bond Markets
OUTLOOK 2019: Late-Cycle Turbulence
OUTLOOK 2019: Late-Cycle Turbulence
Within global bond portfolios, we recommend being underweight bond markets where central banks are in a position to raise short-term interest rates (the U.S. and Canada), and overweight those that are not (Japan and Australia). The first ECB rate hike is unlikely before the end of 2019. However, the imminent end of the asset purchase program argues for no more than a benchmark allocation to core European bond markets within global fixed-income portfolios, especially since real 10-year yields in parts of continental Europe are the furthest below their long-term average. We are overweight gilts at the moment, but foresee shifting to underweight in 2019, depending on how Brexit plays out. Ms. X: What about corporate bonds? I know that total returns for corporates will be poor if government bond yields are rising. But you recommended overweighting corporate bonds relative to Treasurys last year. Given your view that the next U.S. recession is more than a year away, it seems reasonable to assume they will outperform government bonds. BCA: We were overweight corporates in the first half of 2018, but took profits in June and shifted to neutral at the same time that we downgraded our equity allocation. Spreads had tightened to levels that did not compensate investors for the risks. Recent spread widening has returned some value to U.S. corporates. The 12-month breakeven spreads for A-rated and Baa-rated corporate bonds are almost back up to their 50th percentile relative to history (Chart 28). Still, these levels are not attractive enough to justify buying based on valuation alone. As for high-yield, any rise in the default rate would quickly overwhelm the yield pickup in this space. Chart 28Corporate Bond Yields Still Have Upside
Corporate Bond Yields Still Have Upside
Corporate Bond Yields Still Have Upside
It is possible that some of the spread widening observed in October and November will reverse, but corporates offer a poor risk/reward tradeoff, even if the default rate stays low. Corporate profit growth is bound to decelerate in 2019. This would not be a disaster for equities, but slowing profit growth is more dangerous for corporate bond excess returns because the starting point for leverage is already elevated. As discussed above, at a macro level, the aggregate interest coverage ratio for the U.S. corporate sector is decent by historical standards. However, this includes mega-cap companies that have little debt and a lot of cash. Our bottom-up research suggests that interest coverage ratios for firms in the Bloomberg Barclays corporate bond index will likely drop close to multi-decade lows during the next recession, sparking a wave of downgrade activity and fallen angels. Seeing this coming, investors may require more yield padding to compensate for these risks as profit growth slows. Our next move will likely be to downgrade corporate bonds to underweight. We are watching the yield curve, bank lending standards, profit growth, and monetary indicators for signs to further trim exposure. You should already be moving up in quality within your corporate bond allocation. Mr. X: We have already shifted to underweight corporate bonds in our fixed income portfolio. Even considering the cheapening that has occurred over the past couple of months, spread levels still make no sense in terms of providing compensation for credit risk. Equity Market Outlook Ms. X: While we all seem to agree that corporate bonds are not very attractive, I believe that enough value has been restored to equities that we should upgrade our allocation, especially if the next recession is two years away. And I know that stocks sometimes have a powerful blow-off phase before the end of a bull market. Mr. X: This is where I vehemently disagree with my daughter. The recent sell-off resembles a bloodbath in parts of the global market. It has confirmed my worst fears, especially related to the high-flying tech stocks that I believe were in a bubble. Hopes for a blow-off phase are wishful thinking. I’m wondering if the sell-off represents the beginning of an extended bear market. BCA: Some value has indeed been restored. However, the U.S. market is far from cheap relative to corporate fundamentals. The trailing and 12-month forward price-earnings ratios (PER) of 20 and 16, respectively, are still far above their historical averages, especially if one leaves out the tech bubble period of the late 1990s. And the same is true for other metrics such as price-to-sales and price-to-book value (Chart 29). BCA’s composite valuation indicator, based on 8 different valuation measures, is only a little below the threshold of overvaluation at +1 standard deviation because low interest rates still favor equities on a relative yield basis. Chart 29U.S. Equities Are Not Cheap
U.S. Equities Are Not Cheap
U.S. Equities Are Not Cheap
It is true that equities can reward investors handsomely in the final stage of a bull market. Chart 30 presents cumulative returns to the S&P 500 in the last nine bull markets. The returns are broken down by quintile. The greatest returns, unsurprisingly, generally occur in the first part of the bull market (quintile 1). But total returns in the last 20% of the bull phase (quintile 5) have been solid and have beaten the middle quartiles. Chart 30Late-Cycle Blow-Offs Can Be Rewarding
OUTLOOK 2019: Late-Cycle Turbulence
OUTLOOK 2019: Late-Cycle Turbulence
Of course, the tricky part is determining where we are in the bull market. We have long viewed financial markets through the lens of money and credit. This includes a framework that involves the Fed policy cycle. The historical track record for risk assets is very clear; they tend to perform well when the fed funds rate is below neutral, whether rates are rising or falling. Risk assets tend to underperform cash when the fed funds rate is above neutral (Table 3). Table 3Stocks Do Well When The Fed Funds Rate Is Below Neutral
OUTLOOK 2019: Late-Cycle Turbulence
OUTLOOK 2019: Late-Cycle Turbulence
We believe the fed funds rate is still in easy territory. This suggests that it is too early to shift to underweight on risk assets. We may even want to upgrade to overweight if stocks become cheap enough, as long as Fed policy is not restrictive. That said, there is huge uncertainty about the exact level of rates that constitutes “neutral” (or R-star in the Fed’s lingo). Even the Fed is unsure. This means that we must watch for signs that the fed funds rate has crossed the line into restrictive territory as the FOMC tightens over the coming year. An inversion of the 3-month T-bill/10-year yield curve slope would be a powerful signal that policy has become tight, although the lead time of an inverted curve and declining risk asset prices has been quite variable historically. Finally, it is also important to watch U.S. profit margins. Some of our research over the past couple of years focused on the late-cycle dynamics of previous long expansions, such as the 1960s, 1980s and 1990s. We found that risk assets came under pressure once U.S. profit margins peaked. Returns were often negative from the peak in margins to the subsequent recession. Mr. X: U.S. profit margins must be close to peak levels. I’ve seen all sorts of anecdotal examples of rising cost pressures, not only in the labor market. BCA: We expected to see some margin pressure to appear by now. S&P 500 EPS growth will likely top out in the next couple of quarters, if only because the third quarter’s 26% year-over-year pace is simply not sustainable. But it is impressive that our margin proxies are not yet flagging an imminent margin squeeze, despite the pickup in wage growth (Chart 31). Chart 31U.S. Margin Indicators Still Upbeat
U.S. Margin Indicators Still Upbeat
U.S. Margin Indicators Still Upbeat
Margins according to the National Accounts (NIPA) data peaked in 2014 and have since diverged sharply with S&P 500 operating margins. It is difficult to fully explain the divergence. The NIPA margin is considered to be a better measure of underlying U.S. corporate profitability because it includes all companies (not just 500), and it is less subject to accounting trickery. That said, even the NIPA measure of margins firmed a little in 2018, along with the proxies we follow that correlate with the S&P 500 measure. The bottom line is that the macro variables that feed into our top-down U.S. EPS model point to a continuing high level of margins and fairly robust top-line growth, at least for the near term. For 2019, we assumed slower GDP growth and incorporated some decline in margins into our projection just to err on the conservative side. Nonetheless, our EPS model still projects a respectable 8% growth rate at the end of 2019 (Chart 32). The dollar will only be a minor headwind to earnings growth unless it surges by another 10% or more. Chart 32EPS Growth Forecasts
EPS Growth Forecasts
EPS Growth Forecasts
The risks to EPS growth probably are to the downside relative to our forecast, but the point is that U.S. earnings will likely remain supportive for the market unless economic growth is much weaker than we expect. None of this means that investors should be aggressively overweight stocks now. We trimmed our equity recommendation to benchmark in mid-2018 for several reasons. At the time, value was quite poor and bottom-up earnings expectations were too high, especially on a five-year horizon. Also, sentiment measures suggested that investors were overly complacent. As you know, we are always reluctant to chase markets into highly overvalued territory, especially when a lot of good news has been discounted. As we have noted, we are open to temporarily shifting back to overweight in equities and other risk assets. The extension of the economic expansion gives more time for earnings to grow. The risks facing the market have not eased much but, given our base-case macro view, we would be inclined to upgrade equities if there is another meaningful correction. Of course, our profit, monetary and economic indicators would have to remain supportive to justify an upgrade. Mr. X: But you are bearish on bonds. We saw in October that the equity market is vulnerable to higher yields. BCA: It certainly won’t be smooth sailing through 2019 as interest rates normalize. Until recently, higher bond yields reflected stronger growth without any associated fears that inflation was a growing problem. The ‘Fed Put’ was seen as a key backstop for the equity bull market. But now that the U.S. labor market is showing signs of overheating, the bond sell-off has become less benign for stocks because the Fed will be less inclined to ease up at the first sign of trouble in the equity market. How stocks react in 2019 to the upward trend in yields depends a lot on the evolution of actual inflation and long-term inflation expectations. If core PCE inflation hovers close to or just above 2% for a while, then the Fed Put should still be in place. However, it would get ugly for both bonds and stocks if inflation moves beyond 2.5%. Our base case is that this negative dynamic won’t occur until early 2020, but obviously the timing is uncertain. One key indicator to watch is long-term inflation expectations, such as the 10-year TIPS breakeven inflation rate (Chart 33). It is close to 2% at the moment. If it shifts up into the 2.3%-2.5% range, it would confirm that inflation expectations have returned to a level that is consistent with the Fed meeting its 2% inflation target on a sustained basis. This would be a signal to the Fed that it is must become more aggressive in calming growth, with obvious negative consequences for risk assets. Chart 33Watch For A Return To 2.3%-2.5% Range
Watch For A Return To 2.3%-2.5% Range
Watch For A Return To 2.3%-2.5% Range
Mr. X: I am skeptical that the U.S. corporate sector can pull off an 8% earnings gain in 2019. What about the other major markets? Won’t they get hit hard if global growth continues to slow as you suggest? BCA: Yes, that is correct. It is not surprising that EPS growth has already peaked in the Euro Area and Japan. The profit situation is going to deteriorate quickly in the coming quarters. Industrial production growth in both economies has already dropped close to zero, and we use this as a proxy for top-line growth in our EPS models. Nominal GDP growth has decelerated sharply in both economies in absolute terms and relative to the aggregate wage bill. These trends suggest that profit margins are coming under significant downward pressure. Even when we build in a modest growth pickup and slight rebound in margins in 2019, EPS growth falls close to zero by year-end according to our models. Both the Euro Area and Japanese equity markets are cheap relative to the U.S., based on our composite valuation indicators (Chart 34). However, neither is above the threshold of undervaluation (+1 standard deviation) that would justify overweight positions on valuation alone. We think the U.S. market will outperform the other two at least in the first half of 2019 in local and, especially, common-currency terms. Chart 34Valuation Of Nonfinancial Equity Markets Relative To The U.S.
OUTLOOK 2019: Late-Cycle Turbulence
OUTLOOK 2019: Late-Cycle Turbulence
Ms. X: It makes sense that U.S. profit growth will outperform the other major developed countries in 2019. I would like to circle back to emerging market assets. I understand that many emerging economies have deep structural problems. But you admitted that the Chinese authorities will eventually stimulate enough to stabilize growth, providing a bounce in EM growth and asset prices next year. These assets seem cheap enough to me to warrant buying now in anticipation of that rally. As we all know, reversals from oversold levels can happen in a blink of an eye and I don’t want to miss it. BCA: We are looking for an opportunity to buy as well, but are wary of getting in too early. First, valuation has improved but is not good enough on its own to justify buying now. EM stocks are only moderately undervalued based on our EM composite valuation indicator and the cyclically-adjusted P/E ratio (Chart 35). EM currencies are not particularly cheap either, outside of Argentina, Turkey and Mexico (Charts 36A and 36B). Valuation should only play a role in investment strategy when it is at an extreme, and this is not the case for most EM countries. Chart 35EM Stocks Are Not At Capitulation Levels...
bca.bca_mp_2018_12_01_c35
bca.bca_mp_2018_12_01_c35
Chart 36A…And Neither Are EM Currencies
...And Neither Are EM Currencies
...And Neither Are EM Currencies
Chart 36B…And Neither Are EM Currencies
...And Neither Are EM Currencies
...And Neither Are EM Currencies
Second, corporate earnings growth has plenty of downside potential in the near term. Annual growth in EM nonfinancial EBITDA, currently near 10%, is likely to turn negative next year, based on our China credit and fiscal impulse indicator (Chart 37). And, as we emphasized earlier, China is not yet pressing hard on the gas pedal. Chart 37EM Earnings Growth: Lots Of Downside
EM Earnings Growth: Lots Of Downside
EM Earnings Growth: Lots Of Downside
Third, it will take time for more aggressive Chinese policy stimulus, if it does occur, to show up in EM stocks and commodity prices. Trend changes in money growth and our credit and fiscal impulse preceded the trough in EM stocks and commodity prices in 2015, and again at the top in stocks and commodities in 2017 (Chart 38). However, even if these two indicators bottom today, it could take several months before the sell-off in EM financial markets and commodity prices abates. Chart 38Chinese Money And Credit Leads EM And Commodities
Chinese Money And Credit Leads EM And Commodities
Chinese Money And Credit Leads EM And Commodities
Finally, if Chinese stimulus comes largely via easier monetary policy rather than fiscal stimulus, then the outcome will be a weaker RMB. We expect the RMB to drift lower in any event, because rate differentials vis-à-vis the U.S. will move against the Chinese currency next year. A weaker RMB would add to the near-term headwinds facing EM assets. The bottom line is that the downside risks remain high enough that you should resist the temptation to bottom-fish until there are concrete signs that the Chinese authorities are getting serious about boosting the economy. We are also watching for signs outside of China that the global growth slowdown is ending. This includes our global leading economic indicator and data that are highly sensitive to global growth, such as German manufacturing foreign orders. Mr. X: Emerging market assets would have to become a lot cheaper for me to consider buying. Debt levels are just too high to be sustained, and stronger Chinese growth would only provide a short-term boost. I’m not sure I would even want to buy developed market risk assets based solely on some Chinese policy stimulus. BCA: Yes, we agree with your assessment that buying EM in 2019 would be a trade rather than a buy-and-hold strategy. Still, the combination of continued solid U.S. growth and a modest upturn in the Chinese economy would alleviate a lot of investors’ global growth concerns. The result could be a meaningful rally in pro-cyclical assets that you should not miss. We are defensively positioned at the moment, but we could see becoming more aggressive in 2019 on signs that China is stimulating more firmly and/or our global leading indicators begin to show some signs of life. Besides upgrading our overall equity allocation back to overweight, we would dip our toes in the EM space again. At the same time, we will likely upgrade the more cyclical DM equity markets, such as the Euro Area and Japan, while downgrading the defensive U.S. equity market to underweight. We are currently defensively positioned in terms of equity sectors, but it would make sense to shift cyclicals to overweight at the same time. Exact timing is always difficult, but we expect to become more aggressive around the middle of 2019. We also think the time is approaching to favor long-suffering value stocks over growth stocks. The relative performance of growth-over-value according to standard measures has become a sector call over the past decade: tech or financials. The sector skew complicates this issue, especially since tech stocks have already cracked. But we have found that stocks that are cheap within equity sectors tend to outperform expensive (or growth) stocks once the fed funds rate moves into restrictive territory. This is likely to occur in the latter half of 2019. Value should then have its day in the sun. Currencies: Mr. X: We don’t usually hedge our international equity exposure, so the direction of the dollar matters a lot to us. As you predicted a year ago, the U.S. dollar reigned supreme in 2018. Your economic views suggest another good year in 2019, but won’t this become a problem for the economy? President Trump’s desire to lower the U.S. trade deficit suggests that the Administration would like the dollar to drop and we could get some anti-dollar rhetoric from the White House. Also, it seems that the consensus is strongly bullish on the dollar which is always a concern. BCA: The outlook for the dollar is much trickier than it was at the end of 2017. As you highlighted, traders are already very long the dollar, implying that the hurdle for the greenback to surprise positively is much higher now. However, a key driver for the dollar is the global growth backdrop. If the latter is poor in the first half of 2019 as we expect, it will keep a bid under the greenback. Interest rates should also remain supportive for the dollar. As we argued earlier, current market expectations – only one more Fed hike after the December meeting – are too sanguine. If the Fed increases rates by more than currently discounted, the dollar’s fair value will rise, especially if global growth continues to lag that of the U.S. Since the dollar’s 2018 rally was largely a correction of its previous undervaluation, the currency has upside potential in the first half of the year (Chart 39). Chart 39U.S. Dollar Not Yet Overvalued
U.S. Dollar Not Yet Overvalued
U.S. Dollar Not Yet Overvalued
A stronger dollar will dampen foreign demand for U.S.-produced goods and will boost U.S. imports. However, do not forget that a rising dollar benefits U.S. consumers via its impact on import prices. Since the consumer sector represents 68% of GDP, and that 69% of household consumption is geared toward the (largely domestic) service sector, a strong dollar will not be as negative for aggregate demand and employment as many commentators fear, unless it were to surge by at least another 10%. In the end, the dollar will be more important for the distribution of U.S. growth than its overall level. Where the strong dollar is likely to cause tremors is in the political arena. You are correct to point out that there is a large inconsistency between the White House’s desires to shore up growth, while simultaneously curtailing the trade deficit, especially if the dollar appreciates further. As long as the Fed focuses on its dual mandate and tries to contain inflationary pressures, the executive branch of the U.S. government can do little to push the dollar down. Currency intervention cannot have a permanent effect unless it is accompanied by shifts in relative macro fundamentals. For example, foreign exchange intervention by the Japanese Ministry of Finance in the late 1990s merely had a temporary impact on the yen. The yen only weakened on a sustained basis once interest rate differentials moved against Japan. This problem underpins our view that the Sino-U.S. relationship is unlikely to improve meaningfully next year. China will remain an easy target to blame for the U.S.’s large trade deficit. What ultimately will signal a top in the dollar is better global growth, which is unlikely until the second half of 2019. At that point, expected returns outside the U.S. will improve, causing money to leave the U.S., pushing the dollar down. Mr. X: While 2017 was a stellar year for the euro, 2018 proved a much more challenging environment. Will 2019 be more like 2017 or 2018? BCA: We often think of the euro as the anti-dollar; buying EUR/USD is the simplest, most liquid vehicle for betting against the dollar, and vice versa. Our bullish dollar stance is therefore synonymous with a negative take on the euro. Also, the activity gap between the U.S. and the Euro Area continues to move in a euro-bearish fashion (Chart 40). Finally, since the Great Financial Crisis, EUR/USD has lagged the differential between European and U.S. core inflation by roughly six months. Today, this inflation spread still points toward a weaker euro. Chart 40Relative LEI's Moving Against Euro
Relative LEI's Moving Against Euro
Relative LEI's Moving Against Euro
It is important to remember that when Chinese economic activity weakens, European growth deteriorates relative to the U.S. Thus, our view that global growth will continue to sputter in the first half of 2019 implies that the monetary policy divergence between the Fed and the ECB has not yet reached a climax. Consequently, we expect EUR/USD to trade below 1.1 in the first half of 2019. By that point, the common currency will be trading at a meaningful discount to its fair value, which will allow it to find a floor (Chart 41). Chart 41Euro Heading Below Fair Value Before Bottoming
Euro Heading Below Fair Value Before Bottoming
Euro Heading Below Fair Value Before Bottoming
Mr. X: The Bank of Japan has debased the yen, with a balance sheet larger than Japan’s GDP. This cannot end well. I am very bearish on the currency. BCA: The BoJ’s monetary policy is definitely a challenge for the yen. The Japanese central bank rightfully understands that Japan’s inability to generate any meaningful inflation – despite an economy that is at full employment – is the consequence of a well-established deflationary mindset. The BoJ wants to shock inflation expectations upward by keeping real rates at very accommodative levels well after growth has picked up. This means that the BoJ will remain a laggard as global central banks move away from accommodative policies. The yen will continue to depreciate versus the dollar as U.S. yields rise on a cyclical horizon. That being said, the yen still has a place within investors’ portfolios. First, the yen is unlikely to collapse despite the BoJ’s heavy debt monetization. The JPY is one of the cheapest currencies in the world, with its real effective exchange rate hovering at a three-decade low (Chart 42). Additionally, Japan still sports a current account surplus of 3.7% of GDP, hardly the sign of an overstimulated and inflationary economy where demand is running amok. Instead, thanks to decades of current account surpluses, Japan has accumulated a positive net international investment position of 60% of GDP. This means that Japan runs a constant and large positive income balance, a feature historically associated with strong currencies. Chart 42The Yen Is Very Cheap
The Yen Is Very Cheap
The Yen Is Very Cheap
Japan’s large net international investment position also contributes to the yen’s defensive behavior as Japanese investors pull money back to safety at home when global growth deteriorates. Hence, the yen could rebound, especially against the euro, the commodity currencies, and EM currencies if there is a further global growth scare in the near term. Owning some yen can therefore stabilize portfolio returns during tough times. As we discussed earlier, we would avoid the EM asset class, including currency exposure, until global growth firms. Commodities: Ms. X: Once again, you made a good call on the energy price outlook a year ago, with prices moving higher for most of the year. But the recent weakness in oil seemed to come out of nowhere, and I must admit to being confused about where we go next. What are your latest thoughts on oil prices for the coming year? BCA: The fundamentals lined up in a very straightforward way at the end of 2017. The coalition we have dubbed OPEC 2.0 – the OPEC and non-OPEC producer group led by the Kingdom of Saudi Arabia (KSA) and Russia – outlined a clear strategy to reduce the global oil inventory overhang. The producers that had the capacity to increase supply maintained strict production discipline which, to some analysts, was still surprising even after the cohesiveness shown by the group in 2017. Outside that core group output continued to fall, especially in Venezuela, which remains a high-risk producing province. The oil market was balanced and prices were slowly moving higher as we entered the second quarter of this year, when President Trump announced the U.S. would re-impose oil export sanctions against Iran beginning early November. The oft-repeated goal of the sanctions was to reduce Iranian exports to zero. To compensate for the lost Iranian exports, President Trump pressured OPEC, led by KSA, to significantly increase production, which they did. However, as we approached the November deadline, the Trump Administration granted the eight largest importers of Iranian oil 180-day waivers on the sanctions. This restored much of the oil that would have been lost. Suddenly, the market found itself oversupplied and prices fell. As we move toward the December 6 meeting of OPEC 2.0 in Vienna, we are expecting a production cut from the coalition of as much as 1.4mm b/d to offset these waivers. The coalition wishes to keep global oil inventories from once again over-filling and dragging prices even lower in 2019. On the demand side, consumption continues to hold up both in the developed and emerging world, although we have somewhat lowered our expectations for growth next year. We are mindful of persistent concerns over the strength of demand – particularly in EM – in 2019. Thus, on the supply side and the demand side, the level of uncertainty in the oil markets is higher than it was at the start of 2018. Nonetheless, our base-case outlook is on the optimistic side for oil prices in 2019, with Brent crude oil averaging around $82/bbl, and WTI trading $6/bbl below that level (Chart 43). Chart 43Oil Prices To Rebound In 2019
Oil Prices To Rebound In 2019
Oil Prices To Rebound In 2019
Ms. X: I am skeptical that oil prices will rebound as much as you expect. First, oil demand is likely to falter if your view that global growth will continue slowing into early 2019 proves correct. Second, U.S. shale production is rising briskly, with pipeline bottlenecks finally starting to ease. Third, President Trump seems to have gone from taking credit for high equity prices to taking credit for low oil prices. Trump has taken a lot flack for supporting Saudi Arabia following the killing of The Washington Post journalist in Turkey. Would the Saudis really be willing to lose Trump’s support by cutting production at this politically sensitive time? BCA: Faltering demand growth remains a concern. However, note that in our forecasts we do expect global oil consumption growth to slow down to 1.46mm b/d next year, somewhat lower than the 1.6mm b/d growth we expect this year. In terms of the U.S. shale sector, production levels over the short term can be somewhat insensitive to changes in spot and forward prices, given the hedging activity of producers. Over the medium to longer term, however, lower spot and forward prices will disincentivize drilling by all but the most efficient producers with the best, lowest-cost acreage. If another price collapse were to occur – and were to persist, as the earlier price collapse did – we would expect a production loss of between 5% and 10% from the U.S. shales. Regarding KSA, the Kingdom needs close to $83/bbl to balance its budget this year and next, according to the IMF’s most recent estimates. If prices remain lower for longer, KSA’s official reserves will continue to fall, as its sovereign wealth fund continues to be tapped to fill budget gaps. President Trump’s insistence on higher production from KSA and the rest of OPEC is a non-starter – it would doom those economies to recession, and stifle further investment going forward. The U.S. would also suffer down the road, as the lack of investment significantly tightens global supply. So, net, if production cuts are not forthcoming from OPEC at its Vienna meeting we – and the market – will be downgrading our oil forecast. Ms. X: Does your optimism regarding energy extend to other commodities? The combination of a strong dollar and a China slowdown did a lot of damage to industrial commodities in 2018. Given your view that China’s economy should stabilize in 2019, are we close to a bottom in base metals? BCA: It is too soon to begin building positions in base metals because the trade war is going to get worse before it gets better. Exposure to base metals should be near benchmark at best entering 2019, although we will be looking to upgrade along with other risk assets if Chinese policy stimulus ramps up. Over the medium term, the outlook for base metals hinges on how successfully China pulls off its pivot toward consumer- and services-led growth, away from heavy industrial-led development. China accounts for roughly half of global demand for these base metals. Commodity demand from businesses providing consumer goods and services is lower than that of heavy industrial export-oriented firms. But demand for commodities used in consumer products – e.g., copper, zinc and nickel, which go into stainless-steel consumer appliances such as washers and dryers – will remain steady, and could increase if the transition away from heavy industrial-led growth is successful. Gasoline and jet fuel demand will also benefit, as EM consumers’ demand for leisure activities such as tourism increases with rising incomes. China is also going to be a large producer and consumer of electric vehicles, as it attempts to reduce its dependence on imported oil. Although timing the production ramp-up is difficult, in the long term these trends will be supportive for nickel and copper. Mr. X: You know I can’t let you get away without asking about gold. The price of bullion is down about 5% since the end of 2017, but that is no worse than the global equity market and it did provide a hedge against economic, financial or political shocks. The world seems just as risky as it did a year ago, so I am inclined to hold on to our gold positions, currently close to 10% of our portfolio. That is above your recommended level, but keeping a solid position in gold is one area where my daughter and I have close agreement regarding investment strategy. BCA: Gold did perform well during the risk asset corrections we had in 2018, and during the political crises as well. The price is not too far away from where we recommended going long gold as a portfolio hedge at the end of 2017 ($1230.3/oz). We continue to expect gold to perform well as a hedge. When other risk assets are trading lower, gold holds value relative to equities and tends to outperform bonds (Chart 44). Likewise, when other risk assets are rising, gold participates, but does not do as well as equities. It is this convexity – outperforming on the downside but participating on the upside with other risk assets – that continues to support our belief that gold has a role as a portfolio hedge. However, having 10% of your portfolio in gold is more than we would recommend – we favor an allocation of around 5%. Chart 44Hold Some Gold As A Hedge
OUTLOOK 2019: Late-Cycle Turbulence
OUTLOOK 2019: Late-Cycle Turbulence
Geopolitics Ms. X: I’m glad that the three of us agree at least on one thing – hold some gold! Let’s return to the geopolitical situation for a moment. Last year, you correctly forecast that divergent domestic policies in the U.S. and China – stimulus in the former and lack thereof in the latter – would be the most investment-relevant geopolitical issue. At the time, I found this an odd thing to highlight, given the risks of protectionism, populism, and North Korea. Do you still think that domestic policies will dominate in 2019? BCA: Yes, policy divergence between the U.S. and China will also dominate in 2019, especially if it continues to buoy the U.S. economy at the expense of the rest of the world. Of course, Beijing may decide to do more stimulus to offset its weakening economy and the impact of the trade tariffs. A headline rate cut, cuts to bank reserve requirements, and a boost to local government infrastructure spending are all in play. In the context of faltering housing and capex figures in the U.S., the narrative over the next quarter or two could be that the policy divergence is over, that Chinese policymakers have “blinked.” We are pushing back against this narrative on a structural basis. We have already broadly outlined our view that China will not be pressing hard to boost demand growth. Many of its recent policy efforts have focused on rebalancing the economy away from debt-driven investment (Chart 45). The problem for the rest of the world is that raw materials and capital goods comprise 85% of Chinese imports. As such, efforts to boost domestic consumption will have limited impact on the rest of the world, especially as emerging markets are highly leveraged to “old China.” Chart 45Rebalancing Of The Chinese Economy
Rebalancing Of The Chinese Economy
Rebalancing Of The Chinese Economy
Meanwhile, the Trump-Democrat gridlock could yield surprising results in 2019. President Trump is becoming singularly focused on winning re-election in 2020. As such, he fears the “stimulus cliff” looming over the election year. Democrats, eager to show that they are not merely the party of “the Resistance,” have already signaled that an infrastructure deal is their top priority. With fiscal conservatives in the House all but neutered by the midterm elections, a coalition between Trump and likely House Speaker Nancy Pelosi could emerge by late 2019, ushering in even more fiscal stimulus. While the net new federal spending will not be as grandiose as the headline figures, it will be something. There will also be regular spending increases in the wake of this year’s bipartisan removal of spending caps. We place solid odds that the current policy divergence narrative continues well into 2019, with bullish consequences for the U.S. dollar and bearish outcomes for EM assets, at least in the first half of the year. Mr. X: Your geopolitical team has consistently been alarmist on the U.S.-China trade war, a view that bore out throughout 2018. You already stated that you think trade tensions will persist in 2019. Where is this heading? BCA: Nowhere good. Rising geopolitical tensions in the Sino-American relationship has been our premier geopolitical risk since 2012. The Trump administration has begun tying geopolitical and strategic matters in with the trade talks. No longer is the White House merely asking for a narrowing of the trade deficit, improved intellectual property protections, and the removal of non-tariff barriers to trade. Now, everything from surface-to-air missiles in the South China Sea to Beijing’s “Belt and Road” project are on the list of U.S. demands. Trade negotiations are a “two-level game,” whereby policymakers negotiate in parallel with their foreign counterparts and domestic constituents. While Chinese economic agents may accept U.S. economic demands, it is not clear to us that its military and intelligence apparatus will accept U.S. geopolitical demands. And Xi Jinping himself is highly attuned to China’s geopolitical position, calling for national rejuvenation above all. We would therefore downplay any optimistic news from the G20 summit between Presidents Trump and Xi. President Trump could freeze tariffs at current rates and allow for a more serious negotiating round throughout 2019. But unless China is willing to kowtow to America, a fundamental deal will remain elusive in the end. For Trump, a failure to agree is still a win domestically, as the median American voter is not asking for a resolution of the trade war with China (Chart 46). Chart 46Americans Favor Being Tough On China
OUTLOOK 2019: Late-Cycle Turbulence
OUTLOOK 2019: Late-Cycle Turbulence
Ms. X: Could trade tensions spill into rising military friction? BCA: Absolutely. Minor military skirmishes will likely continue and could even escalate. We believe that there is a structural bull market in “war.” Investors should position themselves by being long global defense stocks. Mr. X: That is not encouraging. What about North Korea and Iran? Could they become geopolitical risks in 2019? BCA: Our answer to the North Korea question remains the same as 12 months ago: we have seen the peak in the U.S.’ display of a “credible military threat.” But Iran could re-emerge as a risk mid-year. We argued in last year’s discussion that President Trump was more interested in playing domestic politics than actually ratcheting up tensions with Iran. However, in early 2018 we raised our alarm level, particularly when staffing decisions in the White House involved several noted Iran hawks joining the foreign policy team. This was a mistake. Our initial call was correct, as President Trump ultimately offered six-month exemptions to eight importers of Iranian crude. That said, those exemptions will expire in the spring. The White House may, at that point, ratchet up tensions with Iran. This time, we will believe it when we see it. Intensifying tensions with Iran ahead of the U.S. summer vacation season, and at a time when crude oil markets are likely to be finely balanced, seems like folly, especially with primary elections a mere 6-to-8 months away. What does President Trump want more: to win re-election or to punish Iran? We think the answer is obvious, especially given that very few voters seem to view Iran as the country’s greatest threat (Chart 47). Chart 47Americans Don’t See Iran As A Major Threat
OUTLOOK 2019: Late-Cycle Turbulence
OUTLOOK 2019: Late-Cycle Turbulence
Ms. X: Let’s turn to Europe. You have tended to dismiss Euroskeptics as a minor threat, which has largely been correct. But don’t you think that, with Brexit upon us and Chancellor Angela Merkel in the twilight, populism in continental Europe will finally have its day? BCA: Let’s first wait to see how Brexit turns out! The next few months will be critical. Uncertainty is high, with considerable risks remaining. We do not think that Prime Minister May has the votes in the House of Commons to push through any version of soft Brexit that she has envisioned thus far. If the vote on the U.K.-EU exit deal falls through, a new election could be possible. This will require an extension of the exit process under Article 50 and a prolonged period of uncertainty. The probability of a no-deal Brexit is lower than 10%. It is simply not in the interest of anyone involved, save for a smattering of the hardest of hard Brexit adherents in the U.K. Conservative Party. Put simply, if the EU-U.K. deal falls through in the House of Commons, or even if PM May is replaced by a hard-Brexit Tory, the most likely outcome is an extension of the negotiation process. This can be easily done and we suspect that all EU member states would be in favor of such an extension given the cost to business sentiment and trade that would result from a no-deal Brexit. It is not clear that Brexit has emboldened Euroskeptics. In fact, most populist parties in the EU have chosen to tone down their Euroskepticism and emphasize their anti-immigrant agenda since the Brexit referendum. In part, this decision has to do with how messy the Brexit process has become. If the U.K. is struggling to unravel the sinews that tie it to Europe, how is any other country going to fare any better? The problem for Euroskeptic populists is that establishment parties are wise to the preferences of the European median voter. For example, we now have Friedrich Merz, a German candidate for the head of the Christian Democratic Union – essentially Merkel’s successor – who is both an ardent Europhile and a hardliner on immigration. This is not revolutionary. Merz simply read the polls correctly and realized that, with 83% of Germans supporting the euro, the rise of the anti-establishment Alternative for Germany (AfD) is more about immigration than about the EU. As such, we continue to stress that populism in Europe is overstated. In fact, we expect that Germany and France will redouble their efforts to reform European institutions in 2019. The European parliamentary elections in May will elicit much handwringing by the media due to a likely solid showing by Euroskeptics, even though the election is meaningless. Afterwards, we expect to see significant efforts to complete the banking union, reform the European Stability Mechanism, and even introduce a nascent Euro Area budget. But these reforms will not be for everyone. Euroskeptics in Central and Eastern Europe will be left on the outside looking in. Brussels may also be emboldened to take a hard line on Italy if institutional reforms convince the markets that the core Euro Area is sheltered from contagion. In other words, the fruits of integration will be reserved for those who play by the Franco-German rules. And that could, ironically, set the stage for the unraveling of the European Union as we know it. Over the long haul, a much tighter, more integrated, core could emerge centered on the Euro Area, with the rest of the EU becoming stillborn. The year 2019 will be a vital one for Europe. We are sensing an urgency in Berlin and Paris that has not existed throughout the crisis, largely due to Merkel’s own failings as a leader. We remain optimistic that the Euro Area will survive. However, there will be fireworks. Finally, a word about Japan. The coming year will see the peak of Prime Minister Shinzo Abe’s career. He is promoting the first-ever revision to Japan’s post-war constitution in order to countenance the armed forces. If he succeeds, he will have a big national security success to couple with his largely effective “Abenomics” economic agenda – after that, it will all be downhill. If he fails, he will become a lame duck. This means that political uncertainty will rise in 2019, after six years of unusual tranquility. Conclusions Mr. X: This is a good place to conclude our discussion. We have covered a lot of ground and your views have reinforced my belief that 2019 could be even more turbulent for financial markets than the past has been. I accept your opinion that a major global economic downturn is not around the corner, but with valuations still stretched, I feel that it makes good sense to focus on capital preservation. I may lose out on the proverbial “blow-off” rally, but so be it – I have been in this business long enough to know that it is much better to leave the party while the music is still playing! Ms. X: I agree with my father that the risks surrounding the outlook have risen as we have entered the late stages of this business-cycle expansion. Yet, if global growth does temporarily stabilize and corporate earnings continue to expand, I fear that being out of the market will be very painful. The era of hyper-easy money may be ending, but interest rates globally are still nowhere near restrictive territory. This tells me that the final stages of this bull market could be very rewarding. A turbulent market is not only one where prices go down – they can also go up a lot! BCA: The debate you are having is one we ourselves have had on numerous occasions. There is always a trade-off between maximizing short-term returns and taking a longer-term approach. Valuations are the ultimate guidepost for long-term returns. While most assets have cheapened over the past year, prices are still fairly elevated. Table 4 shows our baseline calculations of what a balanced portfolio will earn over the coming decade. We estimate that such a portfolio will deliver average annual returns of 4.9% over the next ten years, or 2.8% after adjusting for inflation. That is an improvement over our inflation-adjusted estimate of 1.3% from last year, but still well below the 6.6% real return that a balanced portfolio earned between 1982 and 2018. Table 410-Year Asset Return Projections
OUTLOOK 2019: Late-Cycle Turbulence
OUTLOOK 2019: Late-Cycle Turbulence
Our return calculations for equities assume that profit margins decline modestly over the period and that multiples mean revert to their historical average. These assumptions may turn out to be too pessimistic if underlying changes in the economy keep corporate profits elevated as a share of GDP. Structurally lower real interest rates may also justify higher P/E multiples, although this would be largely offset by the prospect of slower economic growth, which will translate into slower earnings growth. In terms of the outlook for the coming year, a lot hinges on our view that monetary policy in the main economies stays accommodative. This seems like a safe assumption in the Euro Area and Japan, where rates are near historic lows, as well as in China, where the government is actively loosening monetary conditions. It is not such a straightforward conclusion for the U.S., where the Fed is on track to keep raising rates. If it turns out that the neutral interest rate is not far above where rates are already, we could see a broad-based slowdown of the U.S. economy that ripples through to the rest of the world. And even if U.S. monetary policy does remain accommodative, many things could still upset the apple cart, including a full-out trade war, debt crises in Italy or China, or a debilitating spike in oil prices. As the title of our outlook implies, 2019 is likely to be a year of increased turbulence. Ms. X: As always, you have left us with much to think about. My father has looked forward to these discussions every year and now that I am able to join him, I understand why. Before we conclude, it would be helpful to have a recap of your key views. BCA: That would be our pleasure. The key points are as follows: The collision between policy and markets that we discussed last year finally came to a head in October. Rather than falling as they normally do when stocks plunge, U.S. bond yields rose as investors reassessed the willingness of the Fed to pause hiking rates even in the face of softer growth. Likewise, hopes that China would move swiftly to stimulate its economy were dashed as it became increasingly clear that the authorities were placing a high emphasis on their reform agenda of deleveraging and capacity reduction. The ongoing Brexit saga and the stalemate between the populist Italian government and the EU have increased uncertainty in Europe at a time when the region was already beginning to slow. We expect the tensions between policy and markets to be an ongoing theme in 2019. With the U.S. unemployment rate at a 48-year low, it will take a significant slowdown for the Fed to stop hiking rates. Despite the deterioration in economic data over the past month, real final domestic demand is still tracking to expand by 3% in the fourth quarter, well above estimates of the sustainable pace of economic growth. Ultimately, the Fed will deliver more hikes next year than discounted in the markets. This will push up the dollar and keep the upward trend in Treasury yields intact. The dollar should peak midway next year. China will also become more aggressive in stimulating its economy, which will boost global growth. However, until both of these things happen, emerging markets will remain under pressure. For the time being, we continue to favor developed market equities over their EM peers. We also prefer defensive equity sectors such as health care and consumer staples over cyclical sectors such as industrials and materials. Within the developed market universe, the U.S. will outperform Europe and Japan for the next few quarters, especially in dollar terms. A stabilization in global growth could ignite a blow-off rally in global equities. If the Fed is raising rates in response to falling unemployment, this is unlikely to derail the stock market. However, once supply-side constraints begin to fully bite in early 2020 and inflation rises well above the Fed’s target of 2%, stocks will begin to buckle. This means that a window exists next year where stocks will outperform bonds. We would maintain a benchmark allocation to stocks for now, but increase exposure if global bourses were to fall significantly from current levels without a corresponding deteriorating in the economic outlook. Corporate credit will underperform stocks as government bond yields rise. A major increase in spreads is unlikely as long as the economy is still expanding, but spreads could still widen modestly given their low starting point. U.S. shale companies have been the marginal producers in the global oil sector. With breakeven costs in shale close to $50/bbl, crude prices are unlikely to rise much from current levels over the long term. However, over the next 12 months, we expect production cuts in Saudi Arabia will push prices up, with Brent crude averaging around $82/bbl in 2019. A balanced portfolio is likely to generate average returns of only 2.8% a year in real terms over the next decade. This compares to average returns of around 6.6% a year between 1982 and 2018. We would like to take this opportunity to wish you and all of our clients a very peaceful, healthy and prosperous New Year. The Editors November 26, 2018
Highlights Credit: Credit spreads are widening due to the combination of weakening global growth and perceptions of restrictive Fed policy. Investors should monitor the indicators of global growth and Fed policy outlined in this report to call the peak in spreads. Duration: Financial conditions have not yet tightened enough for the Fed to take a significant dovish turn. Meanwhile, the housing market indicators with the best track records at signaling restrictive monetary policy remain benign. Maintain below-benchmark duration. MBS: Negative excess MBS returns during the past two months are the result of wider option-adjusted spreads, but continued easing in bank lending standards should prevent OAS from widening dramatically. Maintain a neutral allocation to MBS for now, but look to upgrade at the expense of corporate bonds as the credit cycle progresses. Feature The sell-off in credit markets continues to worsen. The average spread of the Bloomberg Barclays High-Yield index is now above 400 bps and the investment grade spread is at its widest level in two years (Chart 1). Chart 1Risk Off In Credit Markets
Risk Off In Credit Markets
Risk Off In Credit Markets
Just like when credit markets sold off in 2014/15, the catalyst for wider spreads is the combination of weakening global economic growth and tight Fed policy. While indicators of global economic growth are sending negative signals, the Fed continues to focus on the sturdier domestic economy. Once again, the end result is a stronger dollar and a sell-off in risk assets.1 In the midst of a downturn, the relevant investment question becomes when to step back into the market. In this case, the question is: How should we go about calling the peak in credit spreads? In this week’s report we identify several catalysts that could signal a peak in credit spreads in the coming months. The catalysts fall into two categories: Signals of rebounding global growth Signals of Fed capitulation We consider each category in turn. Catalyst 1: Global Growth Rebound Chart 2 shows three indicators of global growth that investors should watch closely in the current environment. All three indicators are highly levered to global demand, signaled the peak in credit spreads in early 2016, and most importantly, are updated daily making it possible to track them in real time. Chart 2Signals Of Rebounding Global Growth
Signals Of Rebounding Global Growth
Signals Of Rebounding Global Growth
The first indicator is the CRB Raw Industrials index (Chart 2, panel 2). This index troughed several weeks before the early-2016 peak in credit spreads. It is also currently in an uptrend, albeit a very modest one. The second indicator is the BCA Market-Based China Growth Indicator (Chart 2, panel 3). This indicator was created by our China Investment Strategy team as a broad proxy of investor expectations for Chinese growth.2 It includes 17 different market prices, spanning equity, commodity, fixed income and currency markets. Just like the CRB Raw Industrials index, it also signaled the early-2016 peak in credit spreads and is currently in a shallow uptrend. The third indicator is the price of Global Industrials stocks (Chart 2, bottom panel). These stocks also bottomed in early-2016, and they are currently trending down. On balance, we do not see sufficient evidence from these three indicators to call the peak in credit spreads. Global industrial stocks are collapsing, while the Raw Industrials and China Growth indexes have only put in tentative bottoms. Further, our assessment of economic trends suggests that these indicators may have more near-term downside. Weakness in global demand has largely been a function of slowing growth in China (Chart 3). The Chinese Manufacturing PMI has already collapsed to the 50 boom/bust line and we are still waiting to see the full impact of tariffs in the economic data. It’s true that Chinese policymakers have begun to ease monetary policy: interest rates are lower (Chart 3, panel 3) and the trade-weighted RMB has depreciated (Chart 3, bottom panel). But so far, easier monetary conditions have not passed through to the money and credit growth indicators that tend to lead Chinese economic activity. Our China Investment Strategy team’s Li Keqiang Leading Indicator is an index designed to lead the Li Keqiang index – a widely followed indicator of Chinese economic activity. The leading index is primarily composed of money and credit growth data, and it remains well below the zero line, pointing to further economic weakness ahead (Chart 3, panel 2). Chart 3Keep An Eye On China
Keep An Eye On China
Keep An Eye On China
Catalyst 2: Fed Capitulation If global demand does not improve, then eventually financial conditions will tighten so much that the Fed will downgrade its assessment of future U.S. economic growth and adopt a more dovish policy stance. This is what happened in early 2016, and the Fed’s capitulation signaled the peak in credit spreads at that time (Chart 4). Chart 4Signals Of Fed Capitulation
Signals Of Fed Capitulation
Signals Of Fed Capitulation
Our 12-month Fed Funds discounter tracks the market’s expectation for changes in the fed funds rate during the next 12 months. The discounter plunged sharply in early 2016 from a peak of 75 bps to a trough of 4 bps, signaling the peak in credit spreads (Chart 4, panel 2). At present, the discounter has fallen somewhat during the past few weeks, but hardly by enough to signal capitulation from the Fed on its “gradual” rate hike cycle. The minutes from the November FOMC meeting will be released this week and we will read closely to get a sense for how the Fed is thinking about the current state of financial conditions. However, at this point we view a December rate hike as a done deal. If credit spreads continue to widen between now and the December 19 FOMC meeting, then Chairman Powell’s post-meeting press conference will become critical for markets. Another useful indicator for the perceived stance of monetary policy is the price of gold (Chart 4, panel 3). In prior research we discussed why a higher gold price correlates with perceptions of easier monetary policy, and vice-versa.3 So it should not be surprising that gold rose sharply as the Fed capitulated in early 2016, signaling the peak in credit spreads. Gold has been range-bound during the past few weeks, but a significant upside break-out would signal a potential buying opportunity in credit. Finally, the trade-weighted U.S. dollar will likely be another useful indicator for calling the peak in credit spreads (Chart 4, bottom panel). The dollar is not a pure indicator of the stance of Fed policy like our 12-month discounter or the gold price. Rather, the dollar’s value is determined jointly by the outlooks for the U.S. economy and the rest of the world. However, a peak in the dollar would signal that either the Fed has become more dovish, or that non-U.S. growth has recovered significantly. Credit spreads would benefit in either case. The dollar did in fact roll over prior to the peak in credit spreads in early 2016, and we expect it would do the same again. Thus far we have focused on what to monitor to call the peak in credit spreads. One of the catalysts is an easing of Fed policy that would obviously be accompanied by lower Treasury yields. Therefore, it is worth thinking about how the outlook for credit spreads influences our portfolio duration call, and vice-versa. Chart 5 provides a useful illustration to help us think about the relationship. The chart shows our 12-month Fed Funds Discounter, our BCA Fed Monitor and each its three components lined up with the 2014/15 period. Specifically, this year’s trough in the dollar is lined up with the 2014 dollar trough, denoted in the chart by a vertical line. Chart 5BCA Fed Monitor: Today Vs. 2014/2015
BCA Fed Monitor: Today Vs. 2014/2015
BCA Fed Monitor: Today Vs. 2014/2015
The first key takeaway is that the market expects roughly the same number of rate hikes during the next 12 months as it did this far into the 2014/15 episode of dollar strength (Chart 5, top panel). However, our Fed Monitor is currently well above the zero line, suggesting that further rate hikes are warranted. This far into the 2014/15 dollar uptrend, our Fed Monitor had already dipped below zero (Chart 5, panel 2). The reason for today’s higher Fed Monitor is that U.S. economic growth and inflation are both on much firmer footing than during 2014/15 (Chart 5, panels 3 & 4). In fact, financial conditions have tightened more severely than at a similar stage of the 2014/15 episode, but the impact on the overall Monitor has been offset by stronger economic growth and inflation. What does this all mean? It very likely means that the Fed will need to see tighter financial conditions (i.e. wider credit spreads) before taking a significant dovish turn. In other words, the near-term path of least resistance for credit spreads is probably wider, while Treasury yields may remain close to current levels. Bottom Line: Credit spreads are widening due to the combination of weakening global growth and perceptions of restrictive Fed policy. Investors should monitor the indicators of global growth and Fed policy outlined in this report to call the peak in spreads. Housing Update In prior research we stressed the importance of housing as the most important channel through which monetary policy impacts the real economy.4 This makes the U.S. housing market critical for the portfolio duration call. If the housing market has peaked for the cycle, then it likely means that monetary policy has become overly restrictive and that interest rates have also peaked. Chart 6 shows the three most important indicators of the housing market in this regard. Residential investment as a share of potential GDP, the 12-month moving average in single family housing starts and the 12-month moving average in new home sales. At the moment, only residential investment has flattened off, while the other two indicators have maintained their uptrends. While there’s no denying that the housing data have softened in recent months, the bigger picture suggests it is too soon to sound the alarm. Chart 6Housing: The Three Most Important Indicators
Housing: The Three Most Important Indicators
Housing: The Three Most Important Indicators
Rising rates have taken most of the blame for weaker housing data, best exemplified by these comments from the National Association of Realtors’ Chief Economist Lawrence Yun that accompanied last week’s release of October’s existing home sales data: Rising interest rates and increasing home prices continue to suppress the rate of first-time homebuyers. Home sales could further decline before stabilizing. The Federal Reserve should, therefore, re-evaluate its monetary policy of tightening credit, especially in light of softening inflationary pressures to help ease the financial burden on potential first-time buyers and assure a slump in the market causes no lasting damage to the economy.5 There are certainly structural impediments to first-time homeownership, most notably the lack of supply at the low-end of the market. The most recent annual report from the Joint Center For Housing Studies noted that of 88 metropolitan areas with available data, “virtually all” had more homes for sale in the top third of the market by price than in the bottom third.6 However, we do not see the level of interest rates as the major problem for first-time homebuyers or indeed the overall market. In fact, it is very difficult to see how the level of interest rates could be a large drag on the housing market when the household mortgage debt service ratio is as low as it has been since 1980 (Chart 6, bottom panel). So what exactly is going on with housing? It is likely that the recent slow-down in housing activity is not function of the level of mortgage rates, but of the recent sharp increase in mortgage rates. Chart 7 shows that there have been three periods since the financial crisis when mortgage rates jumped sharply: 2013, late-2016 and 2018. All three episodes were followed by a contraction in residential investment about six months later. The recent contraction fits this pattern nicely, which suggests that it should reverse if mortgage rates simply flatten-off for a time. Chart 7The Culprit: Large Rate Spikes
The Culprit: Large Rate Spikes
The Culprit: Large Rate Spikes
Bottom Line: The housing market indicators with the best track records at signaling restrictive monetary policy remain benign, suggesting it is too soon to fret about the end of the Fed’s rate hike cycle. We suspect that recent housing weakness is a function of the large jump in mortgage rates, and that housing activity will recover once mortgage rates moderate their uptrend. Agency MBS On Upgrade Watch Agency MBS have underperformed duration-matched Treasuries so far this year. While they have outperformed corporate credit, they have also lagged other Aaa-rated securitizations (Chart 8). As the cycle progresses, we think Agency MBS spreads will remain relatively tight even after the credit cycle turns and corporate bond defaults rise. We maintain a neutral allocation to MBS for now, but will likely upgrade the sector when it comes time to downgrade corporate bonds from neutral to underweight. Chart 8Agency MBS: Outperforming Corporate Credit But Lagging Other Aaa-Rated Securitizations
Agency MBS: Outperforming Corporate Credit But Lagging Other Aaa-Rated Securitizations
Agency MBS: Outperforming Corporate Credit But Lagging Other Aaa-Rated Securitizations
We like to model excess MBS returns using the following formula: Monthly Excess Returns = a * (1-month lag in OAS) - b * (change in OAS) + c * (change in yields) - d * (squared change in yields) In the above formula, the change in yields proxies for mortgage refinancing risk. Refinancings tend to increase when yields fall and decline when they rise. The squared change in yields proxies for extension risk, and the lagged OAS approximates the carry in the security. The final risk factor is the change in MBS OAS itself.7 Chart 9 shows a performance attribution of monthly MBS excess returns to each of the risk factors listed above. The model coefficients are estimated using only 2018 data, and the November figures are month-to-date. The message from Chart 9 is that while the squared change in yields was a drag on returns early in the year, widening OAS has been the reason for negative excess returns during the past two months. Refinancing risk has been muted all year, and this will likely continue as the Fed tightens policy. Chart 9Agency MBS Performance Attribution
A Checklist For Peak Credit Spreads
A Checklist For Peak Credit Spreads
While a wider OAS has dragged down MBS returns during the past two months, we do not see this becoming a long-term issue for the sector. The OAS tends to widen when banks are tightening lending standards on residential mortgage loans, and at present, lending standards are already quite restrictive compared to history. The median FICO score for new mortgages is a lofty 758 (Chart 10). This suggests that the most likely way forward is continued gradual easing in bank mortgage lending standards (Chart 10, bottom panel). Chart 10Lending Standards Will Continue To Ease
Lending Standards Will Continue To Ease
Lending Standards Will Continue To Ease
Bottom Line: Negative excess MBS returns during the past two months are the result of wider option-adjusted spreads, but continued easing in bank lending standards should prevent OAS from widening dramatically. Maintain a neutral allocation to MBS for now, but look to upgrade at the expense of corporate bonds as the credit cycle progresses. Ryan Swift, Vice President U.S. Bond Strategy rswift@bcaresearch.com Footnotes 1 Please see U.S. Bond Strategy Weekly Report, “An Oasis Of Prosperity?”, dated August 21, 2018, available at usbs.bcaresearch.com 2 Please see China Investment Strategy Weekly Report, “Trade Is Not China’s Only Problem”, dated November 21, 2018, available at cis.bcaresearch.com 3 Please see U.S. Bond Strategy Weekly Report, “A Signal From Gold?”, dated May 1, 2018, available at usbs.bcaresearch.com 4 Please see U.S. Bond Strategy Weekly Report, “More Than One Reason To Own Steepeners”, dated September 25, 2018, available at usbs.bcaresearch.com 5 https://www.nar.realtor/newsroom/existing-home-sales-increase-for-the-first-time-in-six-months 6 http://www.jchs.harvard.edu/state-nations-housing-2018 7 For further details on the model please see U.S. Bond Strategy Weekly Report, “On The MOVE”, dated February 13, 2018, available at usbs.bcaresearch.com Fixed Income Sector Performance Recommended Portfolio Specification Corporate Sector Relative Valuation And Recommended Allocation
Feature Asset Allocation Amid Late-Cycle Turbulence BCA today published its 2019 Outlook, Late-Cycle Turbulence,1 our annual discussion with long-time clients Mr X and his daughter, Ms X. Recommendations
Monthly Portfolio Update
Monthly Portfolio Update
This note is simply to update the Global Asset Allocation (GAA) service’s recommended portfolio in the light of our expectations for the next 12 months, as detailed in the 2019 Outlook. The table on the right summarizes our key views, with the full details of recommended weights for a standard portfolio on page 3 of our PDF. Our overall view of markets has not changed significantly. We remain concerned about late-cycle pressures that will ultimately undermine asset prices. However, it is hard to put precise timing on when the U.S. economy will peak. For the next few quarters, it will continue to benefit from loose fiscal policy and still accommodative monetary policy. Although global growth is slowing, a recession is not on the immediate horizon. Therefore, we think it is premature to move underweight on equities. A further sell-off might even present a buying opportunity. Accordingly, we remain neutral on global equities, with a preference for the U.S., underweight global bonds, and overweight cash. The only significant change we make to GAA’s recommended portfolio is to reduce Japanese equities to neutral. Profit margins are at record highs but are vulnerable to narrowing as wage growth picks up and sales to emerging markets come under further pressure. Our model suggests that Japanese profit growth will turn negative in year-on-year terms by the second half of 2019. Barring evidence of more reflationary stimulus from China, Japan will be challenged to outperform global equities. We have used the funds taken from Japan to increase our overweight in U.S. equities. We make two minor changes to our equity sector recommendations, lowering Industrials to underweight and raising Consumer Discretionary to neutral. This is in line with our generally defensive sector tilts. We expect to see a further slowdown in China and, in the U.S. too, capex growth has probably peaked for this cycle. These factors should be negative for capital goods producers. Consumer Discretionary should benefit from a late-cycle rise in wages in developed economies, and contains some structural growth companies in the online commerce space, which are now more attractively valued after the recent sell-off. We will publish our next Monthly Portfolio Update on January 2. Garry Evans, Senior Vice President Global Asset Allocation garry@bcaresearch.com Footnote 1 Please see BCA Outlook titled “Late-Cycle Turbulence” dated November 26, 2018 available at bca.bcaresearch.com Recommended Asset Allocation
Mr. X and his daughter, Ms. X, are long-time BCA clients who visit our office toward the end of each year to discuss the economic and financial market outlook. This report is an edited transcript of our recent conversation. Mr. X: I have been eagerly looking forward to this meeting given the recent turbulence in financial markets. Our investments have done poorly in the past year and, with hindsight, I wish I had followed my instincts to significantly cut our equity exposure at the end of 2017, although we did follow your advice to move to a neutral stance in mid-2018. I remain greatly troubled by economic and political developments in many countries. I have long believed in open and free markets and healthy political discourse, and this all seems under challenge. As always, there is much to talk about. Ms. X: Let me add that I also am pleased to have this opportunity to talk through the key issues that will influence our investment strategy over the coming year. As I am sure you remember, I was more optimistic than my father about the outlook when we met a year ago but things have not worked out as well as I had hoped. In retrospect, I should have paid more attention to your view that markets and policy were on a collision course as that turned out to be a very accurate prediction. When I joined the family firm in early 2017, I persuaded my father that we should have a relatively high equity exposure and that was the correct stance. However, this success led us to maintain too much equity exposure in 2018, and my father has done well to resist the temptation to say “I told you so.” So, we are left with a debate similar to last year: Should we move now to an underweight in risk assets or hold off on the hope that prices will reach new highs in the coming year? I am still not convinced that we have seen the peak in risk asset prices as there is no recession on the horizon and equity valuations are much improved, following recent price declines. I will be very interested to hear your views. BCA: Our central theme for 2018 that markets and policy would collide did turn out to be appropriate and, importantly, the story has yet to fully play out. The monetary policy tightening cycle is still at a relatively early stage in the U.S. and has not even begun in many other regions. Yet, although it was a tough year for most equity markets, the conditions for a major bear market are not yet in place. One important change to our view, compared to a year ago, is that we have pushed back the timing of the next U.S. recession. This leaves a window for risk assets to show renewed strength. It remains to be seen whether prices will reach new peaks, but we believe it would be premature to shift to an underweight stance on equities. For the moment, we are sticking with our neutral weighting for risk assets, but may well recommend boosting exposure if prices suffer further near-term weakness. We will need more clarity about the timing of a recession before we consider aggressively cutting exposure. Mr. X: I can see we will have a lively discussion because I do not share your optimism. My list of concerns is long and I hope we have time to get through them all. But first, let’s briefly review your predictions from last year. BCA: That is always interesting to do, although sometimes rather humbling. A year ago, our key conclusions were that: The environment of easy money, low inflation and healthy profit growth that has been so bullish for risk assets will start to change during the coming year. Financial conditions, especially in the U.S., will gradually tighten as decent growth leads to building inflationary pressures, encouraging central banks to withdraw stimulus. With U.S. equities at an overvalued extreme and investor sentiment overly optimistic, this will set the scene for an eventual collision between policy and the markets. The conditions underpinning the bull market will erode only slowly which means that risk asset prices should continue to rise for at least the next six months. However, long-run investors should start shifting to a neutral exposure. Given our economic and policy views, there is a good chance that we will move to an underweight position in risk assets during the second half of 2018. The U.S. economy is already operating above potential and thus does not need any boost from easier fiscal policy. Any major tax cuts risk overheating the economy, encouraging the Federal Reserve to hike interest rates and boosting the probability of a recession in 2019. This is at odds with the popular view that tax cuts will be good for the equity market. A U.S. move to scrap NAFTA would add to downside risks. For the second year in a row, the IMF forecasts of economic growth for the coming year are likely to prove too pessimistic. The end of fiscal austerity has allowed the Euro Area economy to gather steam and this should be sustained in 2018. However, the slow progress in negotiating a Brexit deal with the EU poses a threat to the U.K. economy. China’s economy is saddled with excessive debt and excess capacity in a number of areas. Any other economy would have collapsed by now, but the government has enough control over banking and other sectors to prevent a crisis. Growth should hold above 6% in the next year or two, although much will depend on how aggressively President Xi pursues painful reforms. The market is too optimistic in assuming that the Fed will not raise interest rates by as much as indicated in their “dots” projections. There is a good chance that the U.S. yield curve will become flat or inverted by late 2018. Bonds are not an attractive investment at current yields. Only Greece and Portugal have real 10-year government bond yields above their historical average. Corporate bonds should outperform governments, but a tightening in financial conditions will put these at risk in the second half of 2018. The Euro Area and Japanese equity markets should outperform the U.S. over the next year reflecting their better valuations and more favorable financial conditions. Developed markets should outperform the emerging market index. Historically, the U.S. equity market has led recessions by between 3 and 12 months. If, as we fear, a U.S. recession starts in the second half of 2019, then the stock market would be at risk from the middle of 2018. The improving trend in capital spending should favor industrial stocks. Our other two overweight sectors are energy and financials. The oil price will be well supported by strong demand and output restraint by OPEC and Russia. The Brent price should average $65 a barrel over the coming year, with risks to the upside. We expect base metals prices to trade broadly sideways but will remain highly dependent on developments in China. Modest positions in gold are warranted. Relative economic and policy trends will favor a firm dollar in 2018. Unlike at the start of 2017, investors are significantly short the dollar which is bullish from a contrary perspective. Sterling is quite cheap but Brexit poses downside risks. The key market-relevant geopolitical events to monitor will be fiscal policy and mid-term elections in the U.S., and reform policies in China. With the former, the Democrats have a good chance of winning back control of the House of Representatives, creating a scenario of complete policy gridlock. A balanced portfolio is likely to generate average returns of only 3.3% a year in nominal terms over the next decade. This compares to average returns of around 10% a year between 1982 and 2017. As already noted, the broad theme that policy tightening – especially in the U.S. – would become a problem for asset markets during the year was supported by events. However, the exact timing was hard to predict. The indexes for non-U.S. developed equity markets and emerging markets peaked in late-January 2018, and have since dropped by around 18% and 24%, respectively (Chart 1). On the other hand, the U.S. market, after an early 2018 sell-off, hit a new peak in September, before falling anew in the past couple of months. The MSCI All-Country World index currently is about 6% below end-2017 levels in local-currency terms. Chart 1Our 'Collision Course' Theme For 2018 Played Out
Our 'Collision Course' Theme For 2018 Played Out
Our 'Collision Course' Theme For 2018 Played Out
We started the year recommending an overweight in developed equity markets but, as you noted, shifted that to a neutral position mid-year. A year ago, we thought we might move to an underweight stance in the second half of 2018 but decided against this because U.S. fiscal stimulus boosted corporate earnings and extended the economic cycle. Our call that emerging markets would underperform was on target. Although it was U.S. financial conditions that tightened the most, Wall Street was supported by the large cut in the corporate tax rate while the combination of higher bond yields and dollar strength was a major problem for many indebted emerging markets. Overall, it was not a good year for financial markets (Table 1). Table 1Market Performance
OUTLOOK 2019: Late-Cycle Turbulence
OUTLOOK 2019: Late-Cycle Turbulence
As far as the overall macro environment was concerned, we were correct in predicting that the IMF was too pessimistic on economic growth. A year ago, the IMF forecast that the advanced economies would expand by 2% in 2018 and that has since been revised up to 2.4% (Table 2). This offset a slight downgrading to the performance of emerging economies. The U.S., Europe and Japan all grew faster than previously expected. Not surprisingly, inflation also was higher than forecast, although in the G7, it has remained close to the 2% level targeted by most central banks. Table 2IMF Economic Forecasts
OUTLOOK 2019: Late-Cycle Turbulence
OUTLOOK 2019: Late-Cycle Turbulence
Despite widespread fears to the contrary, the data have supported our view that Chinese growth would hold above a 6% pace in 2018. Nevertheless, a slowdown currently is underway and downside risks remain very much in place in terms of excessive credit and trade pressures. Another difficult year lies ahead for the Chinese authorities and we will no doubt return to this topic later. As far as our other key forecasts are concerned, we were correct in our views that oil prices and the U.S. dollar would rise and that the market would be forced to revise up its predictions of Fed rate hikes. Of course, oil has recently given back its earlier gains, but we assume that is a temporary setback. On the sector front, our macro views led us to favor industrials, financials and energy, but that did not work out well as concerns about trade took a toll on cyclical sectors. Overall, there were no major macro surprises in 2018, and it seems clear that we have yet to resolve the key questions and issues that we discussed a year ago. At that time, we were concerned about the development of late-cycle pressures that ultimately would undermine asset prices. That story has yet to fully play out. It is hard to put precise timing on when the U.S. economy will peak and, thus, when asset prices will be at maximum risk. Nevertheless, our base case is that there likely will be a renewed and probably final run-up in asset prices before the next recession. Late-Cycle Challenges Mr. X: This seems like déjà-vu all over again. Since we last met, the cycle is one year older and, as you just said, the underlying challenges facing economies and markets have not really changed. If anything, things are even worse: Global debt levels are higher, inflation pressures more evident, Fed policy is moving closer to restrictive territory and protectionist policies have ratcheted up. If it was right to be cautious six months ago, then surely we should be even more cautious now. Ms. X: Oh dear, it does seem like a repeat of last year’s discussion because, once again, I am more optimistic than my father. Obviously, there are structural problems in a number of countries and, at some point, the global economy will suffer another recession. But timing is everything, and I attach very low odds to a downturn in the coming year. Meanwhile, I see many pockets of value in the equity market. Rather than cut equity positions, I am inclined to look for buying opportunities. BCA: We sympathize with your different perspectives because the outlook is complex and we also have lively debates about the view. The global equity index currently is a little below where it was when we met last year, but there has been tremendous intra-period volatility. That pattern seems likely to be repeated in 2019. In other words, it will be important to be flexible about your investment strategy. You both make good points. It is true that there are several worrying problems regarding the economic outlook, including excessive debt, protectionism and building inflation risks. At the same time, the classic conditions for an equity bear market are not yet in place, and may not be for some time. This leaves us in the rather uncomfortable position of sitting on the fence with regard to risk asset exposure. We are very open to raising exposure should markets weaken further in the months ahead, but also are keeping careful watch for signs that the economic cycle is close to peaking. In other words, it would be a mistake to lock in a 12-month strategy right now. Mr. X: I would like to challenge the consensus view, shared by my daughter, that the next recession will not occur before 2020, and might even be much later. The main rationale seems to be that the policy environment remains accommodative and there are none of the usual imbalances that occur ahead of recessions. Of course, U.S. fiscal policy has given a big boost to growth in the past year, but I assume the effects will wear off sharply in 2019. More importantly, there is huge uncertainty about the level of interest rates that will trigger economic problems. It certainly has not taken much in the way of Fed rate hikes to rattle financial markets. Thus, monetary policy may become restrictive much sooner than generally believed. I also strongly dispute the idea that there are no major financial imbalances. If running U.S. federal deficits of $1 trillion in the midst of an economic boom is not an imbalance, then I don’t know what is! At the same time, the U.S. corporate sector has issued large amounts of low-quality debt, and high-risk products such as junk-bond collateralized debt obligations have made an unwelcome reappearance. It seems that the memories of 2007-09 have faded. It is totally normal for long periods of extremely easy money to be accompanied by growing leverage and increasingly speculative financial activities, and I don’t see why this period should be any different. And often, the objects of speculation are not discovered until financial conditions become restrictive. Finally, there are huge risks associated with rising protectionism, the Chinese economy appears to be struggling, Italy’s banks are a mess, and the Brexit fiasco poses a threat to the U.K. economy. Starting with the U.S., please go ahead and convince me why a recession is more than a year away. BCA: It is natural for you to worry that a recession is right around the corner. The current U.S. economic expansion will become the longest on record if it makes it to July 2019, at which point it will surpass the 1990s expansion. Economists have a long and sad history of failing to forecast recessions. Therefore, a great deal of humility is warranted when it comes to predicting the evolution of the business cycle. The Great Recession was one of the deepest downturns on record and the recovery has been fairly sluggish by historic standards. Thus, it has taken much longer than usual for the U.S. economy to return to full employment. Looking out, there are many possible risks that could trip up the U.S. economy but, for the moment, we see no signs of recession on the horizon (Chart 2). For example, the leading economic indicator is still in an uptrend, the yield curve has not inverted and our monetary indicators are not contracting. Our proprietary recession indicator also suggests that the risk is currently low, although recent stock market weakness implies some deterioration. Chart 2Few U.S Recession 'Red Flags'
Few U.S Recession 'Red Flags'
Few U.S Recession 'Red Flags'
The buildup in corporate debt is a cause for concern and we are not buyers of corporate bonds at current yields. However, the impact of rising yields on the economy is likely to be manageable. The interest coverage ratio for the economy as a whole – defined as the profits corporations generate for every dollar of interest paid – is still above its historic average (Chart 3). Corporate bonds are also generally held by non-leveraged investors such as pension funds, insurance companies, and ETFs. The impact of defaults on the economy tends to be more severe when leveraged institutions are the ones that suffer the greatest losses. Chart 3Interest Costs Not Yet A Headwind
Interest Costs Not Yet A Headwind
Interest Costs Not Yet A Headwind
We share your worries about the long-term fiscal outlook. However, large budget deficits do not currently imperil the economy. The U.S. private sector is running a financial surplus, meaning that it earns more than it spends (Chart 4). Not only does this make the economy more resilient, it also provides the government with additional savings with which to finance its budget deficit. If anything, the highly accommodative stance of fiscal policy has pushed up the neutral rate of interest, giving the Fed greater scope to raise rates before monetary policy enters restrictive territory. The impetus of fiscal policy on the economy will be smaller in 2019 than it was in 2018, but it will still be positive (Chart 5). Chart 4The U.S. Private Sector Is Helping To Finance The Fiscal Deficit
The U.S. Private Sector Is Helping To Finance The Fiscal Deficit
The U.S. Private Sector Is Helping To Finance The Fiscal Deficit
Chart 5U.S. Fiscal Policy Still Stimulative In 2019
U.S. Fiscal Policy Still Stimulative In 2019
U.S. Fiscal Policy Still Stimulative In 2019
The risks to growth are more daunting outside the U.S. As you point out, Italy is struggling to contain borrowing costs, a dark cloud hangs over the Brexit negotiations, and China and most other emerging markets have seen growth slow meaningfully. The U.S., however, is a relatively closed economy – it is not as dependent on trade as most other countries. Its financial system is reasonably resilient thanks to the capital its banks have raised over the past decade. In addition, Dodd-Frank and other legislation have made it more difficult for financial institutions to engage in reckless risk-taking. Mr. X: I would never take a benign view of the ability and willingness of financial institutions to engage in reckless behavior, but maybe I am too cynical. Even if you are right that debt does not pose an immediate threat to the market, surely it will become a huge problem in the next downturn. If the U.S. federal deficit is $1 trillion when the economy is strong, it is bound to reach unimaginable levels in a recession. And, to make matters worse, the Federal Reserve may not have much scope to lower interest rates if they peak at a historically low level in the next year or so. What options will policymakers have to respond to the next cyclical downturn? Is there a limit to how much quantitative easing central banks can do? BCA: The Fed is aware of the challenges it faces if the next recession begins when interest rates are still quite low. Raising rates rapidly in order to have more “ammunition” for counteracting the downturn would hardly be the best course of action as this would only bring forward the onset of the recession. A better strategy is to let the economy overheat a bit so that inflation rises. This would allow the Fed to push real rates further into negative territory if the recession turns out to be severe. There is no real limit on how much quantitative easing the Fed can undertake. The FOMC will undoubtedly turn to asset purchases and forward guidance again during the next economic downturn. Now that the Fed has crossed the Rubicon into unorthodox monetary policy without generating high inflation, policymakers are likely to try even more exotic policies, such as price-level targeting. The private sector tends to try to save more during recessions. Thus, even though the fiscal deficit would widen during the next downturn, there should be plenty of buyers for government debt. However, once the next recovery begins, the Fed may feel increasing political pressure to keep rates low in order to allow the government to maintain its desired level of spending and taxes. The Fed guards its independence fiercely, but in a world of increasingly political populism, that independence may begin to erode. This will not happen quickly, but to the extent that it does occur, higher inflation is likely to be the outcome. Ms. X: I would like to explore the U.S.-China dynamic a bit more because I see that as one of the main challenges to my more optimistic view. I worry that President Trump will continue to take a hard line on China trade because it plays well with his base and has broad support in Congress. And I equally worry that President Xi will not want to be seen giving in to U.S. bullying. How do you see this playing out? BCA: Investors hoping that U.S. President Donald Trump and his Chinese counterpart Xi Jinping will reach a deal to end the trade war on the sidelines of the forthcoming G20 leaders' summit in Buenos Aires are likely to be disappointed. President Trump's fiscal policy is completely inconsistent with his trade agenda. Fiscal stimulus in a full-employment economy will suck in imports. It also forces the Fed to raise rates more aggressively than it otherwise would, leading to a stronger dollar. The result will be a larger U.S. trade deficit. Trump will not be able to blame Canada or Mexico for a deteriorating trade position because he just signed a trade agreement with them. The new USMCA agreement is remarkably similar to NAFTA, with the notable exception that it contains a clause barring Canada and Mexico from negotiating bilateral trade deals with China. This means Trump needs a patsy who will take the blame for America's burgeoning trade deficit and China will fill that role. For his part, President Xi knows full well that he will still be China’s leader when Trump is long gone. Giving in to Trump’s demands would hurt him politically. All this means that the trade war will persist. Mr. X: I see a trade war as a major threat to the economy, but it is not the only thing that could derail the economic expansion. Let’s explore that issue in more detail. The Economic Outlook Mr. X: You have shown in previous research that housing is often a very good leading indicator of the U.S. economy, largely because it is very sensitive to changes in the monetary environment. Are you not concerned about the marked deterioration in recent U.S. housing data? BCA: Recent trends in housing have indeed been disappointing, with residential investment acting as a drag on growth for three consecutive quarters. The weakness has been broad-based with sales, the rate of price appreciation of home prices, and builder confidence all declining (Chart 6). Even though the level of housing affordability is decent by historical standards, there has been a fall in the percentage of those who believe that it is a good time to buy a home. Chart 6Recent Softness In U.S. Housing
Recent Softness In U.S. Housing
Recent Softness In U.S. Housing
There are a few possible explanations for the weakness. First, the 2007-09 housing implosion likely had a profound and lasting impact on the perceived attractiveness of home ownership. The homeownership rate for people under 45 has remained extremely low by historical standards. Secondly, increased oversight and tighter regulations have curbed mortgage supply. Finally, the interest rate sensitivity of the sector may have increased with the result that even modest increases in the mortgage rate have outsized effects. That, in turn, could be partly explained by recent tax changes that capped the deduction on state and local property taxes, while lowering the limit on the tax deductibility of mortgage interest. The trend in housing is definitely a concern, but the odds of a further major contraction seem low. Unlike in 2006, the home vacancy rate stands near record levels and the same is true for the inventory of homes. The pace of housebuilding is below the level implied by demographic trends and consumer fundamentals are reasonably healthy. The key to the U.S. economy lies with business investment and consumer spending and these areas are well supported for the moment. Consumers are benefiting from continued strong growth in employment and a long overdue pickup in wages. Meanwhile, the ratio of net worth-to-income has surpased the previous peak and the ratio of debt servicing-to-income is low (Chart 7). Last year, we expressed some concern that the depressed saving rate might dampen spending, but the rate has since been revised substantially higher. Based on its historical relationship with U.S. household net worth, there is room for the saving rate to fall, fueling more spending. Real consumer spending has grown by 3% over the past year and there is a good chance of maintaining that pace during most of 2019. Chart 7U.S. Consumer Fundamentals Are Healthy
U.S. Consumer Fundamentals Are Healthy
U.S. Consumer Fundamentals Are Healthy
Turning to capital spending, the cut in corporate taxes was obviously good for cash flow, and surveys show a high level of business confidence. Moreover, many years of business caution toward spending has pushed up the average age of the nonresidential capital stock to the highest level since 1963 (Chart 8). Higher wages should also incentivize firms to invest in more machinery. Absent some new shock to confidence, business investment should stay firm during the next year. Chart 8An Aging Capital Stock
An Aging Capital Stock
An Aging Capital Stock
Overall, we expect the pace of U.S. economic growth to slow from its recent strong level, but it should hold above trend, currently estimated to be around 2%. As discussed earlier, that means capacity pressures will intensify, causing inflation to move higher. Ms. X: I share the view that the U.S. economy will continue to grow at a healthy pace, but I am less sure about the rest of the world. BCA: You are right to be concerned. We expected U.S. and global growth to diverge in 2018, but not by as much as occurred. Several factors have weighed on CEO confidence outside of the U.S., including trade wars, a strong dollar, higher oil prices, emerging market turbulence, the return of Italian debt woes, and a slowdown in the Chinese economy. The stress has shown up in the global manufacturing PMI, although the latter is still at a reasonably high level (Chart 9). Global export growth is moderating and the weakness appears to be concentrated in capex. Capital goods imports for the major economies, business investment, and the production of investment-related goods have all decelerated this year. Chart 9Global Manufacturing Slowdown
Global Manufacturing Slowdown
Global Manufacturing Slowdown
Our favorite global leading indicators are also flashing yellow (Chart 10). BCA’s global leading economic indicator has broken below the boom/bust line and its diffusion index suggests further downside. The global ZEW composite and the BCA boom/bust indicator are both holding below zero. Chart 10Global Growth Leading Indicators
Global Growth Leading Indicators
Global Growth Leading Indicators
Current trends in the leading indicators shown in Chart 11 imply that the growth divergence between the U.S. and the rest of the world will remain a key theme well into 2019. Among the advanced economies, Europe and Japan are quite vulnerable to the global soft patch in trade and capital spending. Chart 11Global Economic Divergence Will Continue
Global Economic Divergence Will Continue
Global Economic Divergence Will Continue
The loss of momentum in the Euro Area economy, while expected, has been quite pronounced. Part of this is due to the dissipation of the 2016/17 economic boost related to improved health in parts of the European banking system that sparked a temporary surge in credit growth. The tightening in Italian financial conditions following the government’s budget standoff with the EU has weighed on overall Euro Area growth. Softer Chinese demand for European exports, uncertainties related to U.S. trade policy and the torturous Brexit negotiations, have not helped the situation. Real GDP growth decelerated to close to a trend pace by the third quarter of 2018. The manufacturing PMI has fallen from a peak of 60.6 in December 2017 to 51.5, mirroring a 1% decline in the OECD’s leading economic indicator for the region. Not all the economic news has been bleak. Both consumer and industrial confidence remain at elevated levels according to the European Commission (EC) surveys, consistent with a resumption of above-trend growth. Even though exports have weakened substantially from the booming pace in 2017, the EC survey on firms’ export order books remains at robust levels (Chart 12). Importantly for the Euro Area, the bank credit impulse has moved higher.The German economy should also benefit from a rebound in vehicle production which plunged earlier this year following the introduction of new emission standards. Chart 12Europe: Slowing, But No Disaster
Europe: Slowing, But No Disaster
Europe: Slowing, But No Disaster
We interpret the 2018 Euro Area slowdown as a reversion-to-the-mean rather than the start of an extended period of sub-trend growth. Real GDP growth should fluctuate slightly above trend pace through 2019. Given that the Euro Area’s output gap is almost closed, the ECB will not deviate from its plan to end its asset purchase program by year end. Gradual rate hikes should begin late in 2019, assuming that inflation is closer to target by then. In contrast, the Bank of Japan (BoJ) is unlikely to change policy anytime soon. The good news is that wages have finally begun to grow at about a 2% pace, although it required extreme labor shortages. Yet, core inflation is barely positive and long-term inflation expectations are a long way from the 2% target. The inflation situation will have to improve significantly before the BoJ can consider adjusting or removing the Yield Curve Control policy. This is especially the case since the economy has hit a bit of an air pocket and the government intends to raise the VAT in 2019. Japan’s industrial production has stalled and we expect the export picture to get worse before it gets better. We do not anticipate any significant economic slack to develop, but even a sustained growth slowdown could partially reverse the gains that have been made on the inflation front. Ms. X: We can’t talk about the global economy without discussing China. You have noted in the past how the authorities are walking a tightrope between trying to unwind the credit bubble and restructure the economy on the one hand, and prevent a destabilizing economic and financial crisis on the other. Thus far, they have not fallen off the tightrope, but there has been limited progress in resolving the country’s imbalances. And now the authorities appear to be stimulating growth again, risking an even bigger buildup of credit. Can it all hold together for another year? BCA: That’s a very good question. Thus far, there is not much evidence that stimulus efforts are working. Credit growth is still weak and leading economic indicators have not turned around (Chart 13). There is thus a case for more aggressive reflation, but the authorities also remain keen to wean the economy off its addiction to debt. Chart 13China: No Sign Of Reacceleration
China: Credit Impulse Remains Weak
China: Credit Impulse Remains Weak
Waves of stimulus have caused total debt to soar from 140% of GDP in 2008 to about 260% of GDP at present (Chart 14). As is usually the case, rapid increases in leverage have been associated with a misallocation of capital. Since most of the new credit has been used to finance fixed-asset investment, the result has been overcapacity in a number of areas. For example, the fact that 15%-to-20% of apartments are sitting vacant is a reflection of overbuilding. Meanwhile, the rate of return on assets in the state-owned corporate sector has fallen below borrowing costs. Chart 14China: Debt Still Rising
China: Debt Still Rising
China: Debt Still Rising
Chinese exports are holding up well so far, but this might only represent front-running ahead of the implementation of higher tariffs. Judging from the steep drop in the export component of both the official and private-sector Chinese manufacturing PMI, exports are likely to come under increasing pressure over the next few quarters as the headwinds from higher tariffs fully manifest themselves (Chart 15). Chart 15Chinese Exports About To Suffer
Chinese Exports About To Suffer
Chinese Exports About To Suffer
The most likely outcome is that the authorities will adjust the policy dials just enough to stabilize growth sometime in the first half of 2019. The bottoming in China’s broad money impulse offers a ray of hope (Chart 16). Still, it is a tentative signal at best and it will take some time before this recent easing in monetary policy shows up in our credit impulse measure and, later, economic growth. A modest firming in Chinese growth in the second half of 2019 would provide a somewhat stronger demand backdrop for commodities and emerging economies that sell goods to China. Chart 16A Ray Of Hope From Broad Money
bca.bca_mp_2018_12_01_c16
bca.bca_mp_2018_12_01_c16
Ms. X: If you are correct about a stabilization in the Chinese economy next year, this presumably would be good news for emerging economies, especially if the Fed goes on hold. EM assets have been terribly beaten down and I am looking for an opportunity to buy. BCA: Fed rate hikes might have been the catalyst for the past year’s pain in EM assets, but it is not the underlying problem. As we highlighted at last year’s meeting, the troubles for emerging markets run much deeper. Our long-held caution on emerging economies and markets is rooted in concern about deteriorating fundamentals. Excessive debt is a ticking time bomb for many of these countries; EM dollar-denominated debt is now as high as it was in the late 1990s as a share of both GDP and exports (Chart 17). Moreover, the declining long-term growth potential for emerging economies as a group makes it more difficult for them to service the debt. The structural downtrend in EM labor force and productivity growth underscores that trend GDP growth has collapsed over the past three decades (Chart 17, bottom panel). Chart 17EM Debt A Problem Given Slowing Supply-Side...
EM Debt A Problem Given Slowing Supply-Side...
EM Debt A Problem Given Slowing Supply-Side...
Decelerating global growth has exposed these poor fundamentals. EM sovereign spreads have moved wider in conjunction with falling PMIs and slowing industrial production and export growth. And it certainly does not help that the Fed is tightening dollar-based liquidity conditions. EM equities usually fall when U.S. financial conditions tighten (Chart 18). Chart 18...And Tightening Financial Conditions
...And Tightening Financial Conditions
...And Tightening Financial Conditions
Chart 19 highlights the most vulnerable economies in terms of foreign currency funding requirements, and foreign debt-servicing obligations relative to total exports. Turkey stands out as the most vulnerable, along with Argentina, Brazil, Indonesia, Chile, and Colombia. In contrast, Emerging Asia appears to be in better shape relative to the crisis period of the late 1990s. Chart 19Spot The Outliers
OUTLOOK 2019: Late-Cycle Turbulence
OUTLOOK 2019: Late-Cycle Turbulence
The backdrop for EM assets is likely to get worse in the near term, given our view that the Fed will continue to tighten and China will be cautious about stimulating more aggressively. Our base case outlook sees some relief in the second half of 2019, but it is more of a “muddle-through” scenario than a V-shaped economic recovery. Mr. X: Perhaps EM assets could enjoy a bounce next year if the Chinese economy stabilizes, but the poor macro fundamentals you mentioned suggest that it would be a trade rather than a buy-and-hold proposition. I am inclined to avoid the whole asset class in 2019. Bond Market Prospects Ms. X: Let’s turn to fixed income now. I was bearish on bonds in 2018, but yields have risen quite a bit, at least in the United States. The Fed has lifted the fed funds rate by 100 basis points over the past year and I don’t see a lot of upside for inflation. So perhaps yields have peaked and will move sideways in 2019, which would be good for stocks in my view. BCA: Higher yields have indeed improved bond value recently. Nonetheless, they are not cheap enough to buy at this point (Chart 20). The real 10-year Treasury yield, at close to 1%, is still depressed by pre-Lehman standards. Long-term real yields in Germany and Japan remain in negative territory at close to the lowest levels ever recorded. Chart 20Real Yields Still Very Depressed
Real Yields Still Very Depressed
Real Yields Still Very Depressed
We called the bottom in global nominal bond yields in 2016. Our research at the time showed that the cyclical and structural factors that had depressed yields were at an inflection point, and were shifting in a less bond-bullish direction. Perhaps most important among the structural factors, population aging and a downward trend in underlying productivity growth resulted in lower equilibrium bond yields over the past couple of decades. Looking ahead, productivity growth could stage a mild rebound in line with the upturn in the growth rate of the capital stock (Chart 21). As for demographics, the age structure of the world population is transitioning from a period in which aging added to the global pool of savings to one in which aging is beginning to drain that pool as people retire and begin to consume their nest eggs (Chart 22). The household saving rates in the major advanced economies should trend lower in the coming years, placing upward pressure on equilibrium global bond yields. Chart 21Productivity Still Has Some Upside
Productivity Still Has Some Upside
Productivity Still Has Some Upside
Chart 22Demographics Past The Inflection Point
Demographics Past The Inflection Point
Demographics Past The Inflection Point
Cyclical factors are also turning against bonds. U.S. inflation has returned to target and the Fed is normalizing short-term interest rates. The market currently is priced for only one more rate hike after December 2018 in this cycle, but we see rates rising more than that. Treasury yields will follow as market expectations adjust. Long-term inflation expectations are still too low in the U.S. and most of the other major economies to be consistent with central banks’ meeting their inflation targets over the medium term. As actual inflation edges higher, long-term expectations built into bond yields will move up. The term premium portion of long-term bond yields is also too low. This is the premium that investors demand to hold longer-term bonds. Our estimates suggest that the term premium is still negative in the advanced economies outside of the U.S., which is not sustainable over the medium term (Chart 23). Chart 23Term Premia Are Too Low
Term Premia Are Too Low
Term Premia Are Too Low
We expect term premia to rise for two main reasons. First, investors have viewed government bonds as a good hedge for their equity holdings because bond prices have tended to rise when stock prices fell. Investors have been willing to pay a premium to hold long-term bonds to benefit from this hedging effect. But the correlation is now beginning to change as inflation and inflation expectations gradually adjust higher and output gaps close. As the hedging benefit wanes, the term premium should rise back into positive territory. Second, central bank bond purchases and forward guidance have depressed yields as well as interest-rate volatility. The latter helped to depress term premia in the bond market. This effect, too, is beginning to unwind. The Fed is letting its balance sheet shrink by about $50 billion per month. The Bank of England has kept its holdings of gilts and corporate bonds constant for over a year, while the ECB is about to end asset purchases. The Bank of Japan continues to buy assets, but at a much reduced pace. All this means that the private sector is being forced to absorb a net increase in government bonds for the first time since 2014 (Chart 24). Chart 25 shows that bond yields in the major countries will continue to trend higher as the rapid expansion of central bank balance sheets becomes a thing of the past. Chart 24Private Sector To Absorb More Bonds
OUTLOOK 2019: Late-Cycle Turbulence
OUTLOOK 2019: Late-Cycle Turbulence
Chart 25QE Unwind Will Weigh On Bond Prices
QE Unwind Will Weigh On Bond Prices
QE Unwind Will Weigh On Bond Prices
Ms. X: I’m not a fan of bonds at these levels, but that sounds overly bearish to me, especially given the recent plunge in oil prices. BCA: Lower oil prices will indeed help to hold down core inflation to the extent that energy prices leak into non-energy prices in the near term. Nonetheless, in the U.S., this effect will be overwhelmed by an overheated economy. From a long-term perspective, we believe that investors still have an overly benign view of the outlook for yields. The market expects that the 10-year Treasury yield in ten years will only be slightly above today’s spot yield, which itself is still very depressed by historical standards (Chart 26). And that also is the case in the other major bond markets. Chart 26Forward Yields Are Too Low
Forward Yields Are Too Low
Forward Yields Are Too Low
Of course, it will not be a straight line up for yields – there will be plenty of volatility. We expect the 10-year Treasury yield to peak sometime in 2019 or early 2020 in the 3.5%-to-4% range, before the next recession sends yields temporarily lower. Duration should be kept short at least until the middle of 2019, with an emphasis on TIPS relative to conventional Treasury bonds. We will likely downgrade TIPS versus conventionals once long-term inflation expectations move into our target range, which should occur sometime during 2019. The ECB and Japan will not be in a position to raise interest rates for some time, but the bear phase in U.S. Treasurys will drag up European and Japanese bond yields (at the very long end of the curve for the latter). Total returns are likely to be negative in all of the major bond markets in 2019. Real 10-year yields in all of the advanced economies are still well below their long-term average, except for Greece, Italy and Portugal (Chart 27). Chart 27Valuation Ranking Of Developed Bond Markets
OUTLOOK 2019: Late-Cycle Turbulence
OUTLOOK 2019: Late-Cycle Turbulence
Within global bond portfolios, we recommend being underweight bond markets where central banks are in a position to raise short-term interest rates (the U.S. and Canada), and overweight those that are not (Japan and Australia). The first ECB rate hike is unlikely before the end of 2019. However, the imminent end of the asset purchase program argues for no more than a benchmark allocation to core European bond markets within global fixed-income portfolios, especially since real 10-year yields in parts of continental Europe are the furthest below their long-term average. We are overweight gilts at the moment, but foresee shifting to underweight in 2019, depending on how Brexit plays out. Ms. X: What about corporate bonds? I know that total returns for corporates will be poor if government bond yields are rising. But you recommended overweighting corporate bonds relative to Treasurys last year. Given your view that the next U.S. recession is more than a year away, it seems reasonable to assume they will outperform government bonds. BCA: We were overweight corporates in the first half of 2018, but took profits in June and shifted to neutral at the same time that we downgraded our equity allocation. Spreads had tightened to levels that did not compensate investors for the risks. Recent spread widening has returned some value to U.S. corporates. The 12-month breakeven spreads for A-rated and Baa-rated corporate bonds are almost back up to their 50th percentile relative to history (Chart 28). Still, these levels are not attractive enough to justify buying based on valuation alone. As for high-yield, any rise in the default rate would quickly overwhelm the yield pickup in this space. Chart 28Corporate Bond Yields Still Have Upside
Corporate Bond Yields Still Have Upside
Corporate Bond Yields Still Have Upside
It is possible that some of the spread widening observed in October and November will reverse, but corporates offer a poor risk/reward tradeoff, even if the default rate stays low. Corporate profit growth is bound to decelerate in 2019. This would not be a disaster for equities, but slowing profit growth is more dangerous for corporate bond excess returns because the starting point for leverage is already elevated. As discussed above, at a macro level, the aggregate interest coverage ratio for the U.S. corporate sector is decent by historical standards. However, this includes mega-cap companies that have little debt and a lot of cash. Our bottom-up research suggests that interest coverage ratios for firms in the Bloomberg Barclays corporate bond index will likely drop close to multi-decade lows during the next recession, sparking a wave of downgrade activity and fallen angels. Seeing this coming, investors may require more yield padding to compensate for these risks as profit growth slows. Our next move will likely be to downgrade corporate bonds to underweight. We are watching the yield curve, bank lending standards, profit growth, and monetary indicators for signs to further trim exposure. You should already be moving up in quality within your corporate bond allocation. Mr. X: We have already shifted to underweight corporate bonds in our fixed income portfolio. Even considering the cheapening that has occurred over the past couple of months, spread levels still make no sense in terms of providing compensation for credit risk. Equity Market Outlook Ms. X: While we all seem to agree that corporate bonds are not very attractive, I believe that enough value has been restored to equities that we should upgrade our allocation, especially if the next recession is two years away. And I know that stocks sometimes have a powerful blow-off phase before the end of a bull market. Mr. X: This is where I vehemently disagree with my daughter. The recent sell-off resembles a bloodbath in parts of the global market. It has confirmed my worst fears, especially related to the high-flying tech stocks that I believe were in a bubble. Hopes for a blow-off phase are wishful thinking. I’m wondering if the sell-off represents the beginning of an extended bear market. BCA: Some value has indeed been restored. However, the U.S. market is far from cheap relative to corporate fundamentals. The trailing and 12-month forward price-earnings ratios (PER) of 20 and 16, respectively, are still far above their historical averages, especially if one leaves out the tech bubble period of the late 1990s. And the same is true for other metrics such as price-to-sales and price-to-book value (Chart 29). BCA’s composite valuation indicator, based on 8 different valuation measures, is only a little below the threshold of overvaluation at +1 standard deviation because low interest rates still favor equities on a relative yield basis. Chart 29U.S. Equities Are Not Cheap
U.S. Equities Are Not Cheap
U.S. Equities Are Not Cheap
It is true that equities can reward investors handsomely in the final stage of a bull market. Chart 30 presents cumulative returns to the S&P 500 in the last nine bull markets. The returns are broken down by quintile. The greatest returns, unsurprisingly, generally occur in the first part of the bull market (quintile 1). But total returns in the last 20% of the bull phase (quintile 5) have been solid and have beaten the middle quartiles. Chart 30Late-Cycle Blow-Offs Can Be Rewarding
OUTLOOK 2019: Late-Cycle Turbulence
OUTLOOK 2019: Late-Cycle Turbulence
Of course, the tricky part is determining where we are in the bull market. We have long viewed financial markets through the lens of money and credit. This includes a framework that involves the Fed policy cycle. The historical track record for risk assets is very clear; they tend to perform well when the fed funds rate is below neutral, whether rates are rising or falling. Risk assets tend to underperform cash when the fed funds rate is above neutral (Table 3). Table 3Stocks Do Well When The Fed Funds Rate Is Below Neutral
OUTLOOK 2019: Late-Cycle Turbulence
OUTLOOK 2019: Late-Cycle Turbulence
We believe the fed funds rate is still in easy territory. This suggests that it is too early to shift to underweight on risk assets. We may even want to upgrade to overweight if stocks become cheap enough, as long as Fed policy is not restrictive. That said, there is huge uncertainty about the exact level of rates that constitutes “neutral” (or R-star in the Fed’s lingo). Even the Fed is unsure. This means that we must watch for signs that the fed funds rate has crossed the line into restrictive territory as the FOMC tightens over the coming year. An inversion of the 3-month T-bill/10-year yield curve slope would be a powerful signal that policy has become tight, although the lead time of an inverted curve and declining risk asset prices has been quite variable historically. Finally, it is also important to watch U.S. profit margins. Some of our research over the past couple of years focused on the late-cycle dynamics of previous long expansions, such as the 1960s, 1980s and 1990s. We found that risk assets came under pressure once U.S. profit margins peaked. Returns were often negative from the peak in margins to the subsequent recession. Mr. X: U.S. profit margins must be close to peak levels. I’ve seen all sorts of anecdotal examples of rising cost pressures, not only in the labor market. BCA: We expected to see some margin pressure to appear by now. S&P 500 EPS growth will likely top out in the next couple of quarters, if only because the third quarter’s 26% year-over-year pace is simply not sustainable. But it is impressive that our margin proxies are not yet flagging an imminent margin squeeze, despite the pickup in wage growth (Chart 31). Chart 31U.S. Margin Indicators Still Upbeat
U.S. Margin Indicators Still Upbeat
U.S. Margin Indicators Still Upbeat
Margins according to the National Accounts (NIPA) data peaked in 2014 and have since diverged sharply with S&P 500 operating margins. It is difficult to fully explain the divergence. The NIPA margin is considered to be a better measure of underlying U.S. corporate profitability because it includes all companies (not just 500), and it is less subject to accounting trickery. That said, even the NIPA measure of margins firmed a little in 2018, along with the proxies we follow that correlate with the S&P 500 measure. The bottom line is that the macro variables that feed into our top-down U.S. EPS model point to a continuing high level of margins and fairly robust top-line growth, at least for the near term. For 2019, we assumed slower GDP growth and incorporated some decline in margins into our projection just to err on the conservative side. Nonetheless, our EPS model still projects a respectable 8% growth rate at the end of 2019 (Chart 32). The dollar will only be a minor headwind to earnings growth unless it surges by another 10% or more. Chart 32EPS Growth Forecasts
EPS Growth Forecasts
EPS Growth Forecasts
The risks to EPS growth probably are to the downside relative to our forecast, but the point is that U.S. earnings will likely remain supportive for the market unless economic growth is much weaker than we expect. None of this means that investors should be aggressively overweight stocks now. We trimmed our equity recommendation to benchmark in mid-2018 for several reasons. At the time, value was quite poor and bottom-up earnings expectations were too high, especially on a five-year horizon. Also, sentiment measures suggested that investors were overly complacent. As you know, we are always reluctant to chase markets into highly overvalued territory, especially when a lot of good news has been discounted. As we have noted, we are open to temporarily shifting back to overweight in equities and other risk assets. The extension of the economic expansion gives more time for earnings to grow. The risks facing the market have not eased much but, given our base-case macro view, we would be inclined to upgrade equities if there is another meaningful correction. Of course, our profit, monetary and economic indicators would have to remain supportive to justify an upgrade. Mr. X: But you are bearish on bonds. We saw in October that the equity market is vulnerable to higher yields. BCA: It certainly won’t be smooth sailing through 2019 as interest rates normalize. Until recently, higher bond yields reflected stronger growth without any associated fears that inflation was a growing problem. The ‘Fed Put’ was seen as a key backstop for the equity bull market. But now that the U.S. labor market is showing signs of overheating, the bond sell-off has become less benign for stocks because the Fed will be less inclined to ease up at the first sign of trouble in the equity market. How stocks react in 2019 to the upward trend in yields depends a lot on the evolution of actual inflation and long-term inflation expectations. If core PCE inflation hovers close to or just above 2% for a while, then the Fed Put should still be in place. However, it would get ugly for both bonds and stocks if inflation moves beyond 2.5%. Our base case is that this negative dynamic won’t occur until early 2020, but obviously the timing is uncertain. One key indicator to watch is long-term inflation expectations, such as the 10-year TIPS breakeven inflation rate (Chart 33). It is close to 2% at the moment. If it shifts up into the 2.3%-2.5% range, it would confirm that inflation expectations have returned to a level that is consistent with the Fed meeting its 2% inflation target on a sustained basis. This would be a signal to the Fed that it is must become more aggressive in calming growth, with obvious negative consequences for risk assets. Chart 33Watch For A Return To 2.3%-2.5% Range
Watch For A Return To 2.3%-2.5% Range
Watch For A Return To 2.3%-2.5% Range
Mr. X: I am skeptical that the U.S. corporate sector can pull off an 8% earnings gain in 2019. What about the other major markets? Won’t they get hit hard if global growth continues to slow as you suggest? BCA: Yes, that is correct. It is not surprising that EPS growth has already peaked in the Euro Area and Japan. The profit situation is going to deteriorate quickly in the coming quarters. Industrial production growth in both economies has already dropped close to zero, and we use this as a proxy for top-line growth in our EPS models. Nominal GDP growth has decelerated sharply in both economies in absolute terms and relative to the aggregate wage bill. These trends suggest that profit margins are coming under significant downward pressure. Even when we build in a modest growth pickup and slight rebound in margins in 2019, EPS growth falls close to zero by year-end according to our models. Both the Euro Area and Japanese equity markets are cheap relative to the U.S., based on our composite valuation indicators (Chart 34). However, neither is above the threshold of undervaluation (+1 standard deviation) that would justify overweight positions on valuation alone. We think the U.S. market will outperform the other two at least in the first half of 2019 in local and, especially, common-currency terms. Chart 34Valuation Of Nonfinancial Equity Markets Relative To The U.S.
OUTLOOK 2019: Late-Cycle Turbulence
OUTLOOK 2019: Late-Cycle Turbulence
Ms. X: It makes sense that U.S. profit growth will outperform the other major developed countries in 2019. I would like to circle back to emerging market assets. I understand that many emerging economies have deep structural problems. But you admitted that the Chinese authorities will eventually stimulate enough to stabilize growth, providing a bounce in EM growth and asset prices next year. These assets seem cheap enough to me to warrant buying now in anticipation of that rally. As we all know, reversals from oversold levels can happen in a blink of an eye and I don’t want to miss it. BCA: We are looking for an opportunity to buy as well, but are wary of getting in too early. First, valuation has improved but is not good enough on its own to justify buying now. EM stocks are only moderately undervalued based on our EM composite valuation indicator and the cyclically-adjusted P/E ratio (Chart 35). EM currencies are not particularly cheap either, outside of Argentina, Turkey and Mexico (Charts 36A and 36B). Valuation should only play a role in investment strategy when it is at an extreme, and this is not the case for most EM countries. Chart 35EM Stocks Are Not At Capitulation Levels...
bca.bca_mp_2018_12_01_c35
bca.bca_mp_2018_12_01_c35
Chart 36A…And Neither Are EM Currencies
...And Neither Are EM Currencies
...And Neither Are EM Currencies
Chart 36B…And Neither Are EM Currencies
...And Neither Are EM Currencies
...And Neither Are EM Currencies
Second, corporate earnings growth has plenty of downside potential in the near term. Annual growth in EM nonfinancial EBITDA, currently near 10%, is likely to turn negative next year, based on our China credit and fiscal impulse indicator (Chart 37). And, as we emphasized earlier, China is not yet pressing hard on the gas pedal. Chart 37EM Earnings Growth: Lots Of Downside
EM Earnings Growth: Lots Of Downside
EM Earnings Growth: Lots Of Downside
Third, it will take time for more aggressive Chinese policy stimulus, if it does occur, to show up in EM stocks and commodity prices. Trend changes in money growth and our credit and fiscal impulse preceded the trough in EM stocks and commodity prices in 2015, and again at the top in stocks and commodities in 2017 (Chart 38). However, even if these two indicators bottom today, it could take several months before the sell-off in EM financial markets and commodity prices abates. Chart 38Chinese Money And Credit Leads EM And Commodities
Chinese Money And Credit Leads EM And Commodities
Chinese Money And Credit Leads EM And Commodities
Finally, if Chinese stimulus comes largely via easier monetary policy rather than fiscal stimulus, then the outcome will be a weaker RMB. We expect the RMB to drift lower in any event, because rate differentials vis-à-vis the U.S. will move against the Chinese currency next year. A weaker RMB would add to the near-term headwinds facing EM assets. The bottom line is that the downside risks remain high enough that you should resist the temptation to bottom-fish until there are concrete signs that the Chinese authorities are getting serious about boosting the economy. We are also watching for signs outside of China that the global growth slowdown is ending. This includes our global leading economic indicator and data that are highly sensitive to global growth, such as German manufacturing foreign orders. Mr. X: Emerging market assets would have to become a lot cheaper for me to consider buying. Debt levels are just too high to be sustained, and stronger Chinese growth would only provide a short-term boost. I’m not sure I would even want to buy developed market risk assets based solely on some Chinese policy stimulus. BCA: Yes, we agree with your assessment that buying EM in 2019 would be a trade rather than a buy-and-hold strategy. Still, the combination of continued solid U.S. growth and a modest upturn in the Chinese economy would alleviate a lot of investors’ global growth concerns. The result could be a meaningful rally in pro-cyclical assets that you should not miss. We are defensively positioned at the moment, but we could see becoming more aggressive in 2019 on signs that China is stimulating more firmly and/or our global leading indicators begin to show some signs of life. Besides upgrading our overall equity allocation back to overweight, we would dip our toes in the EM space again. At the same time, we will likely upgrade the more cyclical DM equity markets, such as the Euro Area and Japan, while downgrading the defensive U.S. equity market to underweight. We are currently defensively positioned in terms of equity sectors, but it would make sense to shift cyclicals to overweight at the same time. Exact timing is always difficult, but we expect to become more aggressive around the middle of 2019. We also think the time is approaching to favor long-suffering value stocks over growth stocks. The relative performance of growth-over-value according to standard measures has become a sector call over the past decade: tech or financials. The sector skew complicates this issue, especially since tech stocks have already cracked. But we have found that stocks that are cheap within equity sectors tend to outperform expensive (or growth) stocks once the fed funds rate moves into restrictive territory. This is likely to occur in the latter half of 2019. Value should then have its day in the sun. Currencies: Mr. X: We don’t usually hedge our international equity exposure, so the direction of the dollar matters a lot to us. As you predicted a year ago, the U.S. dollar reigned supreme in 2018. Your economic views suggest another good year in 2019, but won’t this become a problem for the economy? President Trump’s desire to lower the U.S. trade deficit suggests that the Administration would like the dollar to drop and we could get some anti-dollar rhetoric from the White House. Also, it seems that the consensus is strongly bullish on the dollar which is always a concern. BCA: The outlook for the dollar is much trickier than it was at the end of 2017. As you highlighted, traders are already very long the dollar, implying that the hurdle for the greenback to surprise positively is much higher now. However, a key driver for the dollar is the global growth backdrop. If the latter is poor in the first half of 2019 as we expect, it will keep a bid under the greenback. Interest rates should also remain supportive for the dollar. As we argued earlier, current market expectations – only one more Fed hike after the December meeting – are too sanguine. If the Fed increases rates by more than currently discounted, the dollar’s fair value will rise, especially if global growth continues to lag that of the U.S. Since the dollar’s 2018 rally was largely a correction of its previous undervaluation, the currency has upside potential in the first half of the year (Chart 39). Chart 39U.S. Dollar Not Yet Overvalued
U.S. Dollar Not Yet Overvalued
U.S. Dollar Not Yet Overvalued
A stronger dollar will dampen foreign demand for U.S.-produced goods and will boost U.S. imports. However, do not forget that a rising dollar benefits U.S. consumers via its impact on import prices. Since the consumer sector represents 68% of GDP, and that 69% of household consumption is geared toward the (largely domestic) service sector, a strong dollar will not be as negative for aggregate demand and employment as many commentators fear, unless it were to surge by at least another 10%. In the end, the dollar will be more important for the distribution of U.S. growth than its overall level. Where the strong dollar is likely to cause tremors is in the political arena. You are correct to point out that there is a large inconsistency between the White House’s desires to shore up growth, while simultaneously curtailing the trade deficit, especially if the dollar appreciates further. As long as the Fed focuses on its dual mandate and tries to contain inflationary pressures, the executive branch of the U.S. government can do little to push the dollar down. Currency intervention cannot have a permanent effect unless it is accompanied by shifts in relative macro fundamentals. For example, foreign exchange intervention by the Japanese Ministry of Finance in the late 1990s merely had a temporary impact on the yen. The yen only weakened on a sustained basis once interest rate differentials moved against Japan. This problem underpins our view that the Sino-U.S. relationship is unlikely to improve meaningfully next year. China will remain an easy target to blame for the U.S.’s large trade deficit. What ultimately will signal a top in the dollar is better global growth, which is unlikely until the second half of 2019. At that point, expected returns outside the U.S. will improve, causing money to leave the U.S., pushing the dollar down. Mr. X: While 2017 was a stellar year for the euro, 2018 proved a much more challenging environment. Will 2019 be more like 2017 or 2018? BCA: We often think of the euro as the anti-dollar; buying EUR/USD is the simplest, most liquid vehicle for betting against the dollar, and vice versa. Our bullish dollar stance is therefore synonymous with a negative take on the euro. Also, the activity gap between the U.S. and the Euro Area continues to move in a euro-bearish fashion (Chart 40). Finally, since the Great Financial Crisis, EUR/USD has lagged the differential between European and U.S. core inflation by roughly six months. Today, this inflation spread still points toward a weaker euro. Chart 40Relative LEI's Moving Against Euro
Relative LEI's Moving Against Euro
Relative LEI's Moving Against Euro
It is important to remember that when Chinese economic activity weakens, European growth deteriorates relative to the U.S. Thus, our view that global growth will continue to sputter in the first half of 2019 implies that the monetary policy divergence between the Fed and the ECB has not yet reached a climax. Consequently, we expect EUR/USD to trade below 1.1 in the first half of 2019. By that point, the common currency will be trading at a meaningful discount to its fair value, which will allow it to find a floor (Chart 41). Chart 41Euro Heading Below Fair Value Before Bottoming
Euro Heading Below Fair Value Before Bottoming
Euro Heading Below Fair Value Before Bottoming
Mr. X: The Bank of Japan has debased the yen, with a balance sheet larger than Japan’s GDP. This cannot end well. I am very bearish on the currency. BCA: The BoJ’s monetary policy is definitely a challenge for the yen. The Japanese central bank rightfully understands that Japan’s inability to generate any meaningful inflation – despite an economy that is at full employment – is the consequence of a well-established deflationary mindset. The BoJ wants to shock inflation expectations upward by keeping real rates at very accommodative levels well after growth has picked up. This means that the BoJ will remain a laggard as global central banks move away from accommodative policies. The yen will continue to depreciate versus the dollar as U.S. yields rise on a cyclical horizon. That being said, the yen still has a place within investors’ portfolios. First, the yen is unlikely to collapse despite the BoJ’s heavy debt monetization. The JPY is one of the cheapest currencies in the world, with its real effective exchange rate hovering at a three-decade low (Chart 42). Additionally, Japan still sports a current account surplus of 3.7% of GDP, hardly the sign of an overstimulated and inflationary economy where demand is running amok. Instead, thanks to decades of current account surpluses, Japan has accumulated a positive net international investment position of 60% of GDP. This means that Japan runs a constant and large positive income balance, a feature historically associated with strong currencies. Chart 42The Yen Is Very Cheap
The Yen Is Very Cheap
The Yen Is Very Cheap
Japan’s large net international investment position also contributes to the yen’s defensive behavior as Japanese investors pull money back to safety at home when global growth deteriorates. Hence, the yen could rebound, especially against the euro, the commodity currencies, and EM currencies if there is a further global growth scare in the near term. Owning some yen can therefore stabilize portfolio returns during tough times. As we discussed earlier, we would avoid the EM asset class, including currency exposure, until global growth firms. Commodities: Ms. X: Once again, you made a good call on the energy price outlook a year ago, with prices moving higher for most of the year. But the recent weakness in oil seemed to come out of nowhere, and I must admit to being confused about where we go next. What are your latest thoughts on oil prices for the coming year? BCA: The fundamentals lined up in a very straightforward way at the end of 2017. The coalition we have dubbed OPEC 2.0 – the OPEC and non-OPEC producer group led by the Kingdom of Saudi Arabia (KSA) and Russia – outlined a clear strategy to reduce the global oil inventory overhang. The producers that had the capacity to increase supply maintained strict production discipline which, to some analysts, was still surprising even after the cohesiveness shown by the group in 2017. Outside that core group output continued to fall, especially in Venezuela, which remains a high-risk producing province. The oil market was balanced and prices were slowly moving higher as we entered the second quarter of this year, when President Trump announced the U.S. would re-impose oil export sanctions against Iran beginning early November. The oft-repeated goal of the sanctions was to reduce Iranian exports to zero. To compensate for the lost Iranian exports, President Trump pressured OPEC, led by KSA, to significantly increase production, which they did. However, as we approached the November deadline, the Trump Administration granted the eight largest importers of Iranian oil 180-day waivers on the sanctions. This restored much of the oil that would have been lost. Suddenly, the market found itself oversupplied and prices fell. As we move toward the December 6 meeting of OPEC 2.0 in Vienna, we are expecting a production cut from the coalition of as much as 1.4mm b/d to offset these waivers. The coalition wishes to keep global oil inventories from once again over-filling and dragging prices even lower in 2019. On the demand side, consumption continues to hold up both in the developed and emerging world, although we have somewhat lowered our expectations for growth next year. We are mindful of persistent concerns over the strength of demand – particularly in EM – in 2019. Thus, on the supply side and the demand side, the level of uncertainty in the oil markets is higher than it was at the start of 2018. Nonetheless, our base-case outlook is on the optimistic side for oil prices in 2019, with Brent crude oil averaging around $82/bbl, and WTI trading $6/bbl below that level (Chart 43). Chart 43Oil Prices To Rebound In 2019
Oil Prices To Rebound In 2019
Oil Prices To Rebound In 2019
Ms. X: I am skeptical that oil prices will rebound as much as you expect. First, oil demand is likely to falter if your view that global growth will continue slowing into early 2019 proves correct. Second, U.S. shale production is rising briskly, with pipeline bottlenecks finally starting to ease. Third, President Trump seems to have gone from taking credit for high equity prices to taking credit for low oil prices. Trump has taken a lot flack for supporting Saudi Arabia following the killing of The Washington Post journalist in Turkey. Would the Saudis really be willing to lose Trump’s support by cutting production at this politically sensitive time? BCA: Faltering demand growth remains a concern. However, note that in our forecasts we do expect global oil consumption growth to slow down to 1.46mm b/d next year, somewhat lower than the 1.6mm b/d growth we expect this year. In terms of the U.S. shale sector, production levels over the short term can be somewhat insensitive to changes in spot and forward prices, given the hedging activity of producers. Over the medium to longer term, however, lower spot and forward prices will disincentivize drilling by all but the most efficient producers with the best, lowest-cost acreage. If another price collapse were to occur – and were to persist, as the earlier price collapse did – we would expect a production loss of between 5% and 10% from the U.S. shales. Regarding KSA, the Kingdom needs close to $83/bbl to balance its budget this year and next, according to the IMF’s most recent estimates. If prices remain lower for longer, KSA’s official reserves will continue to fall, as its sovereign wealth fund continues to be tapped to fill budget gaps. President Trump’s insistence on higher production from KSA and the rest of OPEC is a non-starter – it would doom those economies to recession, and stifle further investment going forward. The U.S. would also suffer down the road, as the lack of investment significantly tightens global supply. So, net, if production cuts are not forthcoming from OPEC at its Vienna meeting we – and the market – will be downgrading our oil forecast. Ms. X: Does your optimism regarding energy extend to other commodities? The combination of a strong dollar and a China slowdown did a lot of damage to industrial commodities in 2018. Given your view that China’s economy should stabilize in 2019, are we close to a bottom in base metals? BCA: It is too soon to begin building positions in base metals because the trade war is going to get worse before it gets better. Exposure to base metals should be near benchmark at best entering 2019, although we will be looking to upgrade along with other risk assets if Chinese policy stimulus ramps up. Over the medium term, the outlook for base metals hinges on how successfully China pulls off its pivot toward consumer- and services-led growth, away from heavy industrial-led development. China accounts for roughly half of global demand for these base metals. Commodity demand from businesses providing consumer goods and services is lower than that of heavy industrial export-oriented firms. But demand for commodities used in consumer products – e.g., copper, zinc and nickel, which go into stainless-steel consumer appliances such as washers and dryers – will remain steady, and could increase if the transition away from heavy industrial-led growth is successful. Gasoline and jet fuel demand will also benefit, as EM consumers’ demand for leisure activities such as tourism increases with rising incomes. China is also going to be a large producer and consumer of electric vehicles, as it attempts to reduce its dependence on imported oil. Although timing the production ramp-up is difficult, in the long term these trends will be supportive for nickel and copper. Mr. X: You know I can’t let you get away without asking about gold. The price of bullion is down about 5% since the end of 2017, but that is no worse than the global equity market and it did provide a hedge against economic, financial or political shocks. The world seems just as risky as it did a year ago, so I am inclined to hold on to our gold positions, currently close to 10% of our portfolio. That is above your recommended level, but keeping a solid position in gold is one area where my daughter and I have close agreement regarding investment strategy. BCA: Gold did perform well during the risk asset corrections we had in 2018, and during the political crises as well. The price is not too far away from where we recommended going long gold as a portfolio hedge at the end of 2017 ($1230.3/oz). We continue to expect gold to perform well as a hedge. When other risk assets are trading lower, gold holds value relative to equities and tends to outperform bonds (Chart 44). Likewise, when other risk assets are rising, gold participates, but does not do as well as equities. It is this convexity – outperforming on the downside but participating on the upside with other risk assets – that continues to support our belief that gold has a role as a portfolio hedge. However, having 10% of your portfolio in gold is more than we would recommend – we favor an allocation of around 5%. Chart 44Hold Some Gold As A Hedge
OUTLOOK 2019: Late-Cycle Turbulence
OUTLOOK 2019: Late-Cycle Turbulence
Geopolitics Ms. X: I’m glad that the three of us agree at least on one thing – hold some gold! Let’s return to the geopolitical situation for a moment. Last year, you correctly forecast that divergent domestic policies in the U.S. and China – stimulus in the former and lack thereof in the latter – would be the most investment-relevant geopolitical issue. At the time, I found this an odd thing to highlight, given the risks of protectionism, populism, and North Korea. Do you still think that domestic policies will dominate in 2019? BCA: Yes, policy divergence between the U.S. and China will also dominate in 2019, especially if it continues to buoy the U.S. economy at the expense of the rest of the world. Of course, Beijing may decide to do more stimulus to offset its weakening economy and the impact of the trade tariffs. A headline rate cut, cuts to bank reserve requirements, and a boost to local government infrastructure spending are all in play. In the context of faltering housing and capex figures in the U.S., the narrative over the next quarter or two could be that the policy divergence is over, that Chinese policymakers have “blinked.” We are pushing back against this narrative on a structural basis. We have already broadly outlined our view that China will not be pressing hard to boost demand growth. Many of its recent policy efforts have focused on rebalancing the economy away from debt-driven investment (Chart 45). The problem for the rest of the world is that raw materials and capital goods comprise 85% of Chinese imports. As such, efforts to boost domestic consumption will have limited impact on the rest of the world, especially as emerging markets are highly leveraged to “old China.” Chart 45Rebalancing Of The Chinese Economy
Rebalancing Of The Chinese Economy
Rebalancing Of The Chinese Economy
Meanwhile, the Trump-Democrat gridlock could yield surprising results in 2019. President Trump is becoming singularly focused on winning re-election in 2020. As such, he fears the “stimulus cliff” looming over the election year. Democrats, eager to show that they are not merely the party of “the Resistance,” have already signaled that an infrastructure deal is their top priority. With fiscal conservatives in the House all but neutered by the midterm elections, a coalition between Trump and likely House Speaker Nancy Pelosi could emerge by late 2019, ushering in even more fiscal stimulus. While the net new federal spending will not be as grandiose as the headline figures, it will be something. There will also be regular spending increases in the wake of this year’s bipartisan removal of spending caps. We place solid odds that the current policy divergence narrative continues well into 2019, with bullish consequences for the U.S. dollar and bearish outcomes for EM assets, at least in the first half of the year. Mr. X: Your geopolitical team has consistently been alarmist on the U.S.-China trade war, a view that bore out throughout 2018. You already stated that you think trade tensions will persist in 2019. Where is this heading? BCA: Nowhere good. Rising geopolitical tensions in the Sino-American relationship has been our premier geopolitical risk since 2012. The Trump administration has begun tying geopolitical and strategic matters in with the trade talks. No longer is the White House merely asking for a narrowing of the trade deficit, improved intellectual property protections, and the removal of non-tariff barriers to trade. Now, everything from surface-to-air missiles in the South China Sea to Beijing’s “Belt and Road” project are on the list of U.S. demands. Trade negotiations are a “two-level game,” whereby policymakers negotiate in parallel with their foreign counterparts and domestic constituents. While Chinese economic agents may accept U.S. economic demands, it is not clear to us that its military and intelligence apparatus will accept U.S. geopolitical demands. And Xi Jinping himself is highly attuned to China’s geopolitical position, calling for national rejuvenation above all. We would therefore downplay any optimistic news from the G20 summit between Presidents Trump and Xi. President Trump could freeze tariffs at current rates and allow for a more serious negotiating round throughout 2019. But unless China is willing to kowtow to America, a fundamental deal will remain elusive in the end. For Trump, a failure to agree is still a win domestically, as the median American voter is not asking for a resolution of the trade war with China (Chart 46). Chart 46Americans Favor Being Tough On China
OUTLOOK 2019: Late-Cycle Turbulence
OUTLOOK 2019: Late-Cycle Turbulence
Ms. X: Could trade tensions spill into rising military friction? BCA: Absolutely. Minor military skirmishes will likely continue and could even escalate. We believe that there is a structural bull market in “war.” Investors should position themselves by being long global defense stocks. Mr. X: That is not encouraging. What about North Korea and Iran? Could they become geopolitical risks in 2019? BCA: Our answer to the North Korea question remains the same as 12 months ago: we have seen the peak in the U.S.’ display of a “credible military threat.” But Iran could re-emerge as a risk mid-year. We argued in last year’s discussion that President Trump was more interested in playing domestic politics than actually ratcheting up tensions with Iran. However, in early 2018 we raised our alarm level, particularly when staffing decisions in the White House involved several noted Iran hawks joining the foreign policy team. This was a mistake. Our initial call was correct, as President Trump ultimately offered six-month exemptions to eight importers of Iranian crude. That said, those exemptions will expire in the spring. The White House may, at that point, ratchet up tensions with Iran. This time, we will believe it when we see it. Intensifying tensions with Iran ahead of the U.S. summer vacation season, and at a time when crude oil markets are likely to be finely balanced, seems like folly, especially with primary elections a mere 6-to-8 months away. What does President Trump want more: to win re-election or to punish Iran? We think the answer is obvious, especially given that very few voters seem to view Iran as the country’s greatest threat (Chart 47). Chart 47Americans Don’t See Iran As A Major Threat
OUTLOOK 2019: Late-Cycle Turbulence
OUTLOOK 2019: Late-Cycle Turbulence
Ms. X: Let’s turn to Europe. You have tended to dismiss Euroskeptics as a minor threat, which has largely been correct. But don’t you think that, with Brexit upon us and Chancellor Angela Merkel in the twilight, populism in continental Europe will finally have its day? BCA: Let’s first wait to see how Brexit turns out! The next few months will be critical. Uncertainty is high, with considerable risks remaining. We do not think that Prime Minister May has the votes in the House of Commons to push through any version of soft Brexit that she has envisioned thus far. If the vote on the U.K.-EU exit deal falls through, a new election could be possible. This will require an extension of the exit process under Article 50 and a prolonged period of uncertainty. The probability of a no-deal Brexit is lower than 10%. It is simply not in the interest of anyone involved, save for a smattering of the hardest of hard Brexit adherents in the U.K. Conservative Party. Put simply, if the EU-U.K. deal falls through in the House of Commons, or even if PM May is replaced by a hard-Brexit Tory, the most likely outcome is an extension of the negotiation process. This can be easily done and we suspect that all EU member states would be in favor of such an extension given the cost to business sentiment and trade that would result from a no-deal Brexit. It is not clear that Brexit has emboldened Euroskeptics. In fact, most populist parties in the EU have chosen to tone down their Euroskepticism and emphasize their anti-immigrant agenda since the Brexit referendum. In part, this decision has to do with how messy the Brexit process has become. If the U.K. is struggling to unravel the sinews that tie it to Europe, how is any other country going to fare any better? The problem for Euroskeptic populists is that establishment parties are wise to the preferences of the European median voter. For example, we now have Friedrich Merz, a German candidate for the head of the Christian Democratic Union – essentially Merkel’s successor – who is both an ardent Europhile and a hardliner on immigration. This is not revolutionary. Merz simply read the polls correctly and realized that, with 83% of Germans supporting the euro, the rise of the anti-establishment Alternative for Germany (AfD) is more about immigration than about the EU. As such, we continue to stress that populism in Europe is overstated. In fact, we expect that Germany and France will redouble their efforts to reform European institutions in 2019. The European parliamentary elections in May will elicit much handwringing by the media due to a likely solid showing by Euroskeptics, even though the election is meaningless. Afterwards, we expect to see significant efforts to complete the banking union, reform the European Stability Mechanism, and even introduce a nascent Euro Area budget. But these reforms will not be for everyone. Euroskeptics in Central and Eastern Europe will be left on the outside looking in. Brussels may also be emboldened to take a hard line on Italy if institutional reforms convince the markets that the core Euro Area is sheltered from contagion. In other words, the fruits of integration will be reserved for those who play by the Franco-German rules. And that could, ironically, set the stage for the unraveling of the European Union as we know it. Over the long haul, a much tighter, more integrated, core could emerge centered on the Euro Area, with the rest of the EU becoming stillborn. The year 2019 will be a vital one for Europe. We are sensing an urgency in Berlin and Paris that has not existed throughout the crisis, largely due to Merkel’s own failings as a leader. We remain optimistic that the Euro Area will survive. However, there will be fireworks. Finally, a word about Japan. The coming year will see the peak of Prime Minister Shinzo Abe’s career. He is promoting the first-ever revision to Japan’s post-war constitution in order to countenance the armed forces. If he succeeds, he will have a big national security success to couple with his largely effective “Abenomics” economic agenda – after that, it will all be downhill. If he fails, he will become a lame duck. This means that political uncertainty will rise in 2019, after six years of unusual tranquility. Conclusions Mr. X: This is a good place to conclude our discussion. We have covered a lot of ground and your views have reinforced my belief that 2019 could be even more turbulent for financial markets than the past has been. I accept your opinion that a major global economic downturn is not around the corner, but with valuations still stretched, I feel that it makes good sense to focus on capital preservation. I may lose out on the proverbial “blow-off” rally, but so be it – I have been in this business long enough to know that it is much better to leave the party while the music is still playing! Ms. X: I agree with my father that the risks surrounding the outlook have risen as we have entered the late stages of this business-cycle expansion. Yet, if global growth does temporarily stabilize and corporate earnings continue to expand, I fear that being out of the market will be very painful. The era of hyper-easy money may be ending, but interest rates globally are still nowhere near restrictive territory. This tells me that the final stages of this bull market could be very rewarding. A turbulent market is not only one where prices go down – they can also go up a lot! BCA: The debate you are having is one we ourselves have had on numerous occasions. There is always a trade-off between maximizing short-term returns and taking a longer-term approach. Valuations are the ultimate guidepost for long-term returns. While most assets have cheapened over the past year, prices are still fairly elevated. Table 4 shows our baseline calculations of what a balanced portfolio will earn over the coming decade. We estimate that such a portfolio will deliver average annual returns of 4.9% over the next ten years, or 2.8% after adjusting for inflation. That is an improvement over our inflation-adjusted estimate of 1.3% from last year, but still well below the 6.6% real return that a balanced portfolio earned between 1982 and 2018. Table 410-Year Asset Return Projections
OUTLOOK 2019: Late-Cycle Turbulence
OUTLOOK 2019: Late-Cycle Turbulence
Our return calculations for equities assume that profit margins decline modestly over the period and that multiples mean revert to their historical average. These assumptions may turn out to be too pessimistic if underlying changes in the economy keep corporate profits elevated as a share of GDP. Structurally lower real interest rates may also justify higher P/E multiples, although this would be largely offset by the prospect of slower economic growth, which will translate into slower earnings growth. In terms of the outlook for the coming year, a lot hinges on our view that monetary policy in the main economies stays accommodative. This seems like a safe assumption in the Euro Area and Japan, where rates are near historic lows, as well as in China, where the government is actively loosening monetary conditions. It is not such a straightforward conclusion for the U.S., where the Fed is on track to keep raising rates. If it turns out that the neutral interest rate is not far above where rates are already, we could see a broad-based slowdown of the U.S. economy that ripples through to the rest of the world. And even if U.S. monetary policy does remain accommodative, many things could still upset the apple cart, including a full-out trade war, debt crises in Italy or China, or a debilitating spike in oil prices. As the title of our outlook implies, 2019 is likely to be a year of increased turbulence. Ms. X: As always, you have left us with much to think about. My father has looked forward to these discussions every year and now that I am able to join him, I understand why. Before we conclude, it would be helpful to have a recap of your key views. BCA: That would be our pleasure. The key points are as follows: The collision between policy and markets that we discussed last year finally came to a head in October. Rather than falling as they normally do when stocks plunge, U.S. bond yields rose as investors reassessed the willingness of the Fed to pause hiking rates even in the face of softer growth. Likewise, hopes that China would move swiftly to stimulate its economy were dashed as it became increasingly clear that the authorities were placing a high emphasis on their reform agenda of deleveraging and capacity reduction. The ongoing Brexit saga and the stalemate between the populist Italian government and the EU have increased uncertainty in Europe at a time when the region was already beginning to slow. We expect the tensions between policy and markets to be an ongoing theme in 2019. With the U.S. unemployment rate at a 48-year low, it will take a significant slowdown for the Fed to stop hiking rates. Despite the deterioration in economic data over the past month, real final domestic demand is still tracking to expand by 3% in the fourth quarter, well above estimates of the sustainable pace of economic growth. Ultimately, the Fed will deliver more hikes next year than discounted in the markets. This will push up the dollar and keep the upward trend in Treasury yields intact. The dollar should peak midway next year. China will also become more aggressive in stimulating its economy, which will boost global growth. However, until both of these things happen, emerging markets will remain under pressure. For the time being, we continue to favor developed market equities over their EM peers. We also prefer defensive equity sectors such as health care and consumer staples over cyclical sectors such as industrials and materials. Within the developed market universe, the U.S. will outperform Europe and Japan for the next few quarters, especially in dollar terms. A stabilization in global growth could ignite a blow-off rally in global equities. If the Fed is raising rates in response to falling unemployment, this is unlikely to derail the stock market. However, once supply-side constraints begin to fully bite in early 2020 and inflation rises well above the Fed’s target of 2%, stocks will begin to buckle. This means that a window exists next year where stocks will outperform bonds. We would maintain a benchmark allocation to stocks for now, but increase exposure if global bourses were to fall significantly from current levels without a corresponding deteriorating in the economic outlook. Corporate credit will underperform stocks as government bond yields rise. A major increase in spreads is unlikely as long as the economy is still expanding, but spreads could still widen modestly given their low starting point. U.S. shale companies have been the marginal producers in the global oil sector. With breakeven costs in shale close to $50/bbl, crude prices are unlikely to rise much from current levels over the long term. However, over the next 12 months, we expect production cuts in Saudi Arabia will push prices up, with Brent crude averaging around $82/bbl in 2019. A balanced portfolio is likely to generate average returns of only 2.8% a year in real terms over the next decade. This compares to average returns of around 6.6% a year between 1982 and 2018. We would like to take this opportunity to wish you and all of our clients a very peaceful, healthy and prosperous New Year. The Editors November 26, 2018