Sectors
A major slump in emerging economies would undoubtedly drag down global equities. In the ensuing synchronized bear market, the more defensive healthcare sector would almost certainly outperform financials, and under these circumstances the direction of…
Our European Investment Strategy team has consistently argued that regional equity views often boil down to relative sector performance. For instance, the performance of U.S. versus euro area stocks tracks the relative performance of technology versus…
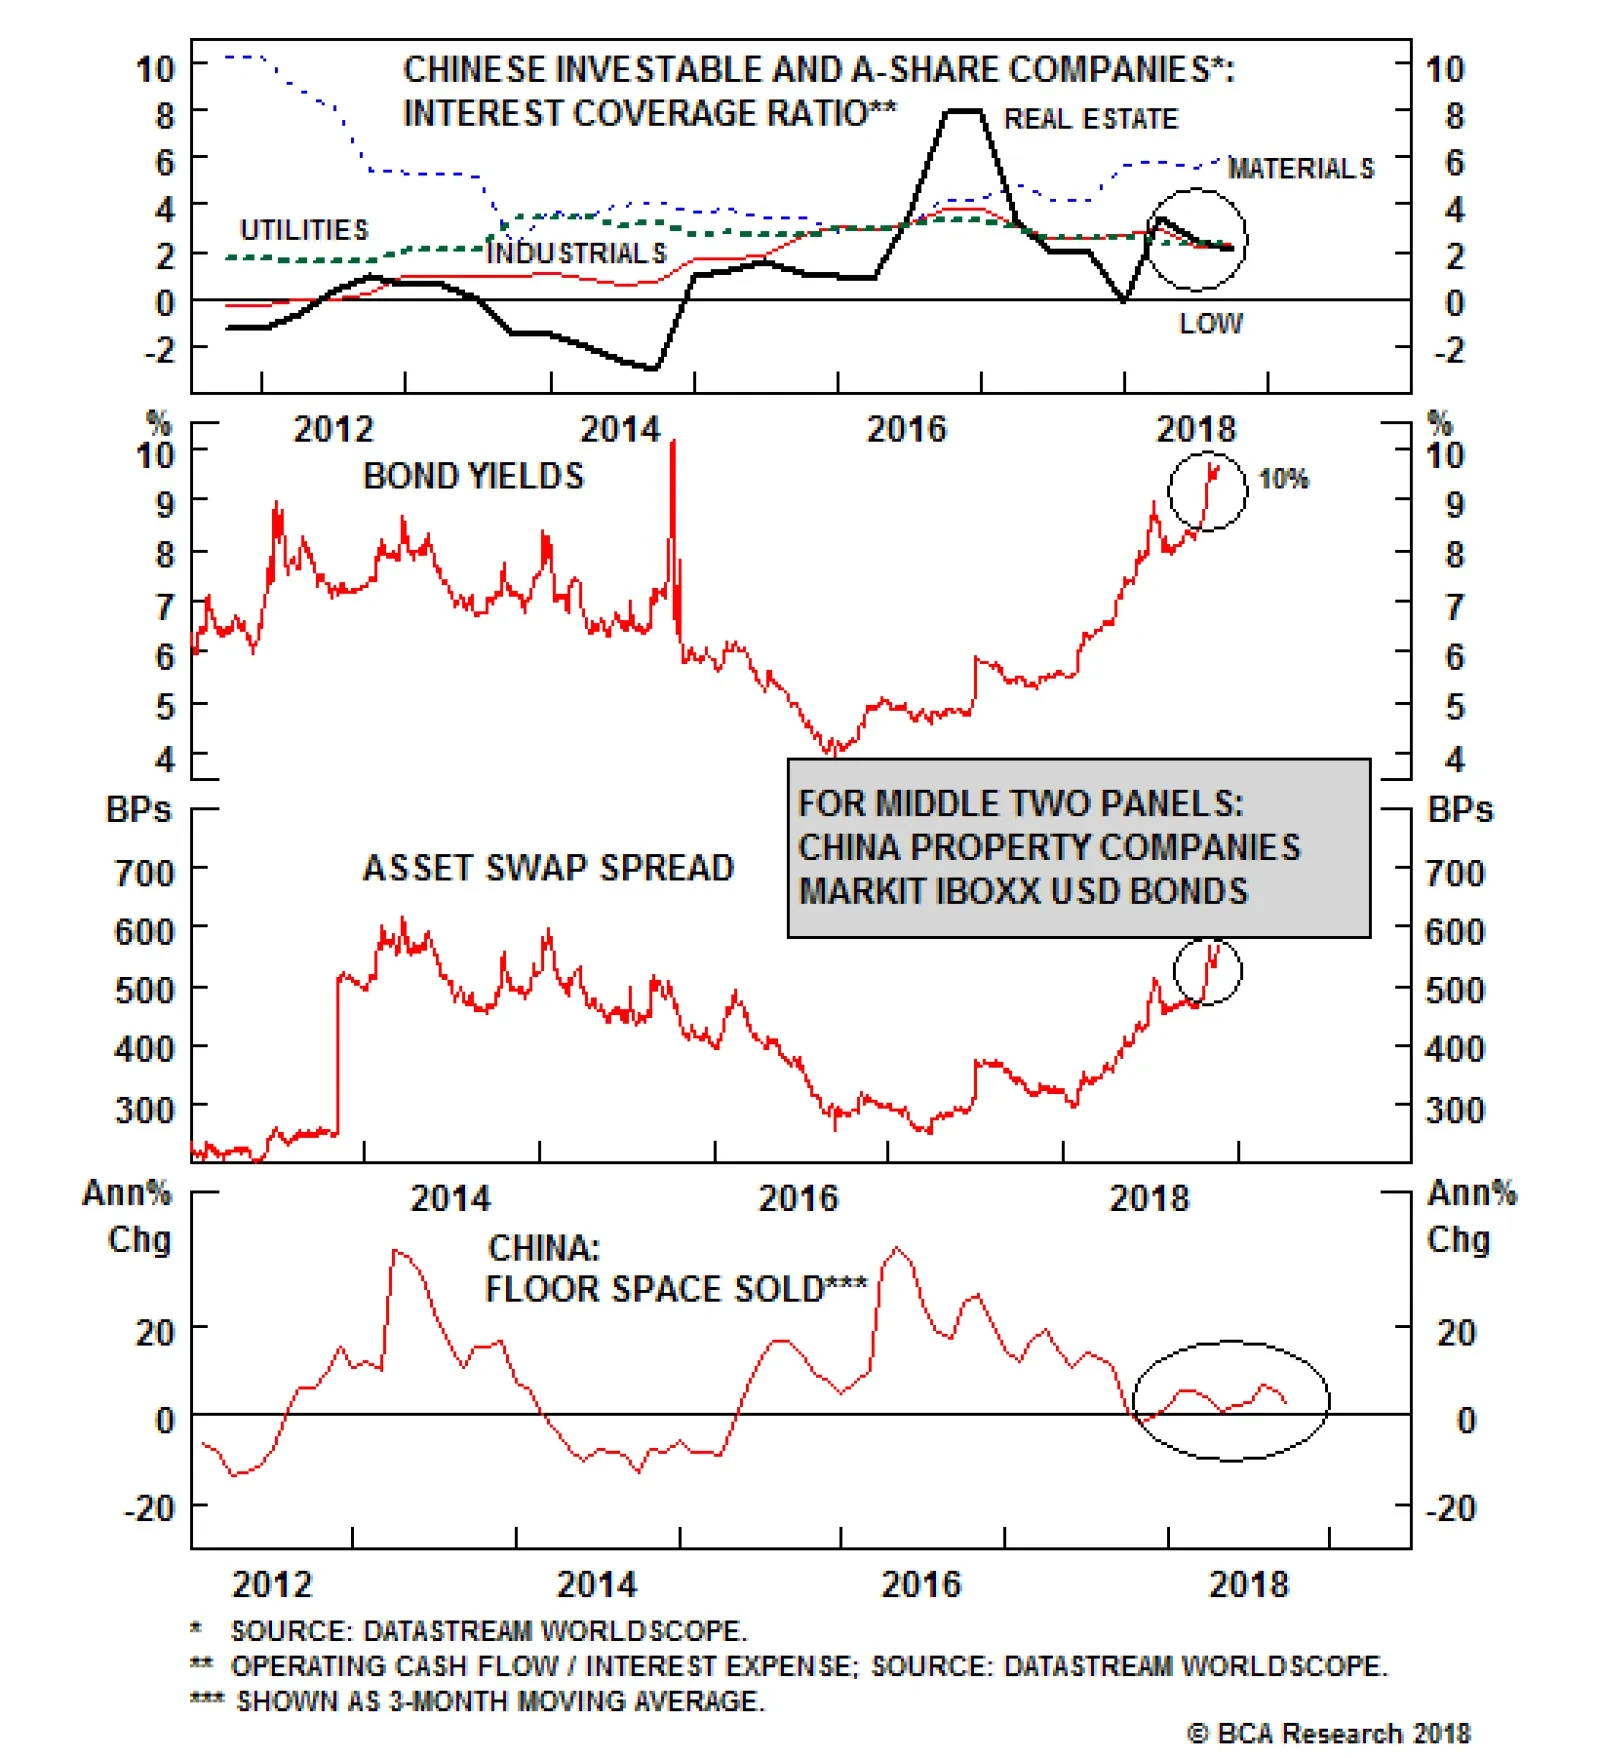
Chinese property developers are heavily indebted. Consistently then, the interest coverage ratio for real estate firms is extremely low (see chart, top panel). The bad news does not end there. The middle two panels of the chart above shows that offshore…

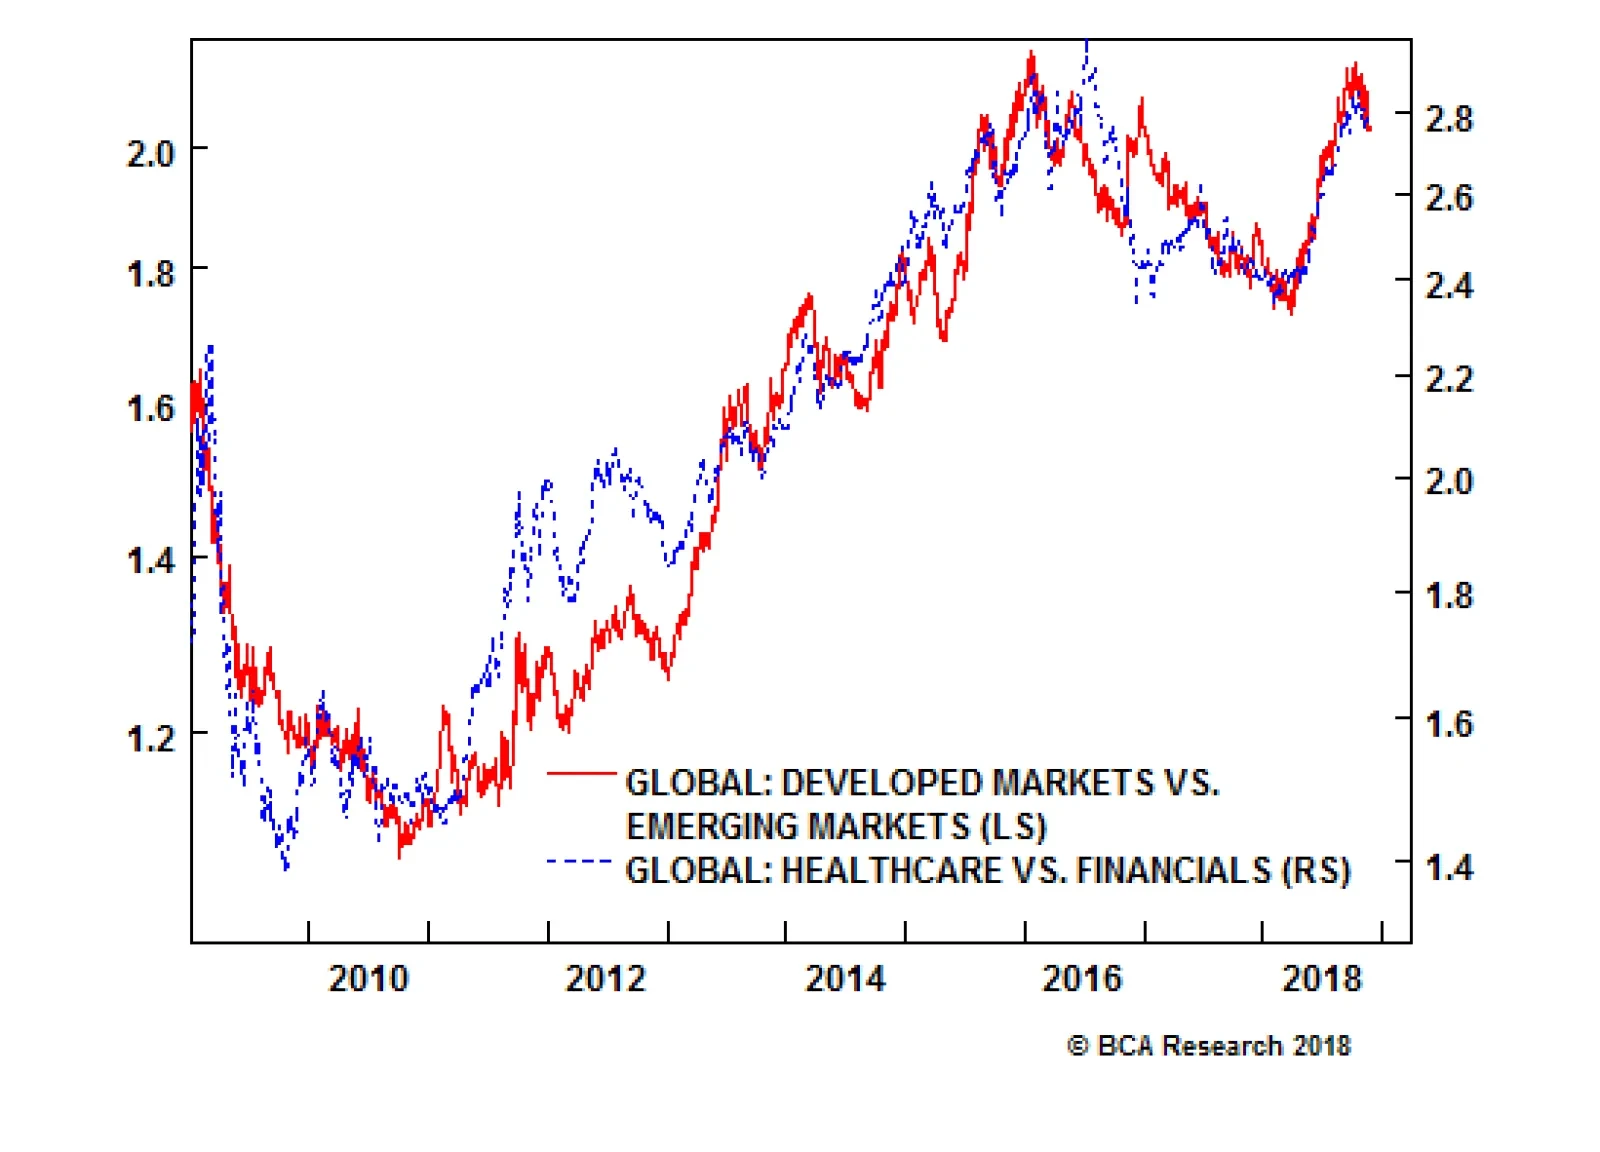
Highlights The relative performance of developed market (DM) versus emerging market (EM) equities just corresponds to the relative performance of healthcare versus financials. On a six month horizon, DM will underperform EM. Within Europe, overweight Poland, Hungary and Czech Republic, but steer clear of energy-heavy Russia. Wait for the 10-year BTP yield to move closer to 3 percent before buying Italian assets, either in absolute or relative terms. Buy the pound on any sharp sell-offs during the Brexit psychodrama. Our medium-term expected value of pound/euro equals 1.18. Chart of the WeekDeveloped Vs. Emerging Markets = Healthcare Vs. Financials
Developed Vs. Emerging Markets = Healthcare Vs. Financials
Developed Vs. Emerging Markets = Healthcare Vs. Financials
Feature They say that to capture the Zeitgeist at any moment, all you need to do is name the top five companies in the world. So here are the top five companies in the developed equity markets (DM): Apple, Microsoft, Google, Amazon, and Facebook (Table I-1). Table I-1Developed Markets: Top 5 Companies
DM Versus EM, And Two European Psychodramas
DM Versus EM, And Two European Psychodramas
These five names do perfectly capture the spirit of our time and should not surprise you. Now look at the top five companies in the emerging equity markets (EM): Tencent, Taiwan Semiconductor, Samsung Electronics, Alibaba, and Naspers (Table I-2). Table I-2Emerging Markets: Top 5 Companies
DM Versus EM, And Two European Psychodramas
DM Versus EM, And Two European Psychodramas
What may surprise you is that technology titans dominate in EM markets too. In fact, the technology sector's weighting in EM, at 25 percent, is even larger than in DM, at 19 percent. If technology looms even larger in EM than in DM, what is the defining sector difference between the two regions? The answer is that emerging markets have almost no healthcare stocks, and an offsetting substantial overweighting to financials (Table I-3). Table I-3Developed Markets Versus Emerging Markets: Sector Weights
DM Versus EM, And Two European Psychodramas
DM Versus EM, And Two European Psychodramas
Developed Vs. Emerging Markets = Healthcare Vs. Financials The following is a very different way of looking at the DM versus EM investment decision and, as such, may differ from the BCA house view. As we have demonstrated time and time again on these pages, an equity market's dominant sector skew is of critical importance to investors (Chart I-2). This is because equity sector skews almost always drive regional and country relative performance. Crucially, this fundamental truth applies at the highest level too: the relative performance of DM versus EM. The Chart of the Week should leave you in absolutely no doubt that the relative performance of DM versus EM just corresponds to the relative performance of healthcare versus financials. Chart I-2Developed Versus Emerging Markets: Sector Weight Differences
DM Versus EM, And Two European Psychodramas
DM Versus EM, And Two European Psychodramas
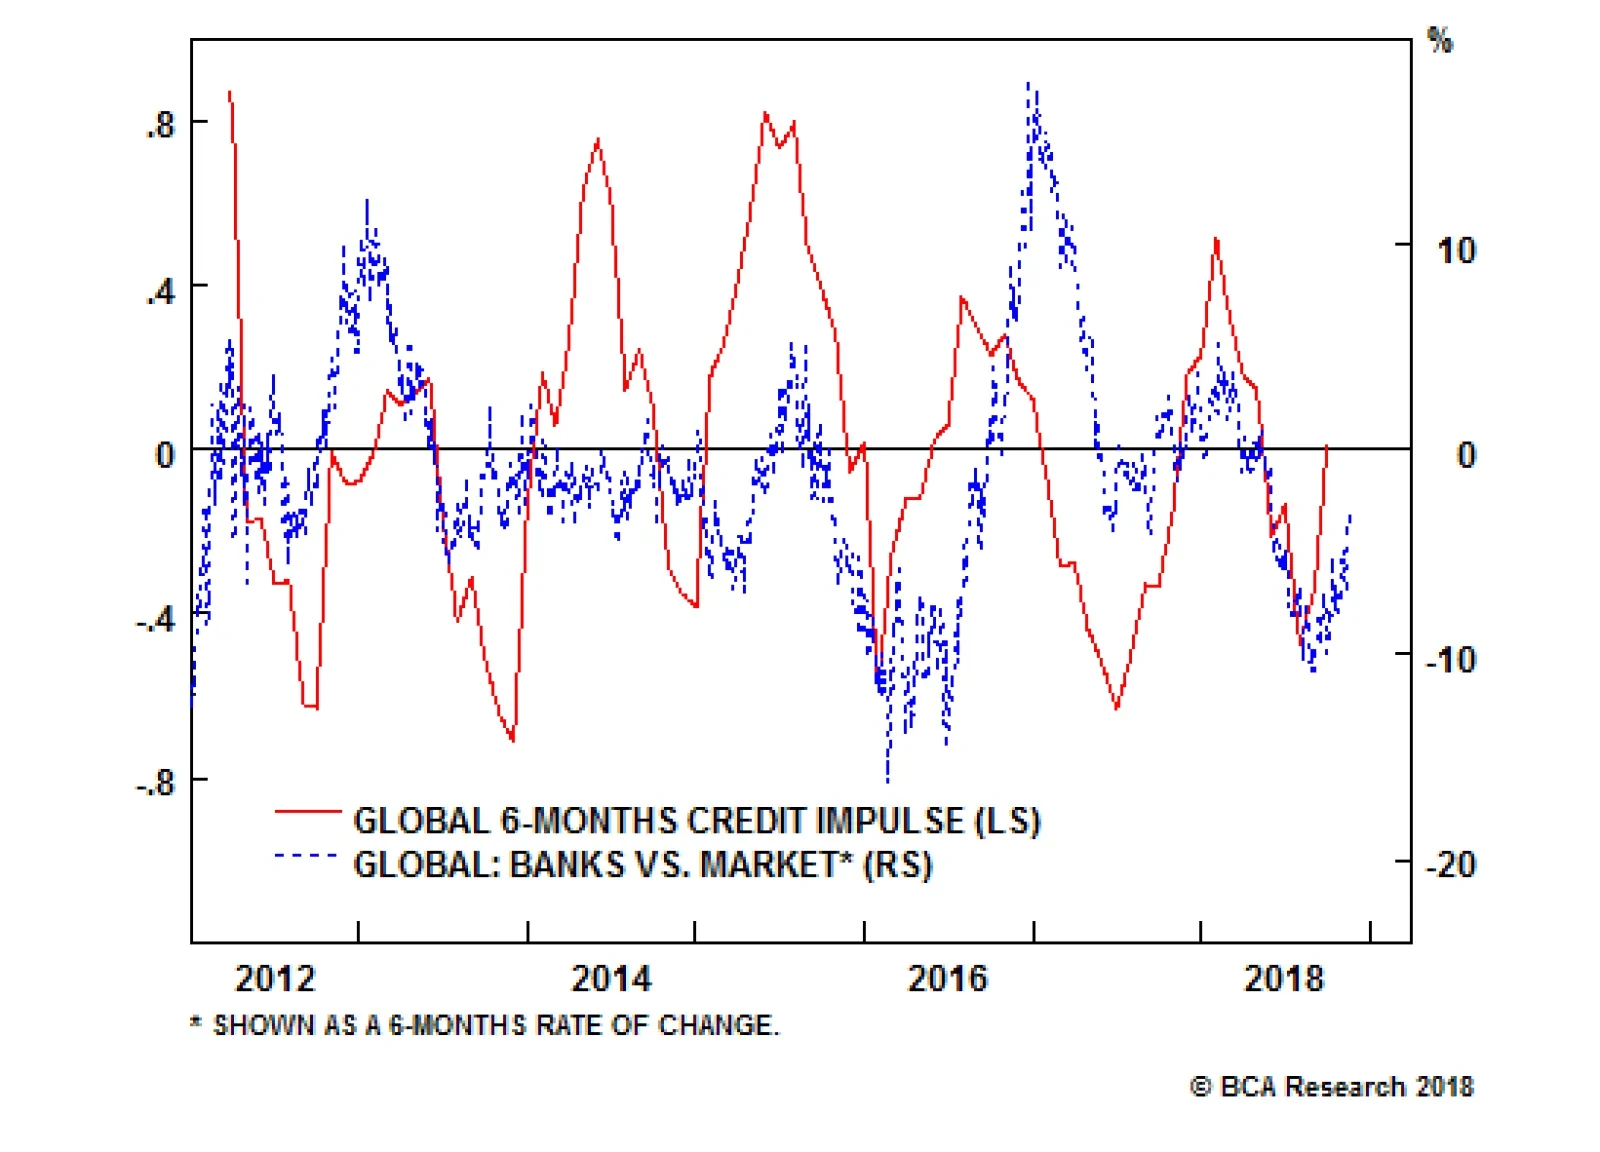
Nevertheless, this striking observation raises a fascinating question: what is the direction of causality? Does healthcare versus financials drive DM versus EM, or in fact does DM versus EM drive healthcare versus financials? The answer is sometimes the former, and at other times the latter. For example, a major slump in emerging economies would undoubtedly drag down global equities. In the ensuing synchronized bear market, the more defensive healthcare sector would almost certainly outperform the financials, and under these circumstances the direction of causality would clearly be from DM versus EM to global sector performance. On the other hand, absent a major bear market, if a reappraisal of sector relative valuations and growth prospects caused a rotation in sector leadership, the causality would run in the other direction: from global sector performance to DM versus EM. Such a reappraisal of sector relative valuations and growth prospects appears to be underway at the moment, and is likely to persist for the next few months. This is because the very sharp down-oscillation in global credit growth which occurred from February through September has now clearly flipped into an up-oscillation. For investors, these oscillations in global credit growth provide excellent tactical opportunities because the oscillations are very regular and therefore predictable; and the cyclical versus defensive sector performance closely tracks the oscillations. So after healthcare's strong outperformance versus financials from February through September, sector relative performance has now flipped into a reverse configuration (Chart I-3). Chart I-3An Up-Oscillation In Global Credit Growth Technically Favours Financials
An Up-Oscillation In Global Credit Growth Technically Favours Financials
An Up-Oscillation In Global Credit Growth Technically Favours Financials
To be clear, this is likely a tactical opportunity lasting no more than six months or so. Nevertheless, from a DM versus EM perspective, it would imply a countertrend move within a structural trend - in which the outperformance of DM versus EM temporarily ends, or even flips into an underperformance (Chart I-4). Chart I-4An Up-Oscillation In Global Credit Growth Technically Favours EM
An Up-Oscillation In Global Credit Growth Technically Favours EM
An Up-Oscillation In Global Credit Growth Technically Favours EM
For European equity investors, the important implication is that developed Europe versus emerging Europe closely tracks broad DM versus broad EM (Chart I-5). Of course, 'emerging Europe' is a misnomer because Poland, Hungary, Czech Republic, and even Russia are developed economies and markets. Nevertheless, as they fall within the MSCI EM index, they tend to move with EM. Chart I-5Developed Europe Vs. Emerging Europe = Developed Markets Vs. Emerging Markets
Developed Europe Vs. Emerging Europe = Developed Markets Vs. Emerging Markets
Developed Europe Vs. Emerging Europe = Developed Markets Vs. Emerging Markets
The upshot is that on a tactical horizon, emerging Europe is likely to outperform developed Europe. However, given our high conviction view that non-energy commodities will continue to outperform energy, focus on Poland, Hungary and Czech Republic and steer clear of energy-heavy Russia. European Psychodrama 1: Italy Vs. The EU In the low-level game of chicken between Italy and the EU Commission over Italy's 2019 budget, the bond market will determine who swerves first. If the 10-year BTP yield rises and stays well above 4 percent, the weakened capital position of Italian banks from lower bond prices combined with deteriorating funding conditions will weigh on bank lending and economic growth. This will put pressure on the Italian government to swerve first and concede ground to the EU's demands. That said, it is hard to know the exact level of yields at which the government would reach its pain threshold. On the other hand, if the 10-year BTP yield falls and stays well below 3 percent, the bond market's insouciance would embolden the Italian government. Moreover, this apparent vote of confidence would be based on sound economics. Italy likely has a very high fiscal multiplier, meaning that a modest increase in its budget deficit to 2.4 percent would more than pay for itself through higher economic growth. Under these circumstances the EU would be under pressure to swerve first and give Italy some room for manoeuvre. The long-term investment opportunity is the Italy versus Spain sovereign 10-year yield spread. At 200 bps, the spread is at its all-time widest, and incongruous with the vanishing gap between the non-performing loans ratios in Italy and Spain. Nevertheless, our recommendation is to wait for the 10-year BTP yield to move closer to 3 percent before buying Italian assets, either in absolute or relative terms (Chart I-6). Chart I-6Remain Neutral Italian Assets Until The 10-Year BTP Yield Moves Closer To 3 Percent
Remain Neutral Italian Assets Until The 10-Year BTP Yield Moves Closer To 3 Percent
Remain Neutral Italian Assets Until The 10-Year BTP Yield Moves Closer To 3 Percent
European Psychodrama 2: Brexit In the psychodrama called Brexit, every new plot twist and turn has the potential to move the pound up or down by a few cents in a day. The next such major twist is the passage of the withdrawal bill through the U.K. parliament in early December. The ultra Brexiteer Conservative MPs and Northern Ireland Unionists will almost certainly vote against the agreement that Theresa May has forged with Brussels. This is because the agreement conjures up the Brexiteers' worst nightmare: a potentially indefinite customs union with the EU27, making it impossible for the U.K. to strike free trade deals with the rest of the world. Hence, for Theresa May to get her agreement through parliament, she will require the support of a substantial number of Labour MPs. But the substantial numbers just aren't there. The upshot is that she is likely to lose the vote, at which point the pound will tumble. For medium-term investors, this would be the moment to buy the pound, and we now explain why. On a six month horizon, the crucial question is: what will happen when the Article 50 process for the U.K. to leave the EU expires at 11pm on March 29, 2019? There are only three possibilities: 1. The U.K. doesn't leave the EU. At this advanced stage on the timeline, not leaving the EU on March 29 2019 effectively means an extension of the Article 50 process. This would require the U.K. to apply for an extension, and for the EU27 to agree to it. But realistically, the EU27 would only agree to it to facilitate a general election and/or a second referendum which could reverse Brexit. Probability = 45%. With the parliamentary arithmetic pointing to a rejection of May's Brexit deal as it stands, an amendment to the withdrawal bill forcing a second referendum, or a lost vote of no confidence in the government could lead to this outcome. Pound/euro = 1.20, because of the realistic prospect of reversing Brexit (Chart I-7). Chart I-7British Public Opinion On Brexit Is Shifting
Long Emerging Markets Vs. Developed Markets
Long Emerging Markets Vs. Developed Markets
2. The U.K. enters a transition period to leave the EU with a negotiated agreement. Theresa May's proposed withdrawal deal, or a variation of it, is approved by the U.K parliament (and the EU27) Probability = 45%. Appropriate amendments to the withdrawal agreement might sufficiently reduce the parliamentary rebellion. Pound/euro = 1.20 because the removal of the 'no deal' outcome would liberate the BoE to hike interest rates. 3. The U.K. crashes out of the EU with 'no deal'. Probability = 10%. This outcome would be the result of a gridlock in the U.K. parliament, with no majority formed for any Brexit strategy. Unlikely, but not impossible. Pound/euro = 1.00 because the U.K. economy would face months of severe disruption and uncertainty. Based on these three possible outcomes on March 29 2019, our expected value of pound/euro equals 1.18. Meaning that any sharp sell-off during the ongoing psychodrama constitutes a medium-term buying opportunity. Dhaval Joshi, Senior Vice President Chief European Investment Strategist dhaval@bcaresearch.com Fractal Trading Model* Supporting the thesis in the main body of this report, the 130-day fractal dimension of EM versus DM recently hit its lower bound, suggesting an oversold extreme and a likely countertrend move. For a short-term trade, position for a 2.5% profit with a symmetrical stop-loss. In other trades, long Portugal / short Hungary hit its stop-loss and is closed, leaving four open trades. For any investment, excessive trend following and groupthink can reach a natural point of instability, at which point the established trend is highly likely to break down with or without an external catalyst. An early warning sign is the investment's fractal dimension approaching its natural lower bound. Encouragingly, this trigger has consistently identified countertrend moves of various magnitudes across all asset classes. Chart I-8
Long Emerging Markets Vs. Developed Markets
Long Emerging Markets Vs. Developed Markets
The post-June 9, 2016 fractal trading model rules are: When the fractal dimension approaches the lower limit after an investment has been in an established trend it is a potential trigger for a liquidity-triggered trend reversal. Therefore, open a countertrend position. The profit target is a one-third reversal of the preceding 13-week move. Apply a symmetrical stop-loss. Close the position at the profit target or stop-loss. Otherwise close the position after 13 weeks. Use the position size multiple to control risk. The position size will be smaller for more risky positions. * For more details please see the European Investment Strategy Special Report "Fractals, Liquidity & A Trading Model," dated December 11, 2014, available at eis.bcaresearch.com Fractal Trading Model Recommendations Asset Allocation Equity Regional and Country Allocation Equity Sector Allocation Bond and Interest Rate Allocation Currency and Other Allocation Closed Fractal Trades Trades Closed Trades Asset Performance Currency & Bond Equity Sector Country Equity Indicators Bond Yields Chart II-1Indicators To Watch - Bond Yields
Indicators To Watch - Bond Yields
Indicators To Watch - Bond Yields
Chart II-2Indicators To Watch - Bond Yields
Indicators To Watch - Bond Yields
Indicators To Watch - Bond Yields
Chart II-3Indicators To Watch - Bond Yields
Indicators To Watch - Bond Yields
Indicators To Watch - Bond Yields
Chart II-4Indicators To Watch - Bond Yields
Indicators To Watch - Bond Yields
Indicators To Watch - Bond Yields
Interest Rate Chart II-5Indicators To Watch - Interest Rate Expectations
Indicators To Watch - Interest Rate Expectations
Indicators To Watch - Interest Rate Expectations
Chart II-6Indicators To Watch - Interest Rate Expectations
Indicators To Watch - Interest Rate Expectations
Indicators To Watch - Interest Rate Expectations
Chart II-7Indicators To Watch - Interest Rate Expectations
Indicators To Watch - Interest Rate Expectations
Indicators To Watch - Interest Rate Expectations
Chart II-8Indicators To Watch - Interest Rate Expectations
Indicators To Watch - Interest Rate Expectations
Indicators To Watch - Interest Rate Expectations
Neutral U.S retailers have reported excellent sales numbers in the most recent quarter, most notably Walmart that delivered a surprising 3.4% same store sales growth number; the market has responded in kind and spared the S&P hypermarkets index that has held up well vs. the broad equity market. Still, this outperformance seems anecdotal as hypermarkets have struggled to gain traction against other retailers. Likely, higher consumer wages are being deployed elsewhere (second panel). With a savings rate that is still elevated relative to history (third panel), the consumer has significant dry powder to deploy, but this appears to have little bearing on hypermarkets and their less discretionary consumption offering. This suggests an absence of a margin lever, which is reflected in the accelerating downward trend of S&P hypermarkets EPS growth relative to the broad market (bottom panel). Net, despite the market's sanguine view on the operating performance of hypermarkets, we prefer to stay on the fence. The ticker symbols for the stocks in this index are: BLBG: S5HYPC - WMT, COST.
Hypermarket Sales Are Looking Up But What About Margins
Hypermarket Sales Are Looking Up But What About Margins
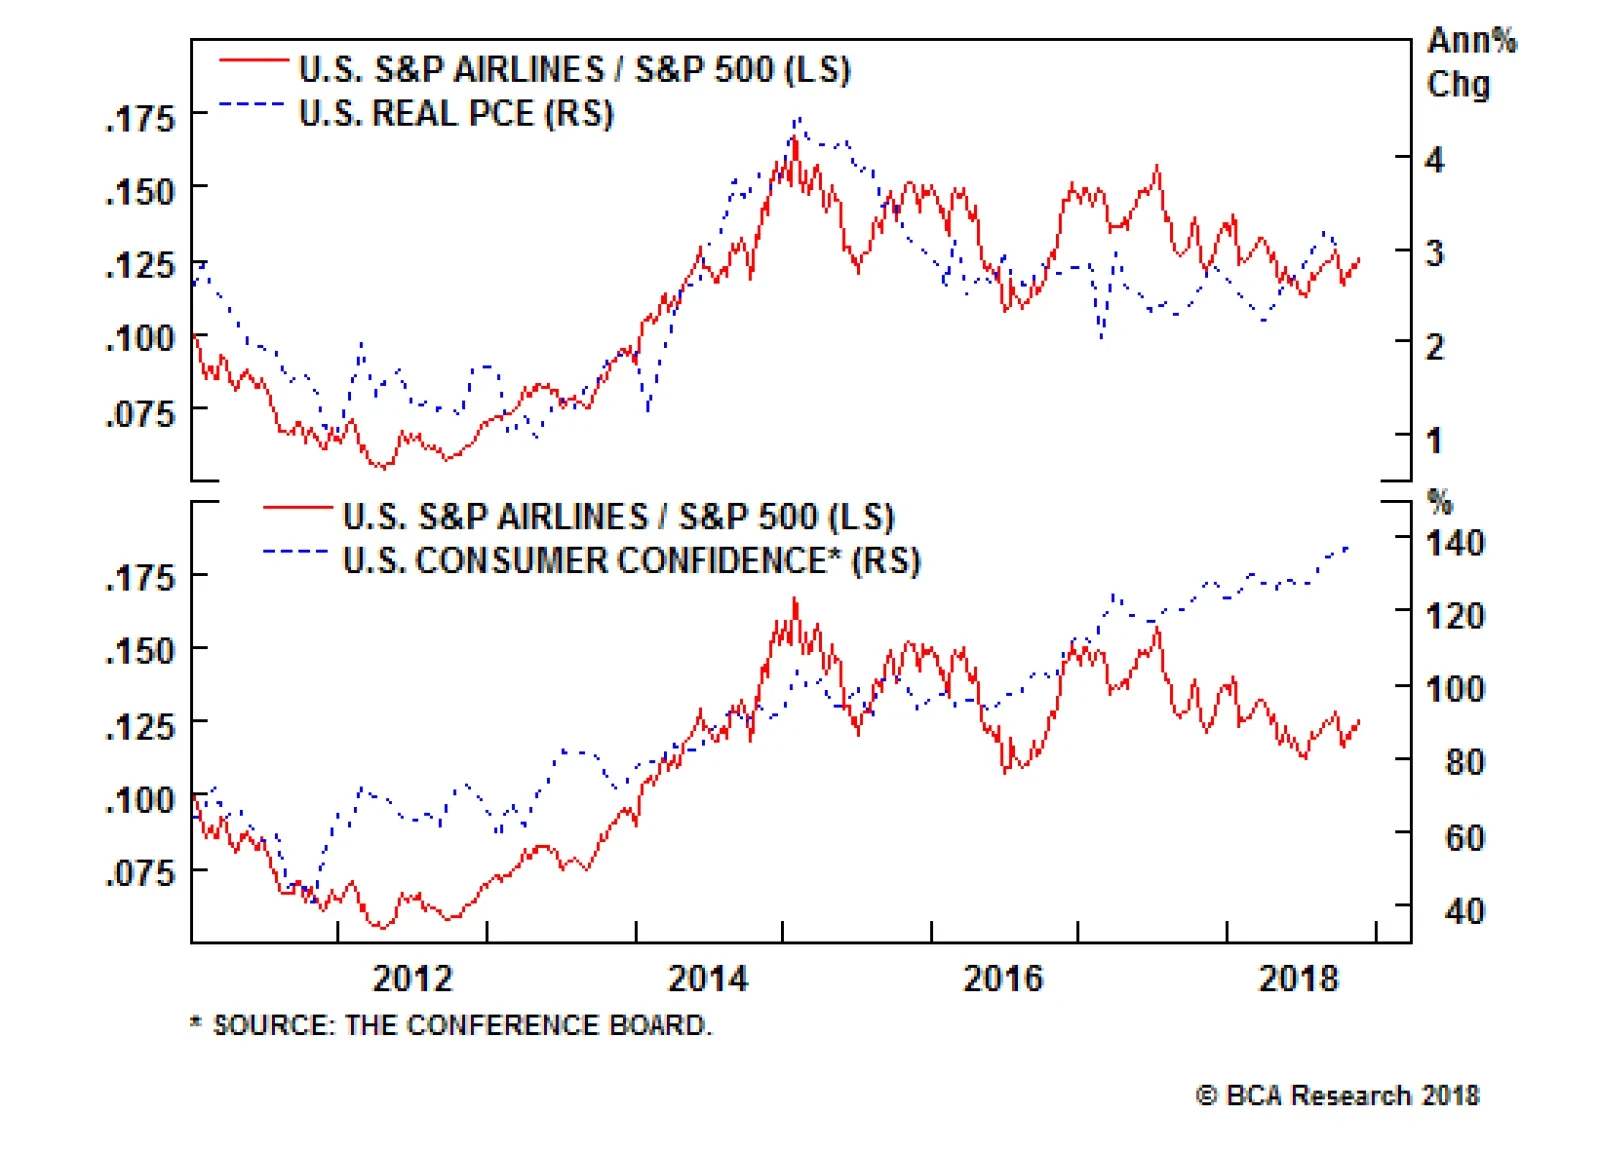
Given the downward pressure on input costs facing airline profits, our U.S. equity strategists have put airlines on upgrade alert and are cementing their gains of 18% from their underweight position. They have also increased exposure to overweight in the…
U.S equities have been experiencing mini-aftershocks following October's seismic move down. This is because the Fed has injected some volatility back into markets by raising interest rates, allowing bonds to roll off its balance sheet, and also resisting…
Our U.S. Investment Strategy team is unperturbed by the three-quarter contraction in residential investment, which one has to squint to see on a longer-term chart.1 They do not believe that housing demand has reached an inflection point, but that prospective…
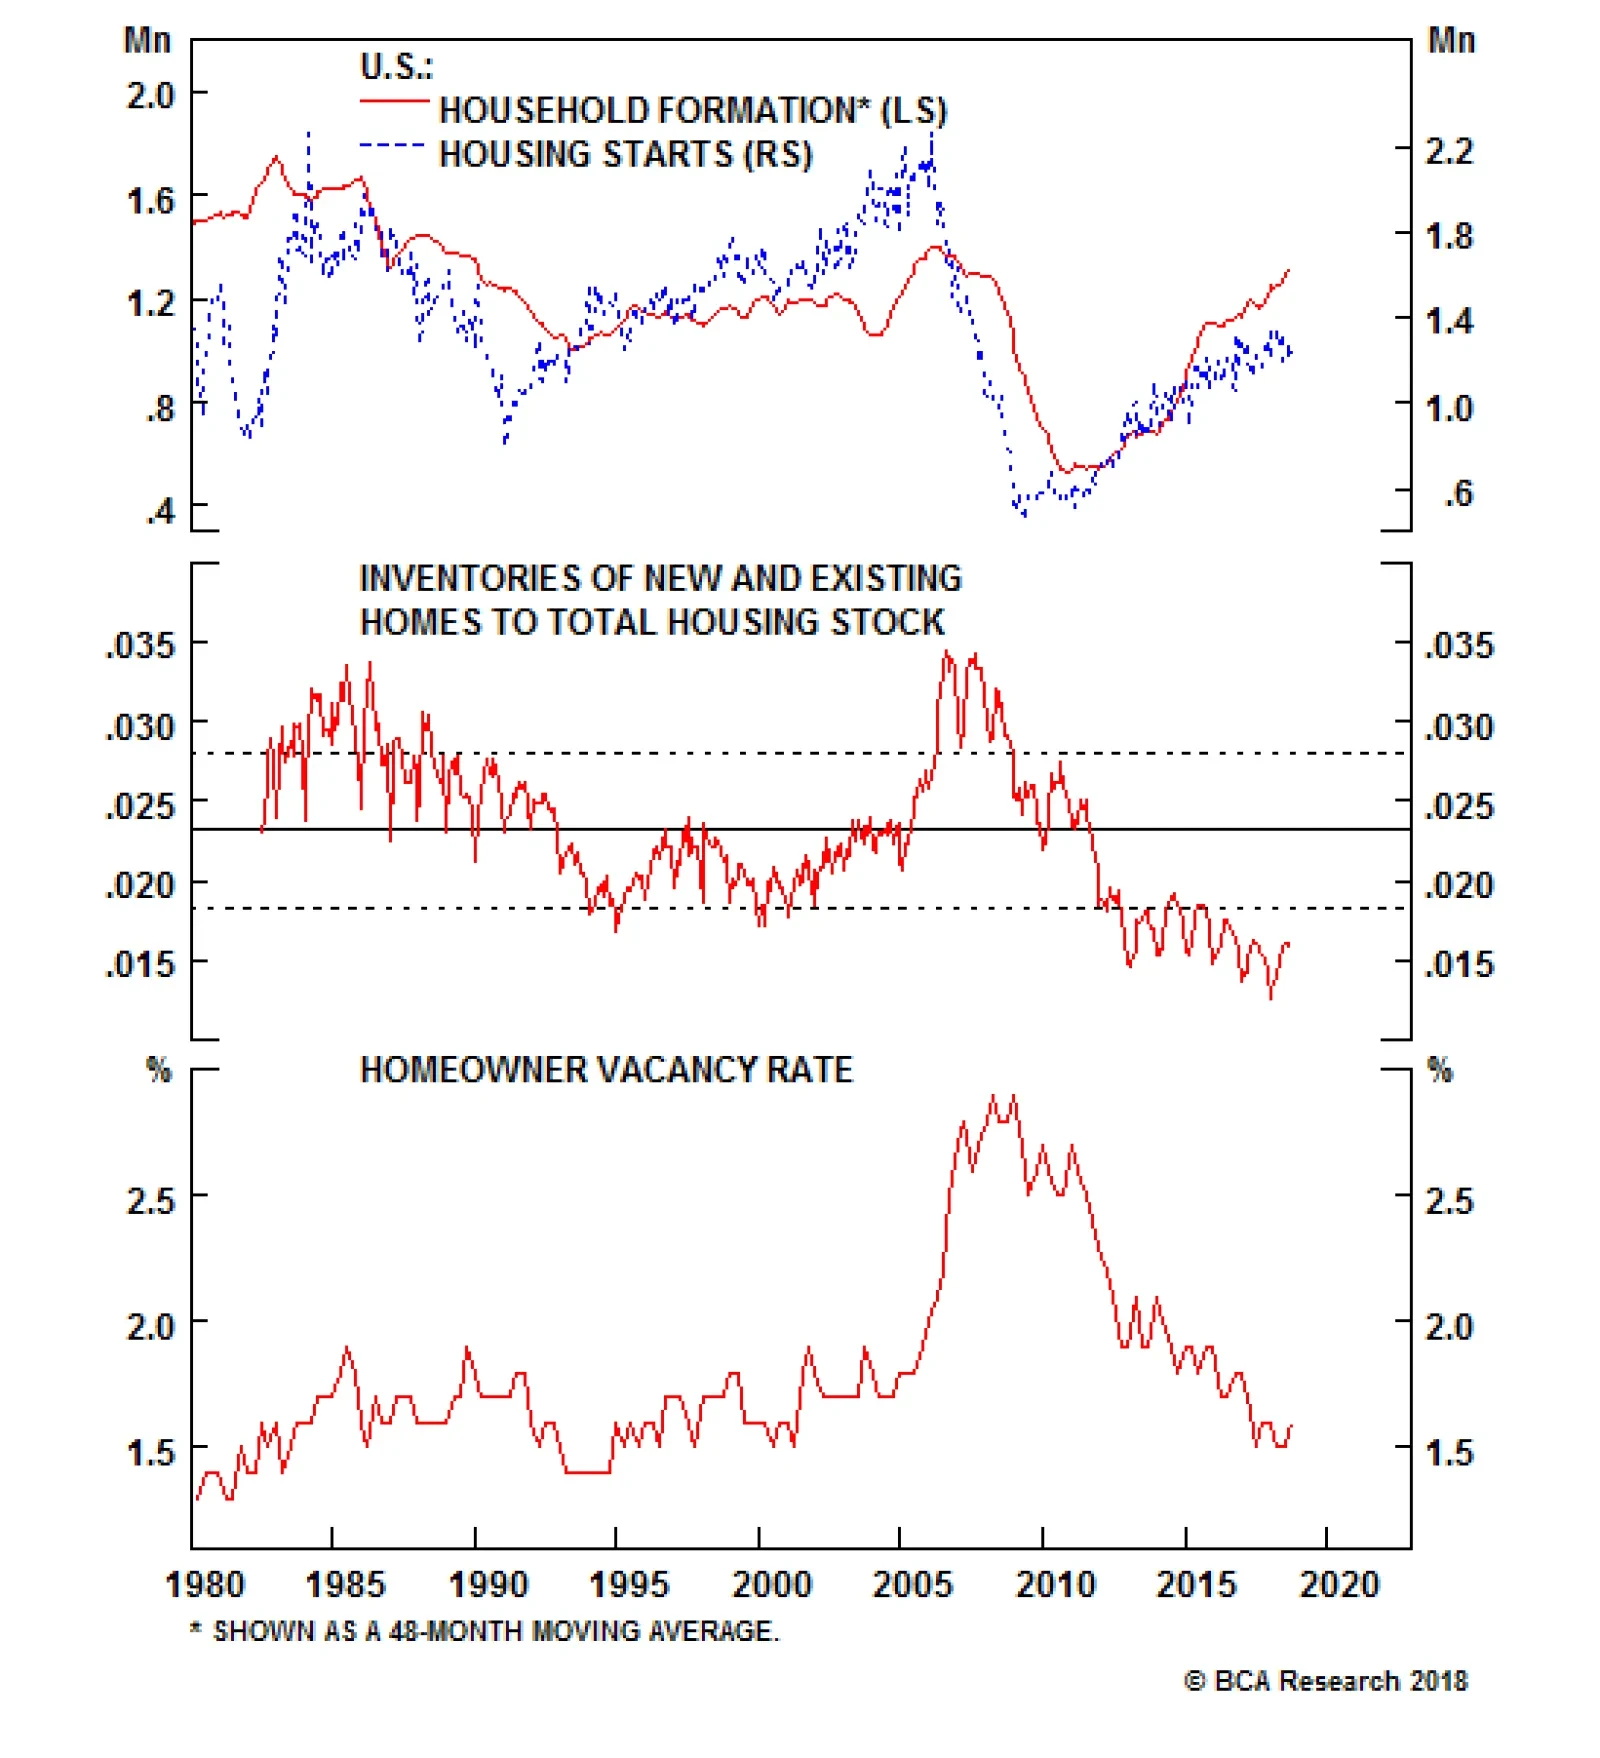
Despite the recent weakness in the U.S. housing data, our strategists believe that the fundamentals for housing are good and that the conditions that triggered the housing recession in 2008 are absent. The homeownership rate is back in its historical…
The outlook for housing and residential investment remains an important part of the growth outlook for the U.S. economy, even if our U.S. strategists think its impact on growth has diminished (see next Insight). More important, the housing data has been…