Sectors

Overweight 2018 has been a tough year for the S&P industrial conglomerates index as all of the key constituent members (GE, MMM and HON) have progressively either disappointed on earnings or lowered forward guidance. Further, industrial dividend stalwart GE yesterday took their dividend down to $0.01 per share, effectively suspending the dividend while the company refocuses its businesses and deleverages. The market’s reaction to the forgoing has been brutal, taking the sector down to relative levels lower than the deepest depths of the financial crisis (recall that GE was, at the time, one of the largest lenders in the U.S.). We think this is an overreaction; our Valuation Indicator is now more than one standard deviation below fair value while our Technical Indicator is extraordinarily oversold, a position that has heralded mean reversions in the past. Bottom Line: In the absence of any confirming data supporting such draconian valuation moves on already record-low EPS growth estimates, we believe a window for solid value at exceptional prices has opened. Accordingly, today we are lifting our recommendation on the S&P industrial conglomerates index to overweight from neutral. This move preserves our overweight recommendation on the GICS 1 S&P industrials index, given our downgrade of the S&P railroads index earlier this week.1 The ticker symbols for the stocks in this index are: BLBG: S5INDCX - GE, MMM, HON, ROP. 1 Please see BCA U.S. Equity Strategy Weekly Report, “Critical Reset,” dated October 29, 2018, available at uses.bcaresearch.com.
A Rout For Conglomerates Opens A Buying Opportunity
A Rout For Conglomerates Opens A Buying Opportunity
Highlights So What? The bull market in defense stocks is global and only beginning. We construct a BCA Global Defense Index to give investors exposure to this theme. Why? Multipolarity will drive uncertainty and conflict, spurring arms demand to Cold War heights. Contemporary geopolitical hotspots require expensive and modern technology. Cold War-era weapon systems are long in the tooth and in need of replacement. Also... We close our long Energy / short S&P 500 portfolio hedge for a gain. Feature It is somewhat of a cliché to tell clients that one of our highest conviction calls is to be overweight defense stocks. We are, after all, geopolitical investment strategists! Our decision to go long S&P 500 aerospace and defense stocks / short MSCI ACW is up 14% since initiation in December 2016. In this report, we build on previous work focusing on U.S. defense stocks and expand our analysis to global plays. GPS' Mega-Theme: Multipolarity Is Good For War International affairs are characterized by an anarchic governance structure. In the absence of a global government, the vacuum of power is filled by powerful states. These states behave like bullies in the schoolyard. When a single, powerful bully dominates the lunch break, all other kids fall in line or suffer the bully's wrath. When two bullies split the yard into warring camps, proxy fights may emerge on the sidelines, but generally an equilibrium is preserved. Formal political science theory and history teach us that the further we are from a hegemonic global structure where one country (the hegemon) dominates and bullies all others, the closer we are to anarchy. The "offensive realism" school of International Relations theory further splits multipolarity into two types: Balanced multipolarity is characterized by a number of roughly equally powerful states, similar to the distribution of power of continental Europe during the "Concert of Europe" era in the nineteenth century. Unbalanced multipolarity is closest to contemporary geopolitics. In The Tragedy Of Great Power Politics, John Mearsheimer reviewed 200 years of European history and concluded that unbalanced multipolarity is by far the most volatile geopolitical system (Table 1).1 Table 1Global System Structure And War
"War! What Is It Good For? - Absolutely Noth...." Actually, Global Defense Stocks!
"War! What Is It Good For? - Absolutely Noth...." Actually, Global Defense Stocks!
A multipolar ordering of global power, therefore, produces the highest level of disorder (Chart 1). This finding is theoretically elegant, but normatively disturbing. Every country gets a voice and an opportunity to defend its sovereignty. But the international order is normatively ignorant and desires a bully or hegemon. Chart 1Multipolarity Produces Disorder
Multipolarity Produces Disorder
Multipolarity Produces Disorder
Over the past fifty years, there have been three identifiable periods in the global arms market (Chart 2): Chart 2Further Upside In The 'War Bull Market'
Further Upside In The 'War Bull Market'
Further Upside In The 'War Bull Market'
Cold War Arms Race - 1961-1982: The arms trade grew by a whopping 177% during this period, with an average annual growth rate of 5.5%; Disarmament - 1982-2002: Arms trade shrunk by 61% and average annual growth rate was -3.9%; Multipolarity - 2002-present: What started with the U.S. defense buildup following 9/11 has evolved into a truly global response to emerging multipolarity. The arms trade grew by 73% from 2002 to 2017, with an average annual growth rate of 3.4%. Bottom Line: In 2017, the total arms trade was 68% of its peak in 1982, signifying that we have more room to go in this recent "War Bull Market." Given that unbalanced multipolarity produces a higher volume of conflict than a bipolar system, we would expect the current phase to be more fruitful for the global arms race than even the Cold War era. The Pillars Of An Arms Bull Market Chart 3Global Defense Spending...
Global Defense Spending...
Global Defense Spending...
In this report, we focus on the global arms trade, which is different from global defense spending (Chart 3). This is because global defense spending includes non-investible transactions, such as spending on salaries, buildings, health care, and pensions. The global arms trade was once 20% of global defense spending, but is now only 1.9% (Chart 4). Chart 4...Is Different From The Global Arms Trade
...Is Different From The Global Arms Trade
...Is Different From The Global Arms Trade
The reason is that salaries and pensions now dominate defense budgets. In the U.S., they make up 42% of all expenditure. They are higher in much of the developed world (66% in Italy, for example). Moreover, many countries that in 1960 did not have an armaments industry have become quite adept at satisfying demand via domestic production. We nonetheless would expect the global arms trade to bounce off of its lows today. There are three main reasons. Evolving Conflict Zones: Asia And Europe The primary reason to expect a brisk pickup in the global arms race is that the global conflict zones are evolving. Multipolarity is causing shifting geopolitical equilibriums. We expect both East Asia and Europe - largely dormant as hotspots since the end of the Cold War - to catch up with the Middle East as zones of tensions. Periods of rising conflict tend to coincide with the rise in the global arms trade (Chart 5). Chart 5Rising Conflict Coincides With Escalating Arms Trade
Rising Conflict Coincides With Escalating Arms Trade
Rising Conflict Coincides With Escalating Arms Trade
East Asia is our primary concern. Sino-American tensions have been brewing for decades, well before the trade war initiated by the Trump administration. Recently, the trade war has begun to spill into strategic areas (Table 2), creating a vicious feedback loop that could spark an accident or outright military conflict. Table 2Trade War Spills Into Strategic Areas
"War! What Is It Good For? - Absolutely Noth...." Actually, Global Defense Stocks!
"War! What Is It Good For? - Absolutely Noth...." Actually, Global Defense Stocks!
The South China Sea is the premier geographic location of U.S.-China strategic friction. It is a hub for international trade, a vital supply route for all major Asian economies, and the premier focus of China's attempt to rewrite global rules (Diagram 1). We update our list of clashes in this area in Appendix A. Diagram 1South China Sea As Traffic Roundabout
"War! What Is It Good For? - Absolutely Noth...." Actually, Global Defense Stocks!
"War! What Is It Good For? - Absolutely Noth...." Actually, Global Defense Stocks!
China has used its growing economic heft in the region to bully its neighbors into acquiescing to its geopolitical posture (Chart 6). It has used economic sanctions, trade boycotts, and tourism bans to get its way with the neighborhood. China's East Asia neighbors - including Japan - will look to balance their growing dependence on the Chinese economy with a desire to maintain sovereignty. One way to do so will be to rearm and present a formidable challenge to Beijing's regional hegemony. This means that not only the South China Sea but also China's entire periphery is at risk of friction, and this is true regardless of any U.S. interest in Asia. Chart 6China Uses Its Economic Might To Bully
China Uses Its Economic Might To Bully
China Uses Its Economic Might To Bully
Europe is also growing as a potential source of global arms demand. Since the end of the Cold War, Europe has seen a decline in defense spending. One reason is the NATO alliance, which has allowed Europeans to pass the buck to the U.S. This has not only been the case with the safely cocooned Western European states. Poland, intimately familiar with the built-in geopolitical risks of its neighborhood, reduced its defense spending once it joined NATO. President Trump has made awakening Europe from its stupor a key pillar of his trans-Atlantic policy. A combination of Trump's pestering and concerns that the U.S. is trending towards isolationism with an evolving threat matrix that now includes terrorism, migration, and Russia should be enough to spur Europeans to meet their commitment to spend 2% of GDP on defense (Chart 7). Chart 7Europeans Will Be Swayed To Meet Defense Commitments...
"War! What Is It Good For? - Absolutely Noth...." Actually, Global Defense Stocks!
"War! What Is It Good For? - Absolutely Noth...." Actually, Global Defense Stocks!
If NATO member states and Japan were to respond to their evolving threats and commit to spending 2% of GDP on defense, the impact on global arms demand would be significant. The extra spending would be roughly $145 billion, a 14% increase from current levels (Chart 8). Chart 8...Raising Global Arms Demand
"War! What Is It Good For? - Absolutely Noth...." Actually, Global Defense Stocks!
"War! What Is It Good For? - Absolutely Noth...." Actually, Global Defense Stocks!
What about the Middle East? In the short term, we are concerned that President Trump's "maximum pressure" policy could lead to kinetic action against Iran. In the medium and long term, we expect some form of an equilibrium to emerge in the Middle East that would keep regional demand for weapons stable at current elevated levels. Saudi Arabia has been the primary importer of weapons, with 13% of total demand since 2002. Saudi purchases have accelerated as the U.S. has geopolitically deleveraged out of the region (Chart 9 and Chart 10). Chart 9As The U.S. Military Deleverages...
As The U.S. Military Deleverages...
As The U.S. Military Deleverages...
Chart 10...The Saudi Arabian Military Leverages
...The Saudi Arabian Military Leverages
...The Saudi Arabian Military Leverages
Evolving Technological Demands The U.S. invasion of Afghanistan and Iraq at the beginning of this century was probably the last large-scale mechanized conflict involving large formations of main battle tanks (MBT). The evolving threat matrixes in East Asia and Europe are likely to create a growing demand for naval, air superiority, and drone/autonomous technology. In East Asia, the two main risk theaters are the South and East China Seas. In Europe, the Mediterranean, the Baltic, and the Black Seas are increasingly becoming a risk vector due to the instability of North African and Middle East countries, as well as Russian assertiveness. This is good news for the arms industry as aircraft and ships are some of the most lucrative exports given the high level of technological sophistication that goes into developing them (Chart 11). A war fought in the trenches and jungles by soldiers and insurgents is unlikely to be very profitable, other than for small arms manufacturers. But tensions between sovereign nations across large distances and bodies of water will be highly lucrative for major defense manufacturers that specialize in anti-access/area-denial systems.2 Chart 11Aircraft And Ships Are Most Lucrative
"War! What Is It Good For? - Absolutely Noth...." Actually, Global Defense Stocks!
"War! What Is It Good For? - Absolutely Noth...." Actually, Global Defense Stocks!
Furthermore, capital depreciation is advanced for the most sophisticated (and thus expensive) military technology that was introduced at the tail-end of the Cold War expansionary phase. The U.S. aircraft carrier fleet, for example, is mostly made up of Nimitz-class carriers, which have served for the past 43 years on average (Chart 12). Chart 12Capital Depreciation Is Advanced
"War! What Is It Good For? - Absolutely Noth...." Actually, Global Defense Stocks!
"War! What Is It Good For? - Absolutely Noth...." Actually, Global Defense Stocks!
Our back-of-the-envelope calculations show that the cyclicality in U.S. aircraft carriers is apparent across the major defense systems. Looking at 40 countries and their respective aircraft and MBTs, the bulk of these weapons is beyond the average age of the previous generation when it was retired (Chart 13). Part of the reason for the extended life cycle is better technology, but we suspect the main reason is that these major weapon systems were developed at the height of the Cold War and have not been updated since then. Chart 13Weapons Are Beyond Retirement Age, Need Updating
"War! What Is It Good For? - Absolutely Noth...." Actually, Global Defense Stocks!
"War! What Is It Good For? - Absolutely Noth...." Actually, Global Defense Stocks!
Population Aging The demographic trends of population aging and low birth rates have wide-ranging macroeconomic implications. But they will also impact the defense industry by encouraging automation. There are benefits to automation in the military sphere beyond simply replacing a shrinking pool of able-bodied youth. First, the likely geopolitical hotspots of this century - East Asian seas, the Persian Gulf, the Black Sea, the Mediterranean, and the Indian Ocean - are conducive to high-tech warfare. These bodies of water will be patrolled by drones and plied by autonomous surface vessels while hypersonic missiles deny access to the enemy. Second, by shifting the burden of fighting wars from humans to robots, policymakers will face lower constraints to conflict. This development will not only encourage policymakers to develop autonomous weapon systems, but might also increase the frequency with which they are used, destroyed, and thus re-ordered, shortening the hardware life-cycle and thus increasing the sales volume. Bottom Line: Global multipolarity has seen the U.S. geopolitically deleverage from the Middle East, threaten Europe with abandonment, and put pressure on China in East Asia. These are trends that we believe are here to stay irrespective of President Trump's success or failure in the 2020 election. They are all bullish for defense spending and arms trade. In addition, evolving technological demands and global demographic trends will buoy the arms trade. We expect this era of unbalanced multipolarity to be even more lucrative for global defense contractors. The U.S.: Remain Overweight Anastasios Avgeriou, BCA's chief U.S. equity strategist, recommends that investors remain overweight the pure-play BCA defense index and add exposure to it on any meaningful pullbacks while keeping it as a structural overweight within the GICS1 S&P industrials index. In the U.S., defense spending and investment have bottomed and will continue to accelerate. The Congressional Budget Office (CBO) continues to project that defense outlays will jump further next year (middle panel, Chart 14). We expect that this breakneck pace is actually sustainable, mainly because any fiscal compromise with Democrats on discretionary, non-defense spending would require acquiescence on GOP spending priorities, such as defense. Defense outlays will therefore continue to expand into the 2020s. Chart 14Upbeat Defense Outlays...
Upbeat Defense Outlays...
Upbeat Defense Outlays...
Such a buoyant demand backdrop is music to the ears of defense contractor CEOs and represents a boost to defense equity revenue growth prospects. Defense contractors enjoy high operating leverage. No wonder M&A activity is robust: at least four large deals have been announced in the past year that are underpinning both takeout premia and relative share prices (bottom panel, Chart 15). Chart 15...And A Flurry Of M&A Is A Boon For Defense
...And A Flurry Of M&A Is A Boon For Defense
...And A Flurry Of M&A Is A Boon For Defense
A closer look at operating metrics corroborates the view that defense goods manufacturers are firing on all cylinders. New orders recently jumped to fresh all-time highs and the industry's shipments-to-inventories ratio is rising, on track to surpass the 2008 peak. Unfilled orders are also running at a high rate, signaling that factories will keep on humming at least for the next few quarters (Chart 16). Chart 16Firming Operating Metrics
Firming Operating Metrics
Firming Operating Metrics
Importantly, the industry is not standing still and is making significant investments. U.S. defense capex as reported in the financial statements of constituent firms is growing at roughly 20% annually, or twice as fast as overall capex (Chart 17). Defense ROE is running near 30%, again roughly double the rate of the broad market (Chart 18). Chart 17Industry Is Not Standing Still
Industry Is Not Standing Still
Industry Is Not Standing Still
Chart 18Healthy Balance Sheet With High ROE...
Healthy Balance Sheet With High ROE...
Healthy Balance Sheet With High ROE...
Valuations are on the expensive side and in overshoot territory (Chart 19). This is clearly a risk to the overall view. However, if our structural thesis pans out, then defense stocks in the U.S. will grow into their pricey valuations as happened in the back half of the 1960s. Chart 19...But Valuations Are Expensive
...But Valuations Are Expensive
...But Valuations Are Expensive
Bottom Line: The secular advance in pure-play defense stocks remains in place. BCA's U.S. Equity Strategy recommends an above-benchmark allocation. The ticker symbols for the stocks in the BCA defense index are: LMT, LLC, NOC, GD, and RTN. Global Stocks: Be Discerning Beyond the U.S., which global defense stocks are appealing? We believe that there are several market and structural factors to consider. We have ranked national defense sectors by market and structural factors in Tables 3 and 4. Further, Appendix B lists all the non-U.S. weapon manufacturers that we examined, as well as market performance by country. Table 3Russian Defense Sector Attractive On Market Factors
"War! What Is It Good For? - Absolutely Noth...." Actually, Global Defense Stocks!
"War! What Is It Good For? - Absolutely Noth...." Actually, Global Defense Stocks!
Table 4European Companies Rank Highly On Structural Factors
"War! What Is It Good For? - Absolutely Noth...." Actually, Global Defense Stocks!
"War! What Is It Good For? - Absolutely Noth...." Actually, Global Defense Stocks!
Momentum - We like stocks from equity markets that have momentum behind them, i.e. whose stock are above their 200-day moving average. Relative valuation - We like defense sectors that are at a discount relative to the U.S. plays. Performance since Trump - For any country that has outperformed the U.S. aerospace and defense sector since the inauguration of President Trump on January 20, the market believes in its competitiveness vis-à-vis the largest exporter. Geographical diversity - We have ranked country defense sectors by how diverse their sources of revenue are. The higher the figure, the more geographically diverse the revenue pool. Russian and Indian defense plays score very low on this variable as they depend solely on one source: themselves. Exposure to arms trade - We have ranked country defense sectors by how exposed their contractors are to defense as opposed to civilian production. Most companies have major civilian outlays. To fully capture our multipolarity theme, we have ranked companies based on how fully focused they are on producing and selling weapons. Share of global arms market - We recommend that clients buy defense companies in countries that already have a high share of the global arms market. Decisions on purchasing weapons often involve path dependency due to the need to acquire compatible systems. Defense spending - We penalize countries that are already spending 2% of GDP on defense. Their companies will see little boost to domestic demand. It is the other, under-spending countries that will significantly increase their outlays over the next decade. Russian companies score high on market factors. They have good momentum, are attractively valued relative to the U.S. aerospace and defense sector, and are structurally supported. Israel, Canada, Australia, and Brazil are also attractive. All of these are made up of only one stock. On structural factors alone, we like German, British, Italian, and Swedish defense companies. They are geographically diversified, have a respectable share of the global arms trade, and have both reason and room to increase domestic spending. French companies are also structurally attractive, although France may have less need to increase defense outlays. Putting it all together, we are creating a BCA Global Defense Basket. We would include the following global tickers in that basket: A:ASBX, F:AIRS, F:CSF, F:SGM, F:AM@F, C:CAE, D:RHM, D:TKA, I:LDO, I:FCTI, ULE, COB and W:SAAB. Clients may want to include in the basket the five U.S. tickers recommended by BCA's U.S. Equity Strategy: LMT, LLL, NOC, GD, and RTN. We recommend that investors buy this basket, in absolute terms, as a structural investment. Housekeeping We are closing two of our hedges today. First, we are closing long Brent / Short S&P 500 for a gain of 6% and our long U.S. energy / short U.S. information technology for a loss of 1.63%. We initiated the two tactical trades on October 3, which means we timed the market correction perfectly. However, concerns over a supply glut in the oil market meant that the "long" part of our trade did not work out. Furthermore, there have been leaks from the White House to the media that the U.S. may award exceptions to the oil embargo to several critical importers. This would suggest that the Trump administration is beginning to see the risks of its aggressive maximum pressure strategy toward Iran and therefore may be trying to backtrack from it. We still think that the odds of an oil spike due to geopolitics in 2019 are high, but they do appear to be declining, at least for the time being. As such, we are closing the two trades for a net gain. We will continue to monitor the Iran embargo carefully as we expect that geopolitical risks will again be understated in the future, offering investors another opportunity to be long energy. Jesse Anak Kuri, Consulting Editor jesse.anakkuri@mail.mcgill.ca 1 Please see John Mearsheimer, The Tragedy Of Great Power Politics (New York: W.W. Norton & Company, 2001). 2 Anti-access/area-denial (A2/AD) is a strategy of preventing an adversary from occupying or transiting a geographic area. Defense systems that perform A2/AD functions in the modern era tend to be expensive and technologically sophisticated. They include anti-ship missiles, sophisticated radars, attack submarines, and air-superiority fighter jets. Appendix A Notable Clashes In The South China Sea (2010-18)
"War! What Is It Good For? - Absolutely Noth...." Actually, Global Defense Stocks!
"War! What Is It Good For? - Absolutely Noth...." Actually, Global Defense Stocks!
Notable Clashes In The South China Sea (2010-18) (Continued)
"War! What Is It Good For? - Absolutely Noth...." Actually, Global Defense Stocks!
"War! What Is It Good For? - Absolutely Noth...." Actually, Global Defense Stocks!
Notable Clashes In The South China Sea (2010-18) (Continued)
"War! What Is It Good For? - Absolutely Noth...." Actually, Global Defense Stocks!
"War! What Is It Good For? - Absolutely Noth...." Actually, Global Defense Stocks!
Appendix B Appendix B Chart 20British Defense Stocks
British Defense Stocks
British Defense Stocks
Appendix B Chart 21French Defense Stocks
French Defense Stocks
French Defense Stocks
Appendix B Chart 22German Defense Stocks
German Defense Stocks
German Defense Stocks
Appendix B Chart 23Italian Defense Stocks
Italian Defense Stocks
Italian Defense Stocks
Appendix B Chart 24Swedish Defense Stocks
Swedish Defense Stocks
Swedish Defense Stocks
Appendix B Chart 25Norwegian Defense Stocks
Norwegian Defense Stocks
Norwegian Defense Stocks
Appendix B Chart 26Canadian Defense Stocks
Canadian Defense Stocks
Canadian Defense Stocks
Appendix B Chart 27Australian Defense Stocks
Australian Defense Stocks
Australian Defense Stocks
Appendix B Chart 28Korean Defense Stocks
Korean Defense Stocks
Korean Defense Stocks
Appendix B Chart 29Japanese Defense Stocks
Japanese Defense Stocks
Japanese Defense Stocks
Appendix B Chart 30Singaporean Defense Stocks
Singaporean Defense Stocks
Singaporean Defense Stocks
Appendix B Chart 31Israeli Defense Stocks
Israeli Defense Stocks
Israeli Defense Stocks
Appendix B Chart 32Russian Defense Stocks
Russian Defense Stocks
Russian Defense Stocks
Appendix B Chart 33Brazilian Defense Stocks
Brazilian Defense Stocks
Brazilian Defense Stocks
Appendix B Chart 34Indian Defense Stocks
Indian Defense Stocks
Indian Defense Stocks
Appendix B Chart 35Turkish Defense Stocks
Turkish Defense Stocks
Turkish Defense Stocks
Appendix B Table 1Key Aerospace And Defense Companies
"War! What Is It Good For? - Absolutely Noth...." Actually, Global Defense Stocks!
"War! What Is It Good For? - Absolutely Noth...." Actually, Global Defense Stocks!
Appendix B Table 1Key Aerospace And Defense Companies, Continued
"War! What Is It Good For? - Absolutely Noth...." Actually, Global Defense Stocks!
"War! What Is It Good For? - Absolutely Noth...." Actually, Global Defense Stocks!
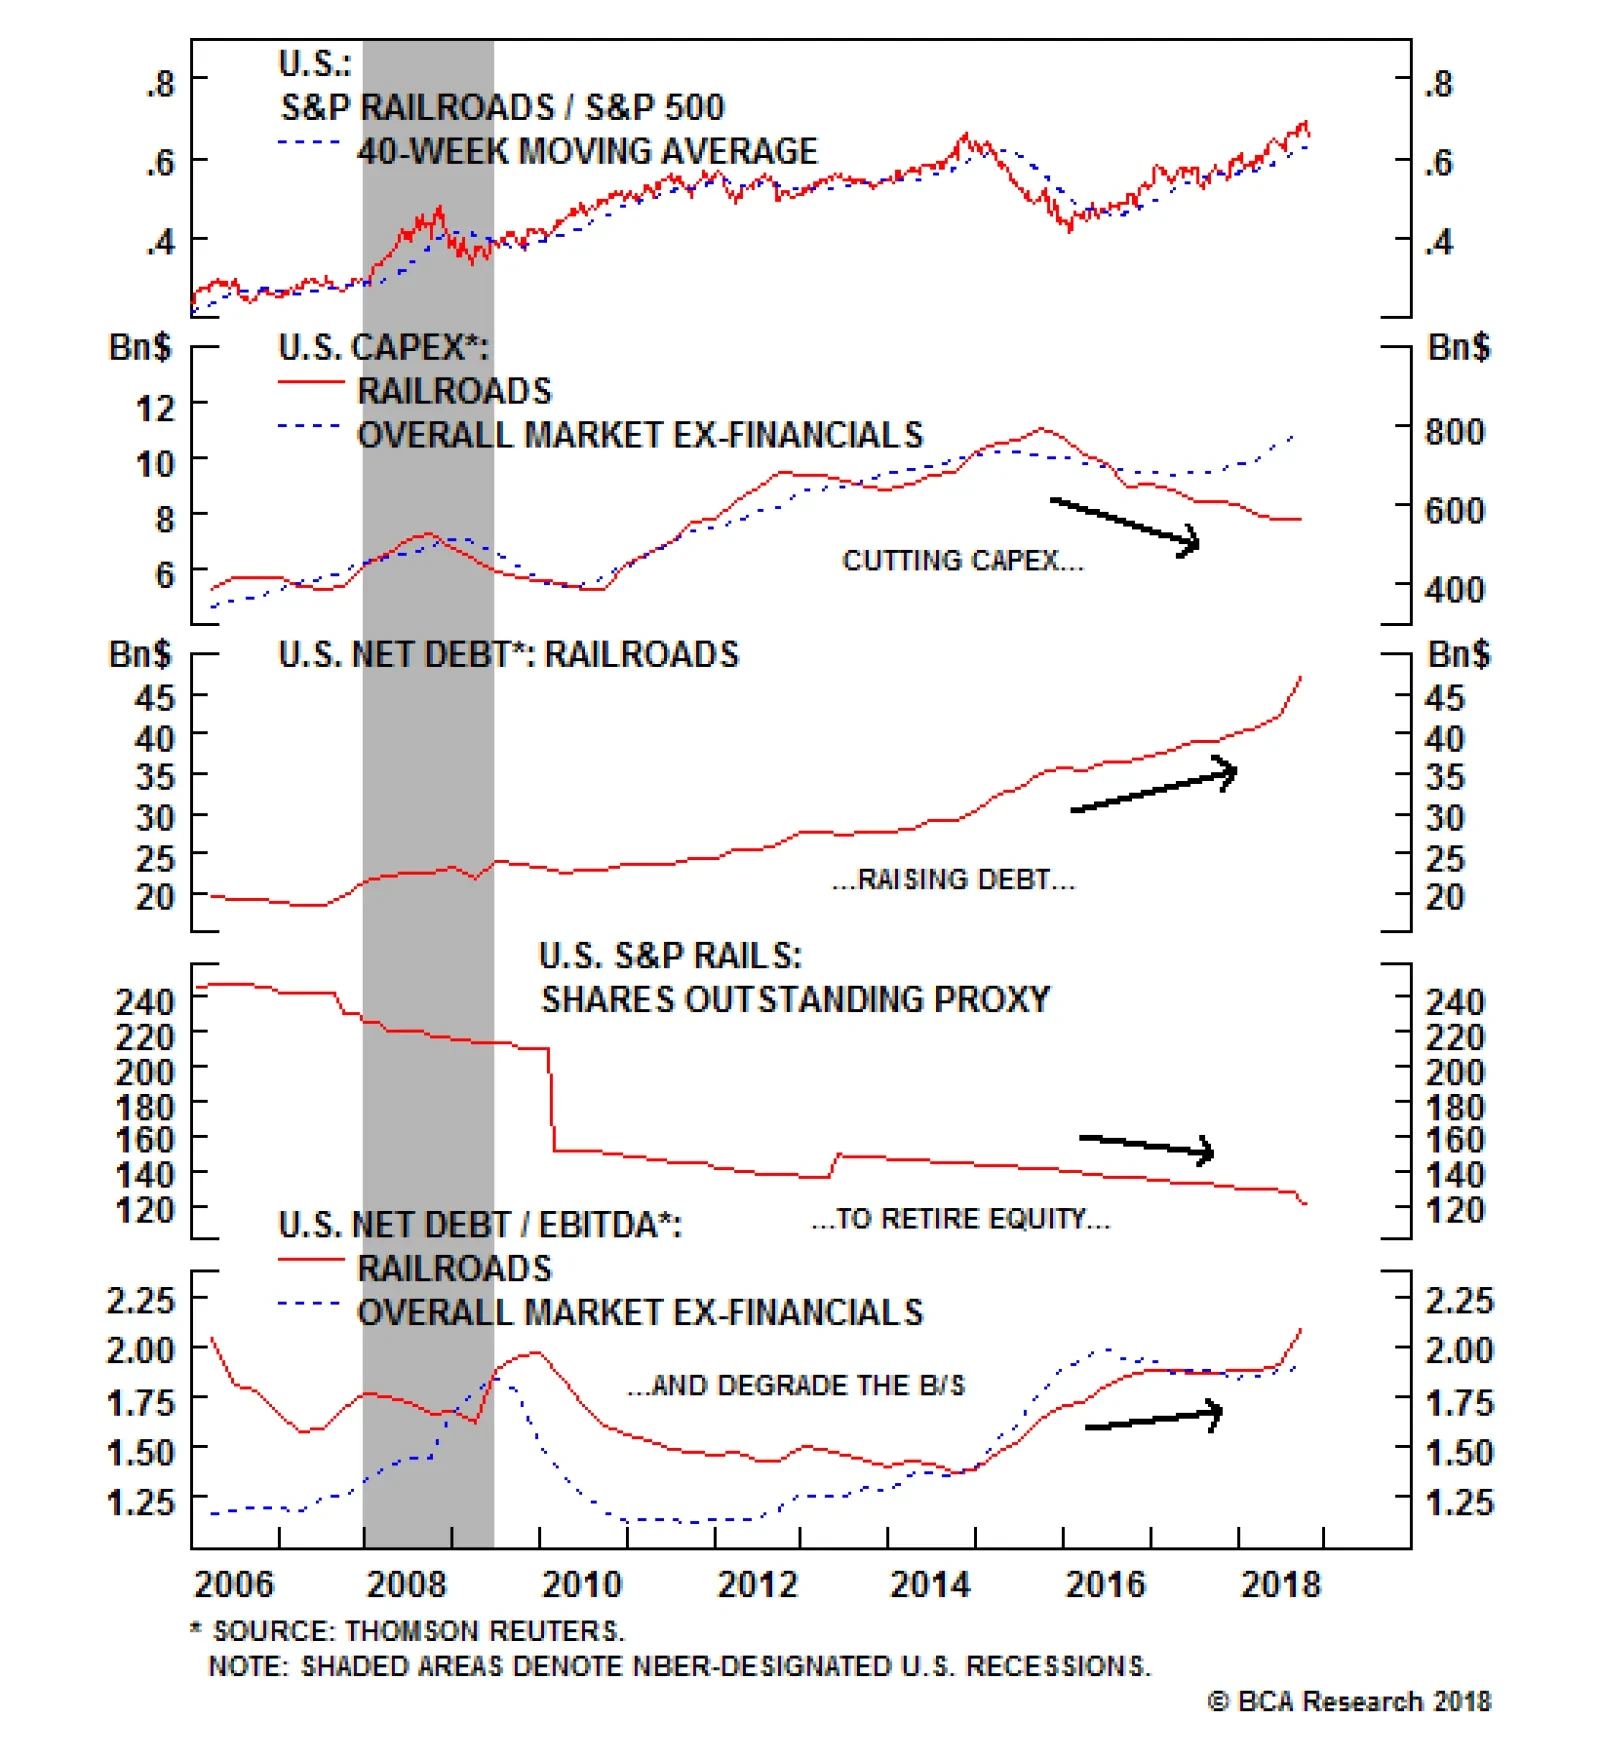
Neutral We have been riding the rails juggernaut for roughly 16 months, but the time has come to get off board. As shown in the chart at the side, technical conditions are overbought and relative valuations are pricey, hovering near previous extremes as investors are extrapolating good times far into the future. Such euphoric readings have historically been synonymous with a high relative performance mark for this key transportation sub-index and are a cause for concern. In Monday's Weekly Report, we highlight four key reasons why it is time for us to downgrade. First, this capital intensive industry has been reducing capex but increasing their debt load to retire equity, which erodes a cushion should cash flow growth suffer a mishap. Second, the global manufacturing outlook has downshifted on the back of Trump's trade rhetoric and China's larger than anticipated slowdown. Third, two of our key rail industry Indicators have suddenly turned south, particularly our Rail Shipment Diffusion Indicator which has fallen off a cliff recently. Lastly, industry operating metrics are deteriorating, at the margin, and intermodal rail shipments have rolled over. Bottom Line: We locked in relative gains of 15% since inception in the S&P rails index and downgraded to neutral on Monday; please see our Weekly Report for more details. The ticker symbols for the stocks in this index are: BLBG: S5RAIL - UNP, CSX, NSC, KSU.
Time To Get Off The Rails
Time To Get Off The Rails
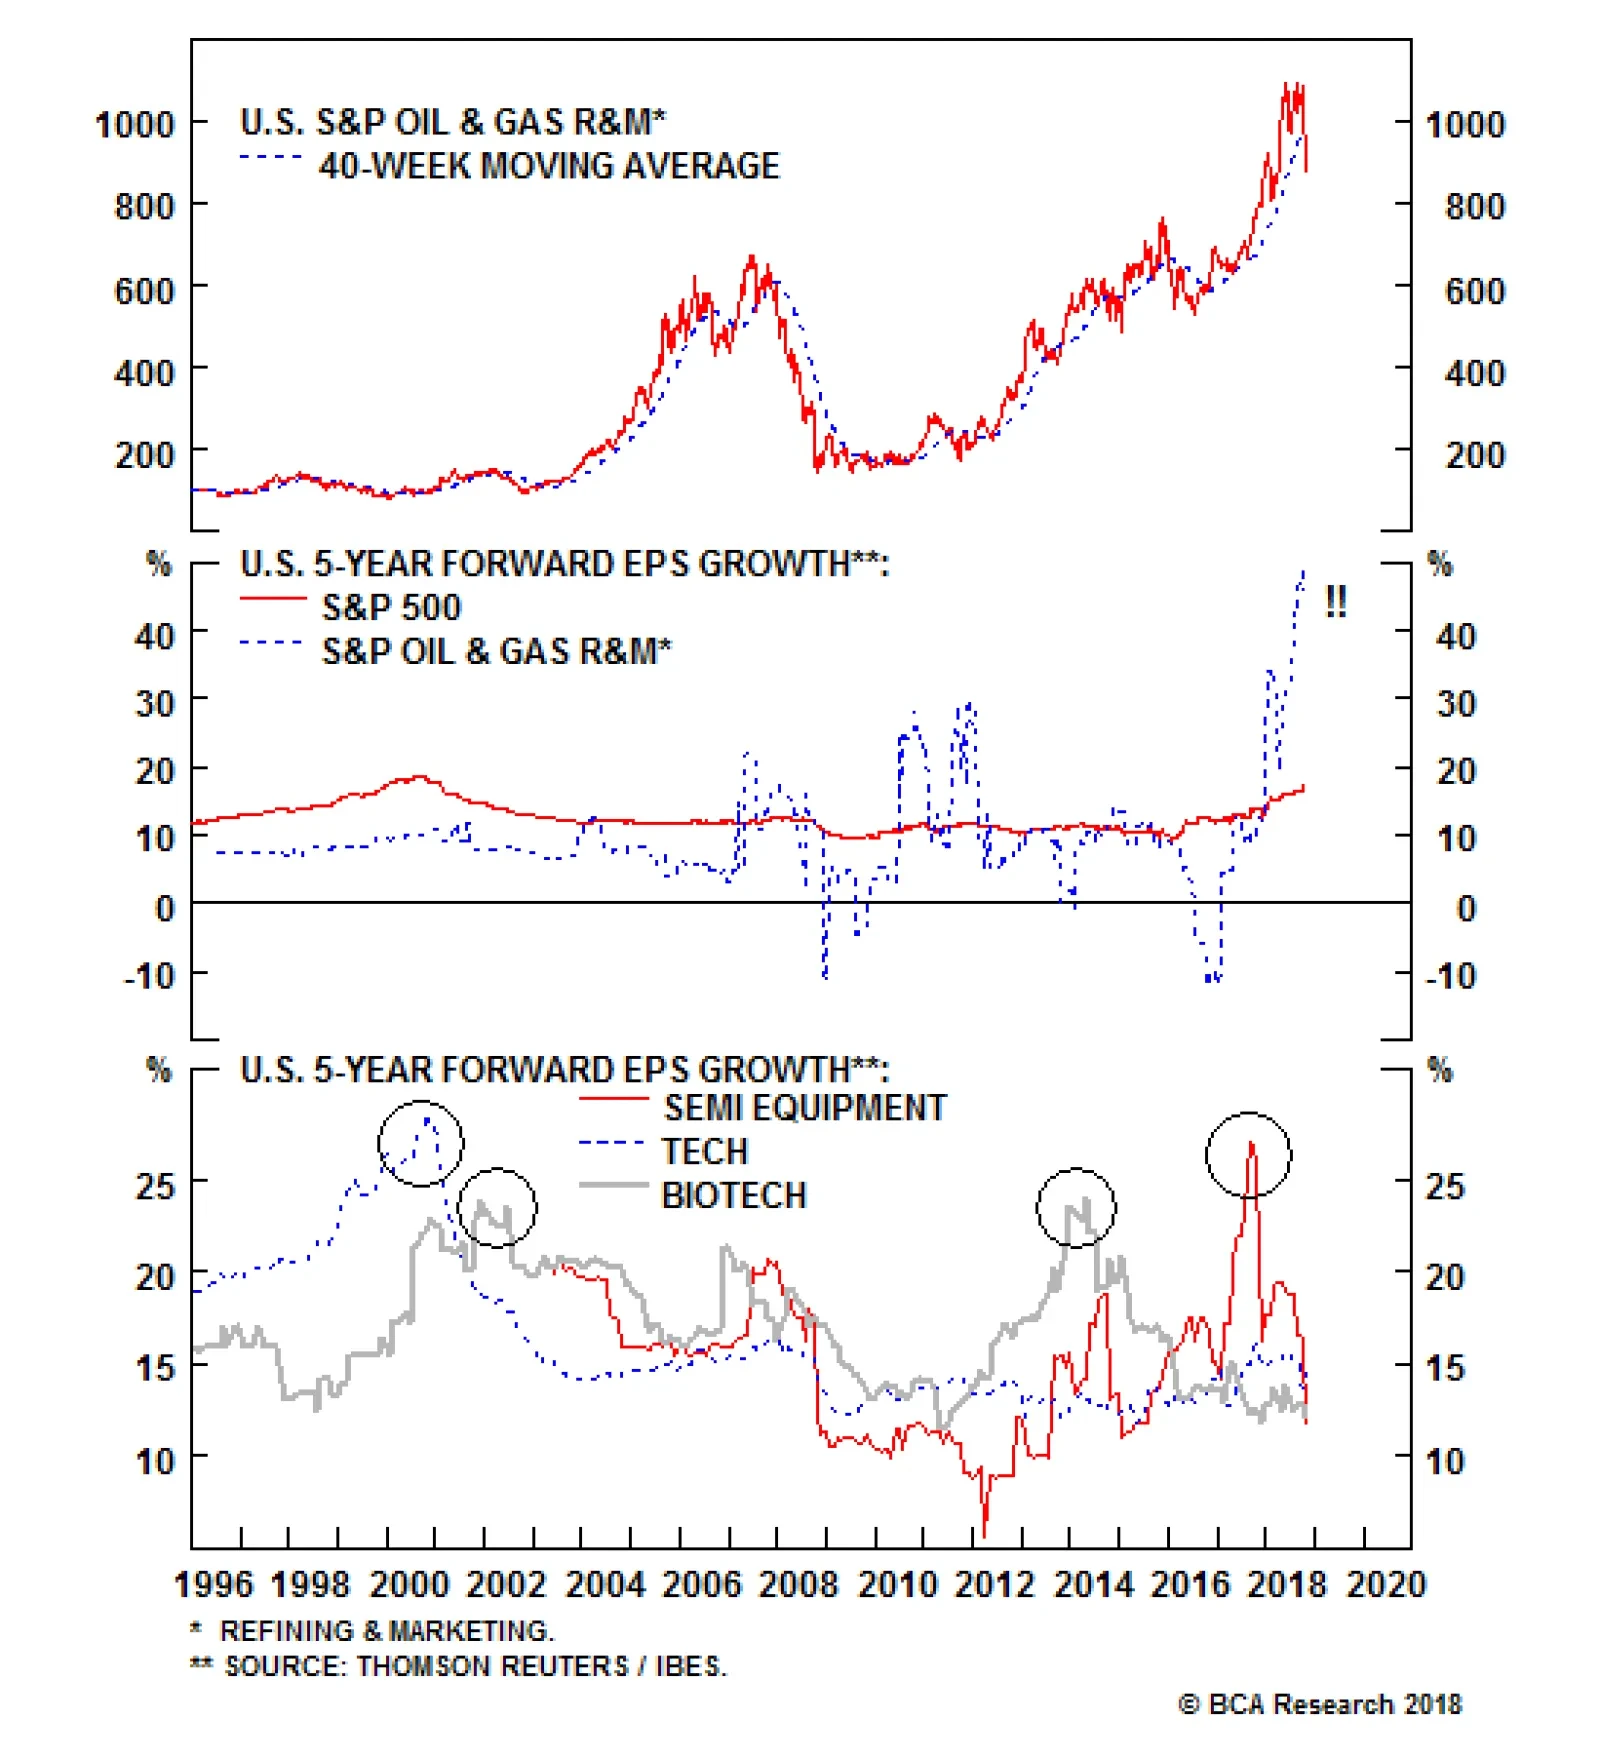
We remain puzzled with sell-side analysts' extreme long-term EPS euphoria in this niche energy space. Historically, when an index catapults to a 25%/annum 5-year forward EPS growth rate, it is time to run for cover: the tech sector in the late 1990s, biotech…
We do not want to overstay our welcome on the S&P rails index for a number of reasons. First, it is quite perplexing why this capital-intensive industry has been cutting capex as the rest of the non-financial corporate sector has been growing gross…
Highlights Portfolio Strategy Overbought technicals, pricey valuations, decelerating global growth, declining capex, rising indebtedness and softening operating metrics argue for hopping off the S&P railroads index. Rising refined product stocks, ebbing gasoline demand, and excessive analyst profit optimism underscore that more pain lies ahead for refiners. Recent Changes Book profits of 15% in the S&P railroads index and downgrade to neutral today. TABLE 1
Critical Reset
Critical Reset
FEATURE Equities continue to digest the recent healthy pullback, and should remain range-bound before building a base in order to resume their bull market run. As we highlighted in our October 9thWeekly Report, "stock market crash-prone October is upon us, and thus a pick-up in volatility would not come as a surprise".1 Simply put, the difference between perception and reality propagates as volatility. Volatility has indeed come roaring back. There are high odds that vol will settle at a higher level, and bouts of volatility will be more frequent. The most important determinant of vol is interest rates, as we first highlighted on March 5th this year.2 For almost a decade, the Fed kept the fed funds rate close to zero in order to suppress volatility. QE and excess liquidity injections into the financial system and in the economy also aided in bringing down volatility across assets classes. Now this process is working in reverse. Not only is the Fed tightening monetary policy by increasing the fed funds rate, but it is also allowing maturing bonds to fall off its balance sheet (what some market participants have defined as quantitative tightening). In other words, as the Fed is mopping up excess liquidity, volatility is making a comeback (Chart 1). Chart 1VIX The Comeback Kid
VIX The Comeback Kid
VIX The Comeback Kid
A relatively flat yield curve also points to higher volatility in the months ahead. This relationship is intuitive, given that a flat curve signals that the cycle is long in the tooth and a recession may be approaching. While both of these interest rate relationships with vol have a long lead time, the message is clear: investors should get accustomed to higher volatility at this stage of the cycle (yield curve shown on inverted scale, Chart 2). Chart 2Yield Curve And Vol Joined At The Hip
Yield Curve And Vol Joined At The Hip
Yield Curve And Vol Joined At The Hip
Following up from last week, our Economic Impulse Indicator (EII) caught the attention of a number of our clients, igniting a healthy exchange. One criticism is that this Indicator has had some big misses in the past. This is true, but the recent history (since mid-1990s) has enjoyed an extremely high correlation. Importantly, if we show SPX profits as an impulse, the fit with the EII increases considerably (bottom panel, Chart 3). In addition, the EII moves in lockstep with the impulse of S&P 500 momentum (second panel, Chart 3). Chart 3Economic Impulse Yellow Flag
Economic Impulse Yellow Flag
Economic Impulse Yellow Flag
Nevertheless, our worry remains intact and the risk of modest economic disappointment sometime early next year is rising (Chart 4). On that front, another indicator that continues to show signs of stress is the credit card chargeoff rate of U.S. commercial banks, excluding the 100 largest outfits. According to the Fed, both delinquencies and chargeoffs are near recessionary levels, a message large banks do not corroborate, at least not yet (Chart 5). Chart 4Economic Growth Trouble
Economic Growth Trouble
Economic Growth Trouble
Chart 5Watch Credit Quality
Watch Credit Quality
Watch Credit Quality
True, we do not think the consumer is at the cusp of retrenching as a tight labor market and rising wage inflation should boost disposable income, but rising interest rates are a clear headwind. Importantly, the fact that regional banks are sniffing out some credit quality trouble is disconcerting especially given the recent anecdote of commercial real estate (CRE) chargeoffs at Bank OZK, a regional bank that epitomizes the CRE excesses of the current cycle. We will continue to monitor our Indicators for further evidence of deteriorating credit quality. While all these risks are worrisome, and a surge in the U.S. dollar is a key EPS risk for 2019, last Friday we triggered our "buy the dip" strategy for long-term oriented capital that we have been touting recently - as the SPX hit the 10% drawdown mark since the late-September peak - predicated on BCA's view of no recession in the coming 12 months.3 In fact, none of the boxes in the three signposts we track to call the end of the cycle have been checked yet (please refer to last week's report for a recap).4 In addition, the multiple has reset significantly lower (down 20% from the cyclical peak set in January) flirting with the late-2015/early-2016 lows (Chart 6), leaving the onus on EPS to do the heavy lifting. Chart 6Wholesale Liquidation Should Bring Out Bargain Hunters
Wholesale Liquidation Should Bring Out Bargain Hunters
Wholesale Liquidation Should Bring Out Bargain Hunters
On that front, Q3 earnings season has been solid, despite the input cost inflation worries that MMM and CAT rekindled recently (please look forward to reading next week's pricing power update where we gauge if the U.S. corporate sector will be in a position to pass on input cost inflation down the supply chain or to the consumer). This week we downgrade a transportation sub-group that has been on fire, and update our view on an energy index we continue to dislike. Time To Get Off The Rails We have been riding the rails juggernaut for roughly 16 months, but the time has come to get off board. Chart 7 shows that technical conditions are overbought and relative valuations are pricey, hovering near previous extremes as investors are extrapolating good times far into the future. Such euphoric readings have historically been synonymous with a high relative performance mark for this key transportation sub-index and are a cause for concern. Chart 7Overvalued And Overbought
Overvalued And Overbought
Overvalued And Overbought
We do not want to overstay our welcome on the S&P rails index for a number of reasons. First, its is quite perplexing why this capital intensive industry has been cutting capex as the rest of the non-financial corporate sector has been growing gross fixed capital formation at near double-digit rates (second panel, Chart 8). Chart 8Capex Blues
Capex Blues
Capex Blues
Adding insult to injury, railroad CEOs have been changing the capital structure of their respective firms by borrowing extensively in order to retire equity (in order to satisfy shareholders) and thus artificially massaging EPS higher. Going through the recent history of the constituents' financial statements is worrying. Net debt-to-EBITDA is up 75% since early-2015 near 2.2x and higher than the overall market, largely driven by rising indebtedness (Chart 8). Taken together, lack of investment and a higher debt burden are painting a grim backdrop, especially if cash flow growth suffers a mishap. Second, the global manufacturing outlook has downshifted on the back of Trump's trade rhetoric and China's larger than anticipated slowdown. Tack on our souring margin proxy and relative EPS euphoria resting mostly on equity retirement is under attack (second panel, Chart 9). Chart 9Warning Signals...
Warning Signals...
Warning Signals...
Third, two of our key industry Indicators have suddenly turned south. Our Railroad Indicator has dropped into the contraction zone and our Rail Shipment Diffusion Indicator has fallen off a cliff lately (Chart 10). The implication is that rail freight demand is likely on the verge of cresting. Chart 10...Abound...
...Abound...
...Abound...
Fourth, industry operating metrics are deteriorating, at the margin. Intermodal rail shipments have rolled over. In fact, toppy consumer confidence alongside decreasing traffic at the Port of Los Angeles signal that the path of least resistance is lower for this key rail freight category, comprising 50% of total carloads (Chart 11). In addition, coal shipments are moribund, despite the recent slingshot recovery in natural gas prices that should have enticed utilities to switch out of nat gas and into coal for electricity generation (not shown). Chart 11...Even In Intermodel...
...Even In Intermodel...
...Even In Intermodel...
However, there are some positive offsets that prevent us from turning outright bearish on the S&P rails index. This transportation sub group is an oligopoly and is in the driver's seat with regard to pricing power (middle panel, Chart 12). In other words, it has the ability to pass rising diesel costs through to its clients as a fuel surcharge. Alternative modes of transportation like air freight and trucking are available, at least for some rail categories, but the switching costs are typically prohibitive and the relative price advantages few and far between. Chart 12...But There Are Offsets
...But There Are Offsets
...But There Are Offsets
Further, rail pricing power is a key input to our railroad EPS model and the message from our model is that EPS have more upside, at least until Q1/2019. Thus, we refrain from swinging all the way to a below benchmark allocation. Adding it up, overbought technicals, pricey valuations, declining capex rising indebtedness and softening operating metrics argue for hopping off the rails. Bottom Line: Lock in gains of 15% since inception in the S&P rails index and downgrade to neutral. The ticker symbols for the stocks in this index are: BLBG: S5RAIL - UNP, CSX, NSC, KSU. Refiners Crack Under Pressure Pure-play refiners remain our sole underweight within the energy space, and despite recent M&A activity, they have trailed the broad market by 9% since the early-July inception. More downside looms, and we continue to recommend a below benchmark allocation in the S&P oil & gas refining & marketing index. We remain puzzled with sell-side analysts' extreme long-term EPS euphoria in this niche energy space. Historically, when an index catapults to a 25%/annum 5-year forward EPS growth rate, it is time to run for cover: the tech sector in the late 1990s, biotech stocks in the early-2000s and in 2014 and, most recently, semi equipment stocks in late-2017 all painfully demonstrate that stocks hit a wall when profit euphoria is so elevated (bottom panel, Chart 13). Chart 13Too Good To Be True
Too Good To Be True
Too Good To Be True
Refiners are currently trading at a 45%/annum long-term EPS growth rate. While at first we thought base effects were the culprit, a closer inspection reveals that those effects were filtered out late last year and the recent increase in expected growth rate from 20% to north of 45% defies logic (middle panel, Chart 13). We expect a sharp revision to a rate below the broad market in the coming months, as refining stocks also continue to correct lower. There are a few reasons why we anticipate such a gravitational pull back down to earth. Refined product consumption is falling and that exerts a downward pull on refining profitability. This letdown in demand is materializing at a time when gasoline inventories are rising at a high mid-single digit rate (gasoline inventories shown inverted, bottom panel, Chart 14). Chart 14Bearish Supply Demand Backdrop
Bearish Supply Demand Backdrop
Bearish Supply Demand Backdrop
Not only have light vehicle sales crested, but also vehicle miles driven are flirting with the contraction zone, weighing heavily on gasoline demand prospects (second panel, Chart 15). Chart 15No Valuation Cushion
No Valuation Cushion
No Valuation Cushion
Ultimately, pricing discovery resolves any supply/demand imbalances and most evidence currently points to at least an easing in crack spreads. Chart 16 highlights that crude oil inventories are trailing the buildup in refined products stocks and that is pressuring refining margins. Chart 16Mixed Signals...
Mixed Signals...
Mixed Signals...
The implication is that refining industry profits will underwhelm, which will catch investors and analysts by surprise given their near and long-term optimistic EPS assessment. If our weak profit backdrop pans out, then a lack of a valuation cushion suggests that relative share prices will likely suffer a significant drawdown (bottom panel, Chart 15). Nevertheless, there are two related positive offsets. And, if they were to persist then our bearish view on refiners would be offside. The widening Brent-WTI crude oil spread suggests that crack spreads could reverse course if it stays stubbornly elevated. This wide oil price differential has pushed refining net exports close to all-time highs and represents a profit relief valve as the energy space has, up to now, escaped the trade wars unscathed (Chart 17). Chart 17...On Crack Spreads
...On Crack Spreads
...On Crack Spreads
Netting it out, rising refined product stocks, softening gasoline demand, and excessive analyst profit optimism underscore that more pain lies ahead for refiners. Bottom Line: Continue to avoid the S&P oil & gas refining & marketing index. The ticker symbols for the stocks in this index are: BLBG: S5OILR - PSX, VLO, MPC and HFC. Anastasios Avgeriou, Vice President U.S. Equity Strategy anastasios@bcaresearch.com 1 Please see BCA U.S. Equity Strategy Report, "The "FIT" Market" dated October 9, 2018, available at uses.bcaresearch.com. 2 Please see BCA U.S. Equity Strategy Special Report, "Top 10 Reasons We Still Like Banks" dated March 5, 2018, available at uses.bcaresearch.com. 3 Please see BCA U.S. Equity Strategy Insight, "Time To Bargain Hunt" dated October 26, 2018, available at uses.bcaresearch.com. 4 Please see BCA U.S. Equity Strategy Report, "Icarus Moment?" dated October 22, 2018, available at uses.bcaresearch.com. Current Recommendations Current Trades Size And Style Views Favor value over growth Favor large over small caps
Overweight The recent global move away from risk assets has been a headwind for the high-beta S&P investment bank and brokers index that thrives when risk appetites are healthy. Still, the return of volatility should be a boon to sector earnings; trading volumes have recently spiked, perhaps heralding the end of the decade-long withdrawal of trading liquidity from domestic bourses (second panel). Tack on a recovery in new and secondary issues and the equity desks promise to be busy for the rest of the year (third panel). Advisory revenues too are in recovery as the late-cycle rise in mergers appears to be upon us (bottom panel). As we have previously written, we continue to await merger mania as an anecdotal indicator on our checklist for the end of the cycle; we are still not there yet. Overall, despite the vagaries of the market, earnings in the S&P investment bank and brokers index should overwhelm; stay overweight. The ticker symbols for the stocks in this index are: BLBG: S5INBK - ETFC, SCHW, GS, RJF, MS.
Earnings Drivers Are Resilient For Investment Banks
Earnings Drivers Are Resilient For Investment Banks
Highlights Five risks to our bullish dollar stance need to be monitored: further weakness in the S&P 500; rebounding gold prices; stabilizing EM exchange rates and bond prices; Spanish bank stocks at multi-decade lows; and large, long-exposure by speculators to the greenback. However, China's lackluster response to stimulus and the U.S.'s domestic strength still favor the dollar. In fact, the key force likely to cause U.S. growth to converge toward weaker global growth will be a stronger U.S. dollar. Feature BCA has a positive bias toward the dollar for the coming six to nine months. Admittedly, the dollar is expensive, but cyclical determinants still favor a rally. The Federal Reserve is hiking rates as the U.S. economy is at full capacity and goosed up by fiscal injections. Yet global growth is very wobbly. This combination is a potent cocktail for USD strength. Despite these key sources of support, we cannot be dogmatic, especially as financial markets are anticipatory mechanisms, and therefore the dollar could have already priced in some of these developments. As such, this week we explore the key risks to our dollar view. While serious threats for the dollar exist over the upcoming two to three quarters, the key macro and financial drivers remain dollar bullish. The Threats 1) The S&P Sells Off Further The MSCI EAFE index, expressed in USD terms, is down nearly 20% since its January 2018 highs. Meanwhile, the S&P 500 has fallen 9% since its recent all-time high, or 7% vis-Ã -vis where it stood in late January. The risk is that as the global economic slowdown deepens, investors end up selling their good assets along with their bad ones. This means the S&P 500 could fall more. In fact, our colleague Peter Berezin writes in BCA's Global Investment Strategy that U.S. equities could fall an additional 6% from current levels before finding a durable support.1 The problem for the dollar is not whether stock prices fall. It is about what it means for the Fed. Until earlier this week, equity weakness had no impact at all on bonds. However, now, weak stock prices are dragging down U.S. bond yields. Moreover, while the U.S. yield curve slope steepened between August 24 and October 5, it is flattening anew (Chart I-1). All these market moves suggest investors are beginning to price out anticipated interest rate hikes. If U.S. stocks were to fall further, these dynamics would most likely deepen. However, since there is little monetary tightening to price out of the European or Japanese interest rate curves, such a move would likely lead to a dollar-bearish narrowing of interest rate differentials. Chart I-1It Took A Stock Market Rout For Investors To Reconsider The Fed's Path
It Took A Stock Market Rout For Investors To Reconsider The Fed's Path
It Took A Stock Market Rout For Investors To Reconsider The Fed's Path
2) Gold Is Rebounding Keynes might have called gold a barbarous relic of a bygone era, but as an extremely long-duration asset with no cash flow, the yellow metal remains an important gauge of global monetary and liquidity conditions. As the stock of dollar foreign-currency debt is large, a strong dollar is synonymous with tightening global liquidity conditions. Unsurprisingly, since 2017, gold and the dollar have been tightly negatively correlated (Chart I-2). However, since October, this correlation has been breaking down. Both the dollar and gold are moving up. This suggests that the recent increase in U.S. interest rates and in the dollar might not be as deleterious for the world as markets are currently anticipating. Chart I-2Is Gold Not Hating A Strong Dollar Anymore?
Is Gold Not Hating A Strong Dollar Anymore?
Is Gold Not Hating A Strong Dollar Anymore?
Moreover, gold prices often lead EM asset prices. Since gold prices are highly sensitive to global liquidity, this makes sense. When the yellow metal sniffs out whiffs of reflation, it is only a matter of time before EM assets do as well. Since a rally in EM assets would lead to an easing in EM financial conditions, this easing would improve the global growth outlook (Chart I-3). Hence, rising gold prices might be a sign that while investors are increasingly negative on global industrial activity, the light at the end of the tunnel could be around the corner. The dollar would suffer if the outlook for global growth were to improve. Chart I-3EM Financial Conditions Hold The Key To Global Growth
EM Financial Conditions Hold The Key To Global Growth
EM Financial Conditions Hold The Key To Global Growth
3) EM Currencies And EM High-Yield Bonds Stabilizing Something strange is happening. While EM equity prices are still falling, EM high-yield bonds and currencies are not. In fact, EM FX and EM debt prices bottomed at the beginning of September, despite rising U.S. interest rates. However, since then, EM stock prices denominated in USD terms have fallen nearly 10% (Chart I-4). EM exchange rates and yields are the most important determinants of EM financial conditions. This suggests that despite EM stock prices falling fast, EM financial conditions may not be deteriorating as quickly as assumed. Chart I-4Are EM Financial Conditions Easing?
Are EM Financial Conditions Easing?
Are EM Financial Conditions Easing?
This market action is in fact consistent with the development we highlighted in the gold market. We must therefore maintain a watchful eye on EM bonds and EM FX. Further meaningful improvement in these assets, while not BCA's base-case, would dangerously challenge our view that global industrial activity slows further, undermining our dollar-bullish view. 4) Spanish Banks Near Post-2008 Lows As we highlighted in August, Spanish banks are the most exposed major banks in the world to EM woes (Chart I-5).2 The exposure of the Spanish banking sector to the weakest EM economies represents 170% of capital and reserves, which is driving the entire euro area's exposure to these markets to 32% of Eurozone banks' capital and reserves. Chart I-5Who Has More Exposure To EM?
Risks To The Dollar View
Risks To The Dollar View
The weakening in EM expected growth and the fall in EM currencies is a risk for Spanish banks. However, Spanish banks also maintain a large chunk of their EM exposure in wholly or partly owned subsidiaries. This means that while an EM crisis will definitely have an important impact on Spanish bank earnings, the impact on the balance sheet of Spanish banks is likely to be more limited. However, Spanish banks now trade in line with the levels that prevailed in Q1 2009, Q3 2012 and Q1 2016 (Chart I-6). In other words, Spanish banks are already pricing in a crisis, especially after the Spanish Supreme Court ruled that banks - not customers - must pay mortgage duties. Chart I-6Spanish Banks Are Discounting Plenty Of Bad News
Spanish Banks Are Discounting Plenty Of Bad News
Spanish Banks Are Discounting Plenty Of Bad News
While markets may not be the most efficient mechanism when it comes to pricing future shocks, markets are very efficient at lateral pricing - i.e. the pricing of an event in one market, even if wrong, will be equally reflected in other markets. If the impact of an EM crisis is fully priced into Spanish banks, the impact of such a crisis is likely to also be reflected in the expectations of what the European Central Bank will do over the coming quarters, and thus it is also priced into the euro. The pessimism already present in Spanish banks and euro area financial equities may explain why the euro has not cracked below its August 17 lows, while global stock prices have. The bad news could simply already be baked into the cake! If Spanish bank stocks rebound, the dollar is likely to suffer; if they break down, the dollar will likely rally more. 5) Speculators Are Already Long The Dollar For the dollar to rise further, someone needs to buy it. The problem is that speculators have already been buying the greenback, and they are now aggressively long the dollar (Chart I-7). This means that it may become more difficult to find new buyers for U.S. dollars, especially as investors may be in the process of unloading their U.S. equities. To be fair, while it is true that the net speculative positions are elevated, they also can remain so for extended periods. Chart I-7Investors Are Long The Dollar
Investors Are Long The Dollar
Investors Are Long The Dollar
Bottom Line: There are important risks to our dollar-bullish view that we need to closely monitor. They are: the global stock selloff migrating to the U.S., which could prompt investors to price out Fed rate hikes; gold rebounding, which might indicate marginal improvement in global liquidity conditions; EM exchange rates and high-yield bonds not weakening anymore, which could result in an easing in financial conditions, ending the deterioration in global growth; Spanish banks potentially already pricing in a dire outcome in EM; and speculators being already long the dollar. Despite these Risks, Why Do We Still Like The Dollar? The first reason relates to global growth. Ultimately, the dollar is a counter-cyclical currency. When global growth weakens, the dollar strengthens. China continues to generate potent headwinds for the world economy. Beijing has been stimulating the Chinese economy, but this stimulus is having a muted impact. As Arthur Budaghyan writes in the week's Emerging Market Strategy report, China's monetary stimulus is falling flat.3 Not only are excess reserves in the banking sector rather meager, Chinese banks are not showing a deep propensity to lend. It is not just about the behavior of Chinese banks: Chinese firms are also not displaying a high propensity to spend and borrow, which is weighing on the velocity of money in China (Chart I-8). As a result, this means that liquidity injections are not generating much impact in terms of loan growth and economic activity. Chart I-8Chinese Stimulus Is Falling Flat Because Economic Agents Are Cautious
bca.fes_wr_2018_10_26_s1_c8
bca.fes_wr_2018_10_26_s1_c8
This is evident when looking at two variables. China's Li-Keqiang Index, our preferred measure of Chinese industrial activity, has stopped rebounding. In fact, it is currently weakening anew, which suggests that Chinese growth, despite all the supposed easing in monetary conditions, is not responding (Chart I-9, top panel). Moreover, Chinese infrastructure spending is also contracting at its fastest pace in 14 years (Chart I-9, bottom panel). Further, the slowing in Chinese real estate sales suggests that construction will not come to the rescue, especially as vacancy rates in Chinese major cities currently stand at elevated levels. Chart I-9Chinese Growth Outlook Is Deteriorating Anew
Chinese Growth Outlook Is Deteriorating Anew
Chinese Growth Outlook Is Deteriorating Anew
We continue to monitor our China Play index (Chart I-10) to see if China is showing any underlying improvement, but the rally evident from June to October is now dissipating. The impact of stimulus thus looks like it is leaving investors wanting for more. Yet, as Matt Gertken and Roukaya Ibrahim argue in this week's Geopolitical Strategy service, additional stimulus will be limited as Xi Jinping is not yet abandoning his three battles against indebtedness, pollution and poverty.4 Hence, we expect China to remain a significant drag on global growth over the coming two to three quarters. Chart I-10China-Related Plays Are Losing Momentum
China-Related Plays Are Losing Momentum
China-Related Plays Are Losing Momentum
The second issue that supports our bullish-dollar stance is the mechanism required for U.S. and global growth to converge. As Ryan Swift argues in BCA's U.S. Bond Strategy service, U.S. growth will not be able to avoid the gravitational pull of a weaker global economy.5 The type of divergence currently on display between the global and U.S. Leading Economic Indicators (LEIs) is generally followed by a deteriorating U.S. growth outlook (Chart I-11). Chart I-11U.S. Growth Ultimately Converges With The Rest Of The World
U.S. Growth Ultimately Converges With The Rest Of The World
U.S. Growth Ultimately Converges With The Rest Of The World
However, this weakening in U.S. growth won't happen out of nowhere. Either there will be domestic vulnerabilities that prompt the U.S. to become more sensitive to foreign shocks, or the dollar will force this adjustment. Today, unlike in 2015 and 2016, the sales-to-inventory ratio does not point to any imminent decline in U.S. industrial activity; to the contrary, it suggests further improvements in the coming months (Chart I-12). This leaves the dollar as the main culprit to put the brakes on U.S. growth. Chart I-12U.S. Domestic Fundamentals Are Fine
U.S. Domestic Fundamentals Are Fine
U.S. Domestic Fundamentals Are Fine
Since 2009, the greenback has been very responsive to the relative growth outlook between the U.S. and the rest of the world. The accumulated gap between the U.S. and global LEIs shows the total impact of growth divergences. This indicator has done a good job at foretelling how the dollar will trade (Chart I-13). The dollar tends to respond to U.S. growth outperformance. Only once the dollar has rallied enough to meaningfully tighten U.S. financial conditions does the U.S. growth outlook deteriorate vis-Ã -vis the rest of the world. Currently, this chart suggests we are nowhere near having reached a chokepoint for U.S. growth. Chart I-13A Higher Dollar Needed For U.S. Growth To Resist The Gravitational Pull From The Rest Of The World
A Higher Dollar Needed For U.S. Growth To Resist The Gravitational Pull From The Rest Of The World
A Higher Dollar Needed For U.S. Growth To Resist The Gravitational Pull From The Rest Of The World
Since the Fed remains quite unconcerned by the weakness in global growth and global stock prices, we expect that world financial markets will have to plunge deeper, the dollar to rally higher and U.S. financial conditions to tighten further before the FOMC shows enough concern to hurt the dollar. We are not there yet. Bottom Line: The absence of a meaningful response by the Chinese economy to stimulus suggests that China may have hit a debt wall. This implies that Chinese growth remains fragile and therefore a drag on global growth. Hence, international economic activity and trade will continue to provide an important tailwind for the U.S. dollar. Meanwhile, the U.S. economy is not displaying enough domestic vulnerabilities to be overly sensitive to the softness in global growth. Instead, more rounds of dollar strength will be required to force U.S. growth to converge lower toward global economic activity. As such, these two forces remain powerful enough to overweight currency exposure to the USD within global portfolios. That said, the five risks described in the previous section must be kept in mind. At the current juncture, they only warrant buying a few hedges, such as our long NZD/USD recommendation, but they do not warrant underweighting the greenback. Mathieu Savary, Vice President Foreign Exchange Strategy mathieu@bcaresearch.com 1 Please see Global Investment Strategy Special Report, "Chinese Stimulus: Not so Stimulating", dated October 26, 2018, available at gis.bcaresearch.com 2 Please see Foreign Exchange Strategy Special Report, "The Bear And The Two Travelers", dated August 17, 2018, available at fes.bcaresearch.com 3 Please see Emerging Markets Strategy Weekly Report, "China: Stimulus, Deleveraging And Growth", dated October 25, 2018, available at ems.bcaresearch.com 4 Please see Geopolitical Strategy Special Report, "China Sticks To The "Three Battles", dated October 24, 2018, available at gps.bcaresearch.com 5 Please see U.S. Bond Strategy Weekly Report, "Waiting For Peak Divergence", dated October 23, 2018, available at usbs.bcaresearch.com Currencies U.S. Dollar Chart II-1USD Technicals 1
USD Technicals 1
USD Technicals 1
Chart II-2USD Technicals 2
USD Technicals 2
USD Technicals 2
Recent data in the U.S. has been mixed: Markit Services PMI outperformed expectations, coming in at 54.7. This measure also increased from the previous month's reading of 53.5. However, durable good ex-defense month-on-month growth underperformed expectations, coming in at -0.6%. Finally, monthly new homes sales underperformed expectations, coming in at an annualized pace of 553 thousand. DXY has appreciated by 0.8% this week. We are bullish on the U.S. dollar on a cyclical basis. Furthermore, momentum, one of the strongest predictive factors for the dollar continues to be positive. Finally, global growth should continue to slowdown, as the monetary tightening by Chinese authorities starts to weigh on the global industrial cycle. Report Links: In Fall, Leaves Turn Red, The Dollar Turns Green - October 12, 2018 Policy Divergences Are Still The Name Of The Game - August 14, 2018 The Dollar And Risk Assets Are Beholden To China's Stimulus - August 3, 2018 The Euro Chart II-3EUR Technicals 1
EUR Technicals 1
EUR Technicals 1
Chart II-4EUR Technicals 2
EUR Technicals 2
EUR Technicals 2
Recent data in the euro area has been negative: Markit Manufacturing PMI surprised to the downside, coming in at 52.1. Moreover, Markit Services PMI also underperformed expectations, coming in at 53.3. Finally, private loan yearly growth surprised negatively, coming in at 3.1%. EUR/USD has fallen by 0.8% this week. We are bearish on the euro on a cyclical basis, as inflationary pressures continue to be too weak in the euro area for the ECB to start raising rates. Moreover, the fact that the euro area's economy is highly dependent on exports, makes it very sensitive to global growth and emerging markets. This means that the tightening by Chinese authorities should impact the euro area economy negatively, and consequently, put downward pressure on EUR/USD. Report Links: Will Rising Wages Cause An Imminent Change In Policy Direction In Europe And Japan? - October 5, 2018 Policy Divergences Are Still The Name Of The Game - August 14, 2018 Time To Pause And Breathe - July 6, 2018 The Yen Chart II-5JPY Technicals 1
JPY Technicals 1
JPY Technicals 1
Chart II-6JPY Technicals 2
JPY Technicals 2
JPY Technicals 2
Recent data in Japan has been mixed: The leading economic Index outperformed expectations, coming in at 104.5. However, the coincident index surprised to the downside, coming in at 116.7. USD/JPY has been flat this week. We are neutral on the yen on a tactical basis, given that the current risk-off environment should continue to help safe havens like the yen. However, we are bearish on the yen on a cyclical basis, as inflation expectations are not well anchored in Japan. This means that the BoJ will continue to conduct ultra-dovish monetary policy for the foreseeable future, putting a cap on how high the yen can rise. Report Links: Will Rising Wages Cause An Imminent Change In Policy Direction In Europe And Japan? - October 5, 2018 Rhetoric Is Not Always Policy - July 27, 2018 Updating Our Long-Term FX Fair Value Models - June 22, 2018 British Pound Chart II-7GBP Technicals 1
GBP Technicals 1
GBP Technicals 1
Chart II-8GBP Technicals 2
GBP Technicals 2
GBP Technicals 2
GBP/USD has decreased by 1.5% this week. Given the lack of a geopolitical risk premium embedded into the pound, we expect GBP volatility to remain elevated. This means that any hiccups in Brexit negotiations could bring about some downside for the pound. Furthermore, inflation should remain contained, even amid a tight labour market. This is mainly because inflation dynamics in the U.K. are much more driven by the external sector, as imports represent a very large portion of British final demand. Given that the pound has remained stable this year, inflation will remain subdued. We are currently short GBP/NZD in our portfolio, to take advantage of the dynamics mentioned above. Report Links: Clashing Forces: The Fed And EM Financial Conditions - October 19, 2018 Updating Our Long-Term FX Fair Value Models - June 22, 2018 Inflation Is In The Price - June 15, 2018 Australian Dollar Chart II-9AUD Technicals 1
AUD Technicals 1
AUD Technicals 1
Chart II-10AUD Technicals 2
AUD Technicals 2
AUD Technicals 2
AUD/USD has been flat this week. We are most bearish on this currency within the G10, given that the AUD is highly sensitive to the Chinese industrial cycle, which will continue to slow down, as Chinese authorities keep cleaning credit excesses in the economy. Moreover, policy tightening by the Fed will provide a further headwind to cyclical plays like the AUD. We are short AUD/CAD within our portfolio, as we believe that the oil currencies should fare better than other commodity currencies, given that OPEC supply cuts, as long as Iranian sanction in oil will keep upward pressure on oil prices. Report Links: Policy Divergences Are Still The Name Of The Game - August 14, 2018 What Is Good For China Doesn't Always Help The World - June 29, 2018 Updating Our Long-Term FX Fair Value Models - June 22, 2018 New Zealand Dollar Chart II-11NZD Technicals 1
NZD Technicals 1
NZD Technicals 1
Chart II-12NZD Technicals 2
NZD Technicals 2
NZD Technicals 2
NZD/USD has been flat this week. We are positive on the New Zealand dollar, particularly against the GBP, as there is very little room for kiwi rate expectations to fall. Moreover, this currency should also outperform the Australian dollar, given that New Zealand is less exposed to the Chinese industrial cycle than Australia. Nevertheless, we remain bearish on the NZD on a long-term basis, given that the new government proposals to reduce immigration and add an unemployment mandate to the RBNZ will lower the neutral rate in New Zealand, which will limit the central bank's ability to tighten monetary policy. Report Links: Clashing Forces: The Fed And EM Financial Conditions - October 19, 2018 In Fall, Leaves Turn Red, The Dollar Turns Green - October 12, 2018 Updating Our Long-Term FX Fair Value Models - June 22, 2018 Canadian Dollar Chart II-13CAD Technicals 1
CAD Technicals 1
CAD Technicals 1
Chart II-14CAD Technicals 2
CAD Technicals 2
CAD Technicals 2
Recent data in Canada has been negative: Core inflation underperformed expectations, coming in at 1.5%. This measure also decreased form 1.7% last month. Headline inflation also surprised to the downside, coming in at 2.2%. This measure decreased significantly, coming down from 2.8% the previous month. The Bank of Canada increased rates to tk% on Wednesday, and highlighted the potential for additional rate hikes over the coming 12 months. USD/CAD has been mostly flat this week. The upside in the CAD versus the USD is likely to be limited as the policy tightening by the BoC now seems well anticipated by market participants. To take advantage of this reality, we went short CAD/NOK in our portfolio. This cross also serves as a hedge to our long dollar view, given its positive correlation to the DXY. Despite some headwinds, the CAD should outperform the AUD, as we expect that oil will do better than base metals within the commodity complex. Report Links: Clashing Forces: The Fed And EM Financial Conditions - October 19, 2018 Updating Our Long-Term FX Fair Value Models - June 22, 2018 Inflation Is In The Price - June 15, 2018 Swiss Franc Chart II-15CHF Technicals 1
CHF Technicals 1
CHF Technicals 1
Chart II-16CHF Technicals 2
CHF Technicals 2
CHF Technicals 2
EUR/CHF has fallen by 0.5% this week, as investors have grown worried with the recent sell off in equities. We are bearish on the franc on a cyclical basis, given that inflation in Switzerland is still too weak for the SNB to move away from their ultra-dovish monetary policy. Moreover, Helvetic real estate prices should continue to fall, as the restrictions on immigration put forth by the Swiss government since 2014 should continue to weigh on housing demand. This will further hamper the ability of the SNB to tighten its extraodinarly accommodative monetary policy. That being said, EUR/CHF could continue to fall in the near term, as money flows into safe heaven assets amid the current sell off in equities. Report Links: Updating Our Long-Term FX Fair Value Models - June 22, 2018 Updating Our Intermediate Timing Models - May 18, 2018 Value Strategies In FX Markets: Putting PPP To The Test - May 11, 2018 Norwegian Krone Chart II-17NOK Technicals 1
NOK Technicals 1
NOK Technicals 1
Chart II-18NOK Technicals 2
NOK Technicals 2
NOK Technicals 2
USD/NOK has risen by 0.9% this week. As expected, yesterday the Norges Bank left rates unchanged at 0.75%. In its report, the Norwegian central bank highlighted that although economic growth has been a little lower than anticipated, inflation has been somewhat higher than expectations. We are bullish on the krona against the Canadian dollar, given that rate hike expectation in Canada are much more fully priced in than in Norway even though the inflationary backdrop is very similar. Moreover, we are positive on the krone relatively to other commodity currencies like the AUD or the NZD, as we expect oil to outperform other commodities thanks to supply cuts by OPEC and sanctions against Iran. Report Links: Clashing Forces: The Fed And EM Financial Conditions - October 19, 2018 Updating Our Long-Term FX Fair Value Models - June 22, 2018 Updating Our Intermediate Timing Models - May 18, 2018 Swedish Krona Chart II-19SEK Technicals 1
SEK Technicals 1
SEK Technicals 1
Chart II-20SEK Technicals 2
SEK Technicals 2
SEK Technicals 2
USD/SEK has rallied by 1% this week. We are positive on USD/SEK on a short-term basis, given that the SEK is the currency which is most negatively affected by the strength of the U.S. dollar. Furthermore, tightening by Chinese authorities should also weigh on the krona, given that the Swedish economy is very levered to the global industrial cycle, as many of its exports are intermediate goods that are then re-exported to emerging markets. That being said, we are bullish on the krona on a longer-term basis, as the Riksbank is on the verge of beginning a tightening cycle as imbalances in the Swedish economy are only growing more dangerous. Report Links: Updating Our Long-Term FX Fair Value Models - June 22, 2018 Updating Our Intermediate Timing Models - May 18, 2018 Value Strategies In FX Markets: Putting PPP To The Test - May 11, 2018 Trades & Forecasts Forecast Summary Core Portfolio Tactical Trades Closed Trades
Overweight - High Conviction The S&P construction machinery & heavy truck (CMHT) index has been waylaid this week and last following earnings reports that the market did not digest well, first from PCAR and most recently by CAT. With respect to the latter, fears over high dealer inventories and tariff-driven input cost increases outweighed surging volumes and margins and the stock fell dramatically. While investor worries about future growth seem to dominate the equity risk premium in the market's meta-analysis, we remain focused on the fundamentals. That is to say, while spectacular volume growth at CAT is decelerating by virtue of lapping last year's powerful results, a decline (or even diminished upward trajectory) in relative profits is not part of the conversation (second panel). This is a result of the company's success in passing through price increases to offset rising input costs as volumes take the driver's seat in sales outgrowing the broad market by a wide margin (third panel). Meanwhile, the pullback in stock prices has pushed the S&P CMHT index' valuation to very affordable levels (bottom panel). We think such buying opportunities are rare and reiterate our high-conviction overweight recommendation. The ticker symbols for the stocks in this index are: BLBG: S5CSTF - CAT, CMI, PCAR.
A Buying Opportunity In Construction Machinery
A Buying Opportunity In Construction Machinery
Overweight The S&P household products index got a solid lift last week on the back of upbeat earnings from sector heavyweight Procter & Gamble (PG), though this was also part of a greater rotation into consumer staples. PG noted volume increases across all of their consumer staples segments with the global consumer remaining remarkably resilient. Despite a clearly healthy quarter, the company maintained their guidance for the next three quarters, suggesting the positive trend has some longevity. This broadly matches the macro signal, with exports of consumer goods staging a multi-year recovery, which should further underpin recent earnings outperformance (second panel). One minor negative anecdote, however, was the reference to the rising greenback that should eat into margins especially in early 2019, but rising volumes on the back of resilient demand should provide an offset. An appreciating U.S. dollar is an earnings risk we have been flagging in recent research for SPX exporters, especially if an EM accident materializes. Still, sector valuations remain depressed, implying bargains are still to be found in household products. We reiterate our overweight recommendation. The ticker symbols for the stocks in this index are: PG, CL, CLX, KMB.
Restock On Household Products
Restock On Household Products