Sectors

Overweight We have been overweight the pure-play BCA defense index since late-2015 and our strategy is to add exposure on any meaningful pullbacks and keep this index as a structural overweight within the GICS1 S&P industrials index. In the U.S., where military spending in absolute terms is greater than the rest of the world put together, defense spending and investment have bottomed and will continue to accelerate. In fact, the CBO continues to project that defense outlays will jump further next year (second panel). While such a breakneck pace is clearly unsustainable, this administration appears serious about upgrading and updating the U.S. military. The upshot is that defense outlays will continue to expand into the 2020s. Still, undoubtedly valuations are on the expensive side. Not only is recent M&A fever the culprit, but global investors' insatiable appetite for pure-play defense stocks has also driven valuations into overshoot territory (bottom panel), though if our thesis pans out, then these stocks will grow into their pricey valuations as happened in the back half of the 1960s.1 Bottom Line: The secular advance in pure-play defense stocks remains in place. We continue to recommend an above benchmark allocation; please see Monday's Weekly Report for more details. The ticker symbols for the stocks in the BCA defense index are: LMT, LLL, NOC, GD and RTN.
Stay With Defense Stocks For The Long-Term
Stay With Defense Stocks For The Long-Term
1 Please see BCA U.S. Equity Strategy Special Report, "Brothers In Arms," dated October 31, 2016, available at uses.bcaresearch.com.
Highlights Portfolio Strategy Debt saddled small caps have to wrestle with rising interest rates at a time when they lack a valuation cushion. Tack on their high beta status and investors should continue to avoid small caps and instead prefer large caps. Upbeat global demand for U.S. defense goods, firming defense industry operating metrics and a flurry of M&A will more than offset the defense contractors' valuation overshoot. Stay structurally overweight. Recent Changes There are no changes to the portfolio this week. Table 1
Icarus Moment?
Icarus Moment?
Feature In Greek mythology, Daedalus warned his son Icarus not to fly too close to the sun when the pair of them were escaping from Crete, as his wax-made wings would melt. Icarus ignored his father's warning and soared toward the sun that eventually led to his drowning in the Aegean Sea when his wings melted. Is the equity market experiencing an Icarus moment? The S&P 500 is undergoing a healthy reset during crash-prone October, but post-midterms it should make an attempt to vault to fresh all-time highs into year-end. The selloff in the bond market (largely driven by the real component) most likely caused the consternation in stocks, but our sense is that the backup in yields is reflective and not yet restrictive both for stocks and, most importantly, the economy. In the coming weeks we expect a retest, and hold, of the recent lows before waving the all clear sign. Nevertheless, the latest bout of volatility is a cause for concern especially given that the SPX pullback is not sentiment/technical driven as it was earlier in the year when on January 221 and again on January 292 we cautioned clients that the equity market advance was too good to be true and complacency reigned supreme. As a reminder in late-January, equities looked extremely stretched on a number of sentiment and technical indicators. This was not the case, however, heading into October (Charts 1 & 2), and it raises the question: what are stocks discounting with regard to the economic backdrop? Chart 1Leading Into The Recent Pullback Sentiment And Technicals...
Leading Into The Recent Pullback Sentiment And Technicals...
Leading Into The Recent Pullback Sentiment And Technicals...
Chart 2...Were Not As Extended As In Late-January
...Were Not As Extended As In Late-January
...Were Not As Extended As In Late-January
Our biggest worry is that the 2018 goosing of the economy will soon fall flat as President Trump runs out of firepower to further buoy the economy. In other words, we have likely brought demand/consumption forward which should get reflected in softer 2019 output data, especially if there is gridlock in Congress post the midterms. Keep in mind, that most of the fiscal easing that pertains to stocks is front loaded to this year. The drop in corporate taxes is a one-off EPS boost for 2018, as is the surge in buybacks that was driven by cash repatriation. Buybacks are on pace to reach $1tn in 2018, but are likely to fall back to the more typical $400bn/annum rate next year. The U.S. economy and stock market will have to grapple with both of these fading tailwinds in 2019. One simple way to depict this is our newly conceived BCA Economic Impulse Indicator (EII). Chart 3 shows six economic indicators gauging the state of the U.S. economy. The EII comprises housing, capex, manufacturing, confidence, employment and credit; it is equally weighted shown as a Z-score. At present it is wobbling and diverging negatively from euphoric SPX EPS growth rates. Chart 3 Mind The Gap
Mind The Gap
Mind The Gap
Not only is the economy humming at an unsustainable pace, but the Fed is also tightening monetary policy and letting maturing securities run off its balance sheet at approximately $50bn/month. If the Fed hikes rates three more times by June 2019, as both the bond market and our fixed income strategists expect, the fed funds rate will reach a range of 2.75%-3%. It then becomes plausible that any letdown in economic data could cause the yield curve to invert. The elimination of the unemployment gap increases the probability of curve inversion (see Chart 1 from the October 23, 2017 Weekly Report), as does another indicator of labor market tightness that recently dropped below zero (Chart 4). Chart 4Full Employment And Yield Curve Joined At The Hip
Full Employment And Yield Curve Joined At The Hip
Full Employment And Yield Curve Joined At The Hip
But, we are not there yet and want to be systematic in calling the end of the business cycle, and thus equity bull market, using the three signposts we deemed most important earlier in the year: a yield curve inversion (leading indicator), doubling in year-over-year oil prices based on monthly dataset (coincident indicator) and a mega-merger announcement either in tech or biotech space (confirming anecdotal indicator). With regard to the latter, the rumored Uber IPO fetching a valuation of $120bn may also qualify as an end of cycle anecdotal indicator. Still, none of these three boxes have yet been ticked. Moreover, two other catalysts may assist in prolonging the cycle and breathe a sigh of relief not only in U.S. equities, but also in global bourses: a trade deal with China, and/or a reversal in U.S. dollar strength that would boost global ex-U.S. growth. Netting it all out, while the recent equity market swoon is worrisome it is still too early to call the end of the cycle and we do not think we are in an "Icarus moment". Our broad equity market strategy is to "buy the dip" as we expect EPS to do all the heavy lifting next year with the multiple drifting lower, and we continue to recommend a cyclical over defensive portfolio bent. This week we highlight a deep cyclical capital goods subsector and revisit our size bias. The Bigger The Better The days in the sun are over for small cap stocks. Similar to the double top formation in the early 1980s, small cap stocks have hit a wall and are giving in to their larger brethren. There are high odds that the small over large multi-year ascendancy is over and a reversion, at least, to the historical time trend mean is in order (Chart 5). Chart 5Double Top
Double Top
Double Top
Since changing our size bias to a large cap bias on May 10, 2018, the S&P 500 has bested the S&P 600 index by over 300bps. Small caps however remain fully valued using different metrics and are extremely overvalued versus the SPX according to the Shiller P/E (or cyclically adjusted P/E, CAPE) methodology of smoothing the earnings cycle over a decade (Chart 6). In fact, this 40% CAPE premium leaves no space for any small cap profit mishaps. Chart 6Small Caps Valuations Are Stretched...
Small Caps Valuations Are Stretched...
Small Caps Valuations Are Stretched...
Unfortunately, on a number of fronts small cap EPS will underwhelm and significantly trail SPX EPS, the opposite of what optimistic sell-side analysts expect. First, small caps are severely debt saddled as we have highlighted in our recent research. Sustained small cap balance sheet degradation is worrying, with S&P 600 net debt-to-EBITDA close to 4 (compared with 1.5 for the SPX, middle panel, Chart 7). Such gearing is fraught with danger as the default rate has nowhere to go but higher. Chart 7...Amidst Balance Sheet Degradation...
...Amidst Balance Sheet Degradation...
...Amidst Balance Sheet Degradation...
Second, small and medium businesses have a higher dependency on bank credit as opposed to the bond market access that mega caps enjoy. Most bank credit is floating rate debt and so are lines of credit, and as the Fed remains firm on tightening monetary policy, interest expense costs are skyrocketing for SMEs. In a relative sense this will weigh on net profits. More generally, given the high indebtedness, small caps are a lot more sensitive to interest rates, and the selloff in the 10-year Treasury note heralds more pain in 2019 (10-year Treasury yield shown inverted, Chart 8). Chart 8 ...And With Rates Rising...
...And With Rates Rising...
...And With Rates Rising...
Third, relative wage costs are flashing red for small caps. Small cap margins are thin - roughly mid-single digits or 800bps below large caps, and rising labor costs (according to the latest NFIB survey) are warning that this delta will widen, further suppressing relative margins and profitability as large cap wage costs are still well contained (Chart 9). Chart 9...And Labor Costs Perking Up, A Margin Squeeze Looms
...And Labor Costs Perking Up, A Margin Squeeze Looms
...And Labor Costs Perking Up, A Margin Squeeze Looms
Fourth, small caps are high(er) beta stocks and when volatility spikes they underperform large caps. When the Fed ballooned its balance sheet and dropped the fed funds rate to zero it suppressed volatility. Now that the Fed has been decreasing the size of its balance sheet and raising interest rates, this is working in reverse and volatility is making a comeback as we have been highlighting in our research, and will continue to weigh on small caps (VIX shown inverted, top panel, Chart 10). Chart 10Large Caps Have The Upper Hand
Large Caps Have The Upper Hand
Large Caps Have The Upper Hand
Another way to showcase small caps' riskier status is the close correlation they have with the relative EM equity share price ratio. When EMs outperform the SPX, small caps follow suit and vice versa. Importantly a wide gap has opened recently and we suspect that it will narrow via small caps following the EM higher beta stocks lower (SPX vs. EM ratio shown inverted, bottom panel, Chart 10). Adding it up, a high small cap debt burden, rising interest rates, lack of a valuation cushion, and their high beta status all signal that investors should continue to avoid small caps and instead prefer large caps. Bottom Line: Stick with a large cap bias. Stay With Defense Stocks For The Long-Term We have been overweight the pure-play BCA defense index since late-2015 and there are high odds that this juggernaut that really commenced with the George Walker Bush presidency remains in a secular growth trajectory (top panel, Chart 11). Our strategy is to add exposure on any meaningful pullbacks and keep this index as a structural overweight within the GICS1 S&P industrials index. Chart 11Defense Stocks Are A Secular Growth Play
Defense Stocks Are A Secular Growth Play
Defense Stocks Are A Secular Growth Play
The rise of global "multipolarity" - or competition between the world's great nations - and the decline of globalization, along with a global arms race and increased risk of cyber-attacks, have been documented in our "Brothers In Arms" Special Report. These trends all signal that global defense related spending will remain upbeat in the coming decade.3 In the U.S. in particular, where military spending in absolute terms is greater that the rest of the world put together, defense spending and investment have bottomed and will continue to accelerate. In fact, the CBO continues to project that defense outlays will jump further next year (middle panel, Chart 12). While such a breakneck pace is clearly unsustainable, President Trump is serious about upgrading and updating the U.S. military in order to keep China's geopolitical and military ascendancy in check (as well as to deal with Russia and Iran).4 The upshot is that defense outlays will continue to expand into the 2020s. Chart 12Upbeat Defense Outlays...
Upbeat Defense Outlays...
Upbeat Defense Outlays...
Such a buoyant demand backdrop is music to the ears of defense contractor CEOs, and represents a boost to defense equity revenue growth prospects. This capital goods sub-industry has extremely high fixed costs and thus any increase in top line growth flows straight to the bottom line. Put differently, defense contractors enjoy high operating leverage. No wonder M&A activity is robust: at least four large deals have been announced in the past year that are underpinning both takeout premia and relative share prices (bottom panel, Chart 13). Chart 13 ...And A Flurry Of M&A Is A Boon For Defense Stocks
...And A Flurry Of M&A Is A Boon For Defense Stocks
...And A Flurry Of M&A Is A Boon For Defense Stocks
A closer look at operating metrics corroborates that defense goods manufacturers are firing on all cylinders. New orders recently jumped to fresh all-time highs and the industry's shipments-to-inventories ratio is rising, on track to surpass the 2008 peak. Unfilled orders are also running at a high rate, signaling that factories will keep on humming at least for the next few quarters (Chart 14). Chart 14Firming Operating Metrics
Firming Operating Metrics
Firming Operating Metrics
Importantly, the industry is not standing still and is making significant investments. U.S. defense capex as reported in the financial statements of constituent firms is growing at roughly 20%/annum or twice as fast as overall capex (Chart 15). Chart 15Industry Is Not Standing Still
Industry Is Not Standing Still
Industry Is Not Standing Still
True, industry indebtedness is also on the rise as some of the expansion has been debt financed, but net debt-to-EBITDA trails the overall market (ex-financials). Similarly, interest coverage has been modestly deteriorating, but is twice as high as the overall market. Impressively, defense ROE is running near 30%, again roughly double the rate of the broad market (Chart 16). Chart 16Healthy B/S With High ROE...
Healthy B/S With High ROE...
Healthy B/S With High ROE...
Nevertheless, undoubtedly valuations are on the expensive side. Not only is recent M&A fever the culprit, but global investors' insatiable appetite for pure-play defense stocks has also driven valuations into overshoot territory (Chart 17). This is a clear risk to our secular overweight view, however, if our thesis pans out, then these stocks will grow into their pricey valuations as happened in the back half of the 1960s.5 Chart 17 ...But Valuations Are Expensive
...But Valuations Are Expensive
...But Valuations Are Expensive
In sum, upbeat global demand for U.S. defense goods, firming industry operating metrics and a flurry of M&A will more than offset the defense contractors' valuation overshoot. Bottom Line: The secular advance in pure-play defense stocks remains in place. We continue to recommend an above benchmark allocation. The ticker symbols for the stocks in the BCA defense index are: LMT, LLL, NOC, GD and RTN. Anastasios Avgeriou, Vice President U.S. Equity Strategy anastasios@bcaresearch.com 1 Please see BCA U.S. Equity Strategy Weekly Report, "Too Good To Be True?" dated January 22, 2018, available at uses.bcaresearch.com. 2 Please see BCA U.S. Equity Strategy Weekly Report, "Corporate Pricing Power Update," dated January 29, 2018, available at uses.bcaresearch.com. 3 Please see BCA U.S. Equity Strategy Special Report, "Brothers In Arms," dated October 31, 2016, available at uses.bcaresearch.com. 4 Please see BCA Geopolitical Strategy Special Report, "A Global Show Of Force?" dated October 10, 2018, available at gps.bcaresearch.com. 5 Please see BCA U.S. Equity Strategy Special Report, "Brothers In Arms," dated October 31, 2016, available at uses.bcaresearch.com. Current Recommendations Current Trades Size And Style Views Favor value over growth Favor large over small caps
Overweight (High-Conviction) We have written frequently about trade tensions keeping a lid on trade-exposed sectors, with the S&P air freight index chief among them. As such, we have been anticipating a rally following the recent signing of the USMCA, negotiations over which had been causing downdrafts for the index. However, the index has continued to move sideways to lower. Meanwhile, the macro backdrop has improved; sector pricing power is at a seven year-high with no signs of slowing down, reflecting extremely positive demand for transportation services in a booming economy (second panel). Anecdotally (and only tangentially comparable), both rail and trucking pricing power are showing the same shift higher. The pricing power potency is reflected in forward profit margins, which are also pushing against post-recession highs (third panel), though the market appears skeptical, possibly due to high jet fuel costs. While that is a risk, particularly given BCA’s sanguine WTI oil market view, the result is that the valuation has been driven to a decade-low (bottom panel). Such a divergence is not sustainable and, in the absence of a recession on the horizon, we think it will be resolved by a catch-up in index share prices; we reiterate our high-conviction overweight recommendation. The ticker symbols for the stocks in this index are: BLBG: S5AIRF - UPS, FDX, CHRW, EXPD.
Trade Tensions Have Eased, Air Freight Should Soar
Trade Tensions Have Eased, Air Freight Should Soar
Production of both crude steel and steel products will rise considerably next year, as the steel sector's de-capacity target is almost reached and new advanced capacity will come quickly on stream to replace old or inefficient capacity that has already exited…
Highlights The long term direction for the pound is higher... ...but as the EU withdrawal bill passes through the U.K. parliament, expect a very hairy ride. The stock markets in Norway, Sweden and Denmark are driven by energy, industrials, and biotech respectively. Upgrade Sweden to neutral and downgrade Denmark to underweight. Think of semiconductors as twenty-first century commodities. Overweight the semiconductor sector versus broader technology indexes. Chart of the WeekBritish Public Opinion On Brexit Is Shifting
Understanding Brexit, Scandinavian Markets, And Semiconductors
Understanding Brexit, Scandinavian Markets, And Semiconductors
Feature The Brexit drama is playing out exactly as scripted (Chart I-2). Chart I-2The Pound Is Following The Brexit Drama
The Pound Is Following The Brexit Drama
The Pound Is Following The Brexit Drama
In July, we wrote: "The U.K. government's much hyped 'Chequers' proposal for Brexit risks getting a cold shower... the EU27 will almost instantaneously reject the proposed division between goods and services as 'cherry-picking' from its indivisible four freedoms - goods, services, capital, and people... the rejection will be based not just on the EU's founding principles, but also on the practical realities of a modern economy - specifically, the distinction between goods and services has become increasingly blurred." 1 Hence, the Chequers proposal to avoid a hard border between Northern Ireland and the Irish Republic is just wishful thinking: "The Irish border trilemma will remain unsolved, leaving a 'backstop' option of Northern Ireland remaining in the EU single market - an outcome that will be politically unpalatable." 2 What happens next? Understanding Brexit In a sense, Brexit is very simple. The EU27 sees only three options for the long-term political and economic relationship between the U.K. and the EU. Remain in the EU (no Brexit). Plug into an off-the-shelf setup, either the European Economic Area (EEA), European Free Trade Association (EFTA), or a permanent customs union, which already establish the EU relationship with Norway, Iceland, Liechtenstein, and Switzerland (soft Brexit). Become a 'third country' to the EU like, for example, Canada (hard Brexit). The first option, to stay in the EU, is politically impossible unless a new U.K. referendum overturned the original referendum's vote to leave. The second option, to join the EEA, EFTA, or permanent customs union is very difficult for Theresa May - because it is strongly opposed by many of the Conservative government's ministers and members of parliament who regard the option as 'Brino' (Brexit in name only). However, in a significant recent development, the opposition leader Jeremy Corbyn has committed the Labour party to a Brexit that keeps the U.K. in a permanent customs union.3 The third option, to become a 'third country', would very likely require some sort of border in Ireland. As already discussed, the only way to avoid a border would be a perfect alignment between the U.K and EU on tariffs and regulations for goods and services. But then, there would be little point in becoming a third country. Here's the crucial issue. The EU27 does not know which option the U.K. will eventually take, yet it must provide an 'all-weather' safeguard for the Good Friday peace agreement, requiring no border between Northern Ireland and the Irish Republic. Therefore, the EU27 will need the withdrawal agreement to commit: either the whole of the U.K. to a potentially permanent customs union with the EU; or Northern Ireland to a potentially permanent customs separation from the rest of the U.K. - in effect, breaking up the U.K by creating a border between Britain and Northern Ireland. Clearly, the hard Brexiters and/or Northern Ireland unionist MPs will vote down a withdrawal bill which contains either of these commitments, thereby wiping out Theresa May's slender majority. The intriguing question is: might Labour MPs - or enough of them - vote for a potentially permanent customs union to get the soft Brexit they want? Labour would be torn between the national interest and the party interest, as it would be missing a golden opportunity to topple the Conservative government. If the withdrawal bill musters a majority, it would remove the prospect of a 'no deal' Brexit and the pound would rally - because it would liberate the Bank of England to hike interest rates more aggressively (Chart I-3 and Chart I-4). If the bill failed, the government and specifically Theresa May would be badly wounded. She might call a general election there and then. Chart I-3Absent Brexit, U.K. Interest Rates Would Be Higher
Absent Brexit, U.K. Interest Rates Would Be Higher
Absent Brexit, U.K. Interest Rates Would Be Higher
Chart I-4Absent Brexit, U.K. Interest Rates Would Be Higher
Absent Brexit, U.K. Interest Rates Would Be Higher
Absent Brexit, U.K. Interest Rates Would Be Higher
If May limped on, parliament would nevertheless have the final say on whether to proceed with a no deal Brexit. And the parliamentary arithmetic indicates that a clear majority of MPs would vote against proceeding over the cliff-edge. At this point with the government paralysed, the only way to unlock the paralysis would be to go back to the people. Either in a general election or in a new referendum, the key issue for the public would be a choice between one of the three aforementioned options for the U.K./EU long-term relationship - because by then, it would be clear that those are the only options on offer. Based on a clear recent shift in British public opinion, the preference is more likely to be for a soft (or no) Brexit than to become a third country (Chart of the Week). Bottom Line: The long term direction for the pound is higher but, as the withdrawal bill passes through parliament, expect a very hairy ride. Understanding Scandinavian Stock Markets The Scandinavian countries - Norway, Sweden, and Denmark - have many things in common: their languages, cultures, and lifestyles, to name just a few. However, when it comes to their stock markets, the three countries could not be more different. Looking at the three bourses, each has a defining dominant sector (or sectors) whose market weighting swamps all others. In Norway, oil and gas accounts for over 40 percent of the market; in Sweden, industrials accounts for 30 percent of the market and financials accounts for another 30 percent; and in Denmark, healthcare accounts for 50 percent of the market (Table I-1). Table I-1The Scandinavian Stock Markets Could Not Be More Different!
Understanding Brexit, Scandinavian Markets, And Semiconductors
Understanding Brexit, Scandinavian Markets, And Semiconductors
In a sense, the dominant equity market sectors in Norway and Sweden just reflect their economies. Norway has a large energy sector; Sweden specializes in advanced industrial equipment and machinery and it also has very high level of private sector indebtedness, explaining the outsized weighting in banks. However, Denmark's equity market - dominated as it is by Novo Nordisk, which is essentially a biotech company - has little connection with Denmark's economy. The important point is that the four dominant sectors - oil and gas, industrials, financials, and biotech - each outperform or underperform as global (or at least pan-regional) sectors. If oil and gas outperforms, it outperforms everywhere and not just locally. It follows that the relative performance of the four dominant equity sectors drives the relative stock market performances of Norway, Sweden, and Denmark. Norway versus Sweden = Energy versus Industrials (Chart I-5) Chart I-5Norway Vs. Sweden = Energy Vs. Industrials
Norway Vs. Sweden = Energy Vs. Industrials
Norway Vs. Sweden = Energy Vs. Industrials
Norway versus Denmark = Energy versus Biotech (Chart I-6) Chart I-6Norway Vs. Denmark = Energy Vs. Biotech
Norway Vs. Denmark = Energy Vs. Biotech
Norway Vs. Denmark = Energy Vs. Biotech
Sweden versus Denmark = Industrials and Financials versus Biotech (Chart I-7) Chart I-7Sweden Vs. Denmark = Industrials And Financials Vs. Biotech
Sweden Vs. Denmark = Industrials And Financials Vs. Biotech
Sweden Vs. Denmark = Industrials And Financials Vs. Biotech
Last week, we upgraded some of the more classical cyclical sectors to a relative overweight. Our argument was that if an inflationary impulse is dominating, beaten-down cyclicals have more upside than the more richly-valued equity sectors; and if a disinflationary impulse from higher bond yields is dominating, its main casualty will be the more richly-valued equity sectors. On this basis, our ranking of the four sectors is: Industrials, Financials, Energy, Biotech. Which means the ranking of the Scandinavian stock markets is: Sweden, Norway, Denmark. Bottom Line: From a pan-European perspective, upgrade Sweden to neutral and downgrade Denmark to underweight. Understanding Semiconductors The best way to understand semiconductors is to think of them as twenty-first century commodities. In the twentieth century, many everyday goods and products contained a classical commodity such as copper. Today, the ubiquity of electronic gadgets, devices, and screens contains a twenty-first century equivalent: the microchip. Hence, semiconductors are to the tech world what classical commodities are to the non-tech world. They exhibit exactly the same cycle of relative performance. If, as we expect, beaten-down industrial commodities outperform, it follows that the beaten-down semiconductor sector will outperform broader technology indexes (Chart I-8). Chart I-8Semiconductors Follow The Commodity Cycle
Semiconductors Follow The Commodity Cycle
Semiconductors Follow The Commodity Cycle
Bottom Line: Overweight the semiconductor sector versus technology. Dhaval Joshi, Senior Vice President Chief European Investment Strategist dhaval@bcaresearch.com 1 For example, the sale of a car is no longer the sale of just a good. As car companies often structure the financing of the car purchase, a car purchase can be a hybrid of a good - the car itself, and a service - the financing package. Therefore, a single market for cars requires a single market for both goods and services. 2 The Irish border trilemma comprises: 1. the U.K./EU land border between Northern Ireland and the Irish Republic; 2. the Good Friday peace agreement requiring the absence of any physical border within Ireland; 3.the Northern Ireland unionists' refusal to countenance a U.K./EU border at the Irish Sea, which would entail a customs border between Northern Ireland and the rest of the U.K. 3 At the Labour Party's just-held 2018 conference, Jeremy Corbyn made a commitment to joining a permanent U.K./EU customs union. Fractal Trading Model* This week's recommended trade comes from Down Under. The 25% outperformance of Australian telecoms (driven by Telstra) versus insurers (driven by IAG and AMP) over the past 3 months appears technically extended, with a 65-day fractal dimension at a level that has regularly indicated the start of a countertrend move. Therefore, the recommended trade is short Australian telecoms versus insurers, setting a profit target of 7% and a symmetrical stop-loss. In other trades, long CRB Industrial commodities versus MSCI World Index achieved its profit target very quickly, leaving four open trades. For any investment, excessive trend following and groupthink can reach a natural point of instability, at which point the established trend is highly likely to break down with or without an external catalyst. An early warning sign is the investment's fractal dimension approaching its natural lower bound. Encouragingly, this trigger has consistently identified countertrend moves of various magnitudes across all asset classes. Chart I-9
Short Australian Telecom Vs. Insurers
Short Australian Telecom Vs. Insurers
The post-June 9, 2016 fractal trading model rules are: When the fractal dimension approaches the lower limit after an investment has been in an established trend it is a potential trigger for a liquidity-triggered trend reversal. Therefore, open a countertrend position. The profit target is a one-third reversal of the preceding 13-week move. Apply a symmetrical stop-loss. Close the position at the profit target or stop-loss. Otherwise close the position after 13 weeks. Use the position size multiple to control risk. The position size will be smaller for more risky positions. * For more details please see the European Investment Strategy Special Report "Fractals, Liquidity & A Trading Model," dated December 11, 2014, available at eis.bcaresearch.com Fractal Trading Model Recommendations Equities Bond & Interest Rates Currency & Other Positions Closed Fractal Trades Trades Closed Trades Asset Performance Currency & Bond Equity Sector Country Equity Indicators Bond Yields Chart I-1Indicators To Watch - Bond Yields
Indicators To Watch - Bond Yields
Indicators To Watch - Bond Yields
Chart I-2Indicators To Watch - Bond Yields
Indicators To Watch - Bond Yields
Indicators To Watch - Bond Yields
Chart I-3Indicators To Watch - Bond Yields
Indicators To Watch - Bond Yields
Indicators To Watch - Bond Yields
Chart I-4Indicators To Watch - Bond Yields
Indicators To Watch - Bond Yields
Indicators To Watch - Bond Yields
Interest Rate Chart I-5Indicators To Watch - Interest Rate Expectations
Indicators To Watch - Interest Rate Expectations
Indicators To Watch - Interest Rate Expectations
Chart I-6Indicators To Watch - Interest Rate Expectations
Indicators To Watch - Interest Rate Expectations
Indicators To Watch - Interest Rate Expectations
Chart I-7Indicators To Watch - Interest Rate Expectations
Indicators To Watch - Interest Rate Expectations
Indicators To Watch - Interest Rate Expectations
Chart I-8Indicators To Watch - Interest Rate Expectations
Indicators To Watch - Interest Rate Expectations
Indicators To Watch - Interest Rate Expectations
Neutral In our recent initiation of coverage on the newly minted Communication Services sector, we examined the impact of a variety of technology and consumer discretionary stocks being pulled together to form a new GICS1 sector.1 One sector that saw some important changes was the S&P internet retail index, a sub-sector of consumer discretionary, with Netflix and TripAdvisor moving out and eBay moving in. Our thesis of continued elevated profit growth being offset by sky-high valuations is unchanged by these moves, though there are two important developments. First, the moves are not equal from a market cap perspective and the stocks moving out are much larger than the one moving in. The upshot is that Amazon goes from 75% of the index to 85% now, meaning that little else matters than that sole equity to an even greater extent. Thus, the second development is Amazon’s 12% share price pullback this month which has made the sky-high index valuation look less-so (second and third panels). Our take is that the decreased diversification has added specific risk that should naturally increase the index’s volatility and, accordingly, our valuation and technical indicators are less reliable. As such, we are maintaining our benchmark allocation recommendation, though we are growing more constructive as the valuation declines. The ticker symbols for the stocks this index are: BLBG: S5INRE - AMZN, BKNG, EBAY, EXPE. 1 Please see BCA U.S. Equity Strategy Special Report, “New Lines Of Communication” dated October 1, 2018, available at uses.bcaresearch.com.
The Amazonification Of Internet Retail
The Amazonification Of Internet Retail
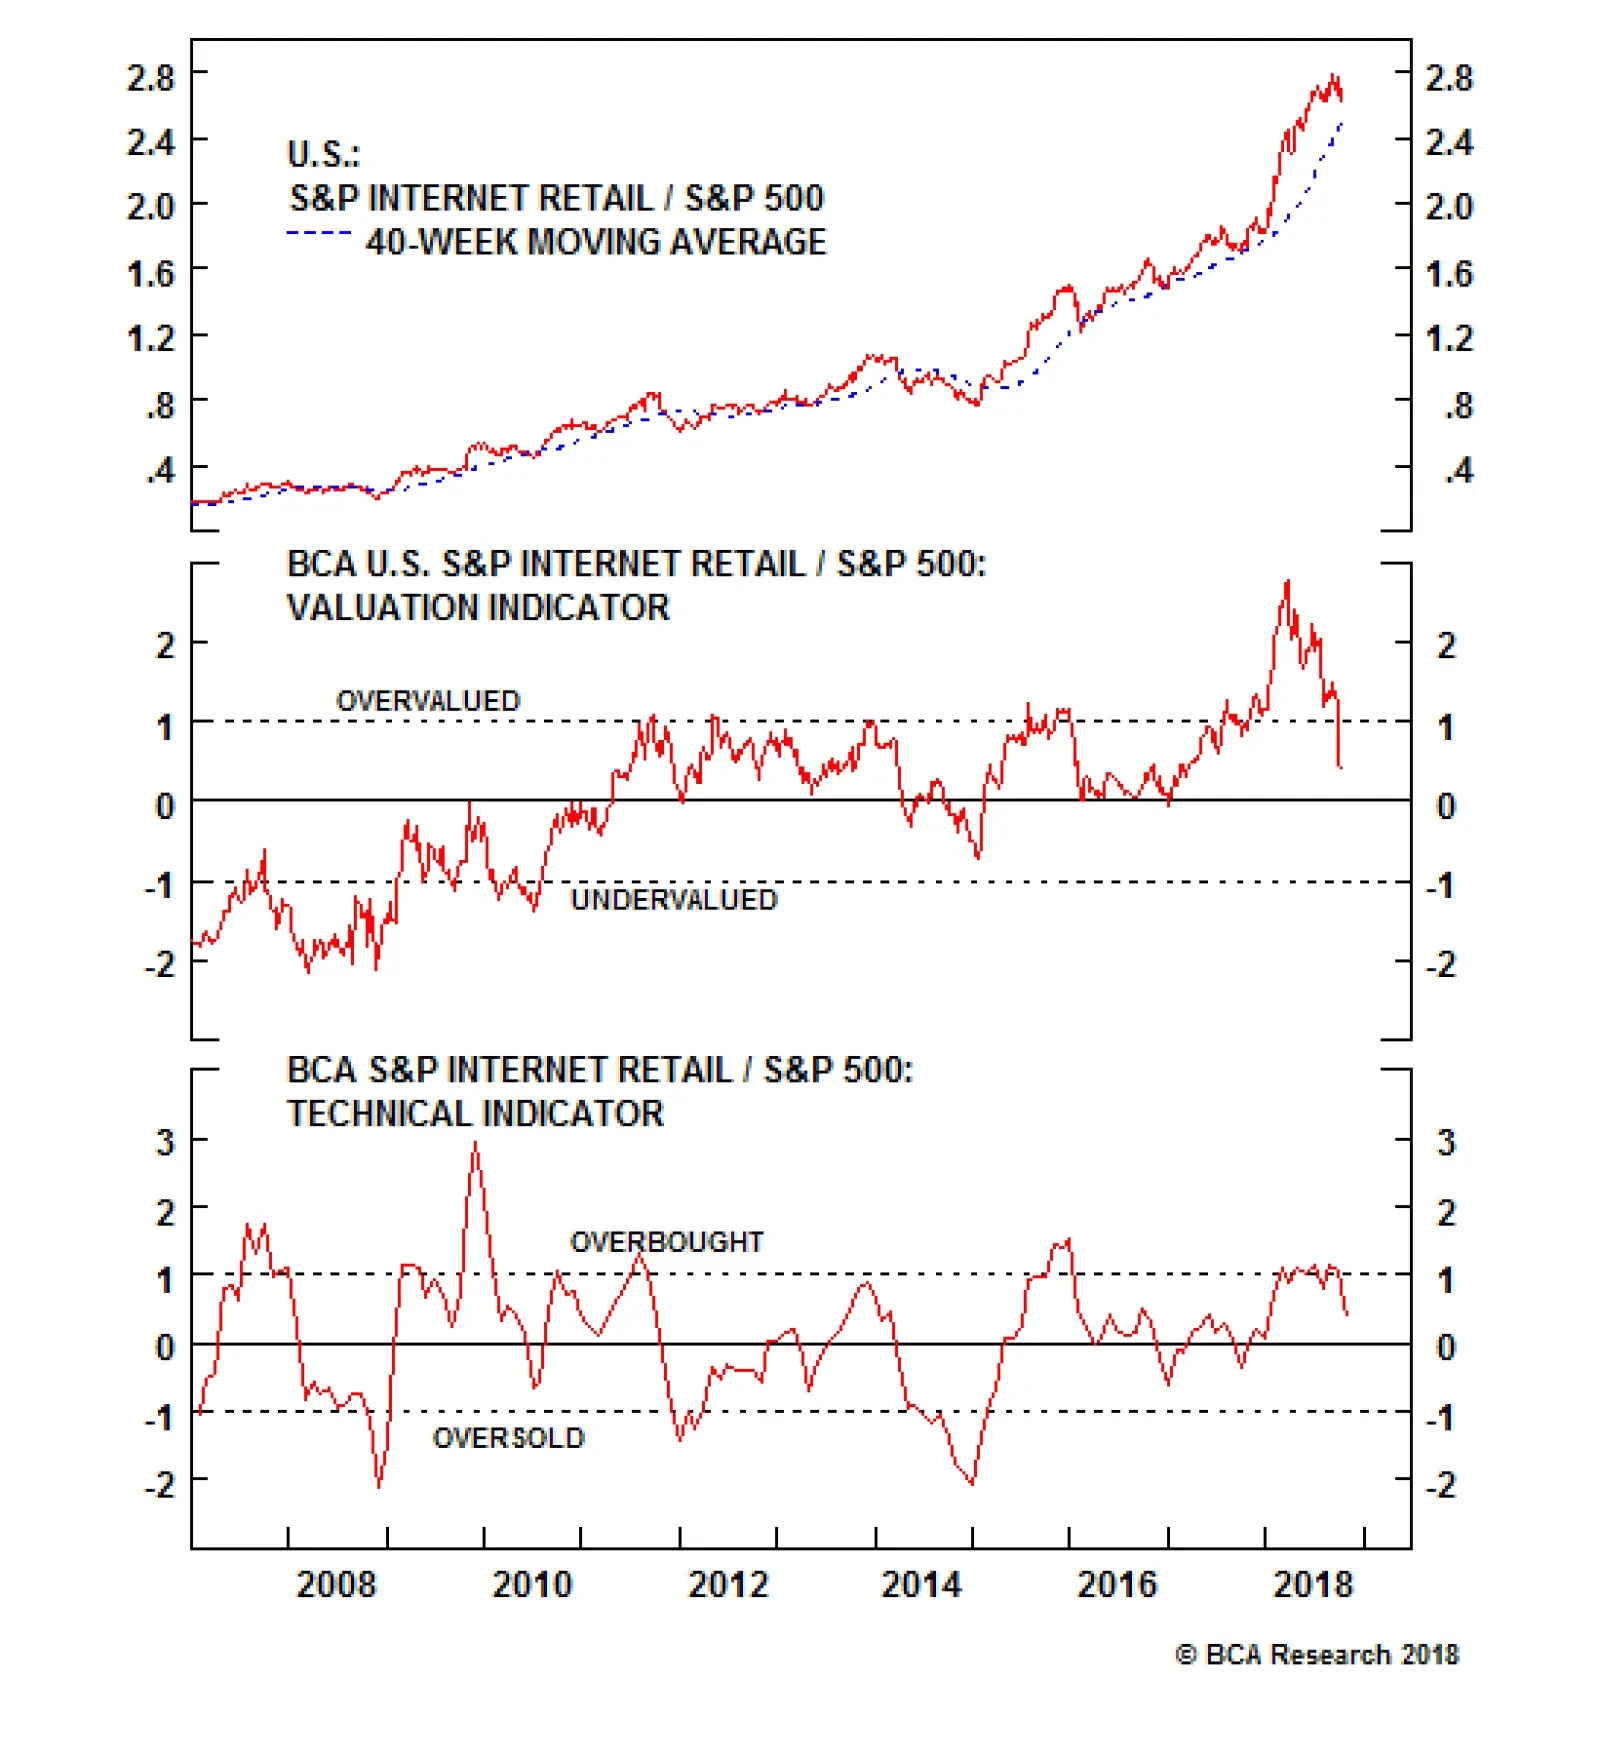
One sector that saw some important changes was the S&P internet retail index, a sub-sector of consumer discretionary, with Netflix and TripAdvisor moving out and eBay moving in. Our thesis of continued elevated profit growth being offset by sky-high…
Highlights The pace of "de-capacity" reforms in China will continue to diminish, with declining shutdowns of inefficient capacity and rising advanced capacity over the next 12-15 months. Coal prices may have less downside than steel prices due to more resilient domestic demand, and lower production growth for the former than the latter. Meanwhile, iron ore prices may have limited downside and could outperform steel prices due to increasing shutdowns of domestic iron ore mines. Go long September 2019 thermal coal and iron ore futures versus September 2019 steel rebar futures. Chinese coal producers' shares may outperform Chinese steel producers' shares. Feature This April, our Special Report titled, "Revisiting China's 'De-Capacity' Reforms," painted a negative picture for steel and coal prices over 2018 and 2019 on diminishing pace of "de-capacity" reforms and rising steel and coal output.1 So far, our call has not yet played out. Both steel and coal prices have been firm over the past five months (Chart 1A). Meanwhile, iron ore and coking coal have also rebounded (Chart 1B). Chart 1ASteel And Coal Prices: More Upside Ahead?
Steel And Coal Prices: More Upside Ahead?
Steel And Coal Prices: More Upside Ahead?
Chart 1BIron Ore And Coking Coal Prices: Following Steel And Coal Prices?
Iron Ore And Coking Coal Prices: Following Steel And Coal Prices?
Iron Ore And Coking Coal Prices: Following Steel And Coal Prices?
In this report, we return to the analysis we laid out back in April, with the goal of identifying whether or not the rally in steel and coal prices will continue. Another major question to answer is why share prices of coal and steel companies have continued to plunge, even though coal and steel prices have held up well. In brief, our research findings still suggest that steel and coal prices are likely to fall over the next 12-15 months on a diminishing pace of de-capacity (less shutdowns of old capacity) and rising advanced capacity. We also reckon that coal prices may have less downside than steel prices over the next 12-15 months due to more resilient domestic demand and smaller production growth compared to steel; we conclude by outlining a long/short trade opportunity tied to this view. Understanding The Recent Price Rally The recent strength in both steel and coal prices has been due to a tighter supply-demand balance than we expected: Steel Falling steel product output and still-solid steel demand growth have pushed up steel prices this year. While crude steel production has had strong growth so far this year (9% year-on-year and 50 million tons in volume), total output of steel product has actually declined by 20 million tons (2.7%) year-on-year during the same period (Chart 2). Steel products, including rebars, wire rods, sheets and other items, are made from crude steel and consumed in end consumption. Tianjin province - a city very close to Beijing - accounted for more than 100% of the reduction of steel product output, as 40% of the province's operating capacity was shut down due to the city's "de-capacity" policy and increasingly stringent environmental regulations. In addition, Chinese steel products production had already experienced huge cut last year by nearly 100 million due to the government's "Ditiaogang" de-capacity policy.2 As a result, strong crude steel output growth this year has not been able to lift steel product production from contraction, creating a shortage in Chinese steel product supply. To put it in perspective, total steel products production for the first eight months of this year is at a five-year low. Chart 2Falling Steel Product Output Amid Strong Crude Steel Production Growth
Falling Steel Product Output Amid Strong Crude Steel Production Growth
Falling Steel Product Output Amid Strong Crude Steel Production Growth
Chart 3Steel Demand Has Been Robust As Well
Steel Demand Has Been Robust As Well
Steel Demand Has Been Robust As Well
Meanwhile, massive pledged supplementary lending (PSL) injections - the People's Bank of China's direct lending to the real estate market - had extended property sales and starts beyond what appeared to be a sustainable trajectory, thereby lifting steel demand to some extent3 (Chart 3). Hence, weaker-than-expected steel products supply combined with slightly better demand than we anticipated have tightened the Chinese domestic steel market further, and underpinned high steel prices. Coal Similarly, the rebound in coal prices has also been due to declining output and strong demand growth. Chinese coal output turned out to be much weaker than we expected due to extremely stringent and frequent environmental and safety inspections on coal output (Chart 4). Back in mid-2017, in order to curb pollution, China demanded that coal mines plant trees, boost efficiency, cut down noise and seal off facilities from the outside world as part of a new "green mining" plan. This year's inspection have been even more stringent. Operations among coal mines, coal-washing plants and coal storage facilities were halted immediately if inspection teams found they failed to meet the related standards. As a result, Chinese coal production contracted 1% for the first eight months of this year. Chart 4Weaker-Than-Expected Coal Output
Weaker-Than-Expected Coal Output
Weaker-Than-Expected Coal Output
Chart 5Resilient Thermal Coal Demand
Resilient Thermal Coal Demand
Resilient Thermal Coal Demand
On the demand side, electricity generation from thermal power has remained quite robust at 7% (Chart 5). Again, coal prices have rebounded as the domestic coal supply-demand balance has tightened. Will Steel And Coal Prices Continue To Rise? The short answer is no. Many of the drivers underpinning the recent rally in steel and coal prices are set to fade over the next 12-15 months: Steel Steel prices will likely weaken in 2019 on rising steel product output and faltering steel demand growth. First, production of both crude steel and steel products will rise considerably next year, as the steel sector's de-capacity target is almost reached and new advanced capacity will come on stream faster to replace old or inefficient capacity that has already exited the market. Table 1 showed the 82% of this year's steel de-capacity target was already achieved by the end of July, leaving not much in the way of additional de-capacity cuts needed through the remainder of 2018. If this year's de-capacity cut target of 30 million tons is fulfilled over the next two months, there will be no need for any more capacity cuts in 2019, as the high end of the 2016-2020 de-capacity target (150 million tons) will be fully met this year. Table 1Supply-Side Reform - Capacity Reduction Target And Actual Achievement
Revisiting China's De-Capacity Reforms
Revisiting China's De-Capacity Reforms
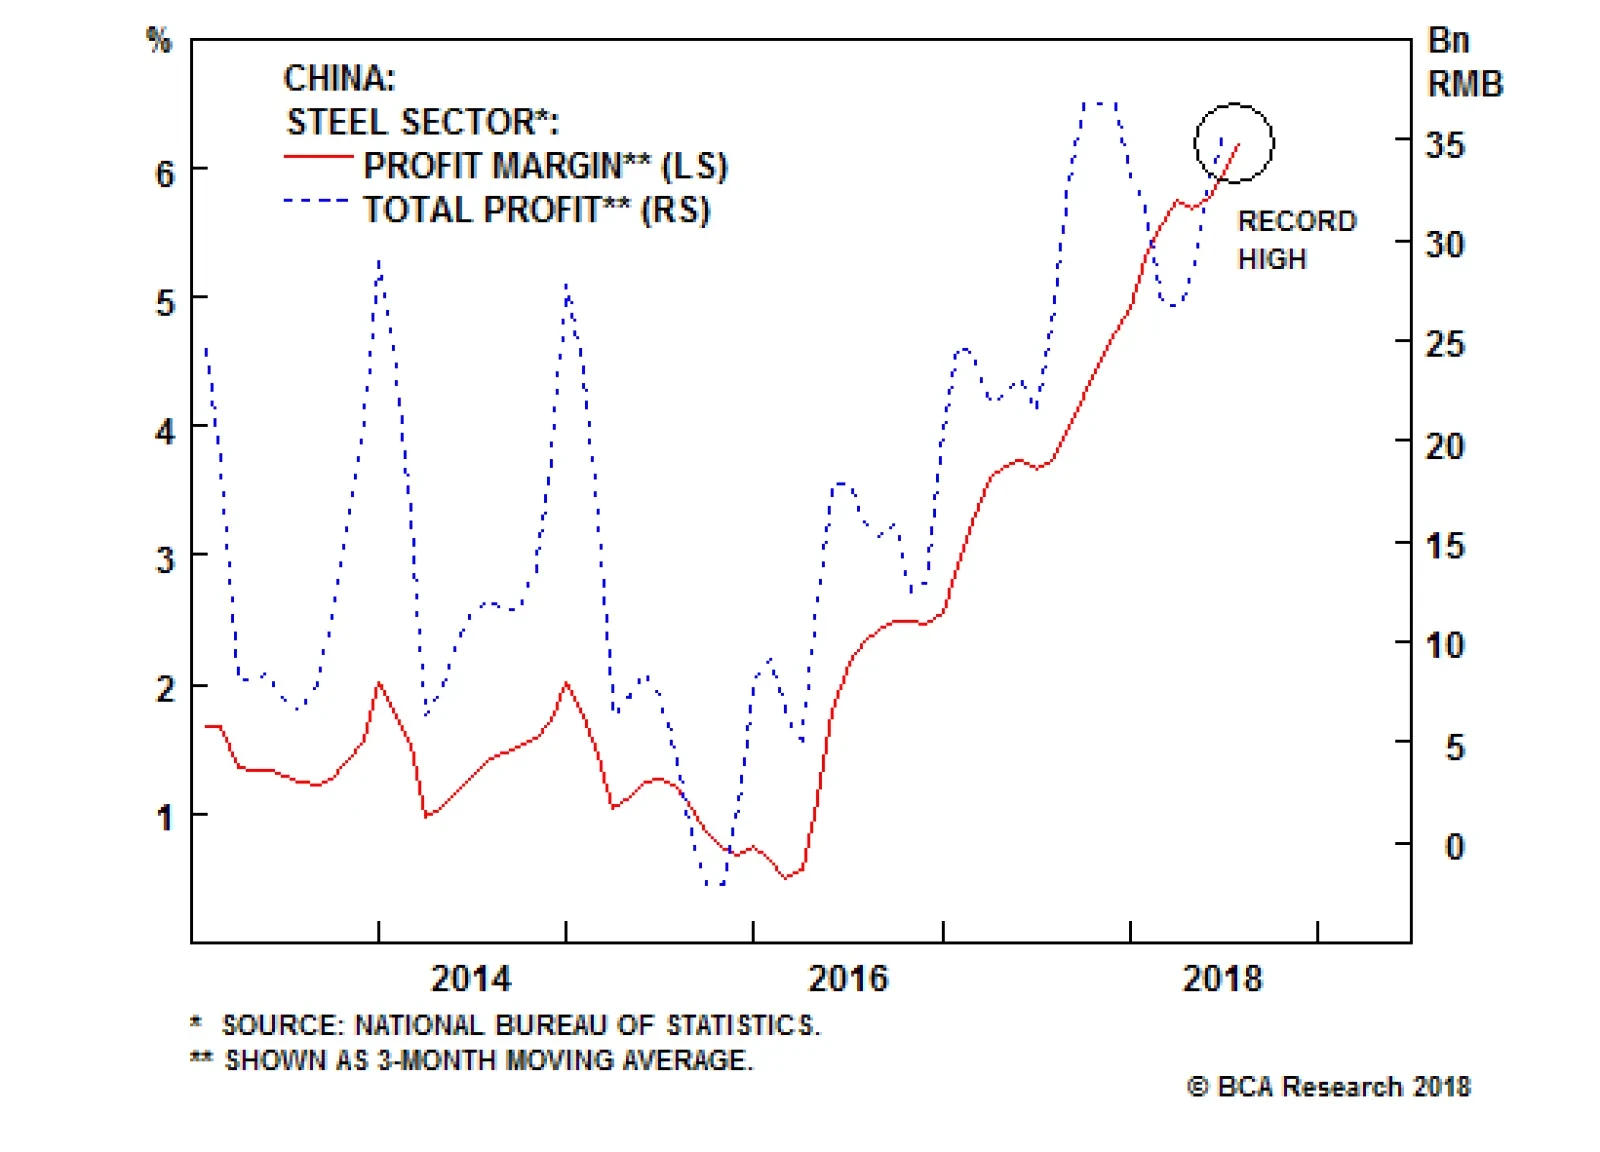
Record-high profit margins that Chinese steel producers are currently enjoying will also help boost steel production (Chart 6). This was the main driver behind this year's strong growth in crude steel output, despite more stringent environmental policies and ongoing de-capacity efforts. In addition, falling graphite electrode prices and increasing graphite electrode production will facilitate the expansion of cleaner electric furnace (EF) steel capacity and production in China (Chart 7). Chart 6Steel Producers' Profit Margin: At A Record High
Steel Producers' Profit Margin: At A Record High
Steel Producers' Profit Margin: At A Record High
Chart 7Rising Graphite Electrode Supply Will Facilitate EF Steel Output
Rising Graphite Electrode Supply Will Facilitate EF Steel Output
Rising Graphite Electrode Supply Will Facilitate EF Steel Output
EF technology uses scrap steel as raw materials, graphite electrodes and electricity to produce crude steel. The availability of graphite electrode has been one major bottleneck for the development of EF capacity. As of late 2017, there were about 524,000 tons of new graphite electrode capacity under construction, most of which will be completed within the next two years. This will nearly double the current capacity of 590,000 tons. As this capacity gradually enters into the market, graphite electrode prices will drop further, encouraging more EF steel projects. In 2017, newly added EF steel capacity was about 30 million tons, and EF steel production increased by about 24 million tons (47% year-on-year). With rising graphite electrode supply, EF capacity this year is expected to add 40 million tons, resulting in about a 25-30 million ton increase in EF steel output. In 2019, based on the government's goal of 15% of total steel production being EF steel by 2020, we expect another 25-30 million tons new EF capacity to come online. This alone would translate into 3-4% rise in steel product production in 2019. Second, while steel supply is rising, the demand outlook seems more pessimistic. Our September 13 Special Report titled, "China's Property Market: Where Will It Go From Here?" concluded that the Chinese property market is facing increasing downside risks. Diminishing PSL direct financing from the central bank and shrinking funding sources for Chinese real estate developers point to a considerable slowdown in property starts and construction, which will eventually lead to faltering demand for steel. Chinese auto output growth is weak, with the three-month moving average growth registering a 6% contraction this September. The government has boosted infrastructure projects. This will support steel demand to some extent, but it is unlikely to offset demand weakness from the down-trending property market. The property market is the biggest steel-consuming sector, accounting for 38% of total Chinese steel consumption - much higher than the 23% share from the infrastructure sector. Bottom Line: Steel prices may stay high over the next two or three months due to low inventories and heating-season production controls within the steel industry. Nonetheless, steel prices are vulnerable to the downside over the next 12-15 months on rising steel product output and faltering steel demand growth. Coal Coal prices will likely decline over the next 12-15 months, but the price downside may be less than that of steel. First, on the supply side, coal output will rise only moderately (i.e., 2-3%) in 2019. There are three drivers pushing up Chinese coal output. The government in May asked domestic coal producers to ramp up coal output, as current coal market supply has been tight this year. Particularly, the National Development and Reform Commission (NDRC) demanded that the top three coal produce provinces (Shanxi, Shaanxi, and Inner Mongolia) increase their aggregated coal output by at least 300,000 tons per day as soon as possible. However, the June-July environmental inspections within the major producing province of Mongolia resulted in a 14 million ton year-on-year drop in the province's coal output. If the 300,000 ton per day increase is realized in 2019, it will be equivalent to nearly 100 million tons of new coal supply next year, which is about 2.8% growth from 2017's output of 3.52 billion tons. Based on government data, 660 million tons of capacity is currently under construction, which includes new technologically advanced capacity that has already been built and ready to use but has not yet received government approval. If 30% of the under-construction capacity comes to market in 2019 and runs at a capacity utilization rate of 70%, it will translate into about 140 million tons of new coal supply next year, which is about 4% growth from last year. Due to too-strict production policies during the winter heating season, there was a coal supply crisis last winter. This year, the government is likely to implement a less stringent production policy for coal. In this case, coal producers will likely produce more to take advantage of seven-year-high profit margins (Chart 8). Chart 8Coal Producers' Profit Margin: At A Multi-Year High
Coal Producers' Profit Margin: At A Multi-Year High
Coal Producers' Profit Margin: At A Multi-Year High
However, at the same time there are also two drivers dragging down coal output. Table 1 above shows that at the end of July, only 53% of this year's coal de-capacity target and 65% of the government's 2016-2020 coal capacity reduction target had been achieved. This implies that Chinese coal producers still need to cut 70 million tons of old coal capacity through the remainder of 2018 and another 210 million tons of inefficient capacity in the coming two years (2019 and 2020) - possibly 105 million tons of cuts in each year. Similar to steel, coal de-capacity reforms are also diminishing (e.g. a 150-million ton reduction target in 2018 versus a 105 million-ton reduction target in 2019). However, different from steel, the remaining de-capacity target for coal is still quite significant. With continuing the implementation of its de-capacity plan, excluding the three major producing provinces, the remaining provinces that in general have smaller-scale coal mines may face further cuts in their coal production. For the first eight months of this year, 13 out of the 22 non-top-three coal-producing provinces registered a contraction in coal output. Environmental policies will likely remain strict, given the country seems determined to improve its air quality. More frequent inspection and/or stricter policies will further curb coal production. On balance, we still expect overall coal output to increase moderately (i.e., 2-3%) next year. Second, on the demand side, coal demand growth will weaken only slightly due to robust thermal coal consumption for thermal power generation (Chart 5 above). We expect Chinese electricity consumption to grow at 5-6% next year - a touch lower than this year - on strong demand from both the residential and service sectors. Most of the growth will likely be supplied by thermal power, as some 72% of total electricity generation is currently thermal power. In addition, the government has limited hydropower and nuclear power projects coming onstream next year. In the meantime, coal consumption for heating will likely be replaced by natural gas or electricity, and coking coal demand may fall due to EF steel expansion and more use of scrap steel in blast furnaces. Bottom Line: Coal prices are likely to head south on rising supply and weakening demand growth next year. In addition, we expect coal prices to fall less than steel prices over the next 12-15 months on a tighter supply-demand balance for the former than the latter. What About The Iron Ore Market? The outlook for iron ore prices is becoming less downbeat. Iron ore prices may have limited downside and could outperform steel prices over the next 12-15 months - due to increasing shutdowns of mainland iron ore mines. Government data show that Chinese domestic iron ore output contracted 40% year-on-year in the first eight months of this year (Chart 9). About 60% of the decline was from Hebei - the province that has probably imposed the strictest environmental policies among all the provinces targeting ferrous- and coal- related industries - due to its proximity to the capital, Beijing. Chart 9Significant Drop In Domestic Iron Ore Output
Significant Drop In Domestic Iron Ore Output
Significant Drop In Domestic Iron Ore Output
Profit margins for iron ore miners has tanked to a 15-year low due to rising production costs on environmental protections. The number of loss-making enterprises as a share of the total number of iron ore companies has reached a record high (Chart 10). Although EF steel capacity additions will contribute to most of the growth in crude steel output next year, non-EF crude steel capacity, which uses iron ore as its main input, will also increase to some extent. This will also lift iron ore demand, which will lead to further declines in port inventories and rising imports (Chart 11). Chart 10Iron Ore Producers' Profit Margin: At A 15-Year Low
Iron Ore Producers' Profit Margin: At A 15-Year Low
Iron Ore Producers' Profit Margin: At A 15-Year Low
Chart 11Chinese Iron Ore Imports Are Likely To Go Up
Chinese Iron Ore Imports Are Likely To Go Up
Chinese Iron Ore Imports Are Likely To Go Up
Bottom Line: We are less bearish on iron ore prices and expect them to outperform steel prices. Chinese iron ore imports will likely grow again. Investment Implications Three main investment implications can be drawn from our analysis. Price ratios of thermal coal/steel rebar and iron ore/steel rebar have fallen to record low levels (Chart 12). As we expect thermal coal and iron ore prices to outperform steel, we recommend going long September 2019 thermal coal futures/short September 2019 steel rebar futures and going long September 2019 iron ore futures/short September 2019 steel rebar futures on Chinese exchanges in RMB. Chinese coal imports including both thermal coal and coking coal could remain strong, which would at a margin be positive news for Chinese major coal importers Australia, Indonesia, Russia and Mongolia. In the meantime, Chinese iron ore imports are likely to rebound in 2019 as well. This will be positive news for producers in Australia, Brazil and South Africa. Chart 12Both Thermal Coal And Iron Ore Will Likely Outperform Steel
Both Thermal Coal And Iron Ore Will Likely Outperform Steel
Both Thermal Coal And Iron Ore Will Likely Outperform Steel
Chart 13Coal Producers' Shares May Outperform Steel Producers' Stocks
Coal Producers' Shares May Outperform Steel Producers' Stocks
Coal Producers' Shares May Outperform Steel Producers' Stocks
Despite stubbornly high coal and steel prices, Chinese share prices of coal producers and steel producers have still plunged (Chart 13, top and middle panel). From a top-down standpoint, it is hard to explain such poor share price performance among Chinese steel and coal companies when their profits have been booming. Our hunch is that these companies have been forced by the government to shoulder the debt of their peer companies that were shut down. This is an example of how the government can force shareholders of profitable companies to bear losses from restructuring by merging zombie companies into profitable ones. Based on our analysis, Chinese steel producers' share prices are still at risk of falling steel prices, while coal-producing companies may benefit from rising production and limited downside in coal prices. Hence, Chinese coal producers' shares may continue to outperform steel producers' shares with the price ratio of the former versus the latter just rebounding from three-year lows (Chart 13, bottom panel). Ellen JingYuan He, Associate Vice President Emerging Markets Strategy EllenJ@bcaresearch.com 1 Pease see Emerging Markets Strategy Special Reports "China's 'De-Capacity' Reforms: Where Steel & Coal Prices Are Headed", dated November 22, 2017, and "Revisiting China's De-Capacity Reforms", dated April 26, 2018, available at ems.bcaresearch.com. 2 Ditiaogang" is low-quality steel made by melting scrap metal in cheap and easy-to-install induction furnaces. These steel products are of poor quality and also lead to environmental degradation. As "Ditiaogang" is illegal in China, it is not recorded in official crude steel production data. However, after it is converted into steel products, official steel products production data do include it. Consequently, last year's significant removal of "Ditiaogang" and statistical issues have caused the big divergence between crude steel production expansion and steel products output contraction since then. 3 Pease see China Investment Strategy Special Report "China's Property Market: Where Will It Go From Here?", dated September 13, 2018, available at cis.bcaresearch.com. Cyclical Investment Stance Equity Sector Recommendations
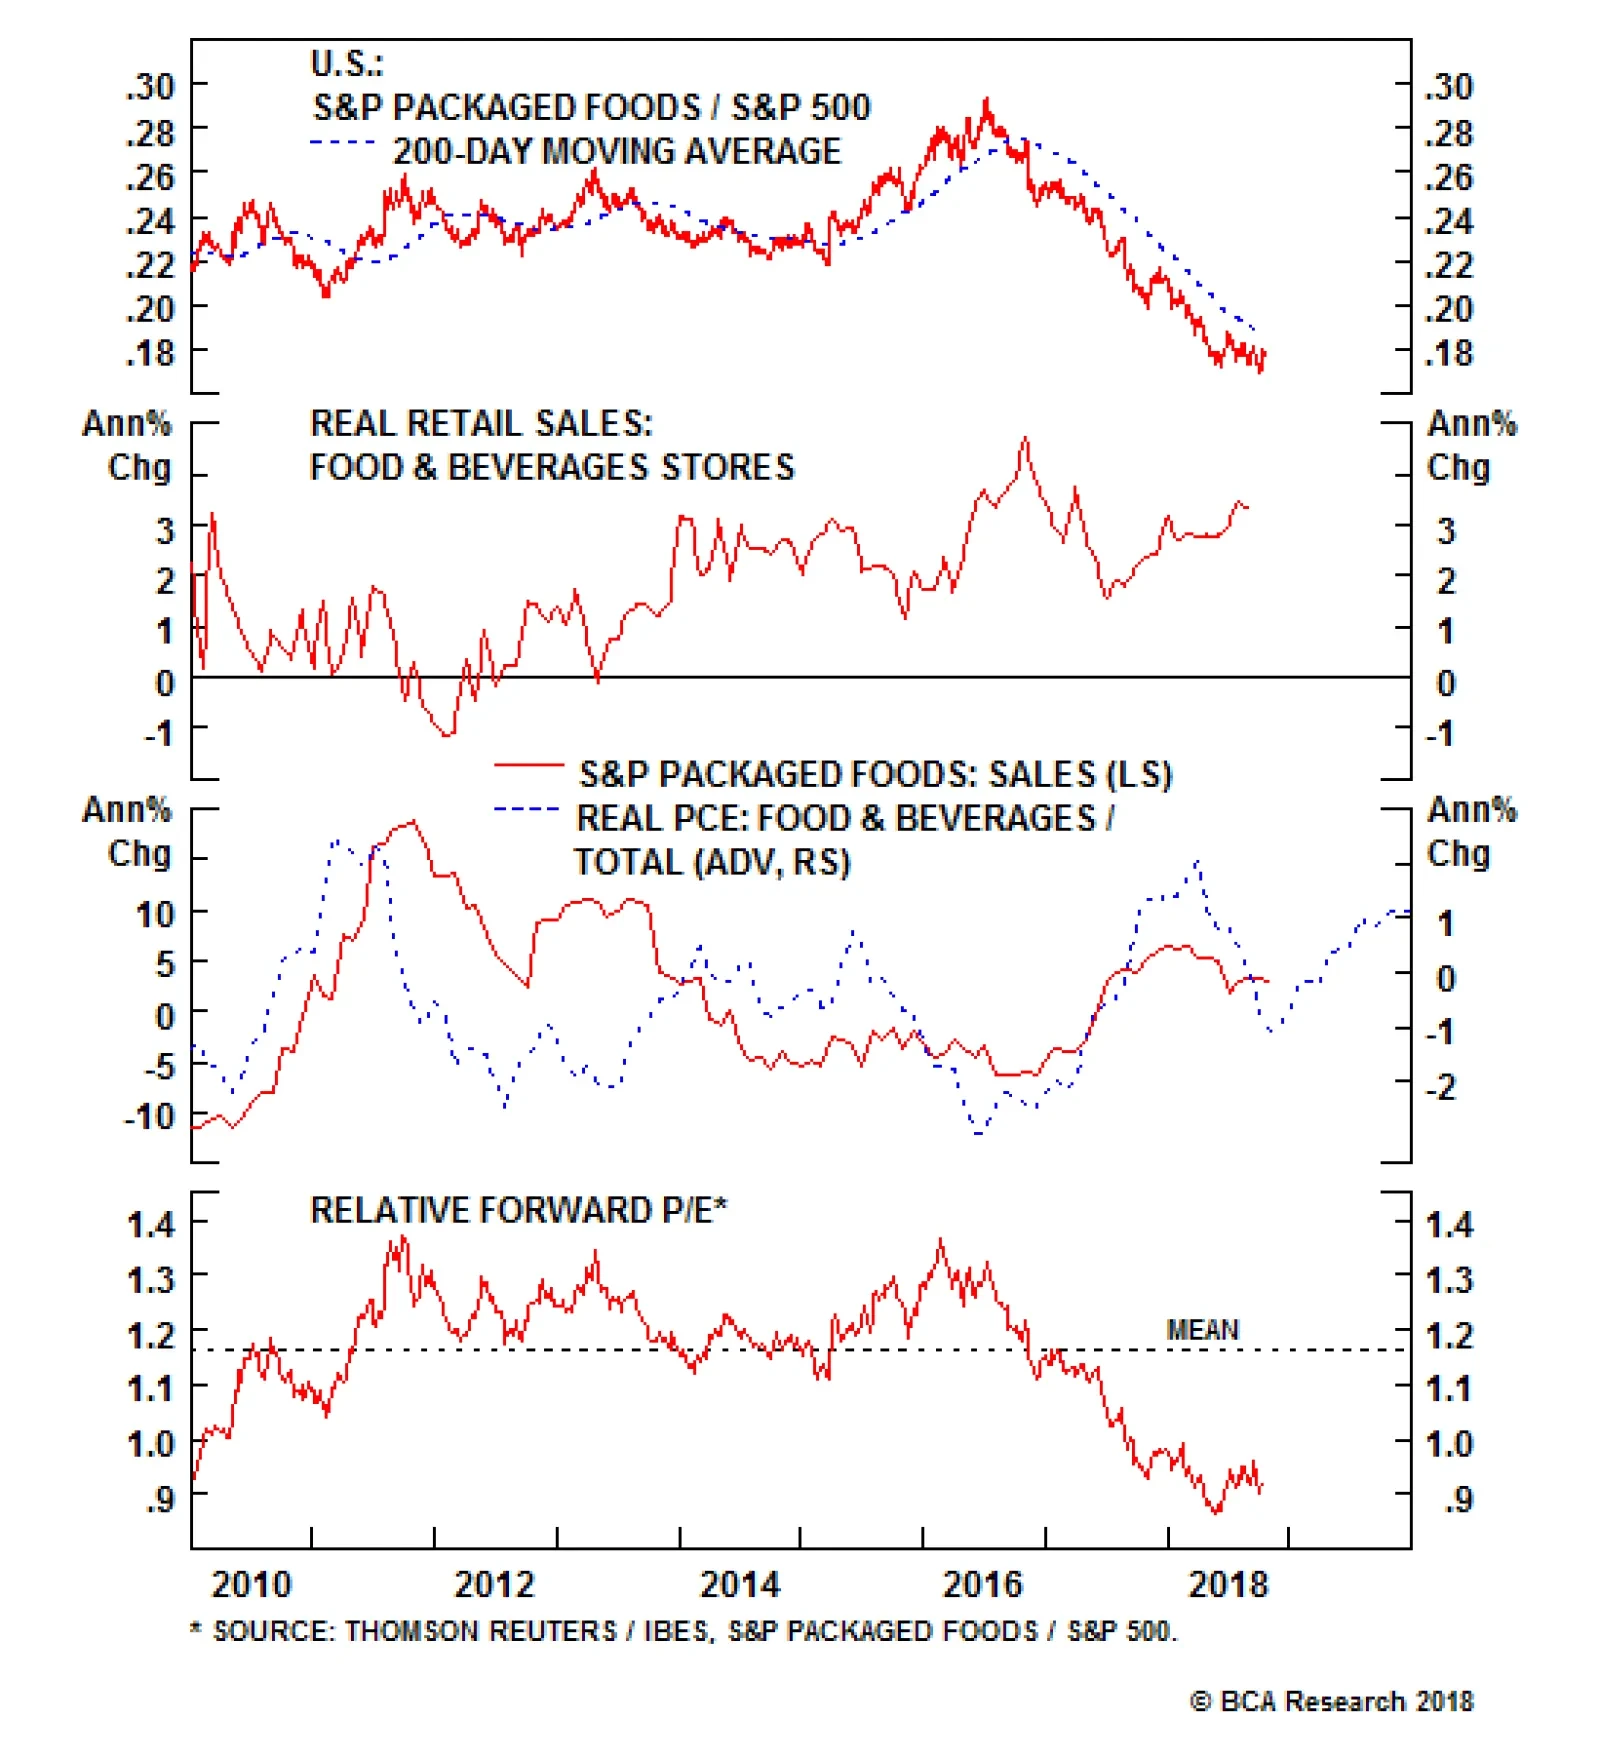
However, the S&P packaged foods sub-index has not participated in the rebound. These exports-oriented stocks have been held back by trade and currency headwinds. Still, we remain constructive on the index as those handicaps could evaporate as suddenly as…
Consumer staples stocks have been staging a recovery late in the year, buoyed by an exceptionally strong consumer. However, the S&P packaged foods sub-index has not participated in the rebound, held back by trade and currency headwinds in this export market-exposed sector. Still, we remain constructive on the index as those headwinds could evaporate as suddenly as they came, leaving a very solid domestic demand backdrop to lift the stocks into outperformance territory. Indeed, the environment looks exceptionally healthy; food retailers have been riding a five-year rising tide of sales (second panel). Further, consumers have been boosting their food consumption, which has historically been a good leading indicator of top line growth (third panel). In the context of a strong dollar providing a meaningful offset to packaging and raw food commodity prices, margin expansion looks particularly potent. Despite the bright outlook, the S&P packaged foods index remains deeply discounted, trading well below its eight-year average earnings multiple as well as the market multiple (bottom panel). We think investors should pick this one out of the bargain bin; stay overweight. The ticker symbols for the stocks in this index are: BLBG: S5PACK - MDLZ, KHC, GIS, TSN, K, MKC, HSY, CAG, SJM, HRL, CPB.
Digging In To Packaged Foods
Digging In To Packaged Foods