Sectors

Underweight - Upgrade Alert The S&P airlines index has been buffeted by headwinds arising from the increasing cost of jet fuel; as the top panel of our chart shows, the price of jet fuel is the single largest driver of airline relative stock performance. In an environment where nearly all airlines bear the volatility of fuel costs without hedging offsets and where such costs represent roughly a quarter of the total, this correlation is logical. Airlines have been responding to rising jet fuel prices by cancelling planned capacity expansions and clamping down on controllable costs, as evidenced by Delta's strong Q3 earnings report this week. Still, the sell side has been reducing profit forecasts in parallel with falling stock prices. The upshot is that valuations have moved sideways to lower (bottom panel). As a reminder, we added an upgrade alert to the S&P airlines index this summer as these depressed valuations reflect much of the bad news. We reiterate that we would not hesitate to crystallize relative profits north of 27% since our underweight inception if fuel prices reverse direction. Bottom Line: Stay underweight the S&P airlines index for now and maintain an upgrade alert. The ticker symbols for the stocks in this index are: BLBG: S5AIRL - DAL, LUV, AAL, UAL, ALK.
Fuel Pressure Is Causing Airlines To Bleed Air
Fuel Pressure Is Causing Airlines To Bleed Air
Overweight - Downgrade Alert Between Friday of this week and Monday of next, roughly 75% of the S&P banks index, representing the nation's largest lenders, will be reporting their Q3 earnings results. Our loan growth and earnings models continue to point significantly higher, particularly the former which is near a 30-year high, a result of a booming economy and record low unemployment. The question becomes whether or not the market cares; the S&P banks index delivered earnings outperformances in both Q1 and Q2 of this year and still underperformed the broad market. Further, the spread between relative performance and yields is widening and even a steepening in the yield curve has not been enough to stimulate a banks rally. We put the S&P banks index on downgrade alert in mid-May when we locked in gains vs. the SPX of 6% and removed it from the high-conviction overweight list, and warned that were banks not to participate in the next bond market selloff we would pull the trigger and downgrade to neutral. Our patience is wearing thin as we await the market's reaction to what should be another solid earnings quarter. Bottom Line: Stay overweight banks, but stay tuned.
Bank Earnings Should Be Revealing
Bank Earnings Should Be Revealing
Highlights Asset allocation: Go long industrial commodities versus equities on a 6-month horizon. If an inflationary impulse is dominating, beaten-down industrial commodities have more upside than richly valued equities; and if a disinflationary impulse is dominating, its main casualty will be equities. Currencies: Take profits on long EUR/CNY. Maintain a broadly neutral stance to EUR, with short EUR/JPY counterbalancing long EUR/USD. Equity sectors: overweight basic materials versus the market. And within the basic materials sector, overweight basic resources versus chemicals. Chart of the WeekChina's 6-Month Credit Impulse Provides A Perfect Explanation For Commodity Inflation
China's 6-Month Credit impulse Provides A Perfect Explanation For Commodity Inflation
China's 6-Month Credit impulse Provides A Perfect Explanation For Commodity Inflation
Feature Equity markets are entering the crossfire between two opposing forces: an inflationary impulse coming from the global economy; and a disinflationary impulse as higher bond yields threaten to deflate the very rich valuations of equities and other risk-assets. As this battle plays out in the coming months a good strategy is to go long commodities versus equities. The logic is simple: if the inflationary impulse from the economy is dominating, then beaten-down industrial commodities have more upside than richly valued equities; and if the disinflationary impulse from higher bond yields is dominating, then commodities have less downside than equities, because commodities have a much weaker valuation link with bond yields. Therefore, going long industrial commodities versus equities on a 6-month horizon should be a good strategy however the battle between inflationary and disinflationary impulses plays out. Inflationary Impulse Battles Disinflationary Impulse Chart I-2 shows the credit impulse oscillations in the euro area, U.S., and China since the start of the millennium, all expressed in dollars to allow a comparison between the three major economies. It is a fascinating chart because the change in the dominant oscillation - the one with the highest amplitude - perfectly illustrates the shift in global economic power and influence from Europe and the U.S. to China. Chart I-2The Shift In Economic Power From Europe And The U.S. To China
The Shift In Economic Power From Europe And The U.S. To China
The Shift In Economic Power From Europe And The U.S. To China
Through 2000-08 the impulses in the euro area and the U.S. dominated. But during the global financial crisis that all changed: the credit stimulus from China dwarfed the responses from the western economies. Then through 2009-12 the impulse oscillations from the three major economies were briefly the same size, before China took on the undisputed mantle of dominant impulse, which it has held consistently since 2013. The world's three major economies are now all in 'up' oscillations according to their credit impulses. This means the global economy will experience an inflationary impulse for the next couple of quarters or so. However, battling the inflationary impulse is a disinflationary impulse. As the inflationary impulse pushes up bond yields, it threatens to deflate the very rich valuations of equities (and other risk-assets). Crucially, this disinflationary force is particularly vicious when bond yields are rising from ultra-low levels. We have described this dynamic exhaustively in previous reports, so we will not go into the detail here. But in a nutshell, both parts of an equity's required return - the risk-free component and the risk premium - go up together when bond yields are rising from ultra-low levels. Meaning that rising yields deflate equity valuations exponentially (Chart I-3).1 Chart I-3At Low Bond Yields The Valuation Of Equities Changes Exponentially
Go Long Commodities Versus Equities
Go Long Commodities Versus Equities
But Which Inflationary Impulse? At our recent investment conference in Toronto, the three speakers on the China panel gave three different conclusions on China: aggressively bullish, moderately bullish, and bearish! The aggressive bull pointed out that the 3-month credit impulse has gone vertical (Chart I-4); the moderate bull pointed out that the 6-month credit impulse appears to be turning up (Chart I-5); while the bearish argument was that the level of the 12-month credit and fiscal impulse remains depressed. Chart I-4The 3-Month Impulse Is Up Sharply...
The 3-Month Impulse Is Up Sharply...
The 3-Month Impulse Is Up Sharply...
Chart I-5But The 6-Month Impulse Is Just Turning
But The 6-Month Impulse Is Just Turning
But The 6-Month Impulse Is Just Turning
So which narrative should we use? The answer is the one that provides the best explanatory power for the cycles that we actually observe in the economic and financial market data. As we described in our Special Report The Cobweb Theory And Market Cycles, the theory and evidence powerfully identifies the 6-month credit impulse as the one with the best explanatory power for the oscillations that we actually observe in the economy and markets - because the 6-month period aligns most closely with the lag between credit demand and credit supply.2 In any case, as we use the 6-month impulse to powerful effect in Europe, consistency demands that we must use the 6-month impulses in U.S. and China too. For the sceptics, the Chart of the Week should finally obliterate any lingering doubts. China's 6-month impulse gives a spookily perfect explanation for the industrial commodity inflation cycle. The important takeaway right now is that if the 6-month impulse is turning up, so will industrial commodity inflation. What Does All Of This Mean For Investors? This brings us to our central message. As we have just seen, an up-oscillation in 6-month impulses, especially in China, will lift industrial commodity inflation. But it will likely have a much smaller influence on developed market equities which, in these circumstances, will be under the strong constraining spell of higher bond yields. On this basis the asset allocation recommendation is to go long industrial commodities versus equities on a 6-month horizon (Chart I-6). Chart I-6Go Long Commodities Vs. Equities
Go Long Commodities Vs. Equities
Go Long Commodities Vs. Equities
Interestingly, technical analysis also supports this recommendation over the next three months or so. Our tried and tested measure of excessive trending and groupthink suggests that the recent underperformance of industrial commodities relative to developed market equities is extreme and at a point which indicates a countertrend move, or at least a trend exhaustion (Chart I-7). Chart I-7The Underperformance Of Industrial Commodities Is Technically Stretched
The Underperformance Of Industrial Commodities Is Technically Stretched
The Underperformance Of Industrial Commodities Is Technically Stretched
For currencies, the foregoing analysis and charts means it is time to take profits in our long position in the euro versus the Chinese yuan. This leaves us with a broadly neutral exposure to the euro, with a short position versus the yen counterbalancing a long position versus the dollar. As for European equities, many years ago they were a pure play on events in Europe. Today, this might still be true for European 'tail-events' such as the euro sovereign debt crisis, or a potential 'no deal' Brexit. However, for the most part, European equity markets are tightly integrated with global equity markets - at least in direction if not level. Given that industrial commodity inflation takes its cue from the 6-month credit impulse - especially in China - it is hardly surprising that the European basic materials sector follows exactly the same cycle, both in absolute terms (Chart I-8) and relative to the broader equity market (Chart I-9). Therefore the equity sector recommendation is to overweight basic materials versus the market. Chart I-8China's 6-Month Credit Impulse Drives Europe's Basic Material Equities In Absolute Terms...
China's 6-Month Credit Impulse Drives Europe's Basic Material Equities In Absolute Terms...
China's 6-Month Credit Impulse Drives Europe's Basic Material Equities In Absolute Terms...
Chart I-9...And In Relative Terms
...And In Relative Terms
...And In Relative Terms
Interestingly, there is also a play within the basic materials sector. The basic resources sector which represents the miners and extractors of raw materials should fare better than the chemicals sector which uses these raw materials as an input (Chart I-10). Hence, overweight basic resources versus chemicals. Chart I-10Overweight Basic Resources Vs. Chemicals
Overweight Basic Resources Vs. Chemicals
Overweight Basic Resources Vs. Chemicals
Readers may argue that most of the foregoing charts illustrate the same cycle. But that's precisely the point! Never forget that financial markets follow the Pareto principle: the most important 20 percent of analysis explains 80 percent of the moves across all asset classes across all geographies across all times. The key to successful investing is to find the most important 20 percent of analysis. Dhaval Joshi, Senior Vice President Chief European Investment Strategist dhaval@bcaresearch.com 1 Please see the European Investment Strategy Weekly Reports 'Trapped: Have Equities Trapped Bonds?' September 13, 2018 and 'The Rule Of 4 For Equities And Bonds' August 2, 2018 available at eis.bcaresearch.com 2 Please see the European Investment Strategy Special Report 'The Cobweb Theory And Market Cycles' January 11, 2018 available at eis.bcaresearch.com Fractal Trading Model* It was a busy week for our trades. Long basic resources versus chemicals achieved its profit target, but short U.S. telecom versus U.S. autos hit its stop-loss. Meanwhile, short trade-weighted dollar reached the end of its 65 day holding period broadly flat. All three trades are now closed. In line with the main body of the report, this week's trade recommendation is to go long industrial commodities (represented by the CRB industrials index) versus equities (represented by the MSCI World Index in USD). The profit target is 2% with a symmetrical stop-loss. For any investment, excessive trend following and groupthink can reach a natural point of instability, at which point the established trend is highly likely to break down with or without an external catalyst. An early warning sign is the investment's fractal dimension approaching its natural lower bound. Encouragingly, this trigger has consistently identified countertrend moves of various magnitudes across all asset classes. Chart 11
Long CRB Industrials Vs. MSCI World
Long CRB Industrials Vs. MSCI World
The post-June 9, 2016 fractal trading model rules are: When the fractal dimension approaches the lower limit after an investment has been in an established trend it is a potential trigger for a liquidity-triggered trend reversal. Therefore, open a countertrend position. The profit target is a one-third reversal of the preceding 13-week move. Apply a symmetrical stop-loss. Close the position at the profit target or stop-loss. Otherwise close the position after 13 weeks. Use the position size multiple to control risk. The position size will be smaller for more risky positions. * For more details please see the European Investment Strategy Special Report "Fractals, Liquidity & A Trading Model," dated December 11, 2014, available at eis.bcaresearch.com Fractal Trading Model Recommendations Equities Bond & Interest Rates Currency & Other Positions Closed Fractal Trades Trades Closed Trades Asset Performance Currency & Bond Equity Sector Country Equity Indicators Bond Yields Chart II-1Indicators To Watch - Bond Yields
Indicators To Watch - Bond Yields
Indicators To Watch - Bond Yields
Chart II-2Indicators To Watch - Bond Yields
Indicators To Watch - Bond Yields
Indicators To Watch - Bond Yields
Chart II-3Indicators To Watch - Bond Yields
Indicators To Watch - Bond Yields
Indicators To Watch - Bond Yields
Chart II-4Indicators To Watch - Bond Yields
Indicators To Watch - Bond Yields
Indicators To Watch - Bond Yields
Interest Rate Chart II-5Indicators To Watch - Interest Rate Expectations
Indicators To Watch - Interest Rate Expectations
Indicators To Watch - Interest Rate Expectations
Chart II-6Indicators To Watch - Interest Rate Expectations
Indicators To Watch - Interest Rate Expectations
Indicators To Watch - Interest Rate Expectations
Chart II-7Indicators To Watch - Interest Rate Expectations
Indicators To Watch - Interest Rate Expectations
Indicators To Watch - Interest Rate Expectations
Chart II-8Indicators To Watch - Interest Rate Expectations
Indicators To Watch - Interest Rate Expectations
Indicators To Watch - Interest Rate Expectations
Underweight Utilities stocks are the ultimate loser from a backup in interest rates as they serve as premier fixed income proxies in the equity space and we are compelled to trim exposure to below benchmark. The niche S&P utilities sector yields 3.5% and when the competing risk free asset is near 3.2% and rising, investors prefer to shed, at the margin, riskier high-yielding equities and park the proceeds in U.S. Treasurys (top and second panels). Apart from the tight inverse correlation utilities have with interest rates, they are also a defensive sector that outperforms the broad market when the economy is in retreat. Currently a plethora of recent economic releases are signaling that the U.S. economy is overheating. The bottom panel of our chart illustrates the safe haven status of utility stocks (ISM survey shown inverted). Despite the above, spiking natural gas prices and a supportive electricity demand backdrop from a roaring economy present risks to our view; rising interest rates and a vibrant U.S. economy should nevertheless overwhelm. Bottom Line: We downgraded the S&P utilities sector to underweight yesterday; please see yesterday's Weekly Report for more details.
Lights Are Out For Utilities
Lights Are Out For Utilities
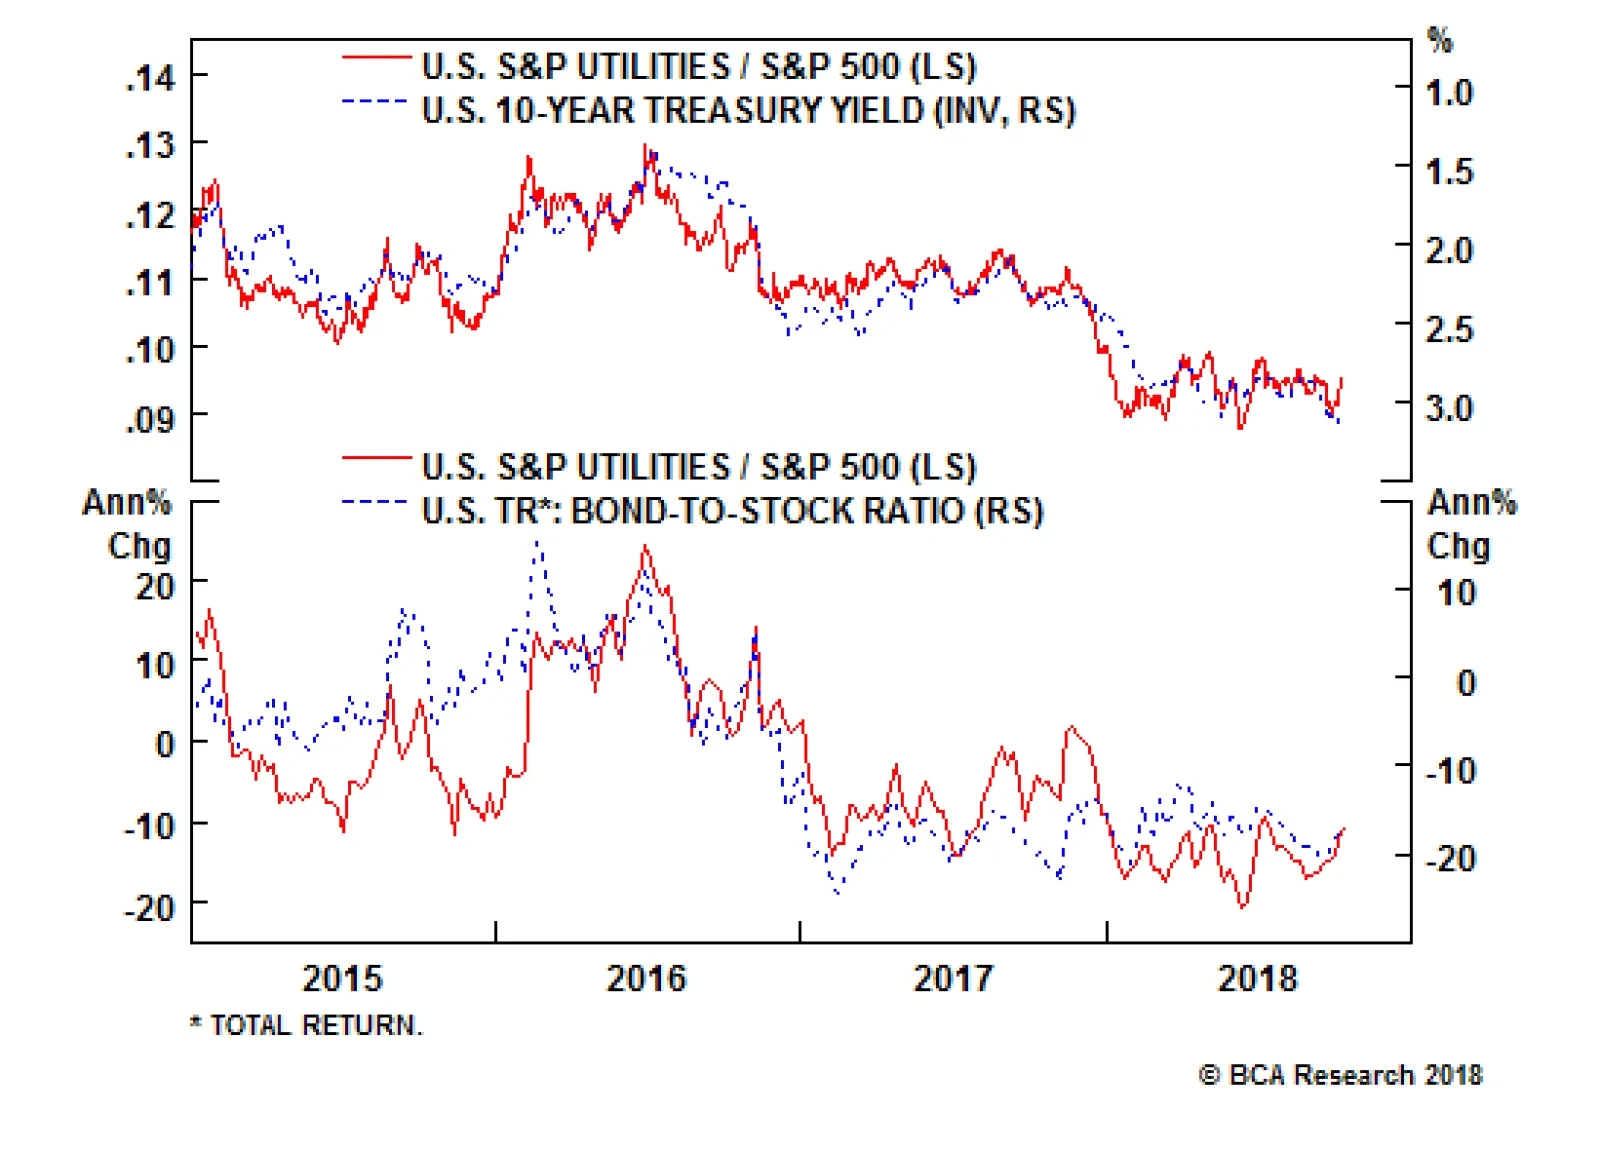
The S&P utilities sector yields 3.5% but when the yield offered by the competing risk free asset nears 3.2% and is rising, investors prefer to shed riskier high-yielding equities and park the proceeds in U.S. Treasurys. While arguably most of the bad…

Against such a backdrop, the coming quarters should see sectors that benefit from rising interest rates and that also serve as inflation hedges outperform. This means we favor "FIT" stocks, which refers to financials, industrials and selected technology…
Highlights Portfolio Strategy A playable sector rotation opportunity has emerged, as we first argued at the recent BCA investment conference: Financials, industrials and select tech subgroups will lead the next phase of the market advance, a result of the bond market selloff gaining steam into year-end and beyond. In contrast, rising interest rates, a vibrant U.S. economy, softening operating metrics and high indebtedness signal that it is time to shed utility stocks. Recent Changes Trim the S&P Utilities sector to underweight today. Table 1
The "FIT" Market
The "FIT" Market
Feature On the eve of earnings season, the SPX remains close to an all-time high. The most recent spate of investor optimism was driven by President Trump cementing another deal last week, this time with Canada. While the renaming of NAFTA to USMCA is a step in the right direction (i.e. a deal was struck), a deal with China remains the elephant in the room. On that front, U.S. hawkish trade rhetoric should remain in vogue and any deal will have to wait until at least after the election, if not until Q1/2019. Up to now Trump's trade hawkishness has not infiltrated U.S. profits, but we continue to closely monitor IBES reported profit growth expectations. Following up from last week, the rest of the world is bearing the brunt of the U.S. trade-related rhetoric according to our profit growth models, a message sell-side analysts' forecasts also corroborate (we use forward EBITDA in order to gauge trend profit growth and filter out the tax-induced jump in U.S. EPS, Chart 1). Meanwhile, at the margin, seasonality can prop up stocks. While September - a historically negative return month, but not this year - is behind us, stock market crash-prone October is upon us, and thus a pick-up in volatility would not come as a surprise. Beyond October's dreaded crash history, the Presidential cycle has piqued our interest, especially years two and three. Building on our sister Geopolitical Strategy publication's research,1 and given the upcoming midterm elections, we created a cycle-on-cycle profile of SPX returns during these two middle Presidential cycle years (Chart 2). Chart 1U.S. Has The Upper Hand
U.S. Has The Upper Hand
U.S. Has The Upper Hand
Chart 2Seasonality Boost Until Midyear 2019?
Seasonality Boost Until Midyear 2019?
Seasonality Boost Until Midyear 2019?
In more detail, we analyzed 17 cycles starting in 1950 using S&P 500 daily data (reconstructed S&P 500 prior to 1957). During these iterations, only two two-year periods ended in the red, 1974/75 and 2002/03. The first coincided with a recession and the second took place in the aftermath of the dotcom bust. In addition, two other cycles produced roughly 5% two-year returns, 1962/63 and 1966/67. Finally, 1954/55 was the outlier when the SPX went parabolic and nearly doubled. While every cycle is different, it is clear from Chart 2 that the Presidential cycle should continue to underpin the SPX, if history is an accurate guide, especially given our forecast of no recession in the coming 9-to-12 months. In fact, the S&P could rise another 10%, in line with our 2019 expectation, predicated upon a 10% increase in profits and a lateral multiple move. Interestingly, according to the median Presidential cycle-on-cycle roadmap, while the back half of 2019 is likely to prove more challenging, the first half of next year should enjoy most of the returns (Chart 2). An assessment of recent data releases in the U.S. and abroad is also revealing. Chart 3 shows that the domestic economy is firing on all cylinders. Consumer confidence and sentiment hit multi-decade highs recently. Similarly, the job market remains vibrant and small business euphoria reigns supreme. Not only are small business owners optimistic on all employment-related subcomponents of the NFIB survey, but SME capex intentions are also as good as they get. The ISM manufacturing survey ticked down from the August peak, but remains close to 60. Its close sibling, the ISM services survey, vaulted into uncharted territory. All of this is reflected in the still-growing U.S. leading economic indicator and signals that the U.S. equity market remains on a solid footing. Outside U.S. shores, the bearish narrative is well established with EMs, especially the U.S. dollar debt-saddled fragile five that have to contend with twin deficits, sinking in a bear market. China's debt load is also coming under intense scrutiny as U.S. tariffs are all but certain to weigh on Chinese output growth. Nonetheless, there is a chance that the EMs have depreciated their currencies by enough to engineer a modest rebound (bottom panel, Chart 4). In other words, absent the currency peg straightjacket that dominated the region in the late-1990s, free-floating FX devaluations may serve as a relief valve in order to boost exports. The latest Korean MARKIT manufacturing PMI spiked above the boom/bust line to a multi-year high signaling that already humming Korean factories (industrial production is accelerating) will likely remain busy in the coming months. Other hard economic data also confirm these greenshoots: Korean manufacturing exports are expanding smartly. In particular, exports to China are soaring. Reaccelerating manufacturing selling prices also corroborate this budding Korean recovery (third panel, Chart 4). Chart 3U.S. Is On Fire
U.S. Is On Fire
U.S. Is On Fire
Chart 4Reflationary Impulse?
Reflationary Impulse?
Reflationary Impulse?
While it is premature to call an end to the EM carnage, most of the bad news on global export volumes and prices may be nearing an end and the EMs may even export some of their inflation to the U.S. Play The Sector Rotation Into Financials And Industrials... In recent research, we have been highlighting that inflation is slowly rearing its ugly head and there are high odds that the selloff in the bond market gains steam into year-end and beyond2 (as a reminder BCA's fixed income publications continue to recommend below-benchmark portfolio duration). Against such a backdrop, sectors that benefit from rising interest rates and that serve as inflation hedges should outperform in the coming quarters. The "FIT" market refers to financials, industrials and select technology stocks. In more detail, we expect a sector rotation, especially into financials and industrials that have been laggards and remain compellingly valued (Chart 5). With regard to financials, Chart 6 shows that this early cyclical sector enjoys a positive correlation with interest rates and inflation expectations, and a catch up phase in relative share prices looms in the coming quarters. Chart 5Rotate Into Financials...
Rotate Into Financials…
Rotate Into Financials…
Chart 6...And Industrials
…And Industrials
…And Industrials
Industrials stocks also benefit from rising inflation and interest rates as large parts of this deep cyclical sector are levered to the commodity cycle (Chart 7). In other words, industrials stocks are an indirect inflation hedge and trouble surfaces only when capital goods producers cannot pass rising input costs down the supply chain or to the consumer. But, we are not there yet. Keep in mind that during the last cycle, relative (and absolute) industrials performance peaked prior to relative energy stock prices. Similarly, the relative industrials stock price ratio troughed in early 2009 before their deep cyclical brethren put in a (temporary) bottom a year later (Chart 8). Chart 7Industrials Lead
Industrials Lead
Industrials Lead
Chart 8Undervalued
Undervalued
Undervalued
True, energy stocks are also going to perform well if our thesis of higher interest rates/inflation pans out in the coming quarters and especially if BCA's Commodity & Energy Strategy service's view of a looming oil price spike materializes (Chart 9). Thus, we sustain the high-conviction overweight stance in the broad sector and reaffirm our recent upgrade to an above benchmark allocation in the S&P oil & gas exploration & production (E&P) subgroup.3 We also reiterate our recent market-neutral and intra-commodity pair trade: long S&P oil & gas E&P / short global gold miners.4 This trade is off to a great start up 10.3% since inception and will benefit further from an inflationary impulse. Chart 9Energy Remains A High-Conviction Overweight
Energy Remains A High-Conviction Overweight
Energy Remains A High-Conviction Overweight
While tech stocks have really delivered and led the market advance year-to-date, a bifurcated tech market should remain in place with capex levered S&P software and S&P tech hardware, storage & peripherals indexes (both are high-conviction overweights) outperforming early cyclical tech groups, semi and semi equipment stocks (we remain underweight both semi subindexes). Bottom Line: A playable rotation into financials and industrials is in the offing especially if the selloff in the bond market accelerates on the back of an inflationary whim. We continue to recommend an overweight allocation to both the S&P financials and S&P industrials sectors. ...But Lights Are Out For Utilities Utilities stocks are the ultimate loser from a backup in interest rates as they serve as premier fixed income proxies in the equity space and we are compelled to trim exposure to below benchmark. The niche S&P utilities sector yields 3.5% and when the competing risk free asset is near 3.2% and rising, investors prefer to shed, at the margin, riskier high-yielding equities and park the proceeds in U.S. Treasurys (Chart 10). While arguably most of the bad news is already reflected in washed out technicals and bombed out short and even long-term profit expectations (Chart 11), the selling will only accelerate into yearend and 2019. Chart 10Higher Yields Bite
Higher Yields Bite
Higher Yields Bite
Chart 11Oversold And Unloved...
Oversold And Unloved…
Oversold And Unloved…
Apart from the tight inverse correlation utilities have with interest rates, they are also a defensive sector that outperforms the broad market when the economy is in retreat. Currently a plethora of recent economic releases are signaling that the U.S. economy is overheating. Chart 12 illustrates the safe haven status of utility stocks (ISM surveys shown inverted). On the operating front, despite the upbeat economic data, electricity capacity utilization remains anemic. Capacity growth is likely responsible for this weak resource utilization signal as utilities construction continues unabated (private construction shown inverted, top panel, Chart 13). Adding insult to injury, inventory accumulation is also weighing on the sector (turbine inventories shown inverted, middle panel, Chart 13). Chart 12...But More Pain Looms
…But More Pain Looms
…But More Pain Looms
Chart 13Weak Operating Metrics
Weak Operating Metrics
Weak Operating Metrics
Worrisomely, all these expansion plans have been financed with debt. While this is not typically an issue for stable cash flow generating utilities, the sector's net debt-to-EBITDA profile has gone parabolic, nearly doubling since the GFC and even overtaking the early 2000s when a California deregulation wave first led to exuberance and then an electricity crisis (Chart 14). Any letdown in cash flow growth will be disruptive, especially given that the sector has no valuation cushion (bottom panel, Chart 14). Nevertheless, there are some risks that could put our underweight position offside. Natural gas prices have spiked of late and given that they are the marginal price setter for the sector they could boost utility pricing power and thus profits (top & middle panels, Chart 15). As the U.S. economy is firing on all cylinders, electricity demand should remain brisk and provide an offset to the otherwise weakening utility operating backdrop (bottom panel, Chart 15). Chart 14Heavily Indebted And Pricey
Heavily Indebted And Pricey
Heavily Indebted And Pricey
Chart 15Risks To Underweight View
Risks To Underweight View
Risks To Underweight View
Netting it all out, rising interest rates, a vibrant U.S. economy, softening operating metrics and high indebtedness signal that the time is ripe to sell utility stocks. Bottom Line: Downgrade the S&P utilities sector to underweight. Anastasios Avgeriou, Vice President U.S. Equity Strategy anastasios@bcaresearch.com 1 Please see BCA Geopolitical Strategy Weekly Report, "Fade The Midterms, Not Iraq Or Brexit," dated September 12, 2018, available at gps.bcaresearch.com. 2 Please see BCA U.S. Equity Strategy Weekly Report, "Deflation - Reflation - Inflation," dated August 20, 2018, available at uses.bcaresearch.com. 3 Please see BCA U.S. Equity Strategy Weekly Report, "Soldiering On," dated July 16, 2018, available at uses.bcaresearch.com. 4 Please see BCA U.S. Equity Strategy Weekly Report, "Deflation - Reflation - Inflation," dated August 20, 2018, available at uses.bcaresearch.com. Current Recommendations Current Trades Size And Style Views Favor value over growth Favor large over small caps
Underweight In our previous Insight, we highlighted the S&P REITs index’s tight inverse correlation with UST yields, but it is far from the only group with this trait. The S&P telecom services index (now a subsector within the S&P communication services index, please see our recent Special Report1), with its predictable earnings stream and dividend payout, trades on the same basis. The spike in yields is thus a negative omen for telco stock prices. It is worth noting that the S&P telecom services index has been bucking its inverse correlation with UST yields since hitting their nadir in mid-2017 (second panel). We expect the beaten-up sector to reestablish the correlation, particularly since telecom’s share of the consumer’s wallet is at a decade low with momentum to continue lower. Bottom Line: Stay underweight the telecom services index. The ticker symbols for the stocks in this index are: BLBG: S5TELSX - T, VZ, CTL.
Yields Are Causing Static For Telecoms
Yields Are Causing Static For Telecoms
1 Please see BCA U.S. Equity Strategy Special Report, “New Lines Of Communication” dated October 1, 2018, available at uses.bcaresearch.com.
Underweight The spike in UST yields have been weighing on fixed income-proxy sectors with REITs foremost among them. As noted in the top panel of the chart, excluding the inflating of the property bubble in advance of the GFC, REITs have had a very tight inverse correlation with UST yields; the resulting downward pressure on the S&P REITs index is thus very predictable. Such downward pressure could be overlooked if all was well on an operating basis but this is not the case. Non-residential construction continues to rise (albeit more slowly than last year) in the face of higher borrowing rates (second panel). Further, demand looks slack as occupancy rates clearly crested at the beginning of last year (bottom panel). As well, on the residential front, multi-family housing starts remain elevated which should prove deflationary to rents. Bottom Line: We reiterate our underweight recommendation on the S&P REITs index. The ticker symbols for the stocks in this index are BLBG: S5REITS - IRM, MAA, AMT, BXP, PLD, ESS, CCI, PSA, O, VTR, VNO, WY, EQIX, DLR, EXR, DRE, FRT, WELL, SBAC, HCP, GGP, KIM, EQR, UDR, REG, MAC, HST, SPG, AVB, AIV, SLG, ARE.
FX15 Moving On Out
FX15 Moving On Out
Underweight September was a tough month for the S&P hotels, resorts and cruise lines index. First, Carnival Corp, the largest cruise line operator warned that net revenue yield growth was slowing as prices for next year are flat; their share price (and those of their competitors) fell significantly. Next, the CEO of Marriott warned that the trade war was already having an impact on tourism, with Europe capturing a larger share of Chinese outbound travel. As with cruise lines, these comments weighed heavily on the hotel operators. Our negative thesis is unchanged with respect to cruise lines; we believe volume gains (the source of margin improvements) have peaked and, in the absence of better pricing, margins will suffer in the face of rising costs, particularly fuel (third panel). Further, despite recovering pricing in hotels, the splurging on new construction should mean a return to price competition (bottom panel), particularly if tourism from China is truly retrenching. Overall, we reiterate our underweight recommendation. The ticker symbols for the stocks in this index are: BLBG: S5HOTL - MAR, CCL, RCL, HLT, WYN, NCLH.
Here Be Dragons
Here Be Dragons