Sectors

In lieu of next week’s report, I will host the monthly Counterpoint Webcast on Monday, July 25. Please mark the date in your calendar, and I do hope you can join. Executive Summary Central banks face a ‘Sophie’s choice’. Inflation at 2 percent, or full employment? If they choose inflation at 2 percent, they will have to take the economy into recession. To take the economy into recession, bond yields and energy prices do not need to move any higher. They just need to stay where they are. The stock market has not yet discounted a recession. With stocks and bonds having become equally ‘cheaper’ this year, but stocks now vulnerable to substantial downgrades to their profits, stocks are likely to underperform bonds over the coming 6-12 months. In the event of recession followed by plunging inflation, a valuation uplift for bonds will also underpin stock prices and limit further downside in absolute terms. The biggest loser will be commodities. On a 6-12 month horizon, the optimal asset allocation is: overweight bonds, neutral stocks, underweight commodities. Fractal trading watchlist: Ethereum. The Bear Market Is A Valuation Bear Market. Profits Are Not Discounting A Recession… Yet
Stocks Caught Between Scylla And Charybdis
Stocks Caught Between Scylla And Charybdis
Bottom Line: On a 6-12 month horizon, overweight bonds, neutral stocks, underweight commodities. Feature The Greek mythological sea monsters, Scylla and Charybdis, sat on opposite sides of the narrow Strait of Messina, with one monster likened to a shoal of rocks, the other to a vortex. Avoiding the rocks meant getting too close to the vortex, and avoiding the vortex meant getting too close to the rocks. In today’s stock market, if Scylla is the monster of high bond yields, then Charybdis is the monster of falling profits. Whether the stock market can safely navigate these twin monsters without further damage depends on a sequence of questions. In today’s stock market, if Scylla is the monster of high bond yields, then Charybdis is the monster of falling profits. If the market can escape high bond yields, can it also escape falling profits? The answer to this depends on a second question. Can central banks guide inflation back to 2 percent without taking the economy into recession? The answer to this depends on a third question. Is 2 percent inflation still consistent with full employment? Central Banks Face A ‘Sophie’s Choice’ – Low Inflation, Or Full Employment? In the US, the main transmission mechanism from employment to inflation is through so-called ‘rent of shelter’. Because, to put it bluntly, you need a steady job to pay the rent. And rent comprises 41 percent of the core inflation basket. For the past couple of decades, the Fed could have its cake and eat it: full employment and inflation running close to 2 percent. This was because full employment was consistent with rent of shelter inflation running at 3.5 percent, which itself was consistent with core inflation running at 2 percent. The Fed faces a ‘Sophie’s choice’. Inflation at 2 percent, or full employment? If it chooses inflation at 2 percent, then the Fed will have to take the economy into recession. But recently, there has been a phase-shift between the employment market and rent of shelter inflation. The current state of full employment equates to rent of shelter inflation running not at 3.5 percent, but at 5.5 percent (Chart I-1). Chart I-1Central Banks Face A 'Sophie's Choice' - Low Inflation, Or Full Employment?
Central Banks Face A 'Sophie's Choice' - Low Inflation, Or Full Employment?
Central Banks Face A 'Sophie's Choice' - Low Inflation, Or Full Employment?
Hence, the Fed faces a ‘Sophie’s choice’. Inflation at 2 percent, or full employment? If it chooses inflation at 2 percent, the unemployment rate will have to rise by 2 percent. Meaning, the Fed will have to take the economy into recession. The Economy Tries The ‘Cold Pressor Test’ To take the economy into recession, bond yields and energy prices do not need to move any higher – they just need to stay where they are. This is because the damage from elevated bond yields and energy prices doesn’t come just from their level. It comes from their level multiplied by the length of time that they stay elevated. Try putting your hand in a bucket of ice water. For the first few seconds, or even tens of seconds, you will not feel any discomfort. After a few minutes though, the pain becomes excruciating. This so-called ‘cold pressor test’ tells us that your discomfort results not just from the temperature level of the ice water, but equally from the length of time that you keep your hand in it. Likewise, a short-lived spike in the mortgage rate or in the price of natural gas, or a short-lived collapse in your stock market wealth will not cause any discomfort. But the longer the mortgage rate stays elevated, and more and more people are buying or refinancing a home at a much higher rate, the greater becomes the economic pain. In the same vein, most Europeans will not notice the sky-high prices of natural gas in the summer when the heating is off. But come the cold of October and November, many people will have to choose literally between physical or economic pain. Some commentators counter that the “war chest of savings” accumulated during the pandemic will buffer households against higher mortgage rates and energy prices. We strongly disagree. The savings accumulated during the pandemic just added to, and became indistinguishable from, other wealth. Yet now, in case you hadn’t noticed, wealth has been pummelled. In case you hadn’t noticed, wealth has been pummelled. The impact of wealth on spending is a huge topic which we will expand upon in a future report. In a nutshell, most spending comes from income and income proxies. Wealth generates income, but it also generates an income proxy via capital gain. So, to the extent that wealth can drive spending growth, the biggest contributor comes from the change in capital gain, also known as the ‘wealth impulse’. Unfortunately, the wealth impulse is now in deeply negative territory (Chart I-2). Chart I-2The Wealth Impulse Is In Deeply Negative Territory
The Wealth Impulse Is In Deeply Negative Territory
The Wealth Impulse Is In Deeply Negative Territory
The Stock Market Has Not Yet Discounted A Recession Coming back to the stock market, does the 2022 bear market mean that it has already discounted a recession? No, this year’s bear market is entirely due to a collapse in valuations. Since the start of the year, US profit expectations have held up. If the bear market were front running profit downgrades, then it would be underperforming its valuation component, but it is not. The counterargument is that analysts are notoriously slow to downgrade their profit estimates. Isn’t the bear market the ‘real-time’ stock market ‘front running’ big downgrades to these profit estimates? Again, no. If the market were front running profit downgrades, then it would be underperforming its valuation component, but it is not (Chart I-3). Chart I-3The Bear Market Is A Valuation Bear Market. Profits Are Not Discounting A Recession...Yet
The Bear Market Is A Valuation Bear Market. Profits Are Not Discounting A Recession...Yet
The Bear Market Is A Valuation Bear Market. Profits Are Not Discounting A Recession...Yet
The bear market in the S&P 500 has near-perfectly tracked the bear market in its valuation component, the 30-year T-bond price. The valuation component of the S&P 500 is the 30-year T-bond price because the duration of the S&P 500 equals the duration of the 30-year T-bond. Several clients have asked how to prove that the duration of the S&P 500 equals that of the 30-year T-bond. We can do it either a difficult theoretical way, or an easy empirical way. The difficult theoretical way is to take the projected cashflows, and calculate the weighted average time to those cashflows, where the weights are the discounted values of those cashflows. The much easier empirical way is to show that the S&P 500 tracks its profits multiplied by the 30-year T-bond price more faithfully than if we use a shorter maturity bond, such as the 10-year T-bond (Chart I-4 and Chart I-5) Chart I-4The S&P 500 Tracks Profits Multiplied By The 30-Year T-Bond Price More Faithfully...
The S&P 500 Tracks Profits Multiplied By The 30-Year T-Bond Price More Faithfully...
The S&P 500 Tracks Profits Multiplied By The 30-Year T-Bond Price More Faithfully...
Chart I-5...Than Profits Multiplied By The 10-Year T-Bond Price
...Than Profits Multiplied By The 10-Year T-Bond Price
...Than Profits Multiplied By The 10-Year T-Bond Price
One important upshot is that any valuation comparison of the S&P 500 with a bond other than the 30-year T-bond is a fundamental error of duration mismatch. Most strategists compare the S&P 500 with the 10-year T-bond because it is convenient. But the duration mismatch makes this ‘apples versus oranges’ valuation comparison one of the most common mistakes in finance. Overweight Bonds, Neutral Stocks, Underweight Commodities All of this is important to answer a crucial question about stock market valuations. With the stock market 20 percent down this year when expected profits have held up, it might appear that stocks have become much cheaper. The truth is more nuanced. Relative to expected profits over the next 12 months the US stock market is indeed much cheaper (Chart I-6). The caveat is that these expected profits are vulnerable to substantial downgrades in the event of a recession. Chart I-6The US Stock Market Is Cheaper Versus Expected Profits, But These Profits Are Too Optimistic
The US Stock Market Is Cheaper Versus Expected Profits, But These Profits Are Too Optimistic
The US Stock Market Is Cheaper Versus Expected Profits, But These Profits Are Too Optimistic
Chart I-7The US Stock Market Is Not Cheaper Versus The 30-Year T-Bond
The US Stock Market Is Not Cheaper Versus The 30-Year T-Bond
The US Stock Market Is Not Cheaper Versus The 30-Year T-Bond
But relative to the equal duration 30-year T-bond, the US stock market is not cheaper. Since, the start of the year, the uplift in the stock market’s (forward earnings) yield is precisely the same as the that on the 30-year T-bond yield (Chart I-7). Relative to the equal duration 30-year T-bond, the US stock market has not become cheaper. With stocks and bonds having become equally ‘cheaper’ this year, but stocks now vulnerable to substantial downgrades to their profits, stocks are likely to underperform bonds over the coming 6-12 months. The good news is that a valuation uplift for bonds will also underpin stock prices, and limit further downside in absolute terms. Unfortunately, the same cannot be said for commodities, whose real prices are still close to the upper end of their 40-year trading range (Chart I-8) Chart I-8The Real Price Of Metals Is Still At The Upper End Of Its 40-Year Trading Range
The Real Price Of Metals Is Still At The Upper End Of Its 40-Year Trading Range
The Real Price Of Metals Is Still At The Upper End Of Its 40-Year Trading Range
In the event of recession followed by plunging inflation, the biggest winner will be bonds and the biggest loser will be commodities. Therefore, on a 6-12 horizon, the optimal asset allocation is: Overweight bonds. Neutral stocks. Underweight commodities. Fractal Trading Watchlist This week we are adding Ethereum to our watchlist, as its 130-day fractal structure is approaching the capitulation point that signalled previous major trend reversals in 2018 (a bottom) and 2021 (a top). The full watchlist of 27 investments that are approaching, or at, potential trend reversals is available on our website: cpt.bcaresearch.com Fractal Trading Watchlist: New Additions Chart I-9Fractal Trading Watch List
Fractal Trading Watch List
Fractal Trading Watch List
Chart 1CNY/USD At A Potential Turning Point
CNY/USD At A Potential Turning Point
CNY/USD At A Potential Turning Point
Chart 2US REITS Are Oversold Versus Utilities
US REITS Are Oversold Versus Utilities
US REITS Are Oversold Versus Utilities
Chart 3CAD/SEK Is Vulnerable To Reversal
CAD/SEK Is Vulnerable To Reversal
CAD/SEK Is Vulnerable To Reversal
Chart 4Financials Versus Industrials Has Reversed
Financials Versus Industrials Has Reversed
Financials Versus Industrials Has Reversed
Chart 5The Outperformance Of Resources Versus Biotech Has Ended
The Outperformance Of Resources Versus Biotech Has Ended
The Outperformance Of Resources Versus Biotech Has Ended
Chart 6The Outperformance Of Resources Versus Healthcare Has Ended
The Outperformance Of Resources Versus Healthcare Has Ended
The Outperformance Of Resources Versus Healthcare Has Ended
Chart 7FTSE100 Outperformance Vs. Euro Stoxx 50 Is Vulnerable To Reversal
FTSE100 Outperformance Vs. Euro Stoxx 50 Is Vulnerable To Reversal
FTSE100 Outperformance Vs. Euro Stoxx 50 Is Vulnerable To Reversal
Chart 8Netherlands' Underperformance Vs. Switzerland Is Ending
Netherlands' Underperformance Vs. Switzerland Is Ending
Netherlands' Underperformance Vs. Switzerland Is Ending
Chart 9The Sell-Off In The 30-Year T-Bond At Fractal Fragility
The Sell-Off In The 30-Year T-Bond At Fractal Fragility
The Sell-Off In The 30-Year T-Bond At Fractal Fragility
Chart 10The Sell-Off In The NASDAQ Is Approaching Fractal Fragility
The Sell-Off In The NASDAQ Is Approaching Fractal Fragility
The Sell-Off In The NASDAQ Is Approaching Fractal Fragility
Chart 11Food And Beverage Outperformance Is Exhausted
Food And Beverage Outperformance Is Exhausted
Food And Beverage Outperformance Is Exhausted
Chart 12German Telecom Outperformance Vulnerable To Reversal
German Telecom Outperformance Vulnerable To Reversal
German Telecom Outperformance Vulnerable To Reversal
Chart 13Japanese Telecom Outperformance Vulnerable To Reversal
Japanese Telecom Outperformance Vulnerable To Reversal
Japanese Telecom Outperformance Vulnerable To Reversal
Chart 14ETH Is Approaching A Possible Capitulation
ETH Is Approaching A Possible Capitulation
ETH Is Approaching A Possible Capitulation
Chart 15The Strong Trend In The 18-Month-Out US Interest Rate Future Has Ended
The Strong Trend In The 18-Month-Out US Interest Rate Future Has Ended
The Strong Trend In The 18-Month-Out US Interest Rate Future Has Ended
Chart 16The Strong Downtrend In The 3 Year T-Bond Has Ended
The Strong Downtrend In The 3 Year T-Bond Has Ended
The Strong Downtrend In The 3 Year T-Bond Has Ended
Chart 17A Potential Switching Point From Tobacco Into Cannabis
A Potential Switching Point From Tobacco Into Cannabis
A Potential Switching Point From Tobacco Into Cannabis
Chart 18Biotech Is A Major Buy
Biotech Is A Major Buy
Biotech Is A Major Buy
Chart 19Norway's Outperformance Has Ended
Norway's Outperformance Has Ended
Norway's Outperformance Has Ended
Chart 20Cotton Versus Platinum Has Reversed
Cotton Versus Platinum Has Reversed
Cotton Versus Platinum Has Reversed
Chart 21Switzerland's Outperformance Vs. Germany Has Ended
Switzerland's Outperformance Vs. Germany Has Ended
Switzerland's Outperformance Vs. Germany Has Ended
Chart 22USD/EUR Is Vulnerable To Reversal
USD/EUR Is Vulnerable To Reversal
USD/EUR Is Vulnerable To Reversal
Chart 23The Outperformance Of MSCI Hong Kong Versus China Has Ended
The Outperformance Of MSCI Hong Kong Versus China Has Ended
The Outperformance Of MSCI Hong Kong Versus China Has Ended
Chart 24A Potential New Entry Point Into Petcare
A Potential New Entry Point Into Petcare
A Potential New Entry Point Into Petcare
Chart 25GBP/USD At A Potential Turning Point
GBP/USD At A Potential Turning Point
GBP/USD At A Potential Turning Point
Chart 26US Utilities Outperformance Vulnerable To Reversal
US Utilities Outperformance Vulnerable To Reversal
US Utilities Outperformance Vulnerable To Reversal
Chart 27The Outperformance Of Oil Versus Banks Is Exhausted
The Outperformance Of Oil Versus Banks Is Exhausted
The Outperformance Of Oil Versus Banks Is Exhausted
Dhaval Joshi Chief Strategist dhaval@bcaresearch.com Fractal Trading System Fractal Trades
Stocks Caught Between Scylla And Charybdis
Stocks Caught Between Scylla And Charybdis
Stocks Caught Between Scylla And Charybdis
Stocks Caught Between Scylla And Charybdis
6-12 Month Recommendations Structural Recommendations Closed Fractal Trades Indicators To Watch - Bond Yields Chart II-1Indicators To Watch - Bond Yields - Euro Area
Indicators To Watch - Bond Yields - Euro Area
Indicators To Watch - Bond Yields - Euro Area
Chart II-2Indicators To Watch - Bond Yields - Europe Ex Euro Area
Indicators To Watch - Bond Yields - Europe Ex Euro Area
Indicators To Watch - Bond Yields - Europe Ex Euro Area
Chart II-3Indicators To Watch - Bond Yields - Asia
Indicators To Watch - Bond Yields - Asia
Indicators To Watch - Bond Yields - Asia
Chart II-4Indicators To Watch - Bond Yields - Other Developed
Indicators To Watch - Bond Yields - Other Developed
Indicators To Watch - Bond Yields - Other Developed
Indicators To Watch - Interest Rate Expectations Chart II-5Indicators To Watch - Interest Rate Expectations
Indicators To Watch - Interest Rate Expectations
Indicators To Watch - Interest Rate Expectations
Chart II-6Indicators To Watch - Interest Rate Expectations
Indicators To Watch - Interest Rate Expectations
Indicators To Watch - Interest Rate Expectations
Chart II-7Indicators To Watch - Interest Rate Expectations
Indicators To Watch - Interest Rate Expectations
Indicators To Watch - Interest Rate Expectations
Chart II-8Indicators To Watch - Interest Rate Expectations
Indicators To Watch - Interest Rate Expectations
Indicators To Watch - Interest Rate Expectations
Dear client, In lieu of July 18 publication, I will be hosting our quarterly webcast that I invite you to join. Our regular weekly publication will resume Monday, July 25. Kind Regards, Irene Tunkel Chief Strategist, US Equity Strategy Deploy Fresh Capital Into Growth At The Expense Of Value In early June, we closed our Growth/Value underweight by moving the ratio to benchmark allocation and crystallizing just under 9% in gains. At the time, we also wrote that we would upgrade Growth and downgrade Value once uncertainty about inflation and the Fed’s action recedes. Today, we believe that the time is ripe for making a move: We are upgrading Growth to overweight, and downgrade Value to underweight. The following are the reasons for a change in positioning: Chart 1Deploy Fresh Capital Into Growth At The Expense Of Value
Deploy Fresh Capital Into Growth At The Expense Of Value
Deploy Fresh Capital Into Growth At The Expense Of Value
Inflationary pressures will ease: There are early signs that inflation is about to turn - prices of energy and commodities are down 20% and 13% off their peaks respectively. A turn in inflation heralds a change in market leadership from Value to Quality and Growth (Chart 1). Chart 2
Deploy Fresh Capital Into Growth At The Expense Of Value
Deploy Fresh Capital Into Growth At The Expense Of Value
Economic growth is slowing: The market focus has shifted away from inflation and has turned towards worries about growth as is evident in the falling 10-year Treasury yield, which decreased from its peak at 3.5% to 3.0% over the past couple of weeks. The environment of slowing growth and falling rates is a tailwind for growth stocks. In a world where growth is becoming scarcer, companies that can deliver growth will shine. These are “growth” companies, i.e., large, stable companies with strong balance sheets that are able to generate positive cash flow and churn out strong earnings even under economic duress. Quality growth outperforms during slowdowns (Chart 2). Earnings Growth Expectations: Analysts expect earnings of Value to grow by over 10% over the next twelve months and Growth by 8.0%. While earnings growth expectations for value stocks appear more attractive, we believe that they will be downgraded. Value stocks are dominated by cyclicals (Chart 3), and as we wrote in the Tuesday's publication, this is the area of the market in which analysts have the least certainty in their estimates and downgrades are imminent. Growth is oversold relative to Value: The Growth/Value ratio is extremely oversold sitting at a level exceeded only during the dot-com crash and on par with the 1970-1980 inflationary era (Chart 4). Chart 3
Deploy Fresh Capital Into Growth At The Expense Of Value
Deploy Fresh Capital Into Growth At The Expense Of Value
Chart 4
Deploy Fresh Capital Into Growth At The Expense Of Value
Deploy Fresh Capital Into Growth At The Expense Of Value
Bottom Line: Slowing growth, impending turn in inflation, and attractive technicals are key reasons for our upgrade of Growth to overweight at the expense of Value.
Executive Summary Our recommended model bond portfolio outperformed its custom benchmark index by +24bps in Q2/2022, improving the year-to-date outperformance to a solid +72bps. The Q2 outperformance came entirely from the credit side of the portfolio (+35bps), led by underweights to US investment grade corporates (+28bps) and EM hard currency debt (+24bps). The rates side of the portfolio was down slightly (-11bps), with gains from underweights in US and UK inflation-linked bonds (a combined +24bps) helping offset the hit from overweights to German and French government bonds (a combined -30bps). Looking ahead, we continue to see more defensive positioning in growth-sensitive credit sectors like US investment grade corporate bonds and EM hard currency debt, rather than duration management, as providing the better opportunity to generate alpha in bond portfolios over the latter half of 2022. GFIS Model Bond Portfolio Recommended Positioning For The Next Six Months
GFIS Model Bond Portfolio Q2/2022 Review & Outlook: Winning By Playing Defense
GFIS Model Bond Portfolio Q2/2022 Review & Outlook: Winning By Playing Defense
Bottom Line: In our model bond portfolio, we are maintaining an overall neutral duration stance and a moderate underweight of spread product versus developed market sovereign bonds. We are, however, reducing the recommended tilts in inflation-linked bonds by upgrading US TIPS to neutral and downgrading Canadian linkers to neutral. Feature Dear Client, We are about to take a mid-summer publishing break, as this humble bond strategist moves his family into a new home in a new city. Next week, you will be receiving a report written by BCA Research’s Chief US Bond Strategist, Ryan Swift. The following week, there will be no Global Fixed Income Strategy report published. Our next report will be published on July 26, 2022. Regards, Rob Robis Bond investors are running out of places to hide to avoid losses in 2022. The total return on the Bloomberg Global Aggregate index (hedged into USD) in the second quarter of this year was -4%, nearly matching the -6% loss seen in Q1. No sector, from government bonds to corporate debt to emerging market credit, could avoid the damage caused by hawkish central bankers belated responding to the worst bout of global inflation since the 1970s. Related Report Global Fixed Income StrategyGFIS Model Bond Portfolio Q1/2022 Review & Outlook: Trading The Consolidation Phase Global inflation rates will soon peak, led by slowing growth of goods prices and commodity prices. However, inflation will remain well above central bank targets across the bulk of the developed world, supported by more domestic sources like services prices, housing costs and wages. This will limit the ability for important central banks like the Fed and ECB to quickly pivot in a more dovish direction to support weakening growth – and bail out foundering bond markets. With that backdrop in mind, we present our quarterly review of the BCA Research Global Fixed Income Strategy (GFIS) model bond portfolio for the second quarter of 2022. We also present our recommended positioning for the portfolio for the next six months, as well as portfolio return expectations for our base case and alternative investment scenarios. As a reminder to existing readers (and to new clients), the model portfolio is a part of our service that complements the usual macro analysis of global fixed income markets. The portfolio is how we communicate our opinion on the relative attractiveness between government bond and spread product sectors. We do this by applying actual percentage weightings to each of our recommendations within a fully invested hypothetical bond portfolio. Q2/2022 Model Bond Portfolio Performance: All About Credit Chart 1Q2/2022 Performance: Gains From Defensive Credit Positioning
Q2/2022 Performance: Gains From Defensive Credit Positioning
Q2/2022 Performance: Gains From Defensive Credit Positioning
The total return for the GFIS model portfolio (hedged into US dollars) in the second quarter was -4.3%, outperforming the custom benchmark index by +24bps (Chart 1).1 In terms of the specific breakdown between the government bond and spread product allocations in our model portfolio, the former generated -11bps of underperformance versus our custom benchmark index while the latter outperformed by +35bps. In our previous quarterly portfolio performance review in April, we noted that the greater opportunities to generate outperformance for fixed income investors would come from more defensive allocations to spread product, rather than big directional moves in government bond yields. That forecast largely panned out, as global credit markets moved to price in the growing risk of a deep economic downturn. Declining nominal government bond yields provided some modest relief at the end of June, with markets modestly pricing out some of the rate hikes discounted over the next year amid deepening global recession fears. While we maintained a neutral stance on overall portfolio duration during the quarter, we did benefit from the fact that the decline in global bond yields in late June was concentrated more in lower inflation expectations than falling real yields. Thus, our underweight positioning in inflation-linked bonds, focused on the US and UK, helped add a combined +25bps of outperformance versus the benchmark (Table 1). Table 1GFIS Model Bond Portfolio Q2/2022 Overall Return Attribution
GFIS Model Bond Portfolio Q2/2022 Review & Outlook: Winning By Playing Defense
GFIS Model Bond Portfolio Q2/2022 Review & Outlook: Winning By Playing Defense
The bar charts showing the total and relative returns for each individual government bond market and spread product sector in our model portfolio are presented in Charts 2 & 3. Chart 2GFIS Model Bond Portfolio Q2/2022 Government Bond Performance Attribution
GFIS Model Bond Portfolio Q2/2022 Review & Outlook: Winning By Playing Defense
GFIS Model Bond Portfolio Q2/2022 Review & Outlook: Winning By Playing Defense
Chart 3GFIS Model Bond Portfolio Q2/2022 Spread Product Performance Attribution By Sector
GFIS Model Bond Portfolio Q2/2022 Review & Outlook: Winning By Playing Defense
GFIS Model Bond Portfolio Q2/2022 Review & Outlook: Winning By Playing Defense
Biggest Outperformers: Underweight US investment grade Industrials (+19bps) Underweight UK index-linked Gilts (+15bps) Underweight US TIPS (+9bps) Underweight US investment grade Financials (+7bps) Underweight US MBS (+6bps) Underweight US Treasuries with maturities beyond ten years (+6bps) Biggest Underperformers: Overweight euro area investment grade corporates (-19bps) Overweight German government bonds with maturities beyond ten years (-14bps) Overweight French government bonds with maturities beyond ten years (-8bps) Overweight UK Gilts with maturities beyond ten years (-6bps) Overweight US CMBS (-4bps) Chart 4 presents the ranked benchmark index returns of the individual countries and spread product sectors in the GFIS model bond portfolio for Q2/2022. Returns are hedged into US dollars (we do not take active currency risk in this portfolio) and adjusted to reflect duration differences between each country/sector and the overall custom benchmark index for the model portfolio. We have also color coded the bars in each chart to reflect our recommended investment stance for each market during Q2 (red for underweight, dark green for overweight, gray for neutral). Chart 4Ranking The Winners & Losers From The GFIS Model Bond Portfolio Universe In Q2/2022
GFIS Model Bond Portfolio Q2/2022 Review & Outlook: Winning By Playing Defense
GFIS Model Bond Portfolio Q2/2022 Review & Outlook: Winning By Playing Defense
Ideally, we would look to see more green bars on the left side of the chart where market returns are highest, and more red bars on the right side of the chart were returns are lowest. That pattern largely held true in Q2/2022, especially at the tail ends of the chart. During a quarter where all the major asset classes in our portfolio lost money on a hedged and duration-matched basis, we outperformed by selectively underweighting the worst performers within the credit side of the benchmark portfolio universe. Notably, we were underweight EM USD-denominated Sovereigns (-1099bps), EM USD-denominated corporates (-816bps) and US investment grade corporates (-686bps) on the extreme right side of the chart. Some of our key overweight positions did relatively well, led by overweights in US CMBS (-148bps), Australian government bonds (-288bps) and euro area investment grade corporates (-378bps), all of which were on the left side of Chart 4. One of our key recommendations throughout the first half of 2022 - overweighting German government bonds (-517bps) and French government bonds (-657bps) versus underweighting US Treasuries (-283bps) - performed poorly in Q2. This was due to investors rapidly pricing in a far more aggressive series of ECB rate hikes than we expected, resulting in some convergence of US-European bond yield differentials. Importantly, core European bond yields have pulled back substantially over the last month, and by much more than US yields have declined. Most notably, the 2-year German yield, which began Q2 at minus-7bps and hit a peak of 1.2% on June 14, has now fallen all the way back to 0.4% as this report went to press. The 2-year US-Germany yield differential has already widened by 35bps in the first week of July, suggesting that our overweight core Europe/underweight US allocation is already contributing positively to the model bond portfolio returns for Q3. Bottom Line: Our model bond portfolio outperformed its benchmark index in the second quarter of the year by +24bps – a positive result coming largely from underweight positions in US corporate bonds, EM spread product and inflation-linked bonds in the US and UK. Future Drivers Of Model Bond Portfolio Returns Just as in Q2/2022, the performance of the model bond portfolio in Q3/2022 will be driven more by relative allocations between countries and spread product sectors, rather than big directional moves in bond yields or credit spreads. Overall Duration Exposure Chart 5A More Stable Backdrop For Global Bond Yields
A More Stable Backdrop For Global Bond Yields
A More Stable Backdrop For Global Bond Yields
In terms of portfolio duration, we still see a stronger case for global bond yields to be more rangebound than trending, especially in the US. There has already been a major downward adjustment to global bond yields via lower inflation expectations and reduced rate hike expectations. A GDP-weighted average of major developed market 10-year inflation breakevens has already fallen from an April 2022 peak of 281bps to 216bps (Chart 5). That aggregate breakeven is now back to the levels that began 2022, before the Russian invasion of Ukraine that triggered a surge in global energy prices. We anticipate that additional declines in global inflation expectations – and the associated reductions in central bank rate hike expectations – will be harder to achieve over the latter half of 2022. “Stickier” inflation from services, housing costs and wages will remain strong enough to keep overall inflation rates above central bank targets, even as decelerating goods and commodity price inflation act to slow headline inflation rates. Our Global Duration Indicator, which is comprised of growth indicators like the ZEW expectations index for the US and Europe as well as our own global leading economic indicator, has fallen substantially and is signaling a decline in global bond yield momentum once realized inflation rates peak (Chart 6). Chart 6Our Duration Indicator Calling For Slowing Global Yield Momentum
Our Duration Indicator Calling For Slowing Global Yield Momentum
Our Duration Indicator Calling For Slowing Global Yield Momentum
Chart 7Overall Portfolio Duration: Stay Neutral
Overall Portfolio Duration: Stay Neutral
Overall Portfolio Duration: Stay Neutral
We see that as signaling more of a sideways action in bond yields over the next six months, rather than a big downward move, especially in the US. Thus, we are keeping the duration of the model bond portfolio close to that of the benchmark index (Chart 7). Government Bond Country Allocation We are sticking with our view that, for countries with active central banks (i.e. everyone but Japan), favoring markets where interest rate expectations are above plausible estimates of neutral policy rates should lead to outperformance from country allocation. In Chart 8, we show 10-year bond yields and 2-years-forward 1-month Overnight Index Swap (OIS) rates for the US, euro area, UK, Canada and Australia. The shaded regions in the chart represent estimates of the range of neutral policy rates. In the case of the US, rate expectations and Treasury yields are now below the upper level of the range of neutral fed funds rates estimates, between 2-3%, taken from the latest set of FOMC economic projections. Hence, we are sticking with an underweight stance on US Treasuries with yields offering less protection against the Fed following through on its current guidance and lifting the funds rate into restrictive territory above 3%. In the other countries, rate expectations are above the range of neutral rate estimates, which suggests that bond yields have a bit more protection against hawkish central bank actions. That leads us to stay overweight core Europe, the UK and Australia in the government bond portion of the model bond portfolio. We are only keeping Canada at neutral, however, as we suspect that the Bank of Canada is more willing than other central banks to follow the Fed’s lead on taking rates to a restrictive level to help bring down elevated Canadian inflation. For other countries, we are staying neutral on Italian government bond exposure, for now, and underweight Japan (Chart 9). Chart 8Favor Countries Where Markets Expect Above-Neutral Rates
Favor Countries Where Markets Expect Above-Neutral Rates
Favor Countries Where Markets Expect Above-Neutral Rates
Chart 9Underweight JGBs, Stay Neutral Italy (For Now)
Underweight JGBs, Stay Neutral Italy (For Now)
Underweight JGBs, Stay Neutral Italy (For Now)
For Italy, we await news from the July 21 ECB meeting on the details of a proposal to help support Italian bond markets in the event of additional yield increases or spread widening versus Germany. It is clear from the history of the past decade that Italian bond returns suffer when the ECB is either hiking rates or slowing the growth of its balance sheet (top panel). In other words, it is difficult to recommend overweighting Italian bonds without the support of easy ECB monetary policy. Chart 10Our Inflation-Linked Bond Country Allocations
Our Inflation-Linked Bond Country Allocations
Our Inflation-Linked Bond Country Allocations
For Japan, our recommendation is strictly related to our view on the move in overall global bond yields. The Bank of Japan is bucking the worldwide trend to tighten monetary policy because core Japanese inflation remains weak. This makes Japanese government bonds (JGBs) a good place for bond investors to “hide out” in when global bond yields are rising. Given our view that global bond yield momentum will slow – in line with the signal from our Global Duration Indicator – we do not see a strong cyclical case for overweighting low-yielding JGBs. On inflation-linked bonds, we are maintaining a cautious overall stance, with commodity prices decelerating, realized inflation momentum set to soon peak and central banks signaling more tightening ahead (Chart 10). This week, we are closing out our lone overweight recommendation on inflation-linked bonds in Canada, where we downgrading to neutral (3 out of 5, see the model bond portfolio table on page 24).2 At the same time, we are neutralizing our underweight stance on US TIPS, moving the allocation to neutral. We still see shorter-term TIPS breakevens as having downside from here, but longer-maturity breakevens have already made enough of a downward adjustment, in our view. Global Spread Product Turning to credit markets, we are maintaining our moderately cautious view on the overall allocation to credit versus government bonds. Slowing global growth momentum and tightening global monetary policy is not an environment where credit spreads can narrow, especially for growth-sensitive credit like corporate bonds and high-yield (Chart 11). Having said that – the spread widening seen in US and European corporate bond markets has introduced a better valuation cushion into spreads. Our preferred measure of spread product valuation – the historical percentile ranking of the 12-month breakeven spread – shows that investment grade spreads in the euro area are now in the top quartile (85%) of its history on a risk-adjusted basis (Chart 12). US investment grade spreads are now up into the second quartile (64%), which is a big improvement from the start of 2022 but not as much as seen in Europe. Chart 11Global Monetary Backdrop Turning More Negative For Credit
Global Monetary Backdrop Turning More Negative For Credit
Global Monetary Backdrop Turning More Negative For Credit
Chart 12Corporate Spread Valuations Have Improved In The US & Europe
Corporate Spread Valuations Have Improved In The US & Europe
Corporate Spread Valuations Have Improved In The US & Europe
European credit spreads likely need to be wide as a risk premium against the numerous risks the region is facing right now – slowing growth, an increasingly hawkish ECB, soaring energy prices and the lingering uncertainties stemming from the Ukraine war. However, a lot of bad news is now discounted in European spreads and, as a result, we are maintaining our overweight stance on European investment grade corporates, especially versus US investment grade where we remain underweight. High-yield spreads on both sides of the Atlantic look more attractive on a 12-month breakeven spread basis, but also on a default-adjusted spread basis (Chart 13). Assuming a moderate increase in the high-yield default rates in the US and Europe - consistent with a sharp slowing of economic growth but no deep recession - the current level of high-yield spreads net of expected default losses over the next year is above long-run averages. It is too soon to move to an overweight stance on high-yield, with the Fed and ECB set to tighten more amid ongoing growth uncertainty, but given the improved valuation cushion we see a neutral allocation to junk in both the US and Europe as appropriate in our model portfolio. Chart 13Junk Spreads Offer Value If Recession Can Be Avoided
Junk Spreads Offer Value If Recession Can Be Avoided
Junk Spreads Offer Value If Recession Can Be Avoided
Finally, we remain comfortably underweight emerging market USD-denominated sovereign and corporate debt. The backdrop is poor for emerging market bond returns, given slowing global growth, softening commodity prices, a tightening Fed and a strengthening US dollar (Chart 14). Chart 14Staying Cautious On EM Debt Exposure
Staying Cautious On EM Debt Exposure
Staying Cautious On EM Debt Exposure
Summing It All Up The full list of our recommended portfolio allocations can be seen in Table 2. The portfolio enters the second half of 2022 with the following high-level characteristics: Table 2GFIS Model Bond Portfolio Recommended Positioning For The Next Six Months
GFIS Model Bond Portfolio Q2/2022 Review & Outlook: Winning By Playing Defense
GFIS Model Bond Portfolio Q2/2022 Review & Outlook: Winning By Playing Defense
Chart 15Overall Portfolio Allocation: Underweight Spread Product Vs Governments
GFIS Model Bond Portfolio Q2/2022 Review & Outlook: Winning By Playing Defense
GFIS Model Bond Portfolio Q2/2022 Review & Outlook: Winning By Playing Defense
the overall duration exposure remains at-benchmark (i.e. neutral) the portfolio has an underweight allocation to overall spread products versus government bonds, equal to four percentage points of the portfolio (Chart 15) the tracking error of the portfolio, or its expected volatility in excess of that of the benchmark, is 77bps – below our self-imposed 100bps tracking error limit (Chart 16) the portfolio now has a yield below that of the custom benchmark index, equal to -31bps on a currency-unhedged basis but a more modest “carry gap” of -10bps on a USD-hedged basis given the gains from hedging into USD (Chart 17). Chart 16Overall Portfolio Risk: Moderate
Overall Portfolio Risk: Moderate
Overall Portfolio Risk: Moderate
Chart 17Overall Portfolio Yield: Below-Benchmark
Overall Portfolio Yield: Below-Benchmark
Overall Portfolio Yield: Below-Benchmark
Bottom Line: Looking ahead, our model bond portfolio performance will continue to be driven by the same factors in Q3/2022 as in the previous quarter: the relative performance of US bonds versus European equivalents for both government debt and corporate bonds, and the path for emerging market credit spreads. Portfolio Scenario Analysis For The Next Six Months After making the modest changes to our inflation-linked bond allocations in the US and Canada, which can be seen in the tables on pages 23-24, we now turn to our regularly quarterly scenario analysis to determine the return expectations for the portfolio for the next six months. On the credit side of the portfolio, we use risk-factor-based regression models to forecast future yield changes for global spread product sectors as a function of four major factors - the VIX, oil prices, the US dollar and the fed funds rate (Table 3A). For the government bond side of the portfolio, we avoid using regression models and instead use a yield-beta driven framework, taking forecasts for changes in US Treasury yields and translating those in changes in non-US bond yields by applying a historical yield beta (Table 3B). Table 3AFactor Regressions Used To Estimate Spread Product Yield Changes
GFIS Model Bond Portfolio Q2/2022 Review & Outlook: Winning By Playing Defense
GFIS Model Bond Portfolio Q2/2022 Review & Outlook: Winning By Playing Defense
Table 3BEstimated Government Bond Yield Betas To US Treasuries
GFIS Model Bond Portfolio Q2/2022 Review & Outlook: Winning By Playing Defense
GFIS Model Bond Portfolio Q2/2022 Review & Outlook: Winning By Playing Defense
For our scenario analysis over the next six months, we use a base case scenario plus two alternate “tail risk” scenarios. In the current environment, our scenarios center around the pace of global growth. Base Case (Slow Global Growth) Global growth momentum slows substantially, with firms cutting back on hiring and investing activity due to slowing corporate profit growth. An outright recession is avoided because softening energy prices help ease the drag on real spending power for consumers. China introduces more monetary and fiscal stimulus measures to boost growth. Global inflation peaks and eases on the back of slowing growth of goods prices and commodity prices, but the floor on inflation in the US and other developed markets is higher than central bank inflation targets due to sticky domestic price pressures. The Fed continues to hike at every policy meeting in H2/2022. There is a very mild bear flattening of the US Treasury curve, but with longer-term yields remain broadly unchanged over the full six month scenario period with the Fed not hiking by more than currently discounted. The Brent oil price retreats by -10%, the US dollar modestly appreciates by 2%, the VIX stays close to current levels at 28 and the fed funds rate reaches 3.25% by year-end. Resilient Growth Scenario Consumer spending surprises to the upside in the US and even Europe, as softer momentum of energy prices eases the relentless downward pressure on real incomes. Labor demand remains sold across the developed world, particularly with firms reluctant to do mass layoffs because of a perceived scarcity of quality labor. China enacts more policy stimulus with growth likely to fall below 2022 government targets. The Fed is forced to be more aggressive on rate hikes, given resilient US growth and inflation staying well above the Fed’s 2% target. The US Treasury curve bear-flattens into outright inversion, but with Treasury yields rising across the curve. The Brent oil price rises +20%, the VIX index climbs to 30, the US dollar appreciates by +3% thanks to a more aggressive Fed that lifts the funds rate to 3.75% by year-end. Recession Scenario A toxic combination of contracting corporate profits and negative real income growth drags the major developed economies into outright recession. Global inflation rates slow rapidly from current elevated levels, fueled by a rapid decline in commodity prices, but remain above central bank targets making it hard for the Fed and other major central banks to pivot dovishly to support growth. Chinese policymakers belatedly act to ease monetary and fiscal policy, but not by enough to offset the slow response from developed market policymakers. The Treasury curve moderately bull-steepens, although the absolute decline in nominal Treasury yields is relatively modest as the Fed will not pivot quickly to signaling policy easing with inflation still likely to remain above 2%. The Brent oil price falls -20%, the VIX index soars to 35, the US dollar depreciates by -3% (as lower US rates win out over slowing global growth) and the Fed pushes the funds rate to 2.75% before pausing after September. The excess return scenarios for the model bond portfolio, using the above inputs in our simple quantitative return forecast framework, are shown in Table 4A. The US Treasury yield assumptions are shown in Table 4B. For the more visually inclined, we present charts showing the model inputs and Treasury yield projections in Chart 18 and Chart 19, respectively. Table 4AGFIS Model Bond Portfolio Scenario Analysis For The Next Six Months
GFIS Model Bond Portfolio Q2/2022 Review & Outlook: Winning By Playing Defense
GFIS Model Bond Portfolio Q2/2022 Review & Outlook: Winning By Playing Defense
Table 4BUS Treasury Yield Assumptions For The 6-Month Forward Scenario Analysis
GFIS Model Bond Portfolio Q2/2022 Review & Outlook: Winning By Playing Defense
GFIS Model Bond Portfolio Q2/2022 Review & Outlook: Winning By Playing Defense
Chart 18Risk Factor Assumptions For The Scenario Analysis
Risk Factor Assumptions For The Scenario Analysis
Risk Factor Assumptions For The Scenario Analysis
Chart 19US Treasury Yield Assumptions For The Scenario Analysis
US Treasury Yield Assumptions For The Scenario Analysis
US Treasury Yield Assumptions For The Scenario Analysis
Given our neutral overall duration stance, the return scenarios will be driven by mostly by the credit side of the portfolio. In the recession scenario where Treasury yields decline, there is a modest projected outperformance from the rates side of the portfolio coming through the underweight to low-beta JGBs. In all scenarios, financial market volatility is expected to stay at, or above, current levels as central banks will be unable to ease policy, even in the event of an actual recession, because of lingering high inflation. Thus, the return on the credit side of the model portfolio will be the main driver of performance, delivering a range of excess return outcomes between +47bps and +60bps. Bottom Line: The model bond portfolio should benefit in H2/2022 from the ongoing cautious stance on global spread product, focused on underweights to US investment grade corporates and EM hard currency debt. Robert Robis, CFA Chief Fixed Income Strategist rrobis@bcaresearch.com Footnotes 1 The GFIS model bond portfolio custom benchmark index is the Bloomberg Barclays Global Aggregate Index, but with allocations to global high-yield corporate debt replacing very high-quality spread product (i.e. AA-rated). We believe this to be more indicative of the typical internal benchmark used by global multi-sector fixed income managers. 2 We are also closing out our Canadian breakeven widening trade in our Tactical Overlay portfolio. GFIS Model Bond Portfolio Recommended Positioning Active Duration Contribution: GFIS Recommended Portfolio Vs. Custom Performance Benchmark
GFIS Model Bond Portfolio Q2/2022 Review & Outlook: Winning By Playing Defense
GFIS Model Bond Portfolio Q2/2022 Review & Outlook: Winning By Playing Defense
The GFIS Recommended Portfolio Vs. The Custom Benchmark Index Global Fixed Income - Strategic Recommendations*
GFIS Model Bond Portfolio Q2/2022 Review & Outlook: Winning By Playing Defense
GFIS Model Bond Portfolio Q2/2022 Review & Outlook: Winning By Playing Defense
Executive Summary Buying a home is now more expensive than renting in many parts of the world. In the US and UK, disappearing homebuyers combined with a flood of home-sellers will weigh on home prices over the next 6-12 months. Falling employment and falling house prices risk becoming a self-reinforcing negative feedback loop that turns a mild recession into a severe recession. To stop such a vicious cycle running out of control, policymakers will eventually bring down mortgage rates. For this reason, on a time horizon of 6-12 months, overweight bonds. A collapse in Chinese property development and construction activity will have negative long-term implications for commodities, emerging Asia, and developing countries that produce raw materials. Structurally underweight. On the other hand, stay structurally overweight the China 30-year government bond. Fractal trading watchlist: US Biotech versus Utilities. Buying A Home Is Now More Expensive Than Renting!
Buying A Home Is Now More Expensive Than Renting!
Buying A Home Is Now More Expensive Than Renting!
Bottom Line: The decade-long global housing boom is over. Feature For the first time since 2018, the number of Brits wanting to buy a home is less than the number of Brits wanting to sell their home. The balance of homebuyers versus homes for sale is the main driver of any housing market. When multiple homebuyers are competing for a home for sale, the subsequent bidding war puts upward pressure on house prices. But when, multiple homes for sale are competing for a homebuyer, the subsequent discounting war puts downward pressure on house prices. The balance of homebuyers versus homes for sale is the main driver of any housing market. This makes the number of homebuyers versus homes for sale the best leading indicator of house prices. The recent collapse of this leading indicator in the UK warns that UK house prices are likely to soften through the remainder of 2022 and into 2023 (Chart I-1). Chart I-1With Fewer UK Homebuyers Than UK Home-Sellers, UK House Prices Are Set To Drop
With Fewer UK Homebuyers Than UK Home-Sellers, UK House Prices Are Set To Drop
With Fewer UK Homebuyers Than UK Home-Sellers, UK House Prices Are Set To Drop
Homebuyers Are Disappearing While Home-Sellers Are Flooding The Market Disappearing homebuyers combined with a flood of home-sellers is also evident in the US. According to Realtor.com: “Weary US homebuyers face not only sky-high home prices but also rising mortgage rates, and that financial double whammy is hitting homebuyers hard: Compared with just a year ago, the cost of financing 80 percent of a typical home rose 57.6 percent, amounting to an extra $745 per month.” Compared with just a year ago, the cost of financing 80 percent of a typical US home rose 57.6 percent, amounting to an extra $745 per month. Unsurprisingly, US mortgage applications for home purchase have recently plunged by a third (Chart I-2) and homebuyer demand has declined by 16 percent since last June.1 Meanwhile, the inventory of homes actively for sale on a typical day in June has increased by 19 percent, the largest increase in the data history. Chart I-2With The Cost Of Financing A US Home Purchase Surging, Mortgage Applications Have Collapsed
With The Cost Of Financing A US Home Purchase Surging, Mortgage Applications Have Collapsed
With The Cost Of Financing A US Home Purchase Surging, Mortgage Applications Have Collapsed
The flood of new homes on the market means that the dwindling pool of homebuyers will have more negotiating leverage on the asking price (Chart I-3 and Chart I-4). This will balance the highly lopsided negotiating dynamics in the raging seller’s market of the past two years. The shape of things to come can be seen in Austin, Texas, which was one of the hottest markets during the early pandemic real estate frenzy. Chart I-3US Homebuyers Are Disappearing...
US Homebuyers Are Disappearing...
US Homebuyers Are Disappearing...
Chart I-4...While US Home-Sellers Are Flooding The Market
...While US Home-Sellers Are Flooding The Market
...While US Home-Sellers Are Flooding The Market
“Prices are definitely starting to go down again… last Friday, an Austin home was listed at $825,000. The next day, at the open house, no one came. A few months ago, there would have been 20 or more buyers showing up. The sellers didn’t want to test the market, so on Sunday, they dropped it to $790,000. It sold for $760,000.” Buying A Home Is Now More Expensive Than Renting The nub of the problem for homebuyers is that the mortgage rate is higher than the rental yield. In simple terms, buying a home is now more expensive than renting (Chart I-5). The housing bulls counter that the high mortgage rate will force rental yields to adjust upwards by rents going up, but this argument is flawed. Chart I-5Buying A Home Is Now More Expensive Than Renting!
Buying A Home Is Now More Expensive Than Renting!
Buying A Home Is Now More Expensive Than Renting!
The most important driver of rent inflation is the unemployment rate (inversely). Because, to put it bluntly, you need a steady job to pay the rent! Today, the Federal Reserve’s inflation problem, in a nutshell, is that rent inflation is too high even versus the tight jobs market (Chart I-6). Chart I-6The Fed Needs To Push Up Unemployment To Pull Down Rent Inflation
The Fed Needs To Push Up Unemployment To Pull Down Rent Inflation
The Fed Needs To Push Up Unemployment To Pull Down Rent Inflation
Although the Fed cannot say this explicitly, its mechanism to bring down inflation is to push up unemployment, and thereby to pull down rent inflation, which constitutes almost half of the core inflation basket. In this case, the rental yield (rent divided by house price) would adjust upwards by the denominator – house prices – going down. The most important driver of rent inflation is the unemployment rate (inversely). Yet the housing bulls also argue that the housing boom is the result of a structural undersupply of homes. They claim that as this structural undersupply persists, it will underpin house prices. But this ‘housing shortage’ narrative is another myth, which we can debunk with two simple observations. Through the past decade, home prices have risen simultaneously and exponentially everywhere in the world. Now ask yourself, is it plausible that there could be a structural undersupply of homes everywhere in the world at the precisely the same time? If this doesn’t debunk the housing shortage narrative, then try this second observation. Through the past decade, gross rents have tracked nominal GDP. Theory says that gross rents should track nominal GDP, because the quality of the housing stock improves broadly in line with GDP, and therefore so too should rents. If there really was a structural undersupply of housing, then gross rents would be structurally outperforming nominal GDP. But that hasn’t happened in any major economy (Chart I-7). Chart I-7Rents Have Tracked GDP, So There Is No 'Structural Undersupply' Of Homes
Rents Have Tracked GDP, So There Is No 'Structural Undersupply' Of Homes
Rents Have Tracked GDP, So There Is No 'Structural Undersupply' Of Homes
As an aside, if rents track GDP, then why do they constitute almost half of the core inflation basket? The answer is that the rents included in inflation are ‘hedonically adjusted’, meaning that are supposedly deflated for quality improvements – though there is always a niggling doubt whether the statisticians do this adjustment correctly! Pulling all of this together, the synchronized global housing boom of the past decade was not the result of a structural undersupply. Instead, it was the result of a valuation boom – meaning, plummeting rental yields, which in turn were the result of plummeting mortgage rates, which in turn were the result of plummeting bond yields. But now that mortgage rates are much higher than rental yields, this ‘virtuous’ cycle risks turning vicious. Falling employment and falling house prices risk becoming a self-reinforcing negative feedback loop that turns a mild recession into a severe recession. To stop such a vicious cycle running out of control, policymakers will eventually have no other choice than to bring down mortgage rates. For this reason, on a time horizon of 6-12 months, overweight bonds. But The Prize For The Biggest Housing Boom Goes To… China The housing booms in the UK, US and other Western economies, extreme as they are, are small fry compared to the housing boom in China. Chinese real estate, now worth $100 trillion, is by far the largest asset-class in the world. And Chinese rental yields, at around 1 percent, are well below the yield on cash. Begging the question, how can Chinese real estate valuations be in such stratospheric territory, with a yield even less than that on ‘risk-free’ cash? The simple answer is that investors have been led to believe that Chinese real estate is a risk-free investment! Without a social safety net and with limited places to park their money, Chinese savers have for years been encouraged to buy homes, in the widespread belief that property is the safest investment, whose price is only supposed to go up (Chart I-8). Chart I-8Chinese Real Estate Is Perceived To Be A 'Risk Free' Investment
Chinese Real Estate Is Perceived To Be A 'Risk Free' Investment
Chinese Real Estate Is Perceived To Be A 'Risk Free' Investment
With the bulk of Chinese households’ wealth in property acting as a perceived economic safety net, even a 10 percent decline in house prices would constitute a major shock to the household sector’s hopes and expectations of what property is. In turn, the ensuing ‘negative wealth effect’ would be catastrophic for household spending in the world’s second largest economy. Therefore, in contrast to the US housing debacle in 2008, the Chinese government will ensure that its property market adjustment does not come from a collapse in home prices. Rather, it will come from a collapse in property development and construction activity, combined with keeping interest rates structurally low. This will have negative long-term implications for commodities, emerging Asia, and developing countries that produce raw materials. Structurally underweight. On the other hand, Chinese bonds are an excellent investment for those investors who can accept the capital control risks. Stay structurally overweight the China 30-year government bond. Fractal Trading Watchlist Biotech and Utilities are both defensive sectors, based on the insensitivity of theirs profits to economic fluctuations. But whereas Biotech is ‘long duration’, Utilities is ‘shorter duration’. Over the coming months, as the economy falters and bond yields back down, long duration defensives, such as Biotech, are likely to be the winners. This is supported by the recent underperformance reaching the point of fractal fragility that has indicated previous major turning points (Chart I-9). The recommended trade is long US Biotech versus Utilities, setting a profit target and symmetrical stop-loss at 20 percent. This replaces our long US Biotech versus Tech position, which achieved its 17.5 percent profit target, and is now closed. Chart I-9Biotech Is Set To Be A Big Winner
Biotech Is Set To Be A Big Winner
Biotech Is Set To Be A Big Winner
Chart 1CNY/USD Has Reversed
CNY/USD Has Reversed
CNY/USD Has Reversed
Chart 2US REITS Are Oversold Versus Utilities
US REITS Are Oversold Versus Utilities
US REITS Are Oversold Versus Utilities
Chart 3CAD/SEK Reversal Has Started
CAD/SEK Reversal Has Started
CAD/SEK Reversal Has Started
Chart 4Financials Versus Industrials To Reverse
Financials Versus Industrials To Reverse
Financials Versus Industrials To Reverse
Chart 5The Outperformance Of Resources Versus Biotech Has Started To Reverse
The Outperformance Of Resources Versus Biotech Has Started To Reverse
The Outperformance Of Resources Versus Biotech Has Started To Reverse
Chart 6The Outperformance Of Resources Versus Healthcare Is Vulnerable To Reversal
The Outperformance Of Resources Versus Healthcare Is Vulnerable To Reversal
The Outperformance Of Resources Versus Healthcare Is Vulnerable To Reversal
Chart 7FTSE100 Outperformance Vs. Euro Stoxx 50 Is Reversing
FTSE100 Outperformance Vs. Euro Stoxx 50 Is Reversing
FTSE100 Outperformance Vs. Euro Stoxx 50 Is Reversing
Chart 8Netherlands Underperformance Vs. Switzerland Has Been Exhausted
Netherlands Underperformance Vs. Switzerland Has Been Exhausted
Netherlands Underperformance Vs. Switzerland Has Been Exhausted
Chart 9The Sell-Off In The 30-Year T-Bond Is Approaching Fractal Fragility
The Sell-Off In The 30-Year T-Bond Is Approaching Fractal Fragility
The Sell-Off In The 30-Year T-Bond Is Approaching Fractal Fragility
Chart 10The Sell-Off In The NASDAQ Is Approaching Fractal Fragility
The Sell-Off In The NASDAQ Is Approaching Fractal Fragility
The Sell-Off In The NASDAQ Is Approaching Fractal Fragility
Chart 11Food And Beverage Outperformance Has Been Exhausted
Food And Beverage Outperformance Has Been Exhausted
Food And Beverage Outperformance Has Been Exhausted
Chart 12AT REVERSAL
AT REVERSAL
AT REVERSAL
Chart 13AT REVERSAL
AT REVERSAL
AT REVERSAL
Chart 14The Strong Trend In The 18-Month-Out US Interest Rate Future Is Fragile
The Strong Trend In The 18-Month-Out US Interest Rate Future Is Fragile
The Strong Trend In The 18-Month-Out US Interest Rate Future Is Fragile
Chart 15The Strong Trend In The 3 Year T-Bond Is Fragile
The Strong Trend In The 3 Year T-Bond Is Fragile
The Strong Trend In The 3 Year T-Bond Is Fragile
Chart 16A Potential Switching Point From Tobacco Into Cannabis
A Potential Switching Point From Tobacco Into Cannabis
A Potential Switching Point From Tobacco Into Cannabis
Chart 17Biotech Is A Major Buy
Biotech Is A Major Buy
Biotech Is A Major Buy
Chart 18Norway's Outperformance Could End
Norway's Outperformance Could End
Norway's Outperformance Could End
Chart 19Cotton's Outperformance Is Vulnerable To Reversal
Cotton's Outperformance Is Vulnerable To Reversal
Cotton's Outperformance Is Vulnerable To Reversal
Chart 20Fractal Trading Watch List
Fractal Trading Watch List
Fractal Trading Watch List
Chart 21The Rally In USD/EUR Could End
The Rally In USD/EUR Could End
The Rally In USD/EUR Could End
Chart 22The Outperformance Of MSCI Hong Kong Versus China Is Vulnerable To Reversal
The Outperformance Of MSCI Hong Kong Versus China Is Vulnerable To Reversal
The Outperformance Of MSCI Hong Kong Versus China Is Vulnerable To Reversal
Chart 23A Potential New Entry Point Into Petcare
A Potential New Entry Point Into Petcare
A Potential New Entry Point Into Petcare
Chart 24GBP/USD At A Turning Point
GBP/USD At A Turning Point
GBP/USD At A Turning Point
Chart 25Fractal Trading Watch List
Fractal Trading Watch List
Fractal Trading Watch List
Chart 26Fractal Trading Watch List
Fractal Trading Watch List
Fractal Trading Watch List
Dhaval Joshi Chief Strategist dhaval@bcaresearch.com Footnotes 1 Realtor.com gauge homebuyer demand by so-called ‘pending listings’, the number of listings that are at various stages of the selling process that are not yet sold. Fractal Trading System Fractal Trades
The Global Housing Boom Is Over, As Buying Becomes More Expensive Than Renting
The Global Housing Boom Is Over, As Buying Becomes More Expensive Than Renting
The Global Housing Boom Is Over, As Buying Becomes More Expensive Than Renting
The Global Housing Boom Is Over, As Buying Becomes More Expensive Than Renting
6-12 Month Recommendations Structural Recommendations Closed Fractal Trades Indicators To Watch - Bond Yields Chart II-1Indicators To Watch - Bond Yields - Euro Area
Indicators To Watch - Bond Yields - Euro Area
Indicators To Watch - Bond Yields - Euro Area
Chart II-2Indicators To Watch - Bond Yields - Europe Ex Euro Area
Indicators To Watch - Bond Yields - Europe Ex Euro Area
Indicators To Watch - Bond Yields - Europe Ex Euro Area
Chart II-3Indicators To Watch - Bond Yields - Asia
Indicators To Watch - Bond Yields - Asia
Indicators To Watch - Bond Yields - Asia
Chart II-4Indicators To Watch - Bond Yields - Other Developed
Indicators To Watch - Bond Yields - Other Developed
Indicators To Watch - Bond Yields - Other Developed
Indicators To Watch - Interest Rate Expectations Chart II-5Indicators To Watch - Interest Rate Expectations
Indicators To Watch - Interest Rate Expectations
Indicators To Watch - Interest Rate Expectations
Chart II-6Indicators To Watch - Interest Rate Expectations
Indicators To Watch - Interest Rate Expectations
Indicators To Watch - Interest Rate Expectations
Chart II-7Indicators To Watch - Interest Rate Expectations
Indicators To Watch - Interest Rate Expectations
Indicators To Watch - Interest Rate Expectations
Chart II-8Indicators To Watch - Interest Rate Expectations
Indicators To Watch - Interest Rate Expectations
Indicators To Watch - Interest Rate Expectations
Executive Summary Rebounding Chinese Auto Sales
Chinese Infrastructure Investment Growth: A Slowdown Ahead
Chinese Infrastructure Investment Growth: A Slowdown Ahead
China’s stimulus for auto purchases and an easing global auto chip shortage will lead to about a 10% recovery in domestic auto sales in 2022H2 from a year ago. Next year, we expect Chinese auto sales to grow only modestly (under 5%). The share of new energy vehicles (NEVs) in auto sales is rising rapidly in China, crowding out internal combustion engine vehicles (ICEVs) at a fast rate. China is becoming more competitive in global auto manufacturing given its edge in NEV battery technologies and autonomous driving. Production of NEVs and the installation of NEV charging poles will expand rapidly. Yet, given the still-high valuation of these stocks, we will look to buy into these sectors at a better price entry point. Bottom Line: Chinese onshore and offshore automobile stock prices have risen sharply in the past couple of months on the expectation of improving car sales. Our bias is that the rally has been too fast and gone too far. Investors should wait for a pullback before they buy. Feature Chinese total auto sales contracted by 12% year on year in the first five months of this year due to a deep 24% contraction in non-NEV sales. In stark contrast, Chinese NEV sales have more than doubled during the same period. However, the 1-million-unit increase in NEV sales failed to counteract the 2.4-million-unit loss in non-NEV demand. This raises two questions. Why have NEV sales skyrocketed at a time when non-NEV sales have tanked? Will Chinese auto sales recover in 2022H2 and 2023? If so, then how strongly will the recovery be? The answer to the first question lies in a major auto chip allocation strategy that many Chinese auto producers adopted last year. Under limited semiconductor supplies, auto producers in China prioritized the use of chips in their production of NEV models – which have higher profit margins –over traditional vehicles. The greater availability of NEVs than ICEVs has meant an increase in sales of the former and a deep contraction in the latter in 2022H1. Chart 1Chinese Auto Sales: A Recovery Ahead?
Chinese Auto Sales: A Recovery Ahead?
Chinese Auto Sales: A Recovery Ahead?
For the second question, we believe that China’s stimulus package to boost auto sales and an easing global auto chip shortage will lead to about a 10% recovery in auto sales in 2022H2 from a year ago. On the other hand, growth in 2023 will be very modest (under 5%). Accordingly, the daily data of Chinese retail auto sales have already shown a strong rebound in the total sales of NEVs and ICEVs in the last three weeks of June (Chart 1). Auto Sales In China: A Gradual Recovery China’s auto sales are set to have a gradual recovery in 2022H2. We expect auto sales to reach 26.2-26.8 million units by the end of this year, with NEV and non-NEVs rising to 5-5.3 million units and 21.2-21.5 million units, respectively1 (Chart 2). The reasons for our positive estimates include policy stimulus, improving technological advancement of NEVs, as well as an easing in the global auto chip shortage. First, the government has issued a flurry of policies since late May attempting to boost domestic auto demand. As Chart 1 shows, these policies have proved effective, at least for now. In previous episodes of stimulus aimed at boosting auto sales in 2009-2010, 2016-2017, and 2019-2021, authorities had implemented similar supportive measures. While the stimulus worked well in the first two episodes, it was not effective in 2019-2021 (Chart 3). Chart 2Auto Demand In China: A Gradual And Moderate Rebound
Auto Demand In China: A Gradual And Moderate Rebound
Auto Demand In China: A Gradual And Moderate Rebound
Chart 3Policy Stimulus Will Help Lift Chinese Auto Demand
Policy Stimulus Will Help Lift Chinese Auto Demand
Policy Stimulus Will Help Lift Chinese Auto Demand
Box 1 shows our summary of those auto stimulus and a comparison of these episodes. Of all these policies, we believe that a sales tax reduction2 on certain vehicles has proved to be the most effective policy as it directly reduced the prices of these vehicles. In 2022H2, this policy will mainly benefit ICEVs sales as NEVs will continue to enjoy a full exemption from the 10% vehicle purchase tax. The government is also considering an extension of the exemption for NEVs to the end of next year. Box 1China’s Stimulus Package For The Domestic Auto Industry
The Chinese Auto Market: On A Path To Recovery
The Chinese Auto Market: On A Path To Recovery
This year’s stimulus is more comparable to the 2009 and 2016 episodes as they share the same reduction in the sales tax rate from 10% to 5%. The main difference is that this time the policy targets cars with 2-liter engines or smaller, while back in 2009 and 2016 this policy only applied to vehicles with capacity no bigger than 1.6-liters. This means a larger range of vehicles will benefit from the reduction. In short, the current policy will allow an additional 23% share of total vehicles sold to benefit from the stimulus. Please note that for the period of 2019-2021 there was no sales tax reduction. This may be one of the reasons for the lack of recovery in vehicle sales in this episode; Chinese auto sales contracted in both 2019 and 2020. Second, Chinese NEVs buyers have been enjoying government subsidies, albeit on a sliding scale since 2019. The amount of subsidy has been dropping by 10%, 20% and 30% in 2020, 2021 and 2022, respectively (Table 1). We expect NEV sales to rise as the subsidy is set to expire by the end of this year. This may induce some buyers to buy NEVs before the subsidy ends. Table 1Government Subsidy For NEV Purchase in China
The Chinese Auto Market: On A Path To Recovery
The Chinese Auto Market: On A Path To Recovery
Chart 4NEVs Become More Appealing To Chinese Consumers
NEVs Become More Appealing To Chinese Consumers
NEVs Become More Appealing To Chinese Consumers
In addition, NEVs are becoming increasingly appealing for auto buyers. This is due to longer travel mileage per battery charge, constant improvement in NEV related technologies, and an expanded charging/battery swap framework (Chart 4). Further, in comparison to traditional ICEVs, NEVs have become increasingly more equipped with functions such as autonomous driving, intelligent interconnection, and other software application-based services. NEVs will also become more integrated with intelligent and interactive networks. All these features will make NEVs more attractive to automobile buyers as well. According to the McKinsey China Auto Consumer Insights 2021 report, Chinese consumers are more interested than ever in smart vehicle technologies, and they are willing to pay a premium for innovative features. 80% of consumers report that autonomous driving will be a key factor in their decision-making when they buy their next car. Meanwhile, 69% of consumers consider that over-the-air update technology (OTA) is an important feature, and 62% of those are willing to pay for it. Chart 5NEV Sales In China Are Not Very Sensitive To Gasoline Prices
NEV Sales In China Are Not Very Sensitive To Gasoline Prices
NEV Sales In China Are Not Very Sensitive To Gasoline Prices
Rising oil and gasoline prices have also encouraged NEV sales in the past six-to-nine months. But we believe high fuel prices are relatively less important factors to NEV demand in China than in the US and EU. For example, in 2020H2, when oil prices were only around US$40-50 and domestic gasoline price were low, Chinese NEV sales still rose strongly during the same period (Chart 5). Third, the deep contraction in non-NEV sales in China in 2021 was partially caused by the global auto chip shortage. Global semiconductor chip shortages are likely to continue easing in 2022H2 as demand-supply gaps decrease across most components. Demand for consumer electronics is set to contract in the US and the EU in the next six-to-nine months. Hence, some capacity for PC and smartphone chips could be used to produce auto chips in the months ahead. Bottom Line: Government initiatives to boost auto sales, improving technological advancement of NEVs, and an easing of the global auto chip shortage will lift Chinese auto sales to some extent. Structural Auto Demand: A New Normal? Auto sales peaked in 2017 and are since down by 13%. Even if auto sales registered a modest recovery as we expect in 2022 and 2023, they will still be about 6% below their 2017 peak. The reasons why we do not expect a brisk auto sales recovery are as follows: Household (HH) income growth is very weak and the unemployment rate has been rising (Chart 6). HHs have considerable debt (Chart 7). With house prices not rising, and potentially deflating, HH willingness to take on more debt has declined. Chart 6Falling HH Income Growth And Rising Unemployment
Falling HH Income Growth And Rising Unemployment
Falling HH Income Growth And Rising Unemployment
Chart 7HH Debt Burden Is Already High
HH Debt Burden Is Already High
HH Debt Burden Is Already High
Wage/income growth has downshifted and narrowed its gap with interest rates on consumer loans. The cost HH debt has therefore risen relative to their income growth, making consumers less willing to take on more debt. Reflecting downbeat consumer sentiment, the HH marginal propensity to consume has fallen to very low levels and has not shown signs of improvement (Chart 8). With the mediocre structural auto demand outlook in China, NEV sales will rapidly gain market share from non-NEVs (Chart 9). NEVs currently account for about 18% of total auto sales in China, still much lower than the country’s goal of 40% in 2030. Chart 8HH Willingness To Spend Is Low Chinese Consumers: Falling Willingness To Consume
HH Willingness To Spend Is Low Chinese Consumers: Falling Willingness To Consume
HH Willingness To Spend Is Low Chinese Consumers: Falling Willingness To Consume
Chart 9Accelerating NEV Penetration In China
Accelerating NEV Penetration In China
Accelerating NEV Penetration In China
Last week the EU passed a plan of a 2035 phase-out of new fossil fuel car sales. This is also a trend for China. Chinese auto makers such as Changan, BAIC Motor and Haima have already announced that they will stop ICEV production in 2025. Chart 10Decelerating Growth In Chinese Oil Demand
Decelerating Growth In Chinese Oil Demand
Decelerating Growth In Chinese Oil Demand
Declining ICEV sales will lead to lower growth of these vehicles on the road (Chart 10). Consequently, gasoline and diesel demand growth from passenger and commercial autos will be decelerating in China in the coming years. Bottom Line: Passenger car demand in China will be settled in low single digit growth rates. The market share of NEVs will rise very fast at the expense of ICEVs. In turn, falling ICEV sales will result in slower growth in domestic petroleum demand. China: Increasing Competitiveness Chart 11Increasing Competitiveness Of Chinese Auto Manufacturers
Increasing Competitiveness Of Chinese Auto Manufacturers
Increasing Competitiveness Of Chinese Auto Manufacturers
China has become increasingly competitive in global auto manufacturing. This is a strong tailwind for the country’s auto exports. In fact, the country’s net exports of autos have been rising (Chart 11). China is the world’s largest auto producer and consumer, accounting for 32.5% and 32% of global auto production and sales, respectively. The country is also the world’s largest NEV producer. Chart 12China: The World’s Leading And Largest EV Battery Producer
The Chinese Auto Market: On A Path To Recovery
The Chinese Auto Market: On A Path To Recovery
The battery is the most important component of an NEV, and its technological progress holds the key to the speed of NEV penetration. China is the world leader in this battery technology. China’s CATL is currently the world's largest battery manufacturer, with a market share of 32.5%. CATL ranked first in the world for five consecutive years from 2017 to 2021. In addition, four out of the top ten global EV battery players are Chinese companies, with a total market share of 44%, up from 41% last year (Chart 12). Moreover, in late June, CATL launched its cell-to-pack (CTP 3.0) battery. With a record-breaking volume utilization efficiency of 72% and an energy density of up to 255 Wh/kg, it achieves the highest integration level worldwide so far, capable of delivering a range of over 1,000 km on a single charge. The CTP 3.0 batteries are expected to be mass produced and come onto the market in 2023. The development of charging/battery-swapping infrastructure will continue to be faster in China than in other countries/regions due to the country’s competitive advantage in NEV production, including batteries, as well as related policy support. For example, the number of total public & private charging poles rose at a compound annual growth rate of 50% in the past five years. This allows China to collect more NEV charging-related data, which could be used to improve the country’s NEV manufacturing process, charging pole production, and the country’s charging infrastructure development. This will help reduce the charging anxiety of Chinese NEV users. In terms of autonomous driving, five Chinese companies have been included in the world’s 10 best autonomous driving companies based on their technological edge, according to the global autonomous driving report released by the California Department of Motor Vehicles (DMV). In addition to test drives in the US, major Chinese NEV makers have also carried out test drives in China with long distances and more complicated driving conditions. For example, as of mid-March, Baidu Apollo’s autonomous driving has already exceeded 25 million kilometers. In comparison, the total test distance of autonomous driving of all autonomous driving test cars in California were only 6.4 million kilometers. Chart 13China: Faster NEV Penetration Versus Other Countries
The Chinese Auto Market: On A Path To Recovery
The Chinese Auto Market: On A Path To Recovery
At 13.4%, the share of NEVs in total auto sales in China was high last year compared with other countries (Chart 13). The ratio has already risen to 21% in the first five months of this year. Bottom Line: China will become more competitive in global auto manufacturing given its edge in NEV battery technologies and autonomous driving. Investment Implications Chinese onshore and offshore automobile stock prices have risen sharply in the past couple of months, expecting improving car sales in the short-to-medium term (Chart 14). Our bias is that the rally has been too fast and gone too far. Investors should wait for a pullback before they buy. A shakeout in broader Chinese offshore and onshore stocks is likely due to the following (Chart 15): Chart 14Chinese Automobile Stock Prices: A Lot Of Good News Already Priced In...
Chinese Automobile Stock Prices: A Lot Of Good News Already Priced In...
Chinese Automobile Stock Prices: A Lot Of Good News Already Priced In...
Chart 15...A Pullback Is Due
...A Pullback Is Due
...A Pullback Is Due
Chart 16Look To Buy Chinese NEV-related Stocks
Look To Buy Chinese NEV-related Stocks
Look To Buy Chinese NEV-related Stocks
China’s economy is still facing downward pressure due to a faltering property market, sluggish household income growth and consumption, falling export demand, as well as heightened risks of further COVID-induced lockdowns. Global equities have probably not completed their downtrend. It will be hard for Chinese stocks to continue rallying if global share prices continue to fall. That said, we have a bullish bias towards Chinese NEV producers. China’s NEV sector enjoys tailwinds from structurally strong demand and its technological edge, especially in batteries. Hence, we will look to buy Chinese NEV and battery stocks at a better price entry point (Chart 16). Ellen JingYuan He Associate Vice President ellenj@bcaresearch.com Footnotes 1 China Association of Automobile Manufacturers (CAAM) predicted Chinese auto sales to rise to 27.5 million units for the full year. We are a little bit less optimistic on that front. 2 The State Council of China is enacting 60-billion-yuan (US$9 billion) worth of tax cuts between June and December. The purchase tax on certain passenger vehicles will be reduced by half to 5% of the sticker price. The tax cuts target cars with 2-liter engines or smaller, priced at 300,000 yuan (US$ 44,800) or less. Strategic Themes Cyclical Recommendations
Executive Summary Analysts Have Little Confidence In Their Forecasts
Analysts Have Little Confidence In Their Forecasts
Analysts Have Little Confidence In Their Forecasts
In the front section of the sector chart pack, we conduct cross-sectional comparisons. Profitability: Earnings expectations for the cyclical sectors are too high and will come down since analysts have little confidence in their forecasts. But despite their bullishness, analysts also expect margins of the most cyclical sectors to contract over the next 12 months. Balance sheet quality: Post-pandemic demand has resulted in a free cash flow windfall for companies in multiple sectors, which they used to repair their balance sheets. Tech, Materials, and Financials have improved the most. Valuations and technicals: Cyclical sectors appear inexpensive (both in absolute terms and relative to history) because multiples have contracted. Technicals signal that the market is oversold. Much of the bad news is priced in, but “new” bad news is likely on the way: We are still in the early stages of the monetary tightening cycle, there is talk about earnings and economic recessions, rates have not stabilized yet, and inflation has not peaked. Bottom Line: We continue to recommend that investors remain patient and pad the more defensive and quality allocations in their portfolios at the expense of cyclical sectors that are geared to a slowdown. Companies with strong and resilient earnings and quality balance sheets will be able to better weather the storm, if it arrives. This week we are sending you a Sector Chart Pack, which offers macro, fundamentals, valuations, technicals, and uses of cash charts for each sector. In the front section of this publication, we will focus on cross-sectional comparisons. As investors are starting to shift their attention away from worries about intransigent inflation toward concerns about slowing growth, they will seek out companies and sectors that offer the strongest and most resilient earnings growth, pristine balance sheets, and strong cash yield. In other words, companies that have the highest chance of surviving the downturn unscathed and of outperforming the market. Performance vs. Our Portfolio Positioning Chart 1Looking Under The Hood...
Taking Stock Of Sectors And Industry Groups
Taking Stock Of Sectors And Industry Groups
The S&P 500 is down roughly 20% off its January 2022 peak. However, 11 industry groups have performed even worse, with Automobiles and Components down as much as 39% off peak. The rest of this inglorious list is dominated by Consumer Cyclicals, Technology, and Financials (Chart 1). We were foreseeing headwinds, and have preempted some of the damage by shifting our portfolio positioning away from the most cyclical areas of the market: We underweighted Semiconductors back in January, observing that Semis are both highly economically sensitive and “growthy” and will be hit by a double whammy of slowing growth and rising rates. We have been underweight Hardware and Equipment since last summer, moving to this trade a bit too early. We downgraded Consumer Durables And Retailing in February, observing that demand for goods, pulled forward by the pandemic, is waning and consumption is shifting away from goods to services. More recently, we downgraded Media and Entertainment. The sector has fallen significantly, but we reasoned that if an economic downturn is indeed on the way, advertisement expense is one of the first that companies curtail when they are tightening their belts. Last week, we downgraded Travel to underweight: Even well-heeled consumers are starting to feel the pinch of surging prices. And while most will take that long-awaited post-COVID vacation, the outlook beyond summer is bleak with surging costs of fuel and labor. As for Autos, we were complacent in our thinking that car shortages will eventually translate into strong earnings growth. Despite the disappointing performance, the EV Revolution remains a long-term investment theme for us. Also having opened the position in June 2021, we are still in the green at +7% in relative terms. We have also upgraded our position in Staples to overweight on a premise that many Americans are reeling from surging prices of food, fuel, and shelter. Consumer Staples is the only likely beneficiary, and its pricing power is on the rise. Bottom Line: We have been able to contain some of the damage incurred by market rotation away from cyclicals. Profitability Earnings Growth Expectations As we have written extensively in the past (e.g., “Is Earnings Recession In The Cards”,) the analysts' earnings growth forecast for the S&P 500 of 10% is too high, especially considering the number of adverse events that have taken place since the beginning of the year, and the overall trajectory of monetary policy and economic growth. The analysts are yet again missing the turning point, just as they did back in 2008, and even in 2020. Chart 2Earnings Forecasts For Cyclicals Are Still Way Too High
Taking Stock Of Sectors And Industry Groups
Taking Stock Of Sectors And Industry Groups
We have noticed that the cyclical industries with the highest EPS growth forecasts, such as Consumer Services, Transportation, and Auto, are most prone to earnings disappointment. To be fair, EPS growth expectations for Consumer Services and Transportation are down from December when they stood at 550% and 143% respectively (Chart 2). Earnings Uncertainty So how certain are analysts about their projections? A short answer is – not particularly. We gauge earnings uncertainty by looking at the dispersion of analyst EPS expectations scaled by the magnitude of EPS. In a way, this is a measure of analyst consensus, with estimates clustered around a certain number indicating extreme certainty of forecasts. We notice that the advent of COVID-19 rendered panic among analysts with the rate of uncertainty surging. More recently, uncertainty has decreased but remains elevated by historical standards (Chart 3). Looking at earnings projections by industry group (Chart 4), we notice that earnings uncertainty is the highest in the cyclical pockets of the market where the highest EPS growth is still expected: Consumer Services, Transportation, and Retailing. Chart 3Analysts Have Little Confidence In Their Forecasts...
Analysts Have Little Confidence In Their Forecasts
Analysts Have Little Confidence In Their Forecasts
Chart 4... Especially For Cyclical Industry Groups
Taking Stock Of Sectors And Industry Groups
Taking Stock Of Sectors And Industry Groups
Implications? Analysts as a group have little confidence in cyclical sector growth, and downward revisions are imminent. Margins In the “Marginally Worse” and subsequent “Sector Margin Scorecard” reports in October, we called for margins to roll over as early as 2022. Curiously, despite their bullishness, analysts expect the margins of most cyclical sectors to contract over the next 12 months (Chart 5). Chart 5Despite Their Bullishness, Analysts Expect Margins To Contract
Taking Stock Of Sectors And Industry Groups
Taking Stock Of Sectors And Industry Groups
Chart 6Pricing Power Is Declining But There Are Exceptions
Taking Stock Of Sectors And Industry Groups
Taking Stock Of Sectors And Industry Groups
Pricing Power As we observed early on, one of the key reasons for margin contraction is a decline in companies’ pricing power, i.e., their ability to pass costs on to their customers (Chart 6). The Materials sector experienced the most significant decline in pricing power, likely a positive as this may be an early sign that inflation is abating. It is also important to note that three sectors – Consumer Staples, Utilities, and Tech–are still growing their pricing power. Consumer Staples and Utilities are necessities, demand for which is fairly inelastic, while Tech is offering services that are still in high demand, as they help improve productivity and substitute labor, which is in short supply, for capital, which is still abundant. Degree of Operating Leverage Chart 7Low Operating Leverage Helps In Case Of Downturn
Taking Stock Of Sectors And Industry Groups
Taking Stock Of Sectors And Industry Groups
If pricing power is waning, what else can come to the rescue? After all, with inflation in the high single digits, nominal sales growth is to remain robust. The crucial piece of the puzzle is the ability of companies to convert sales into profits, i.e., operating leverage (Chart 7). Companies with high fixed costs enjoy higher operating leverage, and a small increase in sales translates into significant earnings growth (and vice versa). However, in case of an outright sales contraction, we are better off holding industries and sectors with low operating leverage, such as Staples and Healthcare. Earnings Stability Chart 8Defensives Have The Most Resilient Earnings
Taking Stock Of Sectors And Industry Groups
Taking Stock Of Sectors And Industry Groups
What sectors have the most resilient earnings, that won’t let investors down in a downturn? To answer this question empirically, we looked at a historical variation in EPS-realized growth rates by sector1 (Chart 8). We found that Staples, Healthcare, and Technology have had the most stable earnings growth rates. However, the last 12 years or so, characterized by low yields and nearly non-existent inflation, were a boon for long-duration technology stocks – so our experiment may not be pure. Bottom Line: Earnings expectations for the cyclical sectors are too high and will come down as analysts have little confidence in their forecasts. Balance Sheet Quality Free Cash Flow Chart 9Post-pandemic Surge In Demand Resulted In Free Cash Flow Windfall...
Taking Stock Of Sectors And Industry Groups
Taking Stock Of Sectors And Industry Groups
Post-pandemic demand has resulted in a free cash flow windfall for companies in multiple sectors. Technology benefited from the transition to remote working. Energy and Materials have not been able to meet the “reopening” demand after years of underinvestment, which resulted in constrained supply, and soaring prices (Chart 9). Chart 10...Which Companies Used To Repair Their Balance Sheets
Taking Stock Of Sectors And Industry Groups
Taking Stock Of Sectors And Industry Groups
Interest Coverage The companies used this profits windfall to repair their balance sheets and reduce their levels of debt. As a result, the interest coverage ratio has picked up across the board (Chart 10). Bottom Line: Corporate balance sheets across most sectors look strong. Tech, Materials, and Financials have improved the most. Cash Yield Companies that pay dividends and buy back their stocks not only enhance the returns of their shareholders but also signal their confidence in future earnings and the strength of their balance sheets (Chart 11). That is one of the reasons income funds were strong performers over the past few months as investors were seeking out quality investments (Chart 12). Chart 11Cash Yield Has Not Been This Attractive In Years...
Taking Stock Of Sectors And Industry Groups
Taking Stock Of Sectors And Industry Groups
Chart 12High Dividend Yield Signals Corporate Confidence
Taking Stock Of Sectors And Industry Groups
Taking Stock Of Sectors And Industry Groups
Valuations A corollary to our conclusion that earnings estimates are hardly trustworthy, is that forward multiples are not a great valuation metric on the verge of an earnings contraction. Trailing multiples are a better measure of value at this point in the cycle. We sorted PE multiples by their Z-score to 10 years of history (Chart 13) and notice the most cyclical sectors are rather inexpensive, both in absolute terms and relative to history as markets are forward looking. Chart 13High Dividend Yield Signals Corporate Confidence
Taking Stock Of Sectors And Industry Groups
Taking Stock Of Sectors And Industry Groups
Technicals Chart 14US Equities Appear Oversold
Taking Stock Of Sectors And Industry Groups
Taking Stock Of Sectors And Industry Groups
And last, but not least: The US equity market is oversold, and most industry groups are several standard deviations below the neutral reading (Chart 14). Bottom Line: Technicals signal that the market is oversold. Yet, a sustainable rebound may still be months away. Investment Conclusion Is it finally time for bottom fishing? We believe that oversold conditions and sectors trading at 30-40 percent of their peak are “necessary but insufficient conditions.” For the equity market to rebound, all the bad news needs to be fully priced in – however, we are still in the early stages of the monetary tightening cycle, and there is talk about earnings and economic recessions, the severity of which is impossible to gauge at this point. Rates have not stabilized yet, and inflation has not peaked. Much of the bad news is priced in, but “new” bad news is likely on the way. Bottom Line We recommend that investors remain patient and pad the more defensive and quality allocations in their portfolios at the expense of cyclical sectors that are geared to a slowdown. Companies with strong and resilient earnings and quality balance sheets will be able to better weather the storm, if it arrives. Irene Tunkel Chief Strategist, US Equity Strategy irene.tunkel@bcaresearch.com S&P 500 Chart II-1Macroeconomic Backdrop
Macroeconomic Backdrop
Macroeconomic Backdrop
Chart II-2Profitability
Profitability
Profitability
Chart II-3Valuations And Technicals
Valuations And Technicals
Valuations And Technicals
Chart II-4Uses Of Cash
Uses Of Cash
Uses Of Cash
Communication Services Chart II-5Macroeconomic Backdrop
Macroeconomic Backdrop
Macroeconomic Backdrop
Chart II-6Profitability
Profitability
Profitability
Chart II-7Valuations And Technicals
Valuations And Technicals
Valuations And Technicals
Chart II-8Uses Of Cash
Uses Of Cash
Uses Of Cash
Consumer Discretionary Chart II-9Macroeconomic Backdrop
Macroeconomic Backdrop
Macroeconomic Backdrop
Chart II-10Profitability
Profitability
Profitability
Chart II-11Valuations And Technicals
Valuations And Technicals
Valuations And Technicals
Chart II-12Uses Of Cash
Uses Of Cash
Uses Of Cash
Consumer Staples Chart II-13Macroeconomic Backdrop
Macroeconomic Backdrop
Macroeconomic Backdrop
Chart II-14Profitability
Profitability
Profitability
Chart II-15Valuations And Technicals
Valuations And Technicals
Valuations And Technicals
Chart II-16Uses Of Cash
Uses Of Cash
Uses Of Cash
Energy Chart II-17Macroeconomic Backdrop
Macroeconomic Backdrop
Macroeconomic Backdrop
Chart II-18Profitability
Profitability
Profitability
Chart II-19Valuations And Technicals
Valuations And Technicals
Valuations And Technicals
Chart II-20Uses Of Cash
Uses Of Cash
Uses Of Cash
Financials Chart II-21Macroeconomic Backdrop
Macroeconomic Backdrop
Macroeconomic Backdrop
Chart II-22Profitability
Profitability
Profitability
Chart II-23Valuations And Technicals
Valuations And Technicals
Valuations And Technicals
Chart II-24Uses Of Cash
Uses Of Cash
Uses Of Cash
Health Care Chart II-25Sector vs Industry Groups
Sector vs Industry Groups
Sector vs Industry Groups
Chart II-26Profitability
Profitability
Profitability
Chart II-27Valuations And Technicals
Valuations And Technicals
Valuations And Technicals
Chart II-28Uses Of Cash
Uses Of Cash
Uses Of Cash
Industrials Chart II-29Macroeconomic Backdrop
Macroeconomic Backdrop
Macroeconomic Backdrop
Chart II-30Profitability
Profitability
Profitability
Chart II-31Valuations And Technicals
Valuations And Technicals
Valuations And Technicals
Chart II-32Uses Of Cash
Uses Of Cash
Uses Of Cash
Information Technology Chart II-33Macroeconomic Backdrop
Macroeconomic Backdrop
Macroeconomic Backdrop
Chart II-34Profitability
Profitability
Profitability
Chart II-35Valuations And Technicals
Valuations And Technicals
Valuations And Technicals
Chart II-36Uses Of Cash
Uses Of Cash
Uses Of Cash
Materials Chart II-37Macroeconomic Backdrop
Macroeconomic Backdrop
Macroeconomic Backdrop
Chart II-38Profitability
Profitability
Profitability
Chart II-39Valuations And Technicals
Valuations And Technicals
Valuations And Technicals
Chart II-40Uses Of Cash
Uses Of Cash
Uses Of Cash
Real Estate Chart II-41Macroeconomic Backdrop
Macroeconomic Backdrop
Macroeconomic Backdrop
Chart II-42Profitability
Profitability
Profitability
Chart II-43Valuations And Technicals
Valuations And Technicals
Valuations And Technicals
Chart II-44Uses Of Cash
Uses Of Cash
Uses Of Cash
Utilities Chart II-45Macroeconomic Backdrop
Macroeconomic Backdrop
Macroeconomic Backdrop
Chart II-46Profitability
Profitability
Profitability
Chart II-47Valuations And Technicals
Valuations And Technicals
Valuations And Technicals
Chart II-48Uses Of Cash
Uses Of Cash
Uses Of Cash
Table II-1Performance
Taking Stock Of Sectors And Industry Groups
Taking Stock Of Sectors And Industry Groups
Table II-2Valuations And Forward Earnings Growth
Taking Stock Of Sectors And Industry Groups
Taking Stock Of Sectors And Industry Groups
Footnotes 1 Scaled and inverted Recommended Allocation
Highlights Chart 1Are Expectations Too Dovish?
Are Expectations Too Dovish?
Are Expectations Too Dovish?
The dominant market narrative has clearly shifted in the last few days. The primary concern among investors used to be that the Fed had fallen behind the curve on inflation. Now, asset prices are telling us that investors are more worried about an overly hawkish Fed and an increased risk of recession. The shift is evident in bond market prices. The yield curve is now priced for only 176 basis points of rate hikes over the next 12 months and only 90 bps of tightening over the next 24 months (Chart 1). What’s more, long-dated market-based inflation expectations have plunged to below the Fed’s target range (bottom panel). We recommend keeping portfolio duration close to benchmark for now, as bond yields could still have some downside during the next few months as both inflation and economic growth slow. That said, we suspect that the market is now pricing-in an overly dovish Fed tightening path for the next couple of years, a change that may soon warrant a shift back to below-benchmark portfolio duration. Stay tuned. Feature Table 1 Recommended Portfolio Specification Table 2Fixed Income Sector Performance
A Narrative Shift
A Narrative Shift
Investment Grade: Underweight Chart 2Investment Grade Market Overview
Investment Grade Market Overview
Investment Grade Market Overview
Investment grade corporate bonds underperformed the duration-equivalent Treasury index by 168 basis points in June, dragging year-to-date excess returns down to -379 bps. The average index option-adjusted spread widened 28 bps on the month and it currently sits at 158 bps. Similarly, our quality-adjusted 12-month breakeven spread moved up to its 61st percentile since 1995 (Chart 2). A report from a few months ago made the case for why investors should underweight investment grade corporate bonds on a 6-12 month investment horizon.1 The main rationale for this recommendation is that the slope of the Treasury curve is very flat, signaling that we are in the mid-to-late stages of the credit cycle. Corporate bond performance tends to be weak during such periods unless spreads start from very high levels. Despite our underweight 6-12 month investment stance, there’s a good chance that spreads will narrow during the next few months as inflation falls. That said, the persistent removal of monetary accommodation and flatness of the yield curve will limit how much spreads can compress. A recent report dug deeper into the corporate bond space and concluded that investment grade-rated Energy bonds offer exceptional value on a 6-12 month horizon.2 That report also concluded that long maturity investment grade corporates are attractively priced relative to short maturity bonds. Table 3A Corporate Sector Relative Valuation And Recommended Allocation* Table 3BCorporate Sector Risk Vs. Reward*
A Narrative Shift
A Narrative Shift
High-Yield: Neutral Chart 3High-Yield Market Overview
High-Yield Market Overview
High-Yield Market Overview
High-Yield underperformed the duration-equivalent Treasury index by 591 basis points in June, dragging year-to-date excess returns down to -889 bps. The average index option-adjusted spread widened 172 bps on the month to reach 578 bps, 209 bps above the 2017-19 average and 41 bps above the 2018 peak. The 12-month spread-implied default rate – the default rate that is priced into the junk index assuming a 40% recovery rate on defaulted debt and an excess spread of 100 bps – moved higher in June. It currently sits at 8% (Chart 3). As is the case with investment grade, there’s a good chance that high-yield spreads will stage a relief rally in the back half of this year as inflation falls. But due to the flatness of the yield curve, we think it will be difficult for spreads to move below the average seen during the last tightening cycle (2017-19). But even a move back to average 2017-19 levels would equate to roughly 11% of excess return for the junk index if it is realized over a six month period. This potential return is the main reason to prefer high-yield over investment grade in a US bond portfolio. While we maintain a neutral (3 out of 5) allocation to high-yield for now, we would be inclined to downgrade the sector if spreads tighten to the 2017-19 average or if core inflation falls back to 4%.3 MBS: Underweight Chart 4MBS Market Overview
MBS Market Overview
MBS Market Overview
Mortgage-Backed Securities underperformed the duration-equivalent Treasury index by 63 basis points in June, dragging year-to-date excess returns down to -171 bps. We discussed the outlook for Agency MBS in a recent report.4 We noted that MBS’s poor performance in 2021 and early-2022 was driven by duration extension. Fewer homeowners refinanced their loans as mortgage rates rose, and the MBS index’s average duration increased (Chart 4). But now, the index’s duration extension is at its end. The average convexity of the MBS index is close to zero (panel 3), meaning that duration is now insensitive to changes in rates. This is because hardly any homeowners have the incentive to refinance at current mortgage rates (panel 4). The implication is that excess MBS returns will be stronger going forward. That said, we still don’t see enough value in MBS spreads to increase our recommended allocation. The average index spread for conventional 30-year Agency MBS remains close to its lowest level since 2000 (bottom panel). At the coupon level, we observe that low-coupon MBS have much higher duration than high-coupon MBS and that convexity is close to zero for the entire coupon stack. This makes the relative coupon trade a direct play on bond yields. Given that we see some potential for yields to fall during the next six months, we recommend favoring low-coupon MBS (1.5%-2.5%) within an overall underweight allocation to the sector. Emerging Market Bonds (USD): Underweight Chart 5Emerging Markets Overview
Emerging Markets Overview
Emerging Markets Overview
Emerging Market bonds underperformed the duration-equivalent Treasury index by 182 basis points in June, dragging year-to-date excess returns down to -737 bps. EM Sovereigns underperformed the Treasury benchmark by 280 bps on the month, dragging year-to-date excess returns down to -925 bps. The EM Corporate & Quasi-Sovereign Index underperformed by 122 bps, dragging year-to-date excess returns down to -617 bps. The EM Sovereign Index underperformed the duration-equivalent US corporate bond index by 99 bps in June. The yield differential between EM sovereigns and duration-matched US corporates remains negative. Further, the relative performance of EM sovereigns versus US corporates has been tracking the performance of EM currencies versus the dollar and our Emerging Markets Strategy service sees further headwinds for EM currencies in the near term (Chart 5).5 The EM Corporate & Quasi-Sovereign Index outperformed duration-matched US corporates by 1 bp in June. The index continues to offer a significant yield advantage versus duration-matched US corporates (bottom panel), and as such, we continue to recommend a neutral (3 out of 5) allocation to the sector. Municipal Bonds: Overweight Chart 6Municipal Market Overview
Municipal Market Overview
Municipal Market Overview
Municipal bonds underperformed the duration-equivalent Treasury index by 89 basis points in June, dragging year-to-date excess returns down to -167 bps (before adjusting for the tax advantage). We view the municipal bond sector as better placed than most to cope with the recent bout of spread volatility. As we noted in a recent report, state & local government revenue growth has been strong and yet governments have also been slow to hire.6 The result is that net state & local government savings are incredibly high (Chart 6) and it will take some time to deplete these coffers even as economic growth slows and federal fiscal thrust turns to drag. On the valuation front, munis have cheapened up relative to both Treasuries and corporates during the past few months. The 10-year Aaa Muni / Treasury yield ratio is currently 94%, up significantly from its 2021 trough of 55%. The yield ratio between 12-17 year munis and duration-matched corporate bonds is also up significantly off its lows (panel 2). We reiterate our overweight allocation to municipal bonds within US fixed income portfolios, and we continue to have a strong preference for long-maturity munis. The yield ratio between 17-year+ General Obligation Municipal bonds and duration-matched US corporates is 92%. The same measure for 17-year+ Revenue bonds stands at 97%, just below parity even without considering municipal debt’s tax advantage. Treasury Curve: Buy 5-Year Bullet Versus 2/10 Barbell Chart 7Treasury Yield Curve Overview
Treasury Yield Curve Overview
Treasury Yield Curve Overview
The Treasury curve bear-flattened in June. The 2-year/10-year Treasury slope flattened 26 bps on the month and the 5-year/30-year slope flattened 13 bps. The 2/10 and 5/30 slopes now stand at 4 bps and 23 bps, respectively. In a recent Special Report we noted the unusually large divergence between flat slopes at the long end of the curve and steep slopes at the front end.7 This divergence has narrowed in recent weeks, but it remains wide by historical standards. For example, the 5-year/10-year Treasury slope is currently 0 bps while the 3-month/5-year slope is 122 bps. The divergence is happening because the market moved quickly to price-in a rapid near-term pace of rate hikes, but the Fed has only delivered 150 bps of tightening so far and this is holding down the very front-end of the curve. The oddly shaped curve presents us with an excellent trading opportunity. Specifically, we recommend buying the 5-year Treasury note versus a duration-matched barbell consisting of the 2-year and 10-year notes. The 5 over 2/10 butterfly spread has narrowed during the past month, but the trade continues to look attractive on our model (Chart 7). We also continue to recommend a position long the 20-year bullet versus a duration-matched 10/30 barbell as an attractive carry trade. TIPS: Underweight Chart 8TIPS Market Overview
TIPS Market Overview
TIPS Market Overview
TIPS underperformed the duration-equivalent nominal Treasury index by 246 basis points in June, dragging year-to-date excess returns down to -14 bps. The 10-year TIPS breakeven inflation rate fell 31 bps on the month, landing back inside the Fed’s 2.3% - 2.5% comfort zone (Chart 8). Consistently, our TIPS Breakeven Valuation Indicator is drifting toward neutral territory, signaling that TIPS are becoming less expensive (panel 2). At the front-end of the yield curve, the 2-year TIPS breakeven inflation rate fell 57 bps in June – from 3.86% to 3.29% - and the 2-year TIPS yield rose 96 bps – from -1.33% to -0.37% (bottom 2 panels). The large drop in short-maturity breakevens is the result of increasing investor conviction that inflation has indeed peaked. In a recent report we made the case that core CPI inflation can fall to a range of 4%-5% (from its current 6.0% rate) without the Fed needing to cause a recession. We also argued that a recession will be required to push inflation from 4% back down to 2%.8 The upshot for bond investors is that TIPS breakeven inflation rates will drop further as core inflation rolls over. This will be particularly true at the front-end of the yield curve. We also noted in last week’s report that Fed policymakers have increasingly indicated a desire for positive real yields across the entire curve.9 This tells us that investors should continue to short 2-year TIPS, targeting a positive real 2-year yield. ABS: Overweight Chart 9ABS Market Overview
ABS Market Overview
ABS Market Overview
Asset-Backed Securities outperformed the duration-equivalent Treasury index by 21 basis points in June, bringing year-to-date excess returns up to -42 bps. Aaa-rated ABS outperformed by 25 bps on the month, bringing year-to-date excess returns up to -33 bps. Non-Aaa ABS underperformed by 5 bps on the month, dragging year-to-date excess returns down to -93 bps. During the past two years, substantial federal government support for household incomes caused US households to build up an extremely large buffer of excess savings. Nowhere is this more evident than in the steep drop in the amount of outstanding credit card debt that was witnessed in 2020 and 2021 (Chart 9). In 2022, consumers have started to re-lever. The personal savings rate was just 5.4% in May and the amount of outstanding credit card debt has recovered to its pre-COVID level (bottom panel). But while household balance sheets are starting to deteriorate, they remain exceptionally strong in level terms. In other words, it will be some time before we see enough deterioration to cause a meaningful uptick in consumer credit delinquencies. Investors should remain overweight consumer ABS and should take advantage of the high quality of household balance sheets by moving down the quality spectrum, favoring non-Aaa rated securities over Aaa-rated ones. Non-Agency CMBS: Overweight Chart 10CMBS Market Overview
CMBS Market Overview
CMBS Market Overview
Non-Agency Commercial Mortgage-Backed Securities underperformed the duration-equivalent Treasury index by 5 basis points in June, dragging year-to-date excess returns down to -194 bps. Aaa Non-Agency CMBS outperformed Treasuries by 12 bps on the month, bringing year-to-date excess returns up to -141 bps. Non-Aaa Non-Agency CMBS underperformed by 52 bps on the month, dragging year-to-date excess returns down to -340 bps. CMBS spreads remain wide compared to other similarly risky spread products and are currently slightly above their historic averages (Chart 10). Meanwhile, weak commercial real estate (CRE) investment continues to drive strong CRE price appreciation (panel 4). Agency CMBS: Overweight Agency CMBS outperformed the duration-equivalent Treasury index by 32 basis points in June, bringing year-to-date excess returns up to 9 bps. The average index option-adjusted spread tightened 3 bps on the month. It currently sits at 47 bps, close to its long-term average (bottom panel). Agency CMBS spreads also continue to look attractive compared to other similarly risky spread products. Stay overweight. Appendix A: The Golden Rule Of Bond Investing We follow a two-step process to formulate recommendations for bond portfolio duration. First, we determine the change in the federal funds rate that is priced into the yield curve for the next 12 months. Second, we decide – based on our assessments of the economy and Fed policy – whether the change in the fed funds rate will exceed or fall short of what is priced into the curve. Most of the time, a correct answer to this question leads to the appropriate duration call. We call this framework the Golden Rule Of Bond Investing, and we demonstrated its effectiveness in the US Bond Strategy Special Report, “The Golden Rule Of Bond Investing”, dated July 24, 2018. Chart 11 illustrates the Golden Rule’s track record by showing that the Bloomberg Barclays Treasury Master Index tends to outperform cash when rate hikes fall short of 12-month expectations, and vice-versa. Chart 11The Golden Rule's Track Record
The Golden Rule's Track Record
The Golden Rule's Track Record
At present, the market is priced for 176 basis points of rate hikes during the next 12 months. We can also use our Golden Rule framework to make 12-month total return and excess return forecasts for the Bloomberg Barclays Treasury index under different scenarios for the fed funds rate. Excess returns are relative to the Bloomberg Barclays Cash index. To forecast total returns we first calculate the 12-month fed funds rate surprise in each scenario by comparing the assumed change in the fed funds rate to the current value of our 12-month discounter. This rate hike surprise is then mapped to an expected change in the Treasury index yield using a regression based on the historical relationship between those two variables. Finally, we apply the expected change in index yield to the current characteristics (yield, duration and convexity) of the Treasury index to estimate total returns on a 12-month horizon. The below tables present those results, along with excess returns for a front-loaded and a back-loaded rate hike scenario. Excess returns are calculated by subtracting assumed cash returns in each scenario from our total return projections.
A Narrative Shift
A Narrative Shift
Appendix B: Butterfly Strategy Valuations The following tables present the current read-outs from our butterfly spread models. We use these models to identify opportunities to take duration-neutral positions across the Treasury curve. The following two Special Reports explain the models in more detail: US Bond Strategy Special Report, “Bullets, Barbells And Butterflies”, dated July 25, 2017, available at usbs.bcaresearch.com US Bond Strategy Special Report, “More Bullets, Barbells And Butterflies”, dated May 15, 2018, available at usbs.bcaresearch.com Table 4 shows the raw residuals from each model. A positive value indicates that the bullet is cheap relative to the duration-matched barbell. A negative value indicates that the barbell is cheap relative to the bullet. Table 4Butterfly Strategy Valuation: Raw Residuals In Basis Points (As Of June 30, 2022)
A Narrative Shift
A Narrative Shift
Table 5 scales the raw residuals in Table 4 by their historical means and standard deviations. This facilitates comparison between the different butterfly spreads. Table 5Butterfly Strategy Valuation: Standardized Residuals (As Of June 30, 2022)
A Narrative Shift
A Narrative Shift
Table 6 flips the models on their heads. It shows the change in the slope between the two barbell maturities that must be realized during the next six months to make returns between the bullet and barbell equal. For example, a reading of -9 bps in the 5 over 2/10 cell means that we would expect the 5-year to outperform the 2/10 if the 2/10 slope flattens by less than 9 bps during the next six months. Otherwise, we would expect the 2/10 barbell to outperform the 5-year bullet. Table 6Discounted Slope Change During Next 6 Months (BPs)
A Narrative Shift
A Narrative Shift
Appendix C: Excess Return Bond Map The Excess Return Bond Map is used to assess the relative risk/reward trade-off between different sectors of the US bond market. It is a purely computational exercise and does not impose any macroeconomic view. The Map’s vertical axis shows 12-month expected excess returns. These are proxied by each sector’s option-adjusted spread. Sectors plotting further toward the top of the Map have higher expected returns and vice-versa. Our novel risk measure called the “Risk Of Losing 100 bps” is shown on the Map’s horizontal axis. To calculate it, we first compute the spread widening required on a 12-month horizon for each sector to lose 100 bps or more relative to a duration-matched position in Treasury securities. Then, we divide that amount of spread widening by each sector’s historical spread volatility. The end result is the number of standard deviations of 12-month spread widening required for each sector to lose 100 bps or more versus a position in Treasuries. Lower risk sectors plot further to the right of the Map, and higher risk sectors plot further to the left. Chart 12Excess Return Bond Map (As Of June 30, 2022)
A Narrative Shift
A Narrative Shift
Ryan Swift US Bond Strategist rswift@bcaresearch.com Footnotes 1 Please see US Bond Strategy / Global Fixed Income Strategy Special Report, “Turning Defensive On US Corporate Bonds”, dated April 12, 2022. 2 Please see US Bond Strategy / Global Fixed Income Strategy Special Report, “Looking For Opportunities In US & European Corporates After The Recent Selloff”, dated May 31, 2022. 3 For more details on this call please see US Bond Strategy Weekly Report, “When The Dual Mandates Clash”, dated June 28, 2022. 4 Please see US Bond Strategy Weekly Report, “The Bond Market Implications Of A 5% Mortgage Rate”, dated April 26, 2022. 5 Please see Emerging Markets Strategy Charts That Matter, “Beware Of Another Downleg In Risk Assets”, dated June 30, 2022. 6 Please see US Bond Strategy Weekly Report, “Echoes Of 2018”, dated May 24, 2022. 7 Please see US Bond Strategy / US Investment Strategy / US Equity Strategy Special Report, “The Yield Curve As An Indicator”, dated March 29, 2022. 8 Please see US Bond Strategy Weekly Report, “No End In Sight For Fed Tightening”, dated June 21, 2022. 9 Please see US Bond Strategy Weekly Report, “When Dual Mandates Clash”, dated June 28, 2022. Recommended Portfolio Specification Other Recommendations Treasury Index Returns Spread Product Returns
Executive Summary There has never been a modern era recession or sharp slowdown in which the oil price did not collapse. In a recession, the massive destruction of oil demand always overwhelms a tight supply. Across the last six recessions, the median collapse in the oil price was -60 percent, with the best case being -30 percent, and the worst case being -75 percent. Hence, in the coming recession, the oil price is likely headed to $55, with the best case being $85, and the worst case being $30. Investors should short oil, or short oil versus copper. Equity investors should underweight the oil sector versus basic resources and/or industrials and/or banks, and underweight oil-heavy equity markets such as Norway. Fractal trading watchlist: Oil versus industrials, and oil versus banks. Oil Didn’t Get The ‘Everything Sell-Off’ Memo
Oil Didn't Get The 'Everything Sell-Off' Memo
Oil Didn't Get The 'Everything Sell-Off' Memo
Bottom Line: There has never been a modern era recession or sharp slowdown in which the oil price did not collapse, and this time will be no different. Feature We have just witnessed a rare star-alignment. The near-perfect line up of Mercury, Venus, Mars, Jupiter and Saturn in the heavens is a spectacular sight for the early birds who can star gaze through clear skies. And it is a rare event, which last happened in 2004. But investors have just witnessed an even rarer star-alignment. The ‘everything sell-off’ in stocks, bonds, inflation-protected bonds, industrial metals, and gold during the second quarter has happened in only one other calendar quarter out of almost 200. Making it a ‘1 in a 100’ event, which last happened way back in 1981 (Chart I-1 and Chart I-2). Chart I-1The ‘Everything Sell-Off’ In 2022…
Oil Didn't Get The 'Everything Sell-Off' Memo
Oil Didn't Get The 'Everything Sell-Off' Memo
Chart I-2...Last Happened In 1981
...Last Happened In 1981
...Last Happened In 1981
As we detailed in our previous reports Markets Echo 1981 When Stagflation Morphed Into Recession and More On 2022-23 = 1981-82 And The Danger Ahead, a once-in-a-generation conjugation connects the ‘1 in a 100’ everything sell-offs in 1981 and 2022. The conjugation is inflation fears, exacerbated by a major war between commodity producing neighbours, and countered by aggressive rate hikes, morph into recession fears. The 1981-82 episode is an excellent blueprint for market action through 2022-23. This makes the 1981-82 episode an excellent blueprint for market action through 2022-23, and we refer readers to the previous reports for the implications for stocks, bonds, equity sectors, and currencies. Oil Didn’t Get The ‘Everything Sell-Off’ Memo But one major investment didn’t get the ‘everything sell-off’ memo. That major investment is crude oil. Even within the commodity space, oil is the outlier. In the second quarter, industrial commodity prices have collapsed: copper, -20 percent; iron ore -25 percent; tin, -40 percent; and lumber, -40 percent. Yet the crude oil price is up, +7 percent, and the obvious explanation is the Russia/Ukraine war (Chart I-3). Chart I-3Oil Didn't Get The 'Everything Sell-Off' Memo
Oil Didn't Get The 'Everything Sell-Off' Memo
Oil Didn't Get The 'Everything Sell-Off' Memo
The Russia/Ukraine war is an important part of the 2022/1981 once-in-a-generation conjugation. In 1981, just as now, the full-scale invasion-led war between two major commodity producing neighbours – Iraq and Iran – disrupted commodity supplies, and thereby added fuel to an already red-hot inflationary fire. When Russia invaded Ukraine earlier this year, the oil price surged by 25 percent. Remarkably, when Iraq invaded Iran in late 1980, the oil price also surged by 25 percent. But by mid-1981, with the global economy slowing, the oil price had given back those gains. Then, as the economy entered recession in early 1982, the oil price slumped to 15 percent below its pre-war level. If 2022-23 follows this blueprint, it would imply the oil price falling to $85/barrel (Chart I-4). Chart I-4If Oil Follows The 1981-82 Blueprint, It Will Tumble To $85
If Oil Follows The 1981-82 Blueprint, It Will Tumble To $85
If Oil Follows The 1981-82 Blueprint, It Will Tumble To $85
There Has Never Been A Recession In Which The Oil Price Did Not Collapse Everybody knows the narrative for the oil price surge this year. In what is putatively a very tight market, the embargo of Russian oil has removed enough supply to put significant upward pressure on the price. The trouble with this story is that Russian oil will find a buyer, even if it requires a discount. Moreover, with the major buyers being China and India, it will be politically and physically impossible to police secondary sanctions. The bottom line is that Russian oil will find its way into the market. There has never been a modern era recession or sharp slowdown in which the oil price did not collapse. But the bigger problem will come from the demand side of the equation when the global economy enters, or even just flirts with, a recession. Put simply, because of massive demand destruction, there has never been a modern era recession or sharp slowdown in which the oil price did not collapse (Chart I-5 - Chart I-10). Chart I-5In The Early 80s Recession, Oil Collapsed By -30 Percent
In The Early 80s Recession, Oil Collapsed By -30 Percent
In The Early 80s Recession, Oil Collapsed By -30 Percent
Chart I-6In The Early 90s Recession, Oil Collapsed By -60 Percent
In The Early 90s Recession, Oil Collapsed By -60 Percent
In The Early 90s Recession, Oil Collapsed By -60 Percent
Chart I-7In The 2000 Dot Com Bust, Oil Collapsed By ##br##-55 Percent
In The 2000 Dot Com Bust, Oil Collapsed By -55 Percent
In The 2000 Dot Com Bust, Oil Collapsed By -55 Percent
Chart I-8In The 2008 Global Financial Crisis, Oil Collapsed By -75 Percent
In The 2008 Global Financial Crisis, Oil Collapsed By -75 Percent
In The 2008 Global Financial Crisis, Oil Collapsed By -75 Percent
Chart I-9In The 2015 EM Recession, Oil Collapsed By ##br##-60 Percent
In The 2015 EM Recession, Oil Collapsed By -60 Percent
In The 2015 EM Recession, Oil Collapsed By -60 Percent
Chart I-10In The 2020 Pandemic, Oil Collapsed By ##br##-75 Percent
In The 2020 Pandemic, Oil Collapsed By -75 Percent
In The 2020 Pandemic, Oil Collapsed By -75 Percent
Furthermore, as we explained in Oil Is The Accessory To The Murder, a preceding surge in the oil price is a remarkably consistent ‘straw that breaks the camel’s back’, tipping an already fragile economy over the brink into recession. Meaning that the oil price ends up in a symmetrical undershoot to its preceding overshoot. The result being a massive drawdown in the oil price in every modern era recession or sharp slowdown. Specifically: Early 80s recession: -30 percent Early 90s recession: -60 percent 2000 dot com bust: -55 percent 2008 global financial crisis: -75 percent 2015 EM recession: -60 percent 2020 pandemic: -75 percent What about the 1970s episode – isn’t this the counterexample in which the oil price remained stubbornly high despite a recession? No, even in the 1974 recession, the oil price fell by -25 percent. Moreover, the commonly cited explanation for the elevated nominal price of oil through the 70s is a misreading of history. The popular narrative blames OPEC supply cutbacks related to geopolitical events – especially the US support for Israel in the Arab-Israel war of October 1973. As neat and popular as this narrative is, it ignores the real culprit: the collapse in August 1971 of the Bretton Woods ‘pseudo gold standard’, which severed the fixed link between the US dollar and quantities of commodities. To maintain the real value of oil, OPEC countries were raising the price of crude oil just to play catch up. Meaning that while geopolitical events may have influenced the precise timing and magnitude of price hikes, OPEC countries were just ‘staying even’ with the collapsing real value of the US dollar, in which oil was priced. In terms of gold, in which oil was effectively priced before 1971, the oil price was no higher in 1980 than in 1971! (Chart I-11) Chart I-11Priced In Gold, The Oil Price Was No Higher In 1980 Than in 1971!
Priced In Gold, The Oil Price Was No Higher In 1980 Than in 1971!
Priced In Gold, The Oil Price Was No Higher In 1980 Than in 1971!
Shorting Oil And Oil Plays Will Be Very Rewarding For Patient Investors The four most dangerous words in investment are ‘this time is different’. Today, the oil bulls insist that this time really is different because of an unprecedented structural underinvestment in fossil fuel extraction. Leaving the precariously tight oil market vulnerable to the slightest uptick in demand, or downtick in supply. Maybe. But to reiterate, in a recession, the massive destruction of oil demand always overwhelms a tight supply. In this important regard, this time will not be different. Taking the median drawdown of the last six recessions of 60 percent, and applying it to the post-invasion peak of $130, it implies that, in the coming recession, oil will plunge to $55. In a recession, the massive destruction of oil demand always overwhelms a tight supply. Of course, this is the average of a range of recession outcomes, with the best case being $85 and the worst case being $30. Still, this means that patient investors who short oil can look forward to substantial gains. Alternatively, those who want a hedged position should short oil versus copper – especially as oil versus copper is now at the top of its 25-year trading channel (Chart I-12). Chart I-12Oil Versus Copper Is At The Top Of Its 25-Year Trading Channel
Oil Versus Copper Is At The Top Of Its 25-Year Trading Channel
Oil Versus Copper Is At The Top Of Its 25-Year Trading Channel
Equity investors should underweight the oil sector versus basic resources (Chart I-13) and/or versus industrials and/or versus banks, and underweight oil-heavy stock markets such as Norway (Chart I-14). Chart I-13Underweight Oil Versus Basic Resources
Underweight Oil Versus Basic Resources
Underweight Oil Versus Basic Resources
Chart I-14Underweight Oil-Heavy Stock Markets Such As Norway
Underweight Oil-Heavy Stock Markets Such As Norway
Underweight Oil-Heavy Stock Markets Such As Norway
Suffice to say, these are all correlated trades. They will all work, or they will all not work. But to repeat, this time is never different. Fractal Trading Watchlist Confirming the fundamental arguments to underweight oil plays, the spectacular recent outperformance of oil equities versus both industrials and banks has reached the point of fragility on its 260-day fractal structures that has reliably signalled previous turning points (Chart I-15). Chart I-15The Outperformance Of Oil Versus Industrials Is Exhausted
The Outperformance Of Oil Versus Industrials Is Exhausted
The Outperformance Of Oil Versus Industrials Is Exhausted
We are adding oil versus banks to our watchlist, with this week’s recommendation being to underweight oil versus industrials, setting a profit target and symmetrical stop-loss of 10 percent, with a maximum holding period of 6 months. Fractal Trading Watchlist: New Additions The Outperformance Of Oil Versus Banks Is Exhausted
The Outperformance Of Oil Versus Banks Is Exhausted
The Outperformance Of Oil Versus Banks Is Exhausted
Chart 1BRL/NZD At A Resistance Point
BRL/NZD At A Resistance Point
BRL/NZD At A Resistance Point
Chart 2Homebuilders Versus Healthcare Services Has Turned
Homebuilders Versus Healthcare Services Has Turned
Homebuilders Versus Healthcare Services Has Turned
Chart 3CNY/USD At A Potential Turning Point
CNY/USD Has Reversed
CNY/USD Has Reversed
Chart 4US REITS Are Oversold Versus Utilities
US REITS Are Oversold Versus Utilities
US REITS Are Oversold Versus Utilities
Chart 5CAD/SEK Is Vulnerable To Reversal
CAD/SEK Reversal Has Started
CAD/SEK Reversal Has Started
Chart 6Financials Versus Industrials Has Reversed
Financials Versus Industrials To Reverse
Financials Versus Industrials To Reverse
Chart 7The Outperformance Of Resources Versus Biotech Has Ended
The Outperformance Of Resources Versus Biotech Has Started To Reverse
The Outperformance Of Resources Versus Biotech Has Started To Reverse
Chart 8The Outperformance Of Resources Versus Healthcare Has Ended
The Outperformance Of Resources Versus Healthcare Is Vulnerable To Reversal
The Outperformance Of Resources Versus Healthcare Is Vulnerable To Reversal
Chart 9FTSE100 Outperformance Vs. Euro Stoxx 50 Is Vulnerable To Reversal
FTSE100 Outperformance Vs. Euro Stoxx 50 Is Reversing
FTSE100 Outperformance Vs. Euro Stoxx 50 Is Reversing
Chart 10Netherlands' Underperformance Vs. Switzerland Is Ending
Netherlands Underperformance Vs. Switzerland Has Been Exhausted
Netherlands Underperformance Vs. Switzerland Has Been Exhausted
Chart 11The Sell-Off In The 30-Year T-Bond At Fractal Fragility
The Sell-Off In The 30-Year T-Bond Is Approaching Fractal Fragility
The Sell-Off In The 30-Year T-Bond Is Approaching Fractal Fragility
Chart 12The Sell-Off In The NASDAQ Is Approaching Fractal Fragility
The Sell-Off In The NASDAQ Is Approaching Fractal Fragility
The Sell-Off In The NASDAQ Is Approaching Fractal Fragility
Chart 13Food And Beverage Outperformance Is Exhausted
Food And Beverage Outperformance Has Been Exhausted
Food And Beverage Outperformance Has Been Exhausted
Chart 14German Telecom Outperformance Vulnerable To Reversal
AT REVERSAL
AT REVERSAL
Chart 15Japanese Telecom Outperformance Vulnerable To Reversal
AT REVERSAL
AT REVERSAL
Chart 16The Strong Downtrend In The 18-Month-Out US Interest Rate Future Has Ended
The Strong Trend In The 18-Month-Out US Interest Rate Future Is Fragile
The Strong Trend In The 18-Month-Out US Interest Rate Future Is Fragile
Chart 17The Strong Downtrend In The 3 Year T-Bond Is Fragile
The Strong Trend In The 3 Year T-Bond Is Fragile
The Strong Trend In The 3 Year T-Bond Is Fragile
Chart 18A Potential Switching Point From Tobacco Into Cannabis
A Potential Switching Point From Tobacco Into Cannabis
A Potential Switching Point From Tobacco Into Cannabis
Chart 19Biotech Is A Major Buy
Biotech Is A Major Buy
Biotech Is A Major Buy
Chart 20Norway's Outperformance Has Ended
Norway's Outperformance Could End
Norway's Outperformance Could End
Chart 21Cotton Versus Platinum Has Reversed
Cotton's Outperformance Is Vulnerable To Reversal
Cotton's Outperformance Is Vulnerable To Reversal
Chart 22Switzerland's Outperformance Vs. Germany Has Ended
Fractal Trading Watch List
Fractal Trading Watch List
Chart 23USD/EUR Is Vulnerable To Reversal
The Rally In USD/EUR Could End
The Rally In USD/EUR Could End
Chart 24The Outperformance Of MSCI Hong Kong Versus China Has Ended
The Outperformance Of MSCI Hong Kong Versus China Is Vulnerable To Reversal
The Outperformance Of MSCI Hong Kong Versus China Is Vulnerable To Reversal
Chart 25A Potential New Entry Point Into Petcare
A Potential New Entry Point Into Petcare
A Potential New Entry Point Into Petcare
Chart 26GBP/USD At A Potential Turning Point
GBP/USD At A Turning Point
GBP/USD At A Turning Point
Chart 27US Utilities Outperformance Vulnerable To Reversal
Fractal Trading Watch List
Fractal Trading Watch List
Chart 28The Outperformance Of Oil Versus Banks Is Exhausted
Fractal Trading Watch List
Fractal Trading Watch List
Dhaval Joshi Chief Strategist dhaval@bcaresearch.com Fractal Trading System Fractal Trades
Why Oil Is Headed To $55
Why Oil Is Headed To $55
Why Oil Is Headed To $55
Why Oil Is Headed To $55
6-Month Recommendations Structural Recommendations Closed Fractal Trades Indicators To Watch - Bond Yields Chart II-1Indicators To Watch - Bond Yields - Euro Area
Indicators To Watch - Bond Yields - Euro Area
Indicators To Watch - Bond Yields - Euro Area
Chart II-2Indicators To Watch - Bond Yields - Europe Ex Euro Area
Indicators To Watch - Bond Yields - Europe Ex Euro Area
Indicators To Watch - Bond Yields - Europe Ex Euro Area
Chart II-3Indicators To Watch - Bond Yields - Asia
Indicators To Watch - Bond Yields - Asia
Indicators To Watch - Bond Yields - Asia
Chart II-4Indicators To Watch - Bond Yields - Other Developed
Indicators To Watch - Bond Yields - Other Developed
Indicators To Watch - Bond Yields - Other Developed
Indicators To Watch - Interest Rate Expectations Chart II-5Indicators To Watch - Interest Rate Expectations
Indicators To Watch - Interest Rate Expectations
Indicators To Watch - Interest Rate Expectations
Chart II-6Indicators To Watch - Interest Rate Expectations
Indicators To Watch - Interest Rate Expectations
Indicators To Watch - Interest Rate Expectations
Chart II-7Indicators To Watch - Interest Rate Expectations
Indicators To Watch - Interest Rate Expectations
Indicators To Watch - Interest Rate Expectations
Chart II-8Indicators To Watch - Interest Rate Expectations
Indicators To Watch - Interest Rate Expectations
Indicators To Watch - Interest Rate Expectations
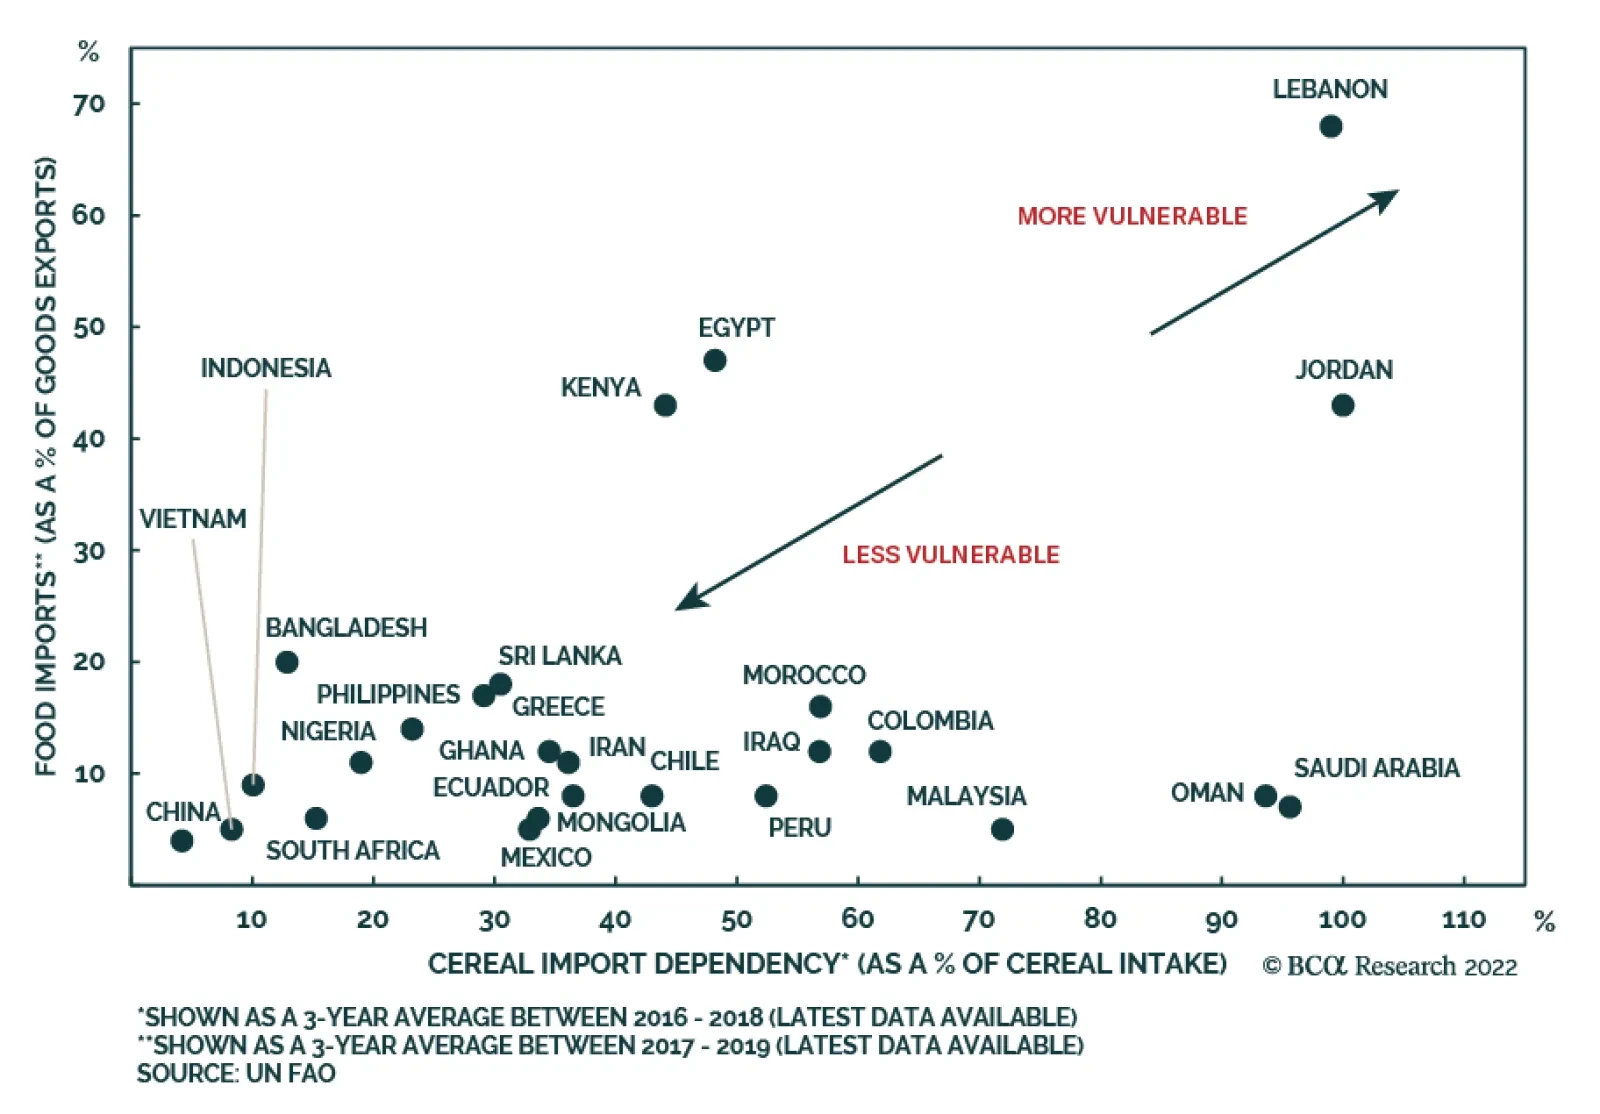
High food and fertilizer prices could morph into food crises in several developing nations. A Special Report from our Emerging Markets Strategy team reckons that Lebanon, Egypt, Kenya, Peru, Pakistan, and Sri Lanka are most at-risk of slipping into a food…
Executive Summary Depressing Housing Market And Service Sector Activity
Depressing Housing Market And Service Sector Activity
Depressing Housing Market And Service Sector Activity
May’s economic data ticked up from extremely depressed levels in April, driven by a normalization in the supply chain and a resumption in production. The service sector and housing market continued to shrink on a year-on-year (YOY) basis and sentiment among households and corporates remains lackluster. The rebound in exports growth in May will likely be unsustainable. Chinese exports are set to contract from 2021 as external demand for goods weakens. The rapidly worsening labor market dynamics reinforce households’ unwillingness to consume and hence, will hinder the recovery in household consumption. Although industrial production showed a decent rebound in May, the manufacturing production recovery might be derailed by rolling lockdowns and prolonged logistic bottlenecks. Barring major lockdowns, China’s economy will likely improve in 2H 2022 from the very low base in Q2. That said, the country’s economic recovery faces several challenges and the magnitude of the rebound will be subdued. Bottom Line: The elements for a robust and sustainable recovery in the Chinese economy are not yet in place. The recent rally in the A-share market reflects a mean-reversal to the pre-March lockdown price level, rather than the beginning of a cyclical bull market. Investors should remain cautious on Chinese equities in the next several months. Feature China’s economic data moved up slightly in May from an extremely depressed level in April. A normalization of the supply chain and a resumption of production post-lockdown in Shanghai and other cities led to a modest recovery in business activities. However, indicators from the service sector and housing market continued to shrink on a YOY basis, highlighting persistent weaknesses on the demand side. Chart 1Import Dynamics Reflect Weak Domestic Demand
Import Dynamics Reflect Weak Domestic Demand
Import Dynamics Reflect Weak Domestic Demand
May’s import data also reflects sluggish domestic demand. The increase in imports value from a year ago was largely driven by the elevated prices in energy and agriculture products. China’s imports in May, in volume terms, continued to contract on a YOY basis, albeit improved from its historical low in April (Chart 1). Barring major lockdowns, China’s economy will likely improve in the second half of this year. However, the economic recovery in 2H 2022 will be very subdued due to the following challenges: Downbeat sentiment among households and enterprises; Continued real estate woes; A contraction in exports; Deteriorating labor market conditions; and Risk of rolling lockdowns and persistent logistic bottlenecks. The recent rebound in the A-share market reflects an improvement in investors’ sentiment buttressed by the easing of lockdowns and a resumption of production. In other words, the rebound in Chinese stock prices is probably a mean-reversal to pre-lockdown levels, rather than a sustainable rally (Chart 2). Our cautious view on Chinese equities is also corroborated by the divergence between falling raw industrial prices, which reflect weak China’s growth, and rising Chinese equity prices (Chart 3). Overall, we continue to recommend a neutral stance in Chinese equities within a global portfolio. Chart 2Too Early To Turn Bullish On Chinese Stocks
Too Early To Turn Bullish On Chinese Stocks
Too Early To Turn Bullish On Chinese Stocks
Chart 3Falling Prices In Raw Materials Do Not Signal An Imminent Round In Demand
Falling Prices In Raw Materials Do Not Signal An Imminent Round In Demand
Falling Prices In Raw Materials Do Not Signal An Imminent Round In Demand
Qingyun Xu, CFA Associate Editor qingyunx@bcaresearch.com Downbeat Household And Corporate Sentiment Chart 4Subdued Bank Loan Growth Has Been A Drag On Credit Expansion
Subdued Bank Loan Growth Has Been A Drag On Credit Expansion
Subdued Bank Loan Growth Has Been A Drag On Credit Expansion
Although China’s credit growth improved sequentially in May after a very weak reading in April, the magnitude of May’s credit rebound is much more subdued compared with the months following the first lockdowns in early 2020 (Chart 4). In addition, May’s rebound in credit growth was mainly driven by an acceleration in local government bond issuance. The modest pickup in the credit impulse - calculated as a 12-month change in total social financing (TSF) as a percentage of nominal GDP - is much more muted when excluding local government bond issuance (Chart 5). Furthermore, as noted in our previous report, given that most of the planned local government special purpose bonds (SPBs) will be issued by the end of June, barring any increase in this year’s SPBs quota, the support from local government bond issuance to TSF growth will likely wane significantly in the second half of 2022. Meanwhile, confidence among consumers and businesses remained downbeat through May (Chart 6). The poor private-sector sentiment will continue to dampen credit demand and thus, limit the effectiveness of monetary stimulus. Chart 5The Rebound In Credit Impulse Is Much More Muted When Excluding Local Government Bond Issuance
The Rebound In Credit Impulse Is Much More Muted When Excluding Local Government Bond Issuance
The Rebound In Credit Impulse Is Much More Muted When Excluding Local Government Bond Issuance
Chart 6Gloomy Sentiment Among Chinese Households And Enterprises
Gloomy Sentiment Among Chinese Households And Enterprises
Gloomy Sentiment Among Chinese Households And Enterprises
Private-sector credit demand remains very frail. Household medium- to long-term loans are still contracting from previous month, while bank loans to corporate peers were also weak in May (Chart 7 & 8). Chart 7Depressed Household Loan Demand
Depressed Household Loan Demand
Depressed Household Loan Demand
Chart 8Corporate Demand For Credit Remains Weak Despite Accommodative Monetary Conditions
Corporate Demand For Credit Remains Weak Despite Accommodative Monetary Conditions
Corporate Demand For Credit Remains Weak Despite Accommodative Monetary Conditions
Chart 9Deterioration In Corporate Sentiment Is Also Reflected In Surveys of Business Conditions
Deterioration In Corporate Sentiment Is Also Reflected In Surveys of Business Conditions
Deterioration In Corporate Sentiment Is Also Reflected In Surveys of Business Conditions
On the other hand, corporate bill financing as a portion of new bank loans, although rolled over from April’s record high, remained very elevated through May (Chart 8, bottom panel). Moreover, enterprises’ financing and investment expectations deteriorated further in May (Chart 9). Persisting Real Estate Woes The near-term outlook for China’s property market remains uninspiring. So far, easing measures in the housing sector have not been successful in reviving home sales and homebuyers’ sentiment. Residential property sales and real estate investment growth ticked up slightly in May after plummeting by 43% and 10% in April, respectively (Chart 10). However, the modest improvement in May does not mark the start of a full-fledged cyclical recovery. High-frequency data show a renewed weakening in floor space sales, particularly in tier-one and tier-two cities, during the first two weeks of June (Chart 11). Chart 10The Slight Improvement In Housing Market Indicators Does Not Signal A Cyclical Recovery
The Slight Improvement In Housing Market Indicators Does Not Signal A Cyclical Recovery
The Slight Improvement In Housing Market Indicators Does Not Signal A Cyclical Recovery
Chart 11Renewed Deterioration In Home Sales In June
Renewed Deterioration In Home Sales In June
Renewed Deterioration In Home Sales In June
Chart 12Real Estate Developers' Decreased Funding Will Further Dampen Housing Construction Activities
Real Estate Developers' Decreased Funding Will Further Dampen Housing Construction Activities
Real Estate Developers' Decreased Funding Will Further Dampen Housing Construction Activities
Funds to real estate developers have been contracting at the fastest rate since data collection began in 1998. The lack of funding for real estate developers will further depress housing construction activities in the near term (Chart 12). Moreover, new home prices, which tend to lead housing starts, started to decrease on a YOY basis in May. This was the first price contraction since 2016. Our housing price diffusion index suggests that home price growth will continue to shrink in the next six to nine months (Chart 13). Many local cities reduced mortgage rates, by anywhere from 15 to more than 100 basis points, after the PBoC lowered mortgage rate floor and the benchmark rate (5-year LPR) in May. However, the average cost of mortgage loans remains higher than households’ income growth, making mortgage borrowing less attractive to ordinary households (Chart 14). Chart 13Housing Prices Are Set To Decline Further In 2H 2022
Housing Prices Are Set To Decline Further In 2H 2022
Housing Prices Are Set To Decline Further In 2H 2022
Chart 14Mortgage Rates Have Dropped, But Still Higher Than Income And Home Price Growth
Mortgage Rates Have Dropped, But Still Higher Than Income And Home Price Growth
Mortgage Rates Have Dropped, But Still Higher Than Income And Home Price Growth
In addition, the widening gap between the average mortgage rate and the pace of housing price appreciation implies that housing has become much less appealing to residents who purchase homes as investment (Chart 14, bottom panel). In short, property purchases will remain weak given neither “to live in” nor investment demand for properties is likely to recover fast. China's Exports Are Set To Contract In 2H 2022 China’s exports rebounded in May from the April low as supply chain interruptions subsided and logistic disruptions began to ease. However, as US and European consumer spending on goods (excluding autos) declines, Chinese shipments will shrink in the months ahead. May’s improvement in suppliers’ delivery times and product inventory subindexes of China’s official Purchasing Managers’ Index (PMI) suggests that logistics were less of a drag on economic activity than in April (Chart 15). In addition, Shanghai and China’s exports freight indexes recovered significantly on a month-over-month basis (Chart 16) with the lifting of lockdown measures. Chart 15Chinese Logistics Pressures Have Eased Slightly In May...
Chinese Logistics Pressures Have Eased Slightly In May...
Chinese Logistics Pressures Have Eased Slightly In May...
Chart 16...And Export Freight Indices Have Rebounded
...And Export Freight Indices Have Rebounded
...And Export Freight Indices Have Rebounded
Chart 17Global Demand Is Dwindling
Global Demand Is Dwindling
Global Demand Is Dwindling
Meanwhile, global demand for goods has been weakening. Korean exports volume growth, a bellwether for global trade, has been trending down since late 2021 (Chart 17). Moreover, the US and Euro Area manufacturing PMIs have been falling (Chart 17, bottom panel). Spending in developed economies is shifting from manufactured goods to services. Retail inventories in the US are well above their pre-pandemic trend, suggesting that the demand growth for Chinese goods will dwindle when US retailers start to destock their inventories (Chart 18). Falling US and Euro Area real household disposable income will also reinforce the downward trend in external demand (Chart 19). Therefore, China's exports are set to shrink in the second half of this year. Chart 18Well-Stocked Shelves In The US Bode Poorly For Chinese Export Demand
Well-Stocked Shelves In The US Bode Poorly For Chinese Export Demand
Well-Stocked Shelves In The US Bode Poorly For Chinese Export Demand
Chart 19A Contraction in US and Euro Area Household Real Disposable Income
A Contraction in US and Euro Area Household Real Disposable Income
A Contraction in US and Euro Area Household Real Disposable Income
Deteriorating Labor Market Conditions Will Curb Household Consumption Recovery Although improved from April’s extreme low, Chinese retail sales and service activity remained in contractionary territory in May, highlighting sluggish household demand (Chart 20). In addition, the cinema audience, which is used to gauge the impact of the pandemic on the service sector, indicates a further deterioration in the sector’s activity in June (Chart 20, bottom panel). The lackluster consumer demand is also evidenced by soft core and service consumer prices (CPI) in May (Chart 21). Chart 20Chinese Retail Sales And Service Activity Continued To Contract In May
Chinese Retail Sales And Service Activity Continued To Contract In May
Chinese Retail Sales And Service Activity Continued To Contract In May
Chart 21Soft Core And Service CPIs Also Reflect Lackluster Household Demand
Soft Core And Service CPIs Also Reflect Lackluster Household Demand
Soft Core And Service CPIs Also Reflect Lackluster Household Demand
Labor market conditions have also worsened. Although the nationwide urban survey-based unemployment rate fell moderately in May, the 31-large city surveyed unemployment rate climbed to an all-time high in the 10-year history of this survey. Moreover, employment in the service sector deteriorated to the worst level since mid-2020 (Chart 22). Furthermore, urban new job creation fell into deep shrinkage on a YOY basis, while the unemployment rate among younger workers rose to the highest point since data collection began in 2018 (Chart 23). Chart 22Labor Market Situation Is Worsening Rapidly...
Labor Market Situation Is Worsening Rapidly...
Labor Market Situation Is Worsening Rapidly...
Chart 23...Particularly Among Younger Workers
...Particularly Among Younger Workers
...Particularly Among Younger Workers
Chart 24Weak Sentiment On Future Income Contributes To Households' Unwillingness To Consume
Weak Sentiment On Future Income Contributes To Households' Unwillingness To Consume
Weak Sentiment On Future Income Contributes To Households' Unwillingness To Consume
The rapidly worsening labor market dynamics and income prospects reinforce households’ downbeat sentiment (Chart 24). The latter will impede household consumption recovery in the second half of this year. Production Recovery Faces Risks Of Persistent Logistic Bottlenecks The uptick in industrial activity in May was due to a lifting of Covid-related lockdown restrictions. Although industrial production showed a decent rebound, underlying data suggest that economic fundamentals remained subdued. Chart 25Industrial Activity Improved Only Slightly In May
Industrial Activity Improved Only Slightly In May
Industrial Activity Improved Only Slightly In May
Chart 26Construction Material Production Continues To Shrink On A YOY Basis
Construction Material Production Continues To Shrink On A YOY Basis
Construction Material Production Continues To Shrink On A YOY Basis
Electricity output remained in contractionary territory through May (Chart 25). Cement and steel output continued shrinking from the same period last year (Chart 26). Moreover, their prices have been falling even though production growth has been waning, which indicates that demand in the construction sector is depressed (Chart 3, bottom panel). Consumer durable goods production also remains well below their levels from a year ago (Chart 27 & 28). Chart 27Auto And Smartphone Production Keeps Decreasing From A Year Ago...
Auto And Smartphone Production Keeps Decreasing From A Year Ago...
Auto And Smartphone Production Keeps Decreasing From A Year Ago...
Chart 28… As Well As Production Of Home Appliances
...As Well As Production Of Home Appliances
...As Well As Production Of Home Appliances
Chart 29Prolonged Logistic Bottlenecks
Prolonged Logistic Bottlenecks
Prolonged Logistic Bottlenecks
Chinese manufacturing investment rebounded in May. However, since exports will likely shrink in the second half of this year, it will create a major headwind for manufacturing investment and output. Moreover, China’s manufacturing production will likely be challenged by persistent logistic bottlenecks in 2H 2022. Chinese road freight was still declining in the first three weeks in June from the same period last year as shown in Chart 29. The risk of renewed Covid-induced lockdowns or mobility restrictions are nontrivial since China will maintain its zero-Covid policy at least through the end of this year. Table 1China Macro Data Summary
A Muted Post-Lockdown Recovery Ahead
A Muted Post-Lockdown Recovery Ahead
Table 2China Financial Market Performance Summary
A Muted Post-Lockdown Recovery Ahead
A Muted Post-Lockdown Recovery Ahead
Footnotes Strategic Themes Cyclical Recommendations