Sectors

Dear Client, We will be working on our 2022 Outlook for China, which will be published on December 8. Next week we will be sending you BCA Research’s Annual Outlook, featuring long-time BCA client Mr. X, who visits towards the end of each year to discuss the economic and financial market outlook for the year ahead. Best regards, Jing Sima China Strategist Feature In meetings with our North American clients this past week, we expressed the view that China’s economic growth is on a downward trend and easing measures have been gradual and modest in scope. Most clients agreed that China’s economy faces tremendous headwinds, however, some investors were more optimistic about the outlook for Chinese stocks in the next 6 to 12 months. Valuations in both China’s onshore and offshore equity markets have dropped to multi-year lows and macro policies have started to ease. Cheaply valued Chinese stocks should have more upside in the wake of policy support. Policy tone recently pivoted to a more growth supporting bias, but the existing easing measures will not offset the deceleration in both credit growth and domestic demand. China’s economic activity may worsen before it stabilizes in mid-2022. Moreover, China’s financial markets do not seem to have priced in the economic weakness. Therefore, in the next one to two quarters, risks to Chinese stocks are tilted toward the downside. Chart 1Chinese Stocks Will Truly Bottom When The Economy Troughs
Chinese Stocks Will Truly Bottom When The Economy Troughs
Chinese Stocks Will Truly Bottom When The Economy Troughs
Below are some of the main questions from our meetings and our answers. Q: Policies have started to be more pro-growth. Why do you still underweight Chinese stocks? A: There are two reasons that we maintain a cautious view on Chinese stocks for at least the next six months, in both absolute terms and relative to global equities. First, we do not think that the magnitude of existing easing measures is sufficient to offset the economy’s downward momentum. Secondly, China’s business cycle lags credit growth by about six to nine months. The timing of a turnaround in the economy and stock prices may be later than investors have priced in. In short, we need to see more reflationary measures and a rebound in credit growth to have a legitimate macro fundamental basis to overweight Chinese stocks (Chart 1). Credit growth on a year-on-year basis stopped falling in October. The underlying data in credit creation, however, points to a weakening in demand for corporate loans (Chart 2). Loans to the housing sector are well below a year ago (Chart 3). Chart 2Weakening Loan Demand
Weakening Loan Demand
Weakening Loan Demand
Chart 3Bank Loans To The Housing Sector Have Not Turned Around
Bank Loans To The Housing Sector Have Not Turned Around
Bank Loans To The Housing Sector Have Not Turned Around
Chart 4It Will Take Time For Policy Easing To Restore Confidence In The Corporate Sector
It Will Take Time For Policy Easing To Restore Confidence In The Corporate Sector
It Will Take Time For Policy Easing To Restore Confidence In The Corporate Sector
Despite an acceleration in local government bond issuance in October and RMB300 billion in additional bank loans to support small and medium enterprises, growth in medium- to long-term corporate loans peaked (Chart 4). In previous cycles, a rollover in corporate demand for longer-term bank lending on average lasted more than nine months, suggesting that any policy adjustments will take a while to restore confidence in the corporate sector. Without a decisive pickup in credit growth, corporate earnings growth will be at risk of deteriorating. Moreover, policy tightening since earlier this year is still working its way through the economy and major economic indicators in China continue to decline (Chart 5). We think that China’s economy is set to decelerate even more in the next several months, suggesting that earnings uncertainty will likely rise. This, combined with reactive policymakers, already slowing earnings momentum, and a downward adjustment in 12-month forward earnings, suggests that investors have not yet reached the maximum bearishness for Chinese stock prices (Chart 6). Chart 5No Signs Of Improvement In The Economy
No Signs Of Improvement In The Economy
No Signs Of Improvement In The Economy
Chart 6The Earnings Adjustement Process Is Only Beginning
The Earnings Adjustement Process Is Only Beginning
The Earnings Adjustement Process Is Only Beginning
Q: What is the impact of China’s property market slowdown on the economy? Will recent policy easing stop deterioration in the real estate sector? A: Policy has been recalibrated by relaxing restrictions on mortgage lending and rules for land sales.1 However, the negative financing loop among developers, households and local governments may take longer to improve. Meanwhile, the market may underestimate the downside risks in housing-related activity in the next 6 to 12 months. Chart 7Households' Home Buying Intentions Have Plummeted
Households' Home Buying Intentions Have Plummeted
Households' Home Buying Intentions Have Plummeted
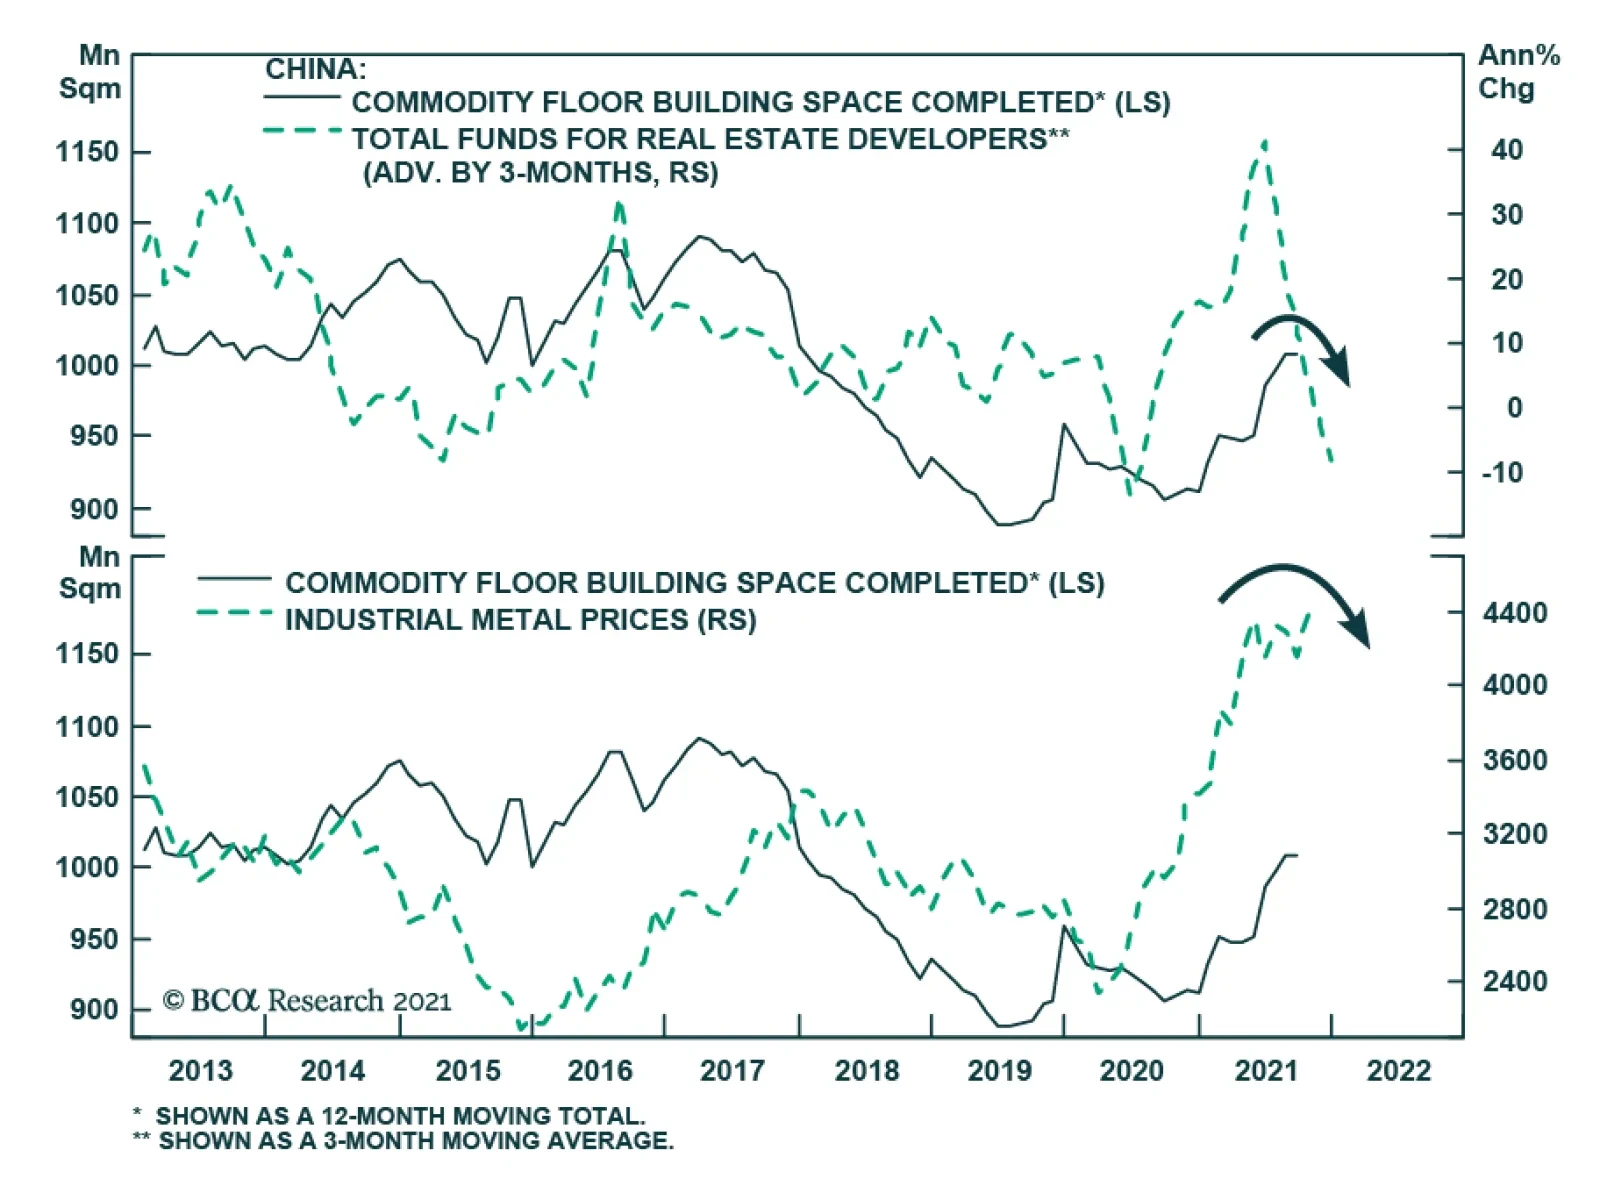
Our view is based on the following: Home sales will likely remain in contraction in the next two quarters. Aggressive crackdowns on property market speculation in the past 12 months have fundamentally shifted consumers’ expectations for future home prices. The impending pilot property tax reform2 (details yet to be disclosed) will only encourage the wait-and-see sentiment of potential buyers. Home sales contracted by 24% in October from a year ago. In previous cycles, contractions in home sales normally lasted for more than 12 months. Moreover, the proportion of households planning to buy a house dropped to only 7.7% in Q3 2021 from 11.6% in Q4 2020 (Chart 7). Real estate developers have slashed new projects and land purchases to preserve liquidity for debt servicing (Chart 8, first and second panels). Policymakers may succeed in prompting banks to resume lending to developers in order to alleviate the escalating risk of widespread defaults. However, so far the marginal easing has failed to reverse the downward trend in bank credit to developers along with home sales (Chart 8, third and bottom panels). Funding constraints for real estate developers will probably be sustained for another six months, despite the recent easing measures. Construction activity, housing starts, and real estate investment will likely remain in doldrum at least through 1H22 (Chart 9). Chart 8Housing Activities Are Still Falling
Housing Activities Are Still Falling
Housing Activities Are Still Falling
Chart 9Less Funding = Less Investment And Completions
Less Funding = Less Investment And Completions
Less Funding = Less Investment And Completions
The marked reduction in land sales will impede local governments’ revenues and weigh on infrastructure investment (Chart 10). Real estate and infrastructure financing contributed 50% of the increase in total Chart 10Local Government Revenues Largely Depend On The Housing Sector
Local Government Revenues Largely Depend On The Housing Sector
Local Government Revenues Largely Depend On The Housing Sector
social financing in 2020. Given that local governments face funding constraints from a slump in land sale incomes, policies on leverage from local government financing vehicles (LGFVs) will have to meaningfully loosen up to allow a rise in bank lending to support infrastructure investment. As discussed in previous reports, an acceleration in local government special-purpose bond issuance can only partially offset weak credit growth. Furthermore, shadow banking activity, which comprises LGFV borrowing and is highly correlated with China’s infrastructure investment growth, remains in contraction and indicates that growth in infrastructure investment is unlikely to rebound strongly (Chart 11). The sharp weakening of real estate construction activities will drag down the demand for building materials, machinery, home appliances and automobiles. Real estate accounts for about 60% of Chinese households’ wealth, thus any substantial drop in home prices will further weaken households’ propensity to consume (Chart 12). Chart 11More Easing Needed For A Meaningful Pickup In Infrastructure Investment
More Easing Needed For A Meaningful Pickup In Infrastructure Investment
More Easing Needed For A Meaningful Pickup In Infrastructure Investment
Chart 12Falling Demand For Commodities And Consumer Goods
Falling Demand For Commodities And Consumer Goods
Falling Demand For Commodities And Consumer Goods
Chart 13AOn The Surface Housing Inventories Are Lower Than Six Years Ago...
On The Surface Housing Inventories Are Lower Than Six Years Ago...
On The Surface Housing Inventories Are Lower Than Six Years Ago...
There are nontrivial risks that the real estate slowdown will evolve into a downturn similar to that of 2014-15. Although the existing housing inventory is more modest than the start of the 2014/15 property downturn, developers have accumulated more debt and unfinished projects in this cycle than in the past (Charts 13A & 13B). Policymakers will have to relax property sector policies much more forcefully to prevent the downturn from intensifying. In the interim, we will likely witness more deterioration in the sector. Chart 13B...But Developers Have Built Up Massive Leverages And Hidden Inventories In The Past Three Years
...But Developers Have Built Up Massive Leverages And Hidden Inventories In the Past Three Years
...But Developers Have Built Up Massive Leverages And Hidden Inventories In the Past Three Years
Q: If the property market accounts for such a big portion of local governments’ revenues, why hasn’t the waning housing market forced policymakers to loosen restrictions? A: We think regulators have been slow to backtrack property market reforms because this year China’s fiscal deficit has narrowed from last year due to lower government spending and improved income from corporate taxes. In previous property market downturns, such as 2011/12, 2015/16 and 2019, property policy restrictions were lightened following major declines in government revenues (Chart 14). However, in 2021 China’s fiscal balance sheet has been stronger than in previous cycles; central and local governments have collected much more taxes, particularly corporate taxes, than in 2020 (Chart 15). Meanwhile, government expenditures so far this year have been lower, resulting in a large improvement in the country’s fiscal deficit (Chart 16). Chart 14Falling Gov Revenues Forced Policymakers To Backtrack Reforms In The Past...
Falling Gov Revenues Forced Policymakers To Backtrack Reforms In The Past...
Falling Gov Revenues Forced Policymakers To Backtrack Reforms In The Past...
Chart 15...But This Year Gov Tax Revenues Have Been Strong
...But This Year Gov Tax Revenues Have Been Strong
...But This Year Gov Tax Revenues Have Been Strong
Chart 16Fiscal Deficit Improved This Year Despite Falling evenues From Land Sales
Fiscal Deficit Improved This Year Despite Falling evenues From Land Sales
Fiscal Deficit Improved This Year Despite Falling evenues From Land Sales
As discussed above, slightly loosened restrictions on land purchases by some regional governments will not restore developers’ confidence and boost the demand for land. The sharp increase in government's corporate tax collection will also start to ebb as economic growth slows and corporate profits decline. As such, even if government expenditures remain the same next year, the fiscal deficit will grow because revenues will be under substantial downward pressure. We expect that Chinese policymakers will have to take more actions to stabilize fiscal conditions. Forecasting exactly when this will occur is difficult, but a benign government balance sheet in much of this year is delaying policymakers’ response to the flagging housing market. Meantime, both policymakers and investors may be complacent about the state of the economy until the full scale of the property sector spillover risk becomes clear. Q: Rates are low and industrial profit growth has been strong this year. Why has capex been so sluggish? A: Investment growth in the manufacturing sector has been lackluster because their profit margins have been squeezed by rising input costs. On the other hand, investment in the mining industry has been constrained by policy restrictions. An acceleration in China’s de-carbonization efforts this year has likely constrained investment in the mining sector. Even though industrial profit growth has been concentrated among the upstream industries such as mining which profits grew by a stunning 100% this year, investment in the sector was mostly flat from a year ago (Chart 17). During the first half of the year, mid- to downstream firms were caught between rising input prices and a weak recovery in domestic consumption. Manufacturing investment grew faster than the mining sector, but manufacturing profit growth only increased by about 30% year to date (Chart 18). However, we think manufacturing investment growth may improve slightly into 2022 as the sector continues to gain pricing power. Chart 17Mining Sector's Profit Growth Way Outpaced Investment
Mining Sector's Profit Growth Way Outpaced Investment
Mining Sector's Profit Growth Way Outpaced Investment
Chart 18Manufacturing Sector Profit Growth Has Been Much More Muted Than Upstream Industries
Manufacturing Sector Profit Growth Has Been Much More Muted Than Upstream Industries
Manufacturing Sector Profit Growth Has Been Much More Muted Than Upstream Industries
Q: The RMB has been strong against the dollar, despite China’s maturing business cycle. What is your outlook for the RMB next year? A: The RMB exchange rate has been boosted by China’s record current account surplus, wide interest rate differentials and speculation that tension between the US and China will abate. However, all three favorable conditions supporting the RMB are in danger of reversing next year. Chart 19The RMB Has Been Appreciating Despite A Strong USD
The RMB Has Been Appreciating Despite A Strong USD
The RMB Has Been Appreciating Despite A Strong USD
Chart 20The RMB's Appreciation Deviates From Economic Fundamentals
The RMB's Appreciation Deviates From Economic Fundamentals
The RMB's Appreciation Deviates From Economic Fundamentals
Despite broad-based dollar strength, the CNY/USD has appreciated by 4.5% year to date (Chart 19). The RMB’s appreciation deviates from China’s economic fundamentals (Chart 20). Strong global demand for goods has boosted Chinese exports while travel restrictions curbed foreign exchange outflows by domestic households (Chart 21). China-US real interest rate differentials have been in favor of the CNY versus USD, bringing net foreign inflows to China’s onshore bond market (Chart 22). Additionally, the recent meeting between President Joe Biden and President Xi Jinping has prompted speculation that the US will lessen tariffs on Chinese imports. Chart 21Large Current Account Surplus
Large Current Account Surplus
Large Current Account Surplus
Chart 22Favorable Interest Rate Differentials And Strong Fund Inflows
Favorable Interest Rate Differentials And Strong Fund Inflows
Favorable Interest Rate Differentials And Strong Fund Inflows
Chart 23China's Extremely Robust Export Growth Unlikely To Sustain In 2022
China's Extremely Robust Export Growth Unlikely To Sustain In 2022
China's Extremely Robust Export Growth Unlikely To Sustain In 2022
Chart 24A Strong RMB Does Not Bode Well For Chinese Exporters' Profits
A Strong RMB Does Not Bode Well For Chinese Exporters' Profits
A Strong RMB Does Not Bode Well For Chinese Exporters' Profits
These factors will likely turn against the CNY next year. First, export growth will moderate as the composition of US consumption rotates from goods to services (Chart 23). Secondly, it would not be in the PBoC’s best interests to let the RMB strengthen too rapidly because an appreciating currency would be a deflationary force on China’s export and manufacturing sectors (Chart 24). While we expect policymakers to maintain their preference for a gradual approach to stimulus, we assign a high probability to a reserve requirement ratio (RRR) cut in early 2022. In this environment, Chinese bond yields will decline, which would narrow the China-US interest rate differential. Finally, while there may be some changes to US tariffs on China, it is doubtful that there would be a broad-based removal of tariffs. Chart 25The CNY/USD Will Likely Fall And Converge To Chinese Stocks' (Under)performance
The CNY/USD Will Likely Fall And Converge To Chinese Stocks' (Under)performance
The CNY/USD Will Likely Fall And Converge To Chinese Stocks' (Under)performance
The CNY’s outperformance stands out as it marks a break from its correlation with China’s relative equity performance vis-à-vis the US (Chart 25). The signal from the currency suggests that either global equity investors are overly pessimistic about economic and regulatory risks in China, or overly optimistic about the value of China’s currency. The latter option is more likely at the moment, and the CNY/USD exchange rate is at the risk of converging to the underperformance of Chinese investable stocks next year. Jing Sima China Strategist jings@bcaresearch.com Footnotes 1 China Cities Ease Land Bidding Rules as Property Stress Spreads - Bloomberg 2 China’s Pilot Property Tax Reforms Benefit Markets Despite Short-Term Pain, Analysts Say - Caixin Global Market/Sector Recommendations Cyclical Investment Stance
Highlights Last month we published a report on the US corporate margins, titled “Marginally Worse.” In the report, we concluded that margins are likely to contract next year, hobbled by a slowdown in top-line growth, falling productivity, a decline in corporate pricing power, and soaring costs of labor and materials. Q3-2021 – another stellar earnings season: Companies achieved superior earnings growth and expanded margins. However, many companies guided down for Q4-2021 and 2022 citing mounting challenges, such as higher costs of labor, shipping, and raw materials. As such, deciphering which sectors are best positioned to maintain profitability is of paramount importance. Framework for Sector Margin Scorecard: We introduce a framework to rank the S&P 500 sector based on the expected resilience of their margins. It is based on four factors that provide a uniform basis for comparison across all sectors, despite their inherent differences in cost structure, effects of input costs, and ability to manage prices. The four factors driving changes in operating margins are: Sell-side operating margins forecasts as a concise summary of bottom-up company trends Pent-up demand for the sector’s products proxied by the difference between annualized sales growth in 2020 and 2021 and long-term annualized sales growth Pricing power or ability to pass on costs to customers Degree of operating leverage or ability to spread costs when sales volume increases Sectors with most resilient margins: According to this scorecard, Financials, Healthcare, Energy, and Utilities are in the best position to preserve operating margins (Table 1). Table 1Sector Margins Scorecard
Sector Margins Scorecard
Sector Margins Scorecard
Energy Sector - Upgrade to Overweight The medium-term supply/demand backdrop is highly supportive of the current crude oil prices, with a Brent price target of $81 and upside price risk due to inadequate capex. Margins are still below the pre-pandemic peak and the street expects them to increase by 7.74 percentage points over the next 12 months. High operating leverage converts growing demand from the global economic recovery into profitability. Financials – Overweight: O/W Banks, EW Insurance While sell-side analysts anticipate Financials margins will decline, we believe that margins may surprise on the upside: The sector has high operating leverage, is somewhat insulated from supply chain disruptions, sees green shoots in loan growth, and its pricing power is improving. Further, the BCA house view expects the 10-year Treasury yield will rise to 2.0% - 2.25% by the end of 2022, supporting net interest margins. Healthcare - Overweight: O/W Medical Equipment and Services, EW Pharma In July we published a report on the Healthcare sector, titled “Checking The Pulse: Deep Dive Into The Health Care Sector” and upgraded it to Overweight. The Healthcare sector is one of the most resilient sectors profitability-wise as, being defensive in nature, its sales are unaffected by changes in economic demand. The street expects margins to expand by over 2% over the next 12 months. Further, there is still significant pent-up demand for the health care services, and specifically for the elective procedures – the most lucrative segment of the Healthcare Sector. Pricing power has recently picked up. Feature Last month we published a report on US corporate profit margins, titled “Marginally Worse.” In that report, we took a close look at corporate margins by analyzing their key drivers. We have concluded that margins are likely to contract next year, driven by a slowdown in top-line growth, falling productivity, and a decline in corporate pricing power. The sales side of the margin equation will fail to offset upward cost pressures imposed by the tight labor market, soaring input prices and transportation costs, rising depreciation expense, and a potential increase in tax rates. We also developed a simple model that encapsulates all the moving parts (Chart 1). Our forecast, based on the model, reiterates that the path of least resistance for US corporate margins is lower.
Chart 1
In this report, we will take a close look at the S&P 500 sectors to gauge their ability to grow earnings and preserve margins. We aim to rank them by their ability to maintain profitability. Q3-2021 Earnings Season: Stellar Results Operating sector margins are a focal point for investors in the current environment of soaring shipping costs, PPI readings unseen for the last forty years, and a wage-price spiral that may lead to prolonged periods of elevated inflation. While rising costs have been a concern for a while now, the Q3-2021 earnings season has surprised on the upside, with 81% of companies exceeding analyst earnings expectations. Earnings increased by 42% year-over-year and sales 17%. The two-year annualized growth rate (CAGR) for S&P 500 earnings is 14.6% and 5.7% for sales. The pandemic trough has been all but forgotten, and earnings are back to their trend (Chart 2).
Chart 2
Chart 3
All sectors, except for Industrials and Consumer Discretionary, have earnings and sales that exceed pre-pandemic levels (Chart 3). Energy, Materials, and Tech enjoyed annualized eps growth over the past two years in excess of 20%. And of course, because of such robust earnings growth, most sectors have reached 2010 -2021 peak margins (Chart 4). And these are unprecedented high peaks: Most sectors’ margins are more than two standard deviations away from their five-year averages. From a statistical standpoint, Z-scores in this “zip code” indicate that the probability of even higher margins is minuscule (Chart 5).
Chart 4
Chart 5
How were companies able to achieve such stellar earnings growth and peak margins despite all the cost and supply chain disruption headwinds? The answer is strong sales growth, efficiency in managing suppliers, ability to pass on costs to customers by raising prices, and finally, high operating leverage. Here is what happened in the words of the companies: Home Depot: “Professional home improvement contractors have had huge backlogs of work to do, and impatient customers have in many cases been willing to pay up in order to get the goods needed despite supply chain problems.” Microsoft: "We do have good understanding of lead times required to meet the capacity and signals that we’re seeing. I think we do a good job managing that. It’s not to say we’re not impacted. Multiple suppliers are important to be able to manage through that, and I feel the team has done a very good job.” Union Pacific Corporation: "The Union Pacific team successfully navigated global supply chain disruptions, a major bridge outage, and additional weather events to produce strong quarterly revenue growth and financial results." Honeywell: "Our disciplined approach to productivity and pricing helped deliver a strong third quarter despite an uncertain global environment marked by supply chain constraints, increasing raw material inflation, and labor market challenges.” Coca-Cola: Our results through the first nine months of 2021," CEO Frank Harrison said, "reflect a strong balance of volume growth, price realization, and prudent expense management." However, there are also multiple cracks in the foundation, with companies such as Target and Amazon guiding lower both for Q4-2021 and 2022 citing higher costs of labor, shipping, and raw materials. As such, deciphering which sectors can maintain profitability is of paramount importance. Building A Sector Margin Scorecard So which sectors have the best ability to preserve or even expand margins over the next year? Forecasting profitability by sector is tricky, as every sector is different, and has disparate drivers of sales and costs, making cross-sectional comparisons challenging. However, we have an advantage – we are not aiming to predict a point estimate for each sector margin a year from now, but rather rank all sectors from best to worst in terms of their ability to maintain profitability. To do so, we have created a scorecard based on four factors that provide a uniform basis for comparison across all sectors, despite their inherent differences in cost structure, effects of input costs, and ability to manage prices. These factors also implicitly incorporate a potential mean reversion, i.e., high readings are unlikely to move even higher. Four factors capturing future changes in the profit margins are: Sell-side forecasts of operating margins over the next 12 months as a concise summary of bottom-up company trends Pent-up demand for the sector’s products proxied by the difference between 2019-2021 sales CAGR and long-term annualized sales growth Pricing power or ability to pass on costs to customers Degree of operating leverage or ability to spread costs when sales volume increases Factor 1: Expected Change In Operating Margins Over The Next 12 Months Top-down sector margin expectations for the next 12 months are an aggregation of the bottom-up company forecasts. Since the stock market is a market of stocks, this is an important summary of companies' trends which we incorporate into our ranking framework. In line with our view, sell-side analysts expect S&P 500 margins to contract by 1.2% over the next 12 months. Margin contraction is expected across the board with two notable exceptions: Energy and Healthcare. In the scorecard, we rank sectors based on the expected magnitude of the margin change, such that sectors with the least compression, or outright growth, are scoring better (Chart 6).
Chart 6
Factor 2: Pent-up Demand For The Sector’s Products Most sectors have enjoyed a fantastic sales and earnings recovery this year (Chart 7), with sales exceeding pre-pandemic levels thanks to strong consumer demand.
Chart 7
However, to gauge the level of pent-up demand for each sector, we compare 2020-2021 CAGR of sales growth with a long-term sales growth rate. We call this factor “sales growth differential.” Our thinking is that if recent sales growth is below a pre-pandemic normal, there is still demand left on the table. For example, the Consumer Discretionary sector is not yet back to the pre-pandemic “normal” pace of growth. Therefore, there is still strong demand for its products and services. This aligns well with what we were observing for months now. Fears of Covid-19 have resulted in a shift of spending from services to goods. As a result, demand for goods has overshot pre-pandemic levels, while demand for services is below its pre-pandemic trend and is enjoying a rebound (Chart 8). Chart 8There Is Still Pent-up Demand For Services
There Is Still Pent-up Demand For Services
There Is Still Pent-up Demand For Services
In the scorecard, we assign a higher score to the sectors like Industrials and Consumer Discretionary expecting a more significant pickup in sales growth, and a lower score to the sectors with sales growth that exceeds the historical average on the concern that mean reversion may be in store: A strong bounce back in sales has already materialized, and demand has been pulled forward. Factor 3: Pricing Power Pricing Power is a proprietary BCA indicator based on the PPI and CPI indices for the 60 different industries. Industries are rolled up into sector indices and the market index.1 Sectors with higher pricing power can pass on their costs to their customers. However, at some point, they may no longer be able to raise prices as that will dampen demand for their products. As a result, after a series of price increases, companies’ pricing power wanes. Today, pricing power of companies in most sectors is already two-to-three standard deviations above the five-year average, suggesting that the probability of further gains is extremely low, i.e., one percent or less (Chart 9). The only exceptions are the Healthcare and Financial sectors whose pricing power has barely budged.
Chart 9
What sectors do we prefer? Ones with a very high pricing power that is about to roll over or the ones whose pricing power is handicapped by outside political pressures and competitive headwinds? Since we believe that markets are driven by the second derivative, waning pricing power may have a detrimental effect on sector performance, while low and stable pricing power is already priced into expectations. To reflect this thinking, we penalize sectors whose pricing power is high relative to five years of history, expecting mean reversion. Factor 4: Degree Of Operating Leverage The degree of operating leverage (DOL), which gauges the company’s ability to spread its costs over sales, is largely determined by the cost of each marginal unit sold. This is a metric that assesses the cost structure of the sector in terms of fixed costs vs. variable costs. Sectors with higher fixed costs have higher operating leverage: It costs next to nothing to produce a marginal unit of sales, which leads to higher profitability as volume grows. We calculate DOL as the following: DOL= % Change in Operating Income/ % Change in Sales Percentage of change in operating income and sales is a five-year change to smooth out volatility and assess the longer-term relationship. Further, to obtain a comprehensive picture of the longer-term DOL, we calculate a median reading for each sector from 2010 to 2021. Median ignores extreme values and is better at capturing the “normal”. We also exclude negative and zero readings from our calculations to gauge DOL only when the companies are profitable (Chart 10).
Chart 10
Bringing It All Together: Operating Margins Sector Scorecard We have ranked all 11 sectors along the four dimensions described above. As a result, we expect Financials, Healthcare, Energy, and Utilities to be in the best position to preserve operating margins (Table 1). Table 1Sector Margins Scorecard
Sector Margins Scorecard
Sector Margins Scorecard
Energy Sector - Upgrade To An Overweight Energy profit margins are linked to underlying commodity prices. BCA Commodity and Energy strategists’ view is that the medium-term supply/demand backdrop is highly supportive of the current energy pricing dynamics and that the oil price is expected to stay high, at around its current level, for the next two years. They also note that upside price risk is increasing going forward, due to inadequate capex. Current operating margins remain well below the previous cyclical peak (Chart 11) and are expected to increase by 7.74 percentage points over the next 12 months. Although the price of oil has risen above the breakeven levels, energy companies are reluctant to invest in capex due to pressure from shareholder activists and newly found financial discipline. As a result, prices are likely to remain high until “high prices cure high prices”. In the meantime, energy producers are returning cash to shareholders – a unique bonus in the current world starved for yield. Chart 11The Street Expects the Energy Sector Margins To Expand. We concur...
The Street Expects the Energy Sector Margins To Expand. We concur...
The Street Expects the Energy Sector Margins To Expand. We concur...
Oil demand is expected to stay robust on the back of the global economic recovery, especially with an increase in consumption by airlines that are resuming international travel. Case in point: ExxonMobil (XOM) “anticipates demand improvement in its downstream segment with a continued economic recovery.” Upgrade Energy from an Equal Weight to an Overweight Financials – Overweight: O/W Banks, EW Insurance 2021 was a blockbuster year for banks on the back of the booming M&A and IPO activity. However, to achieve sustainable profitability, they need to jumpstart the loan growth process. There are early signs that lending is likely to pick up next year (Chart 12). According to JPM: "The customers who typically contribute to credit card loan growth are starting to spend the savings built up from the pandemic at a faster clip, suggesting they could be getting closer to taking on debt again" Regional banks already see the green shoots. According to Key Bank:"We are pleased with the trajectory of our loan growth." Chart 12Early Signs Of Lending Picking Up
Early Signs Of Lending Picking Up
Early Signs Of Lending Picking Up
Insurance companies are faring worse than Banks. Higher costs of labor and materials result in higher replacement costs, and higher customer payouts. However, insurers succeed in incorporating these higher expenses into pricing. While sell-side analysts anticipate margins will decline, (Chart 13) we believe that they may surprise on the upside: High operating leverage, improving pricing power (Chart 14) and growing demand for loans will contribute to strong profitability. Further, BCA expects the 10-year Treasury yield will rise to 2.0% - 2.25% by the end of 2022, supporting wider net interest margins. Chart 13While The Street Has Doubts About The Financial Sector Margins, We Are Constructive...
While The Street Has Doubts About The Financial Sector Margins, We Are Constructive...
While The Street Has Doubts About The Financial Sector Margins, We Are Constructive...
Chart 14Pricing Power Is Improving
Pricing Power Is Improving
Pricing Power Is Improving
Healthcare - Overweight: O/W Medical Equipment and Services, EW Pharma In July we published a report on the Healthcare sector, titled “Checking The Pulse: Deep Dive Into The Health Care Sector.” In this report, we upgraded the Healthcare sector to an overweight. Today, we reiterate the call. First, in a slowdown stage of the business cycle, Healthcare tends to outperform. Second, the Healthcare sector is one of the most resilient sectors profitability-wise as, being defensive by nature, its sales are unaffected by changes in economic demand. The street expects margins to expand by over 2% over the next 12 months (Chart 15). Further, there is still significant pent-up demand for health care services, and specifically for elective procedures – the most lucrative segment of the Healthcare market. Pricing power has recently picked up (Chart 16). Companies concur that life is getting better: According to JNJ:” many of the hospitals and other providers have to pay more for their input, and that's going to be reflected in the economics as we go forward. And of course, all that is reflected in how we price going forward”. Chart 15The Healthcare Margins Are Posed To Widen
The Healthcare Margins Are Posed To Widen
The Healthcare Margins Are Posed To Widen
Chart 16After A Prolonged Decline, Healthcare Pricing Power Is Finally On The Rise
After A Prolonged Decline, Healthcare Pricing Power Is Finally On The Rise
After A Prolonged Decline, Healthcare Pricing Power Is Finally On The Rise
Consumer Staples - Underweight Our sector margins scorecard has identified Consumer Staples as a sector most susceptible to a margin squeeze. Sell-side expects margins to contract by 2% (Chart 17). This is a sector that has low operating leverage which indicates that the marginal cost of producing each additional unit is high, and is particularly vulnerable to rising input costs. At the same time pricing power of the sector is likely to wane: companies were able to raise prices throughout 2021, and now pricing power is over four standard deviations above the five-year average (Chart 18). Raising prices in the environment when fiscal stimulus is in the rearview mirror, against a backdrop of negative real wage growth, will be challenging. Walmart surely knows its customers: It decided to “absorb higher costs and keep prices low for customers all across the business.” Operating Margins of Consumer Staples are likely to contract in 2022. Chart 17Consumer Staples Margins Are Expected To Plunge
Consumer Staples Margins Are Expected To Plunge
Consumer Staples Margins Are Expected To Plunge
Chart 18Pricing Power Is Not Sustainable
Pricing Power Is Not Sustainable
Pricing Power Is Not Sustainable
Investment Implications Our analysis indicates that companies in most sectors have reached their peak margins in Q3-2021. Looking ahead, there will be distinct profitability tracks, with some sectors expanding margins while others will experience margin compression. Sectors that have higher operating leverage, pent-up demand left over from the pandemic slowdown, and whose pricing power may still increase will fare best. Our scorecard screened all the 11 sectors based on these conditions, and Financials, Energy, Healthcare, and Utilities have the best shot at maintaining and even expanding their margins. We have been overweight Financials and Healthcare in our portfolios for a while now, and the expectation of resilient profitability only reinforces our conviction. We are upgrading Energy from neutral to an overweight on the back of the expected margin expansion and high oil price target. We are still underweight Utilities which we consider as a bond proxy, unlikely to outperform in a rising rates environment. Bottom Line In this report, we introduce a framework to rank the S&P 500 sectors based on the expected resilience of their margins. Factors we consider are operating leverage, pricing power, pent-up demand, and sell-side margin expectations. As a result of the analysis, we believe that Financials, Energy, Healthcare, and Utilities are posed for strong profitability in 2022. Irene Tunkel Chief Strategist, US Equity Strategy irene.tunkel@bcaresearch.com Appendix: Chart 19
CHART 19
CHART 19
Chart 20
CHART 20
CHART 20
Chart 21
CHART 21
CHART 21
Chart 22
CHART 22
CHART 22
Chart 23
CHART 23
CHART 23
Chart 24
CHART 24
CHART 24
Chart 25
CHART 25
CHART 25
Chart 26
CHART 26
CHART 26
Chart 27
CHART 27
CHART 27
Chart 28
CHART 28
CHART 28
Chart 29
CHART 29
CHART 29
Chart 30
CHART 30
CHART 30
Footnotes 1 Pricing power is calculated by finding the difference between how much the industry has been able to increase prices and the change in the cost of the raw materials due to inflation. For example, for airlines, pricing power would be measured as the difference in the airfare CPI and jet fuel inflation. The exact calculation is industry specific. Industries are rolled up into sector indices and the market index. Recommended Allocation
Dear Client, There will be no report next week as we will be working on our Quarterly Strategy Outlook, which will be published the following week. In the meantime, please keep an eye out for BCA Research’s Annual Outlook, featuring long-time BCA client Mr. X, who visits towards the end of each year to discuss the economic and financial market outlook for the year ahead. Best regards, Peter Berezin Chief Global Strategist Highlights Inflation in the US, and to a lesser extent, in other major economies, will follow a “two steps up, one step down” trajectory of higher highs and higher lows. While inflation will fall in the first half of next year as goods prices stabilize, an overheated labor market will cause inflation to re-accelerate into 2023. The Fed will be slow to respond to high inflation, implying that monetary policy will remain accommodative next year. This should help propel stocks to new highs. Chinese stimulus will offset much of the drag from a weaker domestic property market. The dollar is a high momentum currency, so we wouldn’t bet against the greenback in the near term. Nevertheless, with “long dollar” now a consensus trade, we would position for a weaker dollar over a 12-month horizon. A depreciating dollar next year should help non-US equities, especially beleaguered emerging market stocks. The dollar will strengthen anew in 2023, as the Fed is forced to turn more hawkish, and global equities begin to buckle. From Ice To Fire In past reports, we have contended that inflation in the US, and to a lesser extent, in other major economies, would follow a “two steps up, one step down” trajectory of higher highs and higher lows. We are currently near the top of those two steps. The pandemic ushered in a major re-allocation of spending from services to goods (Chart 1). US inflation should dip over the next 6-to-9 months as the demand for goods decelerates and supply-chain disruptions abate. Chart 1The Pandemic Caused A Major Shift In Spending From Services To Goods
The Pandemic Caused A Major Shift In Spending From Services To Goods
The Pandemic Caused A Major Shift In Spending From Services To Goods
CHart 2Those With Low Paid Jobs Are Enjoying Stronger Wage Gains
Those With Low Paid Jobs Are Enjoying Stronger Wage Gains
Those With Low Paid Jobs Are Enjoying Stronger Wage Gains
The respite from inflation will not last long, however. The labor market is heating up. So far, most of the wage growth has been at the bottom end of the income distribution (Chart 2). Wage growth will broaden over the course of 2022, setting the scene for a price-wage spiral in 2023. We doubt that either fiscal or monetary policy will tighten fast enough to prevent such a spiral from emerging. As a result, US inflation will surprise meaningfully on the upside. Our view has no shortage of detractors. In this week’s report, we address the main counterarguments in a Q&A format: Q: What makes you think that service spending will rebound fast enough to offset the drag from weaker goods consumption? Chart 3Inventory Restocking Could Be A Source Of Growth Next Year
Inventory Restocking Could Be A Source Of Growth Next Year
Inventory Restocking Could Be A Source Of Growth Next Year
A: There is still a lot of pent-up demand for goods. Try calling any auto dealership. You will hear the same thing: “We have nothing in stock now, but if you put in an order today, you might get a vehicle in 3-to-6 months.” Thus, durable goods sales are unlikely to weaken quickly. And with inventories near record low levels, firms will need to produce more than they sell (Chart 3). Inventory restocking will support GDP growth. As for services, real spending in the US grew by 7.9% in the third quarter, an impressive feat considering that this coincided with the Delta-variant wave. Service growth will stay strong in the fourth quarter. The ISM non-manufacturing index jumped to a record high of 66.7 in October, up from 61.9 in September. The Atlanta Fed’s GDPNow model is tracking real PCE growth of 9.2% in Q4. Goldman’s Current Activity Indicator has hooked up (Chart 4).
Chart 4
Q: Aren’t you worried that spending on services might stall next year? A: Not really. Chart 5 shows the percentage change in real spending for various types of services from January 2020 to September 2021, the last month of available data.
Chart 5
Chart 6
The greatest decline in spending occurred in those sectors that were most directly affected by the pandemic. Notably, spending on movie theaters, amusement parks, and live entertainment in September was still down 46% on a seasonally-adjusted basis compared to last January. Hotel spending was down 22%. Spending on public transport was down 26%. Only spending on restaurants was back to normal. The number of Covid cases has once again started to trend higher in the US, so that path to normalization will take time (Chart 6). Nevertheless, with vaccination rates still edging up and new antiviral drugs set to hit the market, it is reasonable to assume that many of the hardest-hit service categories will recover next year. Q: What about medical services? Some have speculated that the shift to telemedicine will require much lower spending down the road. A: It is true that spending on outpatient services in September was $43 billon below pre-pandemic levels. However, over two-fifths of that shortfall was in dental services, which are not amenable to telemedicine. Spending on dental services was down 16% from its January 2020 levels, compared to 6% for physician services. A more plausible theory is that many people are still worried about venturing to the doctor’s or dentist’s office. In addition, a lot of elective procedures were canceled or postponed due to the pandemic. Clearing that backlog will lift medical spending next year. Chart 7The Flow Of Savings Has Fallen Back To Pre-Pandemic Levels But The Stock Of Accumulated Savings Remains High
The Flow Of Savings Has Fallen Back To Pre-Pandemic Levels But The Stock Of Accumulated Savings Remains High
The Flow Of Savings Has Fallen Back To Pre-Pandemic Levels But The Stock Of Accumulated Savings Remains High
In any case, the cost of a telemedicine appointment is typically no different from an in-person one. And, to the extent that telemedicine does become more widespread, this could encourage more people to seek medical assistance. Lastly, even if spending on certain services does not fully recover after the pandemic, this will probably simply result in a permanent increase in spending on goods. The only way that overall consumer spending will falter is if the savings rate rises, which seems unlikely to us. Q: Why do you say that? The savings rate has been very high throughout the pandemic. A: The savings rate did spike during the pandemic, but that was mainly because fewer services were available, and because households were getting transfer payments from the government. Now that these payments have ended, the savings rate has dropped to 7.5%, roughly where it was prior to the pandemic. There is good reason to think the savings rate will keep falling next year. Households are sitting on $2.3 trillion in excess savings, most of which reside in bank deposits (Chart 7). As they run down those savings, consumption will rise in relation to income. The household deleveraging cycle is over. After initially plunging during the pandemic, credit card balances are rising (Chart 8). Banks are eager to make consumer loans (Chart 9). Household net worth has risen by over 100% of GDP since the start of the pandemic (Chart 10). As we discussed three weeks ago, the wealth effect alone could boost annual consumer spending by up to 4% of GDP. Chart 8APost-GFC Deleveraging Has Ended And People Are Swiping Credit Cards Again Following The Pandemic Scare
Post-GFC Deleveraging Has Ended And People Are Swiping Credit Cards Again Following The Pandemic Scare
Post-GFC Deleveraging Has Ended And People Are Swiping Credit Cards Again Following The Pandemic Scare
Chart 8BPost-GFC Deleveraging Has Ended And People Are Swiping Credit Cards Again Following The Pandemic Scare
Post-GFC Deleveraging Has Ended And People Are Swiping Credit Cards Again Following The Pandemic Scare
Post-GFC Deleveraging Has Ended And People Are Swiping Credit Cards Again Following The Pandemic Scare
Chart 9Banks Are Easing Credit Standards For Consumer Loans
Banks Are Easing Credit Standards For Consumer Loans
Banks Are Easing Credit Standards For Consumer Loans
Chart 10A Record Rise In Household Net Worth
A Record Rise In Household Net Worth
A Record Rise In Household Net Worth
Q: Household wealth could fall as the Fed starts tapering and eventually raising rates. Wouldn’t that cool the economy? A: The taper is a fait accompli, and markets are already pricing in rate hikes starting in the second half of next year. If the Fed were to signal its intention to raise rates more quickly than what has been priced in, then home prices and stocks could certainly weaken. We do not think the Fed will pivot in a more hawkish direction before the end of next year, however. The Fed’s estimate of the neutral rate is only 2.5%, a big step down from its estimate of 4.25% in 2012. The market’s view is broadly in line with the Fed’s (Chart 11). Despite the upward move in realized inflation, long-term inflation expectations remain in check – expected inflation 5-to-10 years out in the University of Michigan survey has increased from 2.3% in late 2019 to 2.9%, bringing it back to where it was between 2010 and 2015. The 5-year/ 5-year forward TIPS breakeven inflation rate is near the bottom end of the Fed’s comfort zone (Chart 12). Chart 11The Fed And Investors Still Believe In Secular Stagnation
The Fed And Investors Still Believe In Secular Stagnation
The Fed And Investors Still Believe In Secular Stagnation
Chart 12Long-Term Inflation Expectations Are Not Yet A Concern For The Fed
Long-Term Inflation Expectations Are Not Yet A Concern For The Fed
Long-Term Inflation Expectations Are Not Yet A Concern For The Fed
Q: What about fiscal policy? Isn’t it set to tighten sharply next year? A: The US budget deficit will decline next year. However, this will happen against the backdrop of strong private demand growth. Moreover, budget deficits are likely to remain elevated in the post-pandemic period. This week, President Biden signed a $1.2 trillion infrastructure bill into law, containing $550 billion in new spending. BCA’s geopolitical strategists expect Congress to pass a $1.5-to-$2 trillion social spending bill using the reconciliation process. All in all, the IMF foresees the US cyclically-adjusted primary budget deficit averaging 4.9% of GDP between 2022 and 2026, compared to 2.0% of GDP between 2014 and 2019 (Chart 13).
Chart 13
Chart 14While Overall Consumption Has Recovered, Business Spending and Direct Government Expenditures Remain Below Trend
While Overall Consumption Has Recovered, Business Spending and Direct Government Expenditures Remain Below Trend
While Overall Consumption Has Recovered, Business Spending and Direct Government Expenditures Remain Below Trend
It should also be noted that government spending on goods and services has been quite weak over the past two years (Chart 14). The budget deficit surged because transfer payments exploded. Unlike direct government spending, which is set to accelerate over the next few years, households saved a large share of transfer payments. Thus, the fiscal multiplier will increase next year, even as the budget deficit shrinks. Q: We have focused a lot on demand, but what about supply? There are over 4 million fewer Americans employed today than before the pandemic and yet the job openings rate is near a record high. Chart 15Despite A Notable Decline, There Are Still A Lot Of People Avoiding Work Because Of Worries About Contracting Or Transmitting Covid
Despite A Notable Decline, There Are Still A Lot Of People Avoiding Work Because Of Worries About Contracting Or Transmitting Covid
Despite A Notable Decline, There Are Still A Lot Of People Avoiding Work Because Of Worries About Contracting Or Transmitting Covid
A: Some people who left the workforce will regain employment. According to the Census Bureau’s Household Pulse Survey, there are still 2.5 million people not working because they are afraid of catching or transmitting the virus (Chart 15). That said, some workers may remain sidelined for a while longer. The very same survey also revealed that about 8 million of the 100 million workers currently subject to vaccine mandates say that “they will definitely not get the vaccine.” In addition, about 3.6 million workers have retired since the start of the pandemic, about 1.2 million more than one would have expected based on pre-existing demographic trends. Most of these retirees will not work again. Lifestyle choices may keep others from seeking employment. Female labor participation has declined much more during the pandemic and than it did during the Great Recession (Chart 16). While many mothers will re-enter the labor force now that schools have reopened, some may simply choose to stay at home.
Chart 16
The bottom line is that the pandemic has reduced labor supply at a time when labor demand remains very strong. This is likely to exacerbate the labor shortage. Q: Any chance that higher productivity will offset some of the damage to the supply side of the economy from decreased labor participation? A: US labor productivity did increase sharply during the initial stages of the pandemic. However, that appears to have been largely driven by composition effects in which low-skilled, poorly-paid service workers lost their jobs. As these low-skilled workers have returned to the labor force, productivity growth has dropped. The absolute level of productivity declined by 5.0% at an annualized rate in the third quarter, leading to an 8.3% increase in labor costs. It is telling that productivity growth has been extremely weak outside the US (Chart 17). This gives weight to the view that the pandemic-induced changes in business practices have not contributed to higher productivity, at least so far. It is also noteworthy that a recent study of 10,000 skilled professionals at a major IT company revealed that work-from-home policies decreased productivity by 8%-to-19%, mainly because people ended up working longer. Increased investment spending should eventually boost productivity. Core capital goods orders, which lead corporate capex, are up 18% since the start of the pandemic (Chart 18). However, the near-term impact of increased investment spending will be to boost aggregate demand, stoking inflation in the process.
Chart 17
Chart 18US Capex Should Pick Up
US Capex Should Pick Up
US Capex Should Pick Up
Q: We have spoken a lot about the US, but the world’s second biggest economy, China, is facing a massive deflationary shock from the implosion of its real estate market. Could that deflationary impulse potentially cancel out the inflationary impulse from an overheated US economy? A: You are quite correct that inflation has risen the most in the US. While inflation has picked up in Europe, this mainly reflects base effects (Chart 19). Inflation in China has fallen since the start of the pandemic despite booming exports. There are striking demographic parallels between China today and Japan in the early 1990s. The bursting of Japan’s property bubble corresponded with a peak in the country’s working-age population (Chart 20). China’s working-age population has also peaked and is set to decline by more than 40% over the remainder of the century. Chart 19The US Stands Out As The Inflation Leader
The US Stands Out As The Inflation Leader
The US Stands Out As The Inflation Leader
Chart 20Demographic Parallels Between China And Japan
Demographic Parallels Between China And Japan
Demographic Parallels Between China And Japan
That said, there are important differences between the two nations. In 1990, Japan was a rich economy; output-per-hour was nearly 70% of US levels. China is still a middle-income economy; output-per-hour is only 20% of US levels (Chart 21). China has the ability to outgrow some of its problems in a way that Japan did not. In addition, Chinese policymakers have learned from some of Japan’s mistakes. They have been trying to curb the economy’s dependence on property development; real estate development investment has fallen from 12% of GDP in 2014 to less than 10% of GDP (Chart 22). China is still building too many new homes, but unlike Japan in the 1990s, the government is likely to pursue stimulus measures to compensate for a shrinking property sector. This should keep the economy from entering a deflationary slump.
Chart 21
Chart 22Real Estate Investment Has Peaked In China
Real Estate Investment Has Peaked In China
Real Estate Investment Has Peaked In China
Q: Let’s bring this back to markets. What is the main investment takeaway from your view? A: The main takeaway is that investors should remain bullish on stocks and other risk assets for the next 12 months but be prepared to turn more cautious in 2023. The neutral rate of interest in the US is higher than generally assumed. This means that monetary policy is currently more accommodative than widely believed, which is good for stocks. Unfortunately, it also means that a policy error is likely: The Fed will keep rates too low for too long, causing the economy to overheat. Chart 23Bank Stocks Tend To Outperform When Yields Rise
Bank Stocks Tend To Outperform When Yields Rise
Bank Stocks Tend To Outperform When Yields Rise
This overheating will not be evident over the next six months. As we noted at the outset of this report, the US economy is currently at the top of the proverbial two steps in our projected “two steps up, one step down” trajectory for inflation. The cresting in durable goods inflation will provide a temporary respite from inflationary worries, even as the underlying long-term driver of higher inflation – an increasingly tight labor market – gains traction. Strong consumer demand and persistent labor shortages will incentivize companies to invest in new capacity and automate production. This will benefit industrial stocks and select tech names. Rising bond yields will also boost bank shares (Chart 23). A country’s current account balance is simply the difference between what it saves and what it invests. With savings on the downswing and investment on the upswing, the US will find it increasingly difficult to finance its burgeoning trade deficit. The US dollar is a high momentum currency, so we wouldn’t necessarily bet against the greenback in the near term (Chart 24). Nevertheless, with “long dollar” now a consensus trade, we would position for a weaker dollar over a 12-month horizon (Chart 25).
Chart 24
Chart 25Long Dollar Is A Crowded Trade
Long Dollar Is A Crowded Trade
Long Dollar Is A Crowded Trade
Chart 26A Depreciating Dollar Next Year Should Help Non-US Equities
A Depreciating Dollar Next Year Should Help Non-US Equities
A Depreciating Dollar Next Year Should Help Non-US Equities
A depreciating dollar next year should help non-US equities, especially beleaguered emerging markets (Chart 26). The dollar will strengthen anew in 2023, as the Fed is forced to turn more hawkish, and global equities begin to buckle. Peter Berezin Chief Global Strategist pberezin@bcaresearch.com Global Investment Strategy View Matrix
Image
Special Trade Recommendations
Image
Current MacroQuant Model Scores
Image
Over the past few weeks, we have received numerous questions on the interplay between the S&P 500 earnings and the forward P/E multiple. The clients are asking how much earnings need to grow for the S&P 500 forward multiple to come down from the hefty 21.5x towards a historical average of 18x. To answer this question, we have created a matrix that summarizes permutations of changes in the index price and earnings growth and their effects on the resulting forward multiple. If we assume that the price of the S&P 500 does not budge, and investors get a 0% return over the next 12 months, earnings will have to grow by about 30% over the next 12 months for the multiple to come down to 18x – hardly a realistic scenario. If the S&P 500 returns 5%, then 30% earnings growth will result in the 19.6x multiple. The sell-side analysts currently expect a 10% earnings growth over the next twelve months: With no change in the price of the index, the resulting multiple will be 21.5x. If the S&P 500 returns 5%, the multiple will move to 23.2x. Bottom Line: Strong earnings growth does not justify elevated valuations, and re-rating is hardly in the cards.
Image
October new home prices fell for the second consecutive month in China (see The Numbers). Given how highly leveraged the Chinese property sector is, a continued decline in home prices would be an unwelcome development for Chinese policymakers. It raises the…
Highlights Why have Value stocks underperformed so much during the past decade? The rise in intangible assets is likely the most important reason since traditional valuation metrics are no longer an accurate measure of intrinsic value. Value stocks today have a larger negative tilt to Quality than they did in the past. This has hurt Value due to Quality's outperformance. Value's underperformance is not just the result of the relative performance of a few sectors or industries, although this has played a role. Falling interest rates have not been the main driver of Value’s underperformance as they can only account for a small portion of returns. “Migration”, or mean-reversion in and out of value buckets, has declined since the Great Financial Crisis, possibly because of an increase in monopoly power. But even this cannot fully account for the underperformance since 2012. We propose that investors who wish to invest in Value screen for Quality. They should also express their Value tilts in sectors with few intangibles, such as Energy or Materials. More sophisticated stock pickers can adjust earnings and book values for intangibles. Asset allocators who invest only in indices should stay away from a structural allocation to Value. Feature Chart 1No Premium From Value Stocks Over The Last Four Decades
No Premium From Value Stocks Over The Last Four Decades
No Premium From Value Stocks Over The Last Four Decades
Betting on cheap stocks has been a cornerstone of equity investing for decades. The rationale is simple: Stocks which are undervalued, according to some measure of intrinsic value, will eventually converge up to their fair value, on average, while stocks that are overvalued will converge down, on average. Historically, this bet on mean-reversion has proven successful – low price-to-book stocks have outperformed high price-to-book stocks by more than 3% per annum since 1927. However, the recent decades have put Value investing to the test. The Value factor, as defined by Fama and French, has not provided a structural premium in the US large cap space since the late 1970s (Chart 1, panel 1). Commercial Value indices haven’t been any more successful: Value aggregates by MSCI, Russell, and S&P have either underperformed or performed in line with the market benchmark over the same time frame (Chart 1, panel 2). The current situation presents a difficult dilemma. On the one hand, buying Value could be a tremendous opportunity. By several measures, Value stocks are the most undervalued they have been since the end of the tech bubble, right before they went on a historic run (Chart 2). Academic work has argued that these deep value spreads tend to be positively correlated with long-term outperformance of Value stocks.1 In a world of sky-high valuations and with equities and bonds projected to deliver very low returns over the next decade, a cheap return stream would be a fantastic addition to most portfolios. Chart 2Value Stocks Are Really Cheap
Value Stocks Are Really Cheap
Value Stocks Are Really Cheap
Chart 3
And yet, Value has become so popular, that many investors are now worried that the Value premium may no longer exist. This worry is not without merit. Several studies have shown that factors lose a sizable portion of their premium once they appear in academic literature2 (Chart 3). Other issues, such as the inability of valuation metrics to properly account for intrinsic value in the modern economy, have also led some investors to seriously question whether buying Value indices will deliver excess returns in the future. So what is the right answer? Why has Value underperformed so much? Is the beaten down Value factor a generational buying opportunity? Or will it continue its decline going forward? In this report we try to answer these questions. Using a company-level dataset from our BCA Research Equity Analyzer (EA), as well as drawing on the latest academic research, we assess the evidence behind Five Theories On Value’s Underperformance. Once we determine which explanations have merit and which do not, we conclude by providing some guidelines on how investors should consider the Value factor going forward in our Investment Implications section. A word of caution: We have constructed our sample of companies to roughly resemble the sample used by MSCI World. Thus, the conclusions from our analysis based on the EA dataset should be relevant to Value indices in general. However, be advised that the methodology that EA uses is different from other commercial Value indices. Specifically, the EA methodology is more aggressive in its positioning and uses a wider array of metrics. For clarity, Table 1 shows the metrics used by EA compared to other Value indices. If you wish to know more on how the methodology works, please refer to the Appendix. Table 1Value Factor Methodologies
Mythbusting The Value Factor
Mythbusting The Value Factor
Also, please note that our report will not deal with the cyclical outlook for Value. While it is entirely possible that a period of cyclical growth could help Value stocks outperform, the question we are trying to answer is whether buying cheap versus expensive stocks still provides a structural premium over the long term. While the Global Asset Allocation service does not use the Value versus Growth framework for equity allocation, our colleagues from our Global Investment Strategy service have written extensively on why they believe investors should pivot to Value on a cyclical basis.3 Five Theories On Value’s Underperformance Chart 4More To The Underperformance Of Value Than Sector Tilts
More To The Underperformance Of Value Than Sector Tilts
More To The Underperformance Of Value Than Sector Tilts
Theory #1: The underperformance of Value indices is purely a result of their sector composition Some investors suggest that Value stocks’ large underweight of mega-cap tech, as well as their overweight in Financials and Energy, have been responsible for Value’s woes over the past decade. However, our research suggests that this theory is not entirely correct. A Value index with the same sector and industry weightings as the Developed Markets (DM) benchmark has still underperformed by more than 15% since 2010 (Chart 4, panel 1). Sector and industry composition have been responsible for about a third of the underperformance of the DM Value index. What about excluding the FAANGM stocks? Again, the story is similar. Even when omitting these stocks from our investment universe, Value stocks have still underperformed by almost the same amount as a regular Value composite (Chart 4, panel 2). Finally, we can also look at the performance of cheap versus expensive stocks within each industry. Chart 5A shows that cheap stocks have underperformed expensive stocks in 18 and 17 out the 24 GICS Level 2 industries in DM and in the US, respectively, since 2012 (roughly corresponding to the peak in relative performance in the EA Value index). Even on an equally-weighted basis, which eliminates the effects of large companies, cheap stocks have underperformed expensive stocks in both the average and median industry (Chart 5B).
Chart 5
Chart 5
Verdict: Myth. The underperformance of cheap versus expensive stocks has been broad. While sector and industry dynamics have certainly been an important factor, Value's underperformance is not just the result of a few companies, sectors, or industries. Chart 6Value Likes Rising Yields...
Value Likes Rising Yields...
Value Likes Rising Yields...
Theory #2: The decline in interest rates is to blame for the underperformance of Value Another reason used to explain the underperformance of Value is the secular decline in interest rates. The reasoning goes as follows: Cash flows from growth stocks are set to be received further into the future, while cash flows from Value stocks are closer to the present. Using a Discounted Cash Flow model, one can show that all else being equal, a decline in the discount rate should result in a relatively higher increase in the present value for Growth stocks versus Value stocks. There is some evidence in support of this theory. While prior to 2010, Value and interest rates had an inconsistent relationship, the beta of cheap stocks to the monthly change in the 10-year US Treasury yield has increased markedly over the past 10 years (Chart 6, panel 1). On the other hand, the beta of expensive stocks to yields has become increasingly more negative. A similar situation occurs when we use the yield curve. Cheap stocks tend to exhibit higher excess returns whenever it steepens, while expensive stocks do so when it flattens (Chart 6, panel 2). Importantly, these relationships are not purely a result of Value’s exposure to banks. Value stocks excluding financials also show a strong positive relationship to both the 10-year yield and yield curve slope versus their growth counterparts (Chart 7). But while this relationship is statistically significant, it fails to be economically significant. Our analysis shows that the betas to either interest rates or the slope of the yield curve only explain a small fraction of the performance of cheap or expensive stocks (Chart 8). This result is in line with the research from Maloney and Moskowitz, which showed that the vast majority of the decline in Value in recent years could not be explained by interest rates.4 Chart 7...Even When Excluding Financials...
...Even When Excluding Financials...
...Even When Excluding Financials...
Chart 8...But Yields Don't Explain Much
...But Yields Don't Explain Much
...But Yields Don't Explain Much
Verdict: Myth. Cheap stocks have an increasingly positive beta to both the 10-year yield and the slope of the yield curve, whereas expensive stocks have an increasingly negative beta. However, while these betas are statistically significant, they can only account for a small portion of Value's underperformance. Theory #3: A decline in market mean-reversion is responsible for the underperformance of Value In a seminal paper, Fama and French describe the process of migration.5 Migration is when stocks move across different value buckets: For example, when stocks in the cheap bucket migrate to the neutral and expensive buckets, and when stocks in the expensive bucket migrate to the neutral or cheap buckets. Historically, this process of mean-reversion has provided a significant share of the Value premium. However, migration has declined significantly over the past decade (Chart 9, panel 1). The amount of market cap migrating each month as a percentage of total market cap has declined from over 12% before the GFC to less than 8% currently. Importantly, this decline in migration has been broad-based. Neither cheap, neutral, nor expensive stocks are moving to other valuation cohorts at the same rates that prevailed in the past (Chart 9, panel 2). The market has become much more ossified: Value stocks remain Value stocks, Neutral stocks remain Neutral stocks, and Growth stocks remain Growth stocks.5 Chart 9What Happens In Value Now Stays In Value
What Happens In Value Now Stays In Value
What Happens In Value Now Stays In Value
Chart 10Market Concentration Could Be The Reason Why Migration Has Declined
Market Concentration Could Be The Reason Why Migration Has Declined
Market Concentration Could Be The Reason Why Migration Has Declined
Why has migration declined? One theory is that industries have increasingly become more monopolistic, which means that it has become harder for new entrants to gain market share (Chart 10). Meanwhile market leaders are able to grow at an above-average pace thanks to their large network effects.6 What has been the role of this decreased migration in the performance of Value? A paper written by Arnott, Harvey, Kalesnik, and Linainmaa showed that while the returns attributable to migration have decreased over the past 15 years, this change is still not strong enough to explain the deep underperformance in Value.7 Our own research assigns it a relatively larger weight, with migration accounting for a little less than half of the underperformance of Value since 20128 (Table 2). Table 2Return Attribution Of Cheap And Expensive Stocks
Mythbusting The Value Factor
Mythbusting The Value Factor
Verdict: Somewhat True. Migration has declined since the GFC, possibly because of an increase in monopoly power. While this decline has certainly played a role in the underperformance of Value, it explains, at most, less than half of the drawdown since 2012. Theory #4: Value has underperformed because it is increasingly a play on junk stocks
Chart 11
It is a well-known empirical fact that cheap stocks tend to have lower Quality than expensive stocks. Conceptually this makes sense: Companies with higher profitability, more stability, and less leverage should trade at a valuation premium, whereas low income, high-debt companies should trade at a discount. However, this gap in Quality between cheap and expensive stocks is not always the same. Consider the composition of cheap and expensive stocks in 2000 – the eve of the tech bubble crash. About a third of expensive stocks were also junk (low quality), whereas 36% were quality stocks (Chart 11). Today, this composition is much different: Only about a fifth of the market capitalization of expensive stocks is junk, whereas quality stocks now make up 44% of the overall expensive cohort. On the other hand, the Quality of cheap stocks has deteriorated: Cheap junk stocks are now 37% of the cheap cohort versus 29% in 2000. Importantly, the difference in Quality between cheap and expensive stocks tends to be a good predictor for value returns (Chart 12). A big gap in the Quality factor often implies lower returns of cheap versus expensive stocks, whereas a small gap implies higher returns. These results are in line with similar research which has shown that Quality, or Quality proxies like profitability, can be used to enhance the Value factor.9 Chart 12Value Does Well When The Quality Gap Is Small
Value Does Well When The Quality Gap Is Small
Value Does Well When The Quality Gap Is Small
Why is this the case? As we have discussed in the past, Quality has been one of the best performing factors over the past 30 years - likely driven by powerful behavioral biases as well as by the incentives in the money management industry.10 As a result, taking an overly negative position on this factor over a long enough period eventually eats away at the Value premium. Verdict: True. Value stocks today have a larger negative tilt to Quality than they did in the past. This negative tilt has hurt Value as excess returns of cheap stocks tend to be dependent on their Quality gap to expensive stocks. Theory #5: Value has underperformed because traditional valuation metrics are no longer a reliable indicator of intrinsic value How exactly to measure whether a company is cheap or expensive has been a matter of debate since the very beginnings of Value investing. Benjamin Graham famously cautioned against using book value as a measure of intrinsic value, preferring a more holistic approach. Today most index providers use a combination of traditional valuation metrics like price-to-book and price-to-earnings to build Value indices. It is fair to ask if these measures are still relevant for today’s companies. Intangible investment has become a much larger part of the economy, having surpassed tangible investment in the US in the late 1990s (Chart 13). However, both US GAAP and IFRS are very restrictive on the capitalization of R&D activities, which are known to originate valuable intangible assets.11 Other types of intangible capital such as unique production processes or customer lists are normally also expensed within SG&A expenses and are never capitalized unless there is an acquisition. This means that both the book value and earnings of intangible-heavy companies could be inadequate estimates of their true intrinsic value.
Chart 13
Is there any evidence that this is the case? Using our EA dataset, we confirm that expensive companies generally have higher R&D expenditures as a percent of sales than cheap companies (Chart 14). Importantly, we see that the performance of Value within low R&D stocks is much better than the performance within high R&D stocks (Chart 15). This is line with the work of Dugar and Pozharny, who found that the value relevance for both earnings and book values has declined for high intangible companies, while it has stayed stable for low-intangible companies.12 This suggests that traditional valuation measures are losing their relevance as intangible-heavy companies become a larger part of the economy.13 Chart 14Growth Stocks Spend More On Intangibles
Growth Stocks Spend More On Intangibles
Growth Stocks Spend More On Intangibles
Chart 15Are Traditional Metrics Underestimating Intrinsic Value In High-Intangible Companies?
Are Traditional Metrics Underestimating Intrinsic Value In High-Intangible Companies?
Are Traditional Metrics Underestimating Intrinsic Value In High-Intangible Companies?
The effect of intangibles on traditional valuation metrics can also give us a clue as to why Value has performed well in some industries but not in others. Using a measure of intangible intensity derived by Dugar and Pozharny14 – which includes identifiable intangible assets, intellectual capital (as proxied by R&D spending), and organizational capital (as proxied by SG&A spending) – we can see that Value has done relatively better in industries with lower intangible intensity while it has performed relatively worse in industries with higher intangible intensity (Chart 16).
Chart 16
Verdict: True. Value performs better when considering only companies with low R&D expenses or industries with low-intangible intensity. This suggests that the rise in intangible assets might be responsible for the underperformance of cheap stocks, as traditional valuation metrics may no longer be an accurate measure of intrinsic value in intangible-heavy companies or industries. Investment Implications Chart 17Investors Can Invest In Value Within Low-Intangible Sectors
Investors Can Invest In Value Within Low-Intangible Sectors
Investors Can Invest In Value Within Low-Intangible Sectors
What does our analysis mean for investors? Aside from the most well-known practices to improve the performance of Value – for example, using a wide array of valuation metrics, exploiting value in small stocks, or using equal-weighted indices to avoid the effect of sector weightings or large companies15 – we would recommend investors first screen cheap stocks for quality to avoid Value traps. Investors should also account for the failure of traditional metrics to measure intangible assets. This can be done in two ways: The first is to take Value tilts only on intangible-light sectors such as Energy and Materials – for example, allocating only to the cheapest oil and materials stocks. For the last decade, the cheapest Energy and Materials companies have outperformed their respective sectors, even while overall Value has cratered (Chart 17). Alternatively, more sophisticated stock pickers can adjust valuation ratios to account for intangibles. There is some promise to this approach. Arnott, Harvey, Kalesnik, and Linainmaa showed that even a crude adjustment to the HML (High-Minus-Low) index consistently outperforms the regular value factor16 (Chart 18). What about asset allocators who invest only in broad indices? We would recommend that they stay away from structural allocations to commercial Value indices altogether. While it is true that sector rotations or interest-rate movements could benefit value on a short-term basis, in the long term, the negative Quality tilt of Value stocks should be a drag on returns. Additionally, it remains a big risk that indices based on traditional measures are underestimating intangible value. This underestimation will only get worse as the economy becomes more digitalized. Investors who wish to take advantage of trends like higher inflation or rising interest rates should just bet on cyclical sectors. So far this has been the right approach. Just this year, even though interest rates have increased by more than 60 basis points, and both Financials and Energy have outperformed IT by 13% and 30% respectively, Value stocks have underperformed Growth stocks (Chart 19). Chart 18Adjusting For Intangibles Improves Value
Adjusting For Intangibles Improves Value
Adjusting For Intangibles Improves Value
Chart 19Rates Rose, Financials And Energy Outperformed IT, And Yet Value Underperformed Growth
Rates Rose, Financials And Energy Outperformed IT, And Yet Value Underperformed Growth
Rates Rose, Financials And Energy Outperformed IT, And Yet Value Underperformed Growth
Appendix A Note On Methodology The Equity Analyzer service is a stock picking tool that applies a top-down approach to bottom-up stock picking. The crux of the platform is the BCA Score, which is a weighted composite of 30 cross sectionally percentile ranked factors. Within this report we focus on the value (price-to-earnings, price-to-book, price-to-cash, price-to-cash flow and price-to-sales) and quality (accruals, profitability, asset growth, and return on equity) factors used in the BCA Score model. Each of the factors are cross sectionally-percentile ranked, within the specified universe, where a score of 100% is best ranked stock according to that particular score. From here, we create the value and quality scores used in this report by equal-weighting and combining the scores from each value and quality factors. It is important to note that a high score does not mean the underlying value is high, but that it exhibits a better characteristic for forecasting future excess returns. For example, the stock with the highest value score would be considered the cheapest. The scores are re-calculated each period and applied on a one-period forward basis when calculating returns. To keep the analysis comparable the MSCI Data and relevant to our clients, we limit the universe of stocks to only those with a market capitalization greater than 1 billion USD. Also, unless otherwise specified, the scores are market-cap weighted when aggregated and all returns are in US dollars. Juan Correa-Ossa, CFA Editor/Strategist juanc@bcaresearch.com Lucas Laskey Senior Quantitative Analyst lucasl@bcaresearch.com Footnotes 1 Please see Clifford Asness, John M. Liew, Lasse Heje Pedersen, and Ashwin K Thapar, “Deep Value,” The Journal of Portfolio Management, 47-64 (11-40), 2021.2 2 Please see Andrew Y. Chen and Mihail Velikov, “Zeroing in on the Expected Returns of Anomalies,” Finance and Economic Discussion Series 2020-039, Board of Governors of the Federal Reserve. 3 Please see Global Investment Strategy Report, “Pivot To Value,” dated September 18, 2020. 4 Please see Thomas Maloney and Tobias J. Moskowitz, “Value and Interest Rates: Are Rates to Blame for Value’s Torments?” The Journal of Portfolio Management, 47-6 (65-87), 2021. 5 Please see Eugene Fama and Kenneth French, “Migration,” Financial Analyst Journal, 63-3 (48-58), 2007. 6 Please see Robert D. Arnott, Campbell R. Harvey, Vitali Kalesnik and Juhani T. Linainmaa, “Reports of Value’s death May Be Greatly Exaggerated,” Financial Analyst Journal, 77-1 (44-67), 2021. 7 Please see Robert D. Arnott, Campbell R. Harvey, Vitali Kalesnik and Juhani T. Linainmaa (2021). 8 Much like us, Lev and Srivastava assign a relatively bigger role to the decline in migration. For more details, please see Baruch Lev and Anup Srivastava, “Explaining the Recent Failure of Value Investing,” NYU Stern School of Business (2019). 9 Please see Clifford Asness, Andrea Frazzini, Ronen Israel and Tobias Moskowitz, “Fact, Fiction, and Value Investing,” The Journal of Portfolio Management, 42-1 (34-52), 2015. 10 Please see Global Asset Allocation Special Report, “Junk Disposal: The Quality Factor In Equity Markets,” dated September 8, 2020. 11 US GAAP requires both Research and Development costs to be expensed. IFRS prohibits capitalization of Research cost but allows it for Development costs provided that some conditions are met. For a further discussion on the accounting treatment of intangibles, please see Amitabh Dugar and Jacob Pozharny, “Equity Investing in the Age of Intangibles,” Financial Analyst Journal, 77-2 (21-42), 2021. 12 Please see Amitabh Dugar and Jacob Pozharny (2021). 13This also follows from research from Lev and Srivastava which showed that while capitalizing intangibles did not improve the value factor in the 1970s, it increased returns substantially after the 1990s. For more details, please see Baruch Lev and Anup Srivastava (2019). 14This measure excludes Banks, Diversified Financials, and Insurance. For more details, please see Amitabh Dugar and Jacob Pozharny (2021). 15Please see Clifford Asness, Andrea Frazzini, Ronen Israel and Tobias Moskowitz (2015). 16Please see Robert D. Arnott, Campbell R. Harvey, Vitali Kalesnik and Juhani T. Linainmaa (2021).
Highlights Geopolitical conflicts point to energy price spikes and could add to inflation surprises in the near term. However, US fiscal drag and China’s economic slowdown are both disinflationary risks to be aware of. Specifically, energy-producers like Russia and Iran gain greater leverage amid energy shortages. Europe’s natural gas prices could spike again. Conflict in the Middle East could disrupt oil flows. President Biden’s $1.75 trillion social spending bill is a litmus test for fiscal fatigue in developed markets. It could fail, and even assuming it passes it will not prevent overall fiscal drag in 2022-23. However, it is inflationary over the long run. China’s slowdown poses the chief disinflationary risk. But we still think policy will ease to avoid an economic crash ahead of the fall 2022 national party congress. We are closing this year’s long value / short growth trade for a loss of 3.75%. Cyclical sectors ended up being a better way to play the reopening trade. Feature Equity markets rallied in recent weeks despite sharp upward moves in core inflation across the world (Chart 1). Inflation is fast becoming a popular concern and we see geopolitical risks that could drive headline inflation still higher in the short run. We also see underrated disinflationary factors, namely China’s property sector distress and economic slowdown. Several major developments have occurred in recent weeks that we will cover in this report. Our conclusions: Biden’s domestic agenda will pass but risks are high and macro impact is limited. Congress passed Biden’s infrastructure deal and will probably still pass his signature social spending bill, although inflation is creating pushback. Together these bills have little impact on the budget deficit outlook but they will add to inflationary pressures. Energy shortages embolden Russia and Iran. Winter weather is unpredictable, the energy crisis may not be over. But investors are underrating Russia’s aggressive posture toward the West. Any conflict with Iran could also cause oil disruptions in the near future. US-China relations may improve but not for long. A bilateral summit between Presidents Joe Biden and Xi Jinping will not reduce tensions for very long, if at all. Climate change cooperation is an insufficient basis to reverse the cold war-style confrontation over the long run. Chart 1Inflation Rattles Policymakers
Inflation Rattles Policymakers
Inflation Rattles Policymakers
The investment takeaway is that geopolitical tensions could push energy prices still higher in the short term. Iran and Russia need to be monitored. However, China’s economic slowdown will weigh on growth. China poses an underrated disinflationary risk to our views. US Congress: Bellwether For Fiscal Fatigue While inflation is starting to trouble households and voters, investors should bear in mind that the current set of politicians have long aimed to generate an inflation overshoot. They spent the previous decade in fear of deflation, since it generated anti-establishment or populist parties that threatened to disrupt the political system. They quietly built up an institutional consensus around more robust fiscal policy and monetary-fiscal coordination. Now they are seeing that agenda succeed but are facing the first major hurdle in the form of higher prices. They will not simply cut and run. Inflation is accompanied by rising wages, which today’s leaders want to see – almost all of them have promised households a greater share of the fruits of their labor, in keeping with the new, pro-worker, populist zeitgeist. Real wages are growing at 1.1% in the US and 0.9% across the G7 (Chart 2). Even more than central bankers, political leaders are focused on jobs and employment, i.e. voters. Yet the labor market still has considerable slack (Chart 3). Almost all of the major western governments have been politically recapitalized since the pandemic, either through elections or new coalitions. Almost all of them were elected on promises of robust public investment programs to “build back better,” i.e. create jobs, build infrastructure, revitalize industry, and decarbonize the energy economy. Thus while they are concerned about inflation, they will leave that to central banks, as they will be loathe to abandon their grand investment plans. Chart 2Higher Wages: Real Or Nominal?
Higher Wages: Real Or Nominal?
Higher Wages: Real Or Nominal?
Still, there will be a breaking point at which inflation forces governments to put their spending plans on hold. The US Congress is the immediate test of whether today’s inflation will trigger fiscal fatigue and force a course correction. Chart 3Policymakers Fear Populism, Focus On Employment
Policymakers Fear Populism, Focus On Employment
Policymakers Fear Populism, Focus On Employment
President Biden’s $550 billion infrastructure bill passed Congress last week and will be signed into law around November 15. Now he is worried that his signature $1.75 trillion social spending bill will falter due to inflation fears. He cannot spare a single vote in the Senate (and only three votes in the House of Representatives). Odds that the bill fails are about 35%. Democratic Party leaders will not abandon the cause due to recent inflation prints. They see a once-in-a-generation opportunity to expand the role of government, the social safety net, and the interests of their constituents. If they miss this chance due to inflation that ends up being transitory then they will lose the enthusiastic left wing of the party and suffer a devastating loss in next year’s midterm elections, in which they are already at a disadvantage. Biden’s social bill is also likely to pass because the budget reconciliation process necessary to pass the bill is the same process needed to raise the national debt limit by December 3. A linkage of the two by party leaders would ensure that both pass … and otherwise Democrats risk self-inflicting a national debt default. The reconciliation bill is more about long-term than short-term inflation risk. The bill does not look to have a substantial impact on the budget outlook: the new spending is partially offset by new taxes and spread out over ten years. The various legislative scenarios look virtually the same in our back-of-the-envelope budget projections (Chart 4).
Chart 4
However, given that the output gap is virtually closed, this bill combined with the infrastructure bill will add to inflationary pressures. The fiscal drag will diminish by 2024, not coincidentally the presidential election year 2024, not coincidentally the presidential election year. The deficit is not expected to increase or decrease substantially between 2023 and 2024. From then onward the budget deficit will expand. The increased government demand for goods and services and the increased disposable income for low-earning families will add to inflationary pressures. Other developed markets face a similar situation: inflation is picking up, but big spending has been promised and normalizing budgets will marginally weigh on growth in the next few years (Chart 5). True, growth should hold up since the private economy is rebounding in the wake of the pandemic. But politicians will not be inclined to renege on campaign promises of liberal spending in the face of fiscal drag. The current crop of leaders is primed to make major public investments. This is true of Germany, Japan, Canada, and Italy as well as the United States. It is partly true in France, where fiscal retrenchment has been put on hold given the presidential election in the spring. The effect will be inflationary, especially for the US where populist spending is more extravagant than elsewhere.
Chart 5
The long run will depend on structural factors and how much the new investments improve productivity. Bottom Line: A single vote in the US Senate could derail the president’s social spending bill, so the US is now the bellwether for fiscal fatigue in the developed world. Biden is likely to pass the bill, as global fiscal drag is disinflationary over the next 12 months. Yet inflation could stay elevated for other reasons. And this fiscal drag will dissipate later in the business cycle. Russia And Iran Gain Leverage Amid Energy Crunch The global energy price spike arose from a combination of structural factors – namely the pandemic and stimulus. It has abated in recent weeks but will remain a latent problem through the winter season, especially if La Niña makes temperatures unusually cold as expected. Rising energy prices feed into general producer prices, which are being passed onto consumers (Chart 6). They look to be moderating but the weather is unpredictable. There is another reason that near-term energy prices could spike or stay elevated: geopolitics. Tight global energy supply-demand balances mean that there is little margin of safety if unexpected supply disruptions occur. This gives greater leverage to energy producers, two of which are especially relevant at the moment: Russia and Iran. Russia’s long-running conflict with the West is heating up on several fronts, as expected. Russia may not have caused the European energy crisis but it is exacerbating shortages by restricting flows of natural gas for political reasons, as it is wont to do (Chart 7). Moscow always maintains plausible deniability but it is currently flexing its energy muscles in several areas: Chart 6Energy Price Depends On Winter ... And Russia/Iran!
Energy Price Depends On Winter ... And Russia/Iran!
Energy Price Depends On Winter ... And Russia/Iran!
Ukraine: Russia has avoided filling up and fully utilizing pipelines and storage facilities in Ukraine, where the US is now warning that Russia could stage a large military action in retaliation for Ukrainian drone strikes in the still-simmering Russia-Ukraine war. Belarus: Russia says it will not increase the gas flow through the major Yamal-Europe natural gas pipeline in 2022 even as Belarus threatens to halt the pipeline’s operation entirely. Belarus, backed by Russia, is locked in a conflict with Poland and the EU over Belarus’s funneling of migrants into their territory (Chart 8). The conflict could lead not only to energy supply disruptions but also to a broader closure of trade and a military standoff.1 Russia has flown two Tu-160 nuclear-armed bombers over Belarus and the border area in a sign of support. Moldova: Russia is withholding natural gas to pressure the new, pro-EU Moldovan government.
Chart 7
Chart 8
Russia’s main motive is obvious: it wants Germany and the EU to approve and certify the new Nord Stream II pipeline. Nord Stream II enables Germany and Russia to bypass Ukraine, where pipeline politics raise the risk of shortages and wars. Lame duck German Chancellor Angela Merkel worked with Russia to complete this pipeline before the end of her term, convincing the Biden administration to issue a waiver on congressional sanctions that could have halted its construction. However, two of the parties in the incoming German government, the Greens and the Free Democrats, oppose the pipeline. While these parties may not have been able to stop the pipeline from operating, Russia does not want to take any chances and is trying to force Germany’s and the EU’s hand. The energy crisis makes it more likely that the pipeline will be approved, since the European Commission will have to make its decision during a period when cold weather and shortages will make it politically acceptable to certify the pipeline.2 The decision will further drive a wedge between Germany and eastern EU members, which is what Russia wants. EU natural gas prices will likely subside sometime next year and will probably not derail the economic recovery, according to both our commodity and Europe strategists. A bigger and longer-lasting Russian energy squeeze would emerge if the Nord Stream II pipeline is not certified. This is a low risk at this point but the next six months could bring surprises. More broadly, the West’s conflict with Russia can easily escalate from here. First, President Vladimir Putin faces economic challenges and weak political support. He frequently diverts popular attention by staging aggressive moves abroad. There is no reason to believe his post-2004 strategy of restoring Russia’s sphere of influence in the former Soviet space has changed. High energy prices give him greater leverage even aside from pipeline coercion – so it is not surprising that Russia is moving troops to the Ukraine border again. Growing military support for Belarus, or an expanded conflict in Ukraine, are likely to create a crisis now or later. Second, the US-Germany agreement to allow Nord Stream II explicitly states that Russia must not weaponize natural gas supply. This statement has had zero effect so far. But when the energy shortage subsides, the EU could pursue retaliatory measures along with the United States. Of course, Russia has been able to weather sanctions. But tensions are already escalating significantly. After Russia, Iran also gains leverage during times of tight energy supplies. With global oil inventories drawing down, Iran is in the position to inflict “maximum pressure” on the US and its allies, a role reversal from the 2017-20 period in which large inventories enabled the US to impose crippling sanctions on Iran after pulling out of the 2015 nuclear deal (Chart 9). Iran is rapidly advancing on its nuclear program and a new round of diplomatic negotiations may only serve to buy time before it crosses the “breakout” threshold of uranium enrichment capability as early as this month or next. In a recent special report we argued that there is a 40% chance of a crisis over Iran in the Middle East. Such a crisis could ultimately lead to an oil shock in the Persian Gulf or Strait of Hormuz. Chart 9Now Iran Can Use 'Maximum Pressure'
Now Iran Can Use 'Maximum Pressure'
Now Iran Can Use 'Maximum Pressure'
Bottom Line: Russia’s natural gas coercion of Europe could keep European energy prices high through March or May. More broadly Russia’s renewed tensions with the West confirm our view that oil producers gain geopolitical leverage amid the current supply shortages. Iran also gains leverage and its conflict with the US could lead to global oil supply disruptions anytime over the next 12 months. Until Nord Stream II is certified and a new Iranian nuclear agreement is signed, there are two clear sources of potential energy shocks. Moreover in today’s inflationary context there is limited margin of safety for unexpected supply disruptions regardless of source. Xi’s Historical Rewrite China continues to be a major source of risk for the global economy and financial markets in the lead-up to the twentieth national party congress in fall 2022. While Chinese assets have sold off this year, global risk assets are still vulnerable to negative surprises from China. The five-year political reshuffle in 2022 is more important than usual since President Xi Jinping was originally supposed to step down but will instead stick around as leader for life, like China’s previous strongmen Mao Zedong and Deng Xiaoping.3 Xi’s rejection of term limits became clear in 2017 and is not really news. But Xi will fortify himself and his faction in 2022 against any opposition whatsoever. He is extremely vigilant about any threats that could disrupt this process, whether at home or abroad. The Communist Party’s sixth plenary session this week highlights both Xi’s success within the Communist Party and the sensitivity of the period. Xi produced a new “historical resolution,” or interpretation of the party’s history, which is only the third such resolution. A few remarks on this historical resolution are pertinent: Mao’s resolution: Chairman Mao wrote the first such resolution in 1945 to lay down his version of the party’s history and solidify his personal control. It is naturally a revolutionary leftist document. Deng’s revision of Mao: General Deng Xiaoping then produced a major revision in 1981, shortly after initiating China’s economic opening and reform. Deng’s interpretation aimed to hold Mao accountable for “gross mistakes” during the Cultural Revolution and yet to recognize the Communist Party’s positive achievements in founding the People’s Republic. His version gave credit to the party and collective leadership rather than Mao’s personal rule. Two 30-year periods: The implication was that the party’s history should be divided into two thirty-year periods: the period of foundations and conflict with Mao as the party’s core and the period of improvement and prosperity with Deng as the core. Jiang’s support of Deng: Deng’s telling came under scrutiny from new leftists in the wake of Tiananmen Square incident in 1989. But General Secretary Jiang Zemin largely held to Deng’s version of the story that the days of reform and opening were a far better example of the party’s leadership because they were so much more stable and prosperous.4 Xi’s reaction to Jiang and Deng: Since coming to power in 2012, Xi Jinping has shown an interest in revising the party’s official interpretation of its own history. The central claim of the revisionists is that China could never have achieved its economic success if not for Mao’s strongman rule. Mao’s rule and the Communist Party’s central control thus regain their centrality to modern China’s story. China’s prosperity owes its existence to these primary political conditions. The two periods cannot be separated. Xi’s synthesis of Deng and Mao: Now Xi has written himself into that history above all other figures – indeed the communique from the Sixth Plenum mentions Xi more often than Marx, Mao, or Deng (Chart 10). The implication is that Xi is the synthesis of Mao and Deng, as we argued back in 2017 at the end of the nineteenth national party congress. The synthesis consists of a strongman who nevertheless maintains a vibrant economy for strategic ends.
Chart 10
What are the practical policy implications of this history lesson? Higher Country Risk: China’s revival of personal rule, as opposed to consensus rule, marks a permanent increase in “country risk” and political risk for investors. Autocratic governments lack institutional guardrails (checks and balances) that prevent drastic policy mistakes. When Xi tries to step down there will probably be a succession crisis. Higher Macroeconomic Risk: China is more likely to get stuck in the “middle-income trap.” Liberal or pro-market economic reform is de-emphasized both in the new historical resolution and in the Xi administration’s broader program. Centralization is already suppressing animal spirits, entrepreneurship, and the private sector. Higher Geopolitical Risk: The return to autocracy and the withdrawal from economic liberalism also entail a conflict with the United States, which is still the world’s largest economy and most powerful military. The US is not what it once was but it will put pressure on China’s economy and build alliances aimed at strategic containment. Bottom Line: China is trying to escape the middle-income trap, like Taiwan, Japan, and South Korea, but it is trying to do so by means of autocracy, import substitution, and conflict with the United States. These other Asian economies improved productivity by democratizing, embracing globalization, and maintaining a special relationship with the United States. China’s odds of succeeding are low. China will focus on power consolidation through fall 2022 and this will lead to negative surprises for financial markets. China Slowdown: The Disinflationary Risk While it is very unlikely that Xi will face serious challenges to his rule, strange things can happen at critical junctures. Therefore the regime will be extremely alert for any threats, foreign or domestic, and will ultimately prioritize politics above all other things, which means investors will suffer negative surprises. The lingering pandemic still poses an inflationary risk for the rest of the world while the other main risk is disinflationary: Inflationary Risk – Zero COVID: The “Covid Zero” policy of attempting to stamp out any trace of the virus will still be relevant at least over the next 12 months (Chart 11). Clampdowns serve a dual purpose since the Xi administration wants to minimize foreign interference and domestic dissent before the party congress. Hence the global economy can suffer more negative supply shocks if ports or factories are closed. Inflationary Risk – Energy Closures: The government is rationing electricity amid energy shortages to prioritize household heating and essential services. This could hurt factory output over the winter if the weather is bad. Disinflationary Risk – Property Bust: The country is still flirting with overtightening monetary, fiscal, and regulatory policies. Throughout the year we have argued that authorities would avoid overtightening. But China is still very much in a danger zone in which policy mistakes could be made. Recent rumors suggest the government is trying to “correct the overcorrection” of regulatory policy. The government is reportedly mulling measures to relax the curbs on the property sector. We are inclined to agree but there is no sign yet that markets are responding, judging by corporate defaults and the crunch in financial conditions (Chart 12).
Chart 11
Chart 12China Has Not Contained Property Turmoil
China Has Not Contained Property Turmoil
China Has Not Contained Property Turmoil
Evergrande, the world’s most indebted property developer, is still hobbling along, but its troubles are not over. There are signs of contagion among other developers, including state-owned enterprises, that cannot meet the government’s “three red lines.” 5 Credit growth has now broken beneath the government’s target range of 12%, though money growth has bounced off the lower 8% limit set for this year (Chart 13). China is dangerously close to overtightening. China’s economic slowdown has not yet been fully felt in the global economy based on China’s import volumes, which are tightly linked to the combined credit-and-fiscal-spending impulse (Chart 14). The implication is that recent pullbacks in industrial metal prices and commodity indexes will continue. Chart 13China Tries To Avoid Over-Tightening
China Tries To Avoid Over-Tightening
China Tries To Avoid Over-Tightening
Chart 14China Slowdown Not Yet Fully Felt
China Slowdown Not Yet Fully Felt
China Slowdown Not Yet Fully Felt
Until China eases policy more substantially, it poses a disinflationary risk and a strong point in favor of the transitory view of global inflation. It is difficult for China to ease policy – let alone stimulate – when producer prices are so high (see Chart 6 above). The result is a dangerous quandary in which the government’s regulatory crackdowns are triggering a property bust yet the government is prevented from providing the usual policy support as the going gets tough. Asset prices and broader risk sentiment could go into free fall. However, the party has a powerful incentive to prevent a generalized crisis ahead of the party congress. So we are inclined to accept signs that property curbs and other policies will be eased. Bottom Line: The full disinflationary impact of China’s financial turmoil and economic slowdown has yet to be felt globally. Biden-Xi Summit Not A Game Changer As long as inflation prevents robust monetary and fiscal easing, Beijing is incentivized to improve sentiment in other ways. One way is to back away from the regulatory crackdown in other sectors, such as Big Tech. The other is to improve relations with the United States. A stabilization of US ties would be useful before the party congress since President Xi would prefer not to have the US interfering in China’s internal affairs during such a critical hour. No surprise that China is showing signs of trying to stabilize the relationship. The US is apparently reciprocating. Presidents Biden and Xi also agreed to hold a virtual bilateral summit next week, which could lead to a new series of talks. The US Trade Representative also plans to restart trade negotiations. The plan is to enforce the Phase One trade deal, issue waivers for tariffs that hurt US companies, and pursue new talks over outstanding structural disputes. The Phase One trade deal has fallen far short of its goals in general but on the energy front it is doing well. China will continue importing US commodities amid global shortages (Chart 15).
Chart 15
Chart 15
The summit alone will have a limited impact. Biden had a summit with Putin earlier this year but relations could deteriorate tomorrow over cyber-attacks, Ukraine, or Belarus. However, there is some basis for the US and China to cooperate next year: Iran. Xi is consolidating power at home in 2022 and probably wants to use negotiations to keep the Americans at bay. Biden is pivoting to foreign policy in 2022, since Congress will not get anything done, and will primarily focus on halting Iran’s nuclear program. If China assists the US with Iran, then there is a basis for a reduction in tensions. The problem is not only Iran itself but also that China will not jump to enforce sanctions on Iran amid energy shortages. And China is not about to make sweeping structural economic concessions to the US as the Xi administration doubles down on state-guided industrial policy. Meanwhile the US is pursuing a long-term policy of strategic containment and Biden will not want to be seen as appeasing China ahead of midterm elections, especially given Xi’s reversion to autocracy. What about cooperation on climate change? The US and China also delivered a surprise joint statement at the United Nations climate change conference in Scotland (COP26), confirming the widely held expectation that climate policy is an area of engagement. These powers and Europe have a strategic interest in reducing dependency on Middle Eastern oil (Chart 16). Climate talks will begin in the first half of next year. However, climate cooperation is not significant enough alone to outweigh the deeper conflicts between the US and China. Moreover climate policy itself is somewhat antagonistic, as the EU and US are looking at applying “carbon adjustment fees” to carbon-intensive imports, e.g. iron and steel exports from China and other high-polluting producers (Chart 17). While the EU and US are not on the same page yet, and these carbon tariffs are far from implementation, the emergence of green protectionism does not bode well for US-China relations even aside from their fundamental political and military disputes.
Chart 16
Bottom Line: Some short-term stabilization of US-China relations is possible but not guaranteed. Markets will cheer if it happens but the effect will be fleeting. Chinese assets are still extremely vulnerable to political and geopolitical risks.
Chart 17
Investment Takeaways Gold can still go higher. Financial markets are pricing higher inflation and weak real rates. Gold has been our chief trade to prepare both for higher inflation and geopolitical risk. We are closing our long value / growth equity trade for a loss of 3.75%. We are maintaining our long DM Europe / short EM Europe trade. This trade has performed poorly due to the rally in energy prices and hence Russian equities. But while energy prices may overshoot in the near term, investors will flee Russian equities as geopolitical risks materialize. We are maintaining our long Korea / short Taiwan trade despite its being deeply in the red. This trade is valid over a strategic or long-term time horizon, in which a major geopolitical crisis and/or war is likely. Our expectation that China will ease policy to stabilize the economy ahead of fall 2022 should support Korean equities. Matt Gertken Vice President Geopolitical Strategy mattg@bcaresearch.com Footnotes 1 Over the past year President Alexander Lukashenko’s repression of domestic unrest prompted the EU to impose sanctions. Lukashenko responded by organizing an immigration scheme in which Middle Eastern migrants are flown into Belarus and funneled into the EU via Poland. The EU is threatening to expand sanctions while Belarus is threatening to cut off the Yamal-Europe pipeline amid Europe’s energy crisis. See Pavel Felgenhauer, “Belarus as Latest Front in Acute East-West Standoff,” Jamestown Foundation, November 11, 2021, Jamestown.org. 2 Both Germany and the EU must approve of Nord Stream II for it to enter into operation. The German Federal Network Agency has until January 8, 2022 to certify the project. The Economy Ministry has already given the green light. Then the European Commission has two-to-four months to respond. The EU is supposed to consider whether the pipeline meets the EU’s requirement that gas transport be “unbundled” or separated from gas production and sales. This is a higher hurdle but Germany’s clout will be felt. Hence final approval could come by March 8 or May 8, 2022. The energy crisis will put pressure for an early certification but the EU Commission may take the full time to pretend that it is not being blackmailed. See Joseph Nasr and Christoph Steitz, “Certifying Nord Stream 2 poses no threat to gas supply to EU – Germany,” Reuters, October 26, 2021, reuters.com. 3 Xi is not serving for an “unprecedented third term,” as the mainstream media keeps reporting. China’s top office is not constant nor were term limits ever firmly established. Each leader’s reign should be measured by their effective control rather than technical terms in office. Mao reigned for 27 years (1949-76), Deng for 14 years or more (1978-92), Jiang Zemin for 10 years (1992-2002), and Hu Jintao for 10 years (2002-2012). 4 See Joseph Fewsmith, “Mao’s Shadow” Hoover Institution, China Leadership Monitor 43 (2014), and “The 19th Party Congress: Ringing In Xi Jinping’s New Age,” Hoover Institution, China Leadership Monitor 55 (2018), hoover.org. 5 Liability-to-asset ratios less than 70%, debt-to-equity less than 100%, and cash-to-short-term-debt ratios of more than 1.0x. Strategic View Open Tactical Positions (0-6 Months) Open Cyclical Recommendations (6-18 Months) Open Trades & Positions
Image
Chart 1
Revisiting EV Revolution Structural Investment Theme
Revisiting EV Revolution Structural Investment Theme
In June of this year, we published a Special Report on EV Revolution, recommending clients to add exposure to the structural electric vehicles (EV) theme to their portfolios. We continue to be bullish about the space and are reiterating our call. While the EV Revolution theme transcends GICS definitions, the S&P Autos & Components index remains the industry group with the highest EV exposure. It is dominated by Tesla and legacy automakers, Ford, and GM. Since our June Special Report, the sector outperformed the market by 34% (Chart 1). In the report, we posited that The Autos & Components industry group is in the middle of a momentous transition to electric and autonomous-vehicle manufacturing thanks to technological advances in battery storage, AI, and radars. Further, we noted that the entire EV ecosystem will benefit from government support for decarbonization, the preferences of millennials for green tech, and cutting-edge technological innovation. The recent passage of the Infrastructure bill with its green provisions are a certain positive for EVs. Chart 2
Revisiting EV Revolution Structural Investment Theme
Revisiting EV Revolution Structural Investment Theme
Tesla dominates the Auto industry group and accounts for roughly 75% of its market cap, thus dwarfing all other constituents. It had an amazing run since we made the call, doubling since June 21, 2021, when the report was published. While we are not stock-pickers, we believe that Tesla is a poster child of the theme: it sold 241,300 in the third quarter alone, which is over 100,000 than the same quarter last year - compare that to 367,500 vehicles in all of 2019. Tesla’s profitability is growing steadily (Chart 2), and so far, it was able to fend off challenges from competitors. Legacy Automakers, while crimped by the chip shortages and supply chain disruptions, are also likely beneficiaries of the theme: costs are high, but rewards are worth it: Higher earnings and greater economic visibility regarding EV transition should lead to eventual rerating of the industry group. These carmakers are also turning into Growth stocks as an expected surge in earnings is far in the future. In Table 1, we summarize the most popular EV ETFs. A more detailed description of each investment vehicle is in the appendix of the original report.
Chart
Bottom Line: We believe that the EV/AV theme will continue to outperform the US equity market over the 3-12 months horizon.
Highlights There is a high risk of a global demand shortfall in 2022. This is because consumer demand for services will remain well below its pre-pandemic trend… …while the recent booming demand for goods is crashing back to earth. Stay overweight 30-year T-bonds. In the equity market, underweight the ‘reflation’ sectors: specifically, underweight banks and basic resources. Stay overweight animal care. Overweight the interactive entertainment sector (look out for a Special Report on this sector coming out very soon). Fractal analysis: Overweight gas distribution. Feature Chart of the WeekSpending On Services In The US Is Still Far Below The Pre-Pandemic Trend. Will It Catch Up In 2022?
Spending On Services In The US Is Still Far Below The Pre-Pandemic Trend. Will It Catch Up In 2022?
Spending On Services In The US Is Still Far Below The Pre-Pandemic Trend. Will It Catch Up In 2022?
With inflation surging, you would be forgiven for thinking that global demand is red-hot. Sadly, global demand is not red-hot. Two years after the pandemic began, the lynchpin of demand – consumer spending on services – remains far below its pre-pandemic trend. For example, US consumer spending on services is around $420 billion, or 5 percent, below where it should be (Chart I-1). A similar story holds true in the UK and France (Chart I-2 and Chart I-3). Chart I-2Spending On Services Is Still Far Below The Pre-Pandemic Trend In The UK...
Spending On Services Is Still Far Below The Pre-Pandemic Trend In The UK...
Spending On Services Is Still Far Below The Pre-Pandemic Trend In The UK...
Chart I-3...And France
...And France
...And France
Still, overall US consumer spending is on trend. Just. But only thanks to an unprecedented largesse of fiscal and monetary stimulus. Begging the question, what will happen when the stimulus ends? If overall stimulated spending is just on trend while spending on services is in deficit, it means that spending on goods is in a mirror-image $420 billion surplus. Which, given the smaller share of spending on goods, equates to 8 percent above where it should be. One misconception is that the surplus in goods spending is concentrated in durables. While this was true six months ago, two-thirds of the current surplus is in nondurables, dominated by clothing and shoes, food and drink at home, and games, toys and hobbies (Chart I-4). Chart I-4US Overspend On Durables Is Now $140 Bn, While Overspend On Nondurables Is $280 Bn
US Overspend On Durables Is Now $140 Bn, While Overspend On Nondurables Is $280 Bn
US Overspend On Durables Is Now $140 Bn, While Overspend On Nondurables Is $280 Bn
Looking ahead, if the demand for goods crashes back to earth, as seems to be happening now, then the demand for services will have to catch up to its pre-pandemic trend. Otherwise there will be a deficit in aggregate demand. So, the crucial question for 2022 is, will services spending catch up to its pre-pandemic trend? Services Spending Will Remain Well Below Its Pre-Pandemic Trend Many people believe that the deficit in US services spending is due to the underspend in bars, restaurants, and hotels. In fact, this is another misconception. The underspending on ‘food services and accommodations’ is now a negligible $30 billion out of the $420 billion deficit. In which case, where is the deficit? Surprisingly, the biggest component is a $160 billion underspend on health care (Chart I-5). In particular, the spending on ‘outpatient physician services’ levelled off a year ago well below its pre-pandemic level (Chart I-6). A plausible explanation is that many doctor’s appointments have shifted to online, requiring much lower spending. The result is that health care consumption has slowed its convergence to the pre-pandemic trend, implying that a deficit could be persistent. Chart I-5US Underspend On Health Care ##br##Is $160 Bn
US Underspend On Health Care Is $160 Bn
US Underspend On Health Care Is $160 Bn
Chart I-6US Spending On Physician Services Is Far Below The Pre-Pandemic Trend
US Spending On Physician Services Is Far Below The Pre-Pandemic Trend
US Spending On Physician Services Is Far Below The Pre-Pandemic Trend
A second major component of the deficit is a $110 billion underspend on recreation services, as consumers have shunned the large or dense crowds in amusement parks, sports centres, spectator sports, and theatres. Some of this shunning of crowds will be long-lasting (Chart I-7). Chart I-7US Underspend On Recreation Services Is $110 Bn
US Underspend On Recreation Services Is $110 Bn
US Underspend On Recreation Services Is $110 Bn
A third major component of the deficit is a $60 billion underspend on public transportation, as people have likewise shunned the personal proximity required in mass transit systems and aeroplanes. Some of this shunning of transport that requires personal proximity will also be long-lasting (Chart I-8). Chart I-8US Underspend On Public Transportation Is $60 Bn
US Underspend On Public Transportation Is $60 Bn
US Underspend On Public Transportation Is $60 Bn
Worryingly, the recent spending on both recreation services and public transportation has stopped converging with the pre-pandemic trend. Admittedly, this might be a blip due to the delta wave of the pandemic, and spending could re-accelerate once this wave subsides. On the other hand, it would be prudent to assume that the delta wave was not the last wave of the pandemic and that further waves could arrive in 2022. Pulling all of this together, large parts of services spending will remain persistently below their pre-pandemic trend. Eventually, new and innovative types of services will plug this deficit, but this will take time. Therefore, we conservatively estimate that, at the end of 2022, US consumer spending on services will still be below its pre-pandemic trend by at least $200 billion, or 2.5 percent. Other major economies, like the UK and France, will suffer similar deficits. Goods Spending Will Crash Back To Earth Let’s now switch to the other side of the ledger, and assess to what extent the underspend in services can be countered by an overspend in goods. Spending on durables is already crashing back to earth. A surplus of $500 billion in March has collapsed to $140 billion now, and we fully expect it to fall back to zero. The reason is that durables, by their very definition, provide long-duration utility. Meaning that there are only so many cars, smartphones, and gadgets that any person can own. But what about the current $280 billion surplus on nondurables – can that be sustained? The biggest component of the nondurables surplus is a $85 billion, or 20 percent, overspend on clothes and shoes. Some of this overspend is justified by a wardrobe transition to the post-pandemic way of working and living. But clothes and shoes, though classified as nondurable, are in fact quite durable. Meaning that once the wardrobe transition is complete, we do not expect people to spend 20 percent more on clothes and shoes than they did before the pandemic (Chart I-9). Chart I-9US Overspend On Clothes And Shoes Is $85 Bn
US Overspend On Clothes And Shoes Is $85 Bn
US Overspend On Clothes And Shoes Is $85 Bn
A second major component of the nondurables surplus is a $75 billion, or 7 percent, overspend on food and beverages at home. To a large extent, this has been a displacement of the underspending on eating and drinking out. But given that this underspend on eating and drinking out has almost normalised, we expect the overspend on eating and drinking at home to fade (Chart I-10). Chart I-10US Overspend On Food And Drink At Home Is $75 Bn
US Overspend On Food And Drink At Home Is $75 Bn
US Overspend On Food And Drink At Home Is $75 Bn
A third major component of the nondurables surplus is a $45 billion, or 16 percent, overspend on recreational items: games, toys, hobbies, and pets and pet products (Chart I-11 and Chart I-12). To a large extent, this has been a displacement of the underspend on recreation services involving crowds, which will last. Hence, we expect the nondurable surplus on recreational items also to last, to the benefit of the animal care sector and the interactive (electronic) entertainment sector. Chart I-11US Overspend On Games, Toys, And Hobbies Is $45 Bn
US Overspend On Games, Toys, And Hobbies Is $45 Bn
US Overspend On Games, Toys, And Hobbies Is $45 Bn
Chart I-12Spending On Pets Is ##br##Booming
Spending On Pets Is Booming
Spending On Pets Is Booming
Pulling all of this together, we expect the $140 billion surplus on durables to disappear fully, and the $280 billion surplus on nondurables to fade to well below $200 billion. Therefore, given that the deficit on services is likely to be above $200 billion, there is a high risk of a consumer demand deficit in 2022. Four Investment Conclusions The ultra-long end of the bond market is figuring out that without sustained above-trend demand, you cannot get sustained inflation. And to repeat, if demand is barely on trend after an unprecedented largesse of fiscal and monetary stimulus, then what will happen when the stimulus ends? All of which leads to four investment conclusions: Stay overweight 30-year T-bonds. In the equity market, underweight the ‘reflation’ sectors: specifically, underweight banks and basic resources. Stay overweight animal care. Overweight the interactive entertainment sector (look out for a Special Report on this sector coming out very soon). Gas Distribution Is Oversold Finally, one of the paradoxes of skyrocketing natural gas prices is that it has badly hurt the gas distributors which, for the most part, have not been able to pass on the higher prices in full to end users. The resulting margin squeeze has caused a sharp recent underperformance, which is now fragile on its 65-day/130-day composite fractal structure (Chart I-13). Chart I-13Gas Distribution Is Oversold
Gas Distribution Is Oversold
Gas Distribution Is Oversold
Given this fractal fragility combined with the recent correction in natural gas prices, a recommended trade would be to overweight global gas distribution versus banks, setting a profit target and symmetrical stop-loss at 5 percent. Dhaval Joshi Chief Strategist dhaval@bcaresearch.com Fractal Trading System Fractal Trades 6-Month Recommendations Structural Recommendations Closed Fractal Trades Indicators To Watch - Bond Yields Chart II-1Indicators To Watch - Bond Yields ##br##- Euro Area
Indicators To Watch - Bond Yields - Euro Area
Indicators To Watch - Bond Yields - Euro Area
Chart II-2Indicators To Watch - Bond Yields ##br##- Europe Ex Euro Area
Indicators To Watch - Bond Yields - Europe Ex Euro Area
Indicators To Watch - Bond Yields - Europe Ex Euro Area
Chart I-3Indicators To Watch - Bond Yields ##br##- Asia
Indicators To Watch - Bond Yields - Asia
Indicators To Watch - Bond Yields - Asia
Chart I-4Indicators To Watch - Bond Yields ##br##- Other Developed
Indicators To Watch - Bond Yields - Other Developed
Indicators To Watch - Bond Yields - Other Developed
Indicators To Watch - Interest Rate Expectations Chart I-5Indicators To Watch - Interest Rate Expectations
Indicators To Watch - Interest Rate Expectations
Indicators To Watch - Interest Rate Expectations
Chart I-6Indicators To Watch - Interest Rate Expectations
Indicators To Watch - Interest Rate Expectations
Indicators To Watch - Interest Rate Expectations
Chart I-7Indicators To Watch - Interest Rate Expectations
Indicators To Watch - Interest Rate Expectations
Indicators To Watch - Interest Rate Expectations
Chart I-8Indicators To Watch - Interest Rate Expectations
Indicators To Watch - Interest Rate Expectations
Indicators To Watch - Interest Rate Expectations
Highlights The bipartisan Infrastructure Investment and Jobs Act will increase US government non-defense spending to around 3% of GDP, a level comparable to the 1980s-90s and larger than the 2010s. Democrats are increasingly likely to pass their ~$1.75 trillion social spending bill, with odds at 65%. The budget reconciliation process necessary to pass this bill is also necessary to raise the national debt limit by December 3, so Congress is unlikely to fail. The Democratic spending bills will reduce fiscal drag very marginally in 2022-24 and will occasionally increase fiscal thrust thereafter. Republicans are unlikely to repeal much of the spending in coming years. Limited Big Government is a new strategic theme. The federal government is permanently taking a larger role in the economy – but this role will still be limited by voters, who do not favor socialism. Biden’s approval rating will stabilize at a low level. Immigration, crime, and especially inflation will determine the Democrats’ fate in the 2022 midterms. Gridlock is likely. The stock market has already priced the infrastructure bill and it will continue to rally on the rumor that reconciliation will pass. But growth has outperformed value, contrary to expectations. Feature Democrats in the House of Representatives finally passed the $1.2 trillion Infrastructure Investment and Jobs Act, which consists of $550 billion in brand new spending and $650 billion in a continuation of existing levels of spending to cover the next ten years. The legislation passed with 228 votes in the House, ten more than needed, due to 13 Republican votes, making it “bipartisan” (Chart 1). The contents of the bill are shown in Table 1. Republicans supported the bill because of its focus on traditional infrastructure – roads, bridges, ports – but they also agreed to more modern elements such as $65 billion on broadband Internet and $36 billion on electric vehicles and environmental remediation. Implementation of the bill will be felt in 2023-24, in time for the presidential election, as committees will need to be set up to identify and approve projects.
Chart 1
Table 1Itemized Infrastructure Plan
Closing The Loop On Infrastructure
Closing The Loop On Infrastructure
While $550 billion is not a lot in a world of multi-trillion dollar stimulus bills, nevertheless it makes for a 34% increase in federal non-defense investment to levels consistent with the 1980s-90s (Chart 2).
Chart 2
The new government spending will amount to 3% of GDP per year over the next ten years, a non-trivial amount of stimulus even though the big picture of the budget deficit remains about the same (Chart 3).
Chart 3
The passage of the infrastructure bill will increase, not decrease, the odds of Biden and the Democrats passing their $1.75 trillion social spending bill via the partisan budget reconciliation process. Subjectively we put the odds at 65% in the wake of infrastructure, although recent events suggest that the odds could be put even higher. While left-wing Democrats failed to link the infrastructure and social spending bills, as we argued, nevertheless the passage of infrastructure was a requirement for the key swing voter in the Senate, Joe Manchin of West Virginia. Manchin is negotiating on the reconciliation bill, suggesting he will vote for it, and he will ultimately capitulate because he will not want to be blamed for a default on the US national debt. The US will hit the national debt ceiling on December 3 and the only reliable means for the Democrats to raise the ceiling is reconciliation. The other critical moderate Democratic senator, Kyrsten Sinema of Arizona, seems to have capitulated, after securing a removal of corporate and high-income individual tax hikes from the bill. Far-left senators might make a last stand, holding up reconciliation and winning some last-minute concession. Six House Democrats refused to vote for the infrastructure bill (including New York House member Alexandria Ocasio-Cortez). However, progressives lost leverage after the Democrats’ losses in the off-year elections. Moreover the debt ceiling will force the hand of the progressives as well as the moderates. Any such hurdles will ultimately be steamrolled by the president and Democratic Party leaders. Combined with infrastructure, the net deficit impact of the infrastructure and reconciliation bills will range from $461 billion to $1 trillion (Table 2). Our scenarios vary based on how much credence we give to Democratic revenue raisers, since many of these are gimmicks and accounting tricks to make the bill look more fiscally responsible than it really is. At the most the US is looking at an increase in the budget deficit of less than 0.5% of GDP per year in the coming years. Table 2Biden Administration Tax-And-Spend Scenarios
Closing The Loop On Infrastructure
Closing The Loop On Infrastructure
Investors should think of Biden’s legislative efforts as very marginally reducing fiscal drag rather than increasing fiscal thrust, at least in the short run. The budget deficit is normalizing after hitting unprecedented peacetime extremes at the height of the global pandemic and social lockdowns. The shrinking deficit subtracts from aggregate demand in 2022-2024. But the new spending bills will remove a small part of that drag during these years, as highlighted in Chart 4. More importantly the US Congress is signaling that fiscal policy is back in action and that fiscal retrenchment is a long way off. Over the long run, new spending will add marginally to fiscal thrust and aggregate demand, suggesting that the US government’s contribution to the economy will grow a bit in the latter part of the 2020s, namely if Democratic legislation survives the 2024 election. For the most part it probably will, as it is very difficult to repeal entitlements or slash government spending even with Republican majorities, as witnessed with the Affordable Care Act (Obamacare) in 2017.
Chart 4
Chart 5Polarization Of Economic Sentiment Declining
Polarization Of Economic Sentiment Declining
Polarization Of Economic Sentiment Declining
The polarization of economic sentiment – i.e. divergence in partisan views of the economy – has fallen since the pandemic and will likely continue to fall as the business cycle continues (Chart 5). Both presidential candidates offered infrastructure packages – they only differed on how to fund it. With the government taking a larger role in the economy – and yet the Republicans likely to rebound in future elections – the result is one of our new strategic themes: limited big government. The heyday of “limited government,” from President Ronald Reagan through George W. Bush, has ended. But the new popular and elite consensus in favor of “Big Government” can be overrated – the US political system is defined by checks and balances that will limit the pace and magnitude of the big government trend, and at times even seem to reverse it. Hence investors should think of US fiscal policy and government role in the economy as limited big government. Political Implications Of Bipartisan Infrastructure President Biden’s approval rating has collapsed since this summer when he suffered from perceptions of incompetence on both the delta variant of COVID-19 and the withdrawal from Afghanistan. Democratic infighting, which delayed the passage of his legislation, also hurt him (Chart 6). However, these are all passing narratives, with the exception of the incompetence narrative, which could become a lasting threat to Biden if not addressed. Biden’s signing of the infrastructure bill will stabilize his approval rating. Biden will probably end up somewhere between Presidents Obama and Trump. Voters will most likely upgrade their assessment of his handling of the economy over the coming year, at least marginally. But on foreign policy he will remain extremely vulnerable since he faces numerous immediate crises in coming years. American presidential disapproval has trended upwards since the 1950s of President Eisenhower. Disapproval peaks during recessions and wars. As the economy improves, Biden’s disapproval will fall, but foreign crises and wars are likely in today’s fraught geopolitical environment (Chart 7).
Chart 6
Chart 7
A few opinion polls suggest that Republicans have taken the lead over the Democrats in generic opinion polling regarding support for the parties in Congress. These polls are outliers and may or may not become the norm over the next year. Democrats have fallen from their peaks but Republicans still suffer from significant internal divisions (Chart 8).
Chart 8
Voters continue to identify mostly as political independents, with a notable downtrend in the share of voters who see themselves as Republicans or Democrats in recent years (Chart 9). Independent voters have marked leanings, right or left. While the leftward lean of independents has peaked, they are not leaning to the right. The infrastructure bill and even reconciliation bill will support Democratic identification. But the sharp rise in immigration, crime, and potentially persistent inflation will support Republicans. These last will become the critical political issues going forward. The democratic socialist or progressive agenda has already been checked by voters and Democrats can only double down on that agenda at their own peril. The infrastructure bill’s passage may give a boost to perceptions of Democratic odds of maintaining the Senate in the 2022 midterm elections – that question is still up in the air, even as the House is very likely to return to Republican control (Chart 10). Chart 9Independent Voters Still Rule
Independent Voters Still Rule
Independent Voters Still Rule
An under-the-radar beneficiary of the bipartisan infrastructure bill is Congress itself. Since 2014, public approval of Congress has gradually recovered from historic lows. The level is still low, at 27%, but the upward trend is notable for suggesting that a fiscally active Congress gains popular approval (Chart 11). New social spending will also increase Congress’s image, first for “doing something,” and second for expanding the social safety net, which more than half of voters will approve.
Chart 10
Chart 11
Partisan gridlock after 2022 could reverse the trend, as Republicans may find or invent a reason to impeach President Biden in retribution for President Trump’s impeachments. But our best guess is that Congress will remain above its low point as long as fiscal support – limited big government – remains intact. Aggressive tax hikes or spending cuts, or a national debt default, could reverse the recovery of this institution. Investment Takeaways The infrastructure bill’s passage may have supported the recent rally in stocks but it is not the main driver. Infrastructure stocks had largely discounted the bill’s passage by spring and our BCA Infrastructure Basket has underperformed the broad market since then. In absolute terms, infrastructure stocks have reached new highs and show a rising trajectory (Chart 12). The infrastructure bill has not delivered as expected when it comes to sectors or investment styles. Cyclicals have outperformed defensives, as expected. But value stocks have hit new lows relative to growth stocks, contrary to our expectation this year (Chart 13). Chart 12Infrastructure Was Already Priced
Infrastructure Was Already Priced
Infrastructure Was Already Priced
Chart 13Wall Street Looks Well Beyond Infrastructure
Wall Street Looks Well Beyond Infrastructure
Wall Street Looks Well Beyond Infrastructure
External factors – namely China’s policy tightening and bumps in the global recovery – weighed on cyclicals and value plays, especially relative to Big Tech (Chart 14). Growth stocks have surged yet again on low bond yields, positive earnings surprises, and secular trends like innovation and digitization. The American economy looks robust as the year draws to a close. The service sector is recovering smartly from the delta variant. Non-manufacturing business activity is surging and new orders are exploding upward relative to inventories (Chart 15). Service sector employment has suffered from shortages. Chart 14External Factors Weigh On Infrastructure Plays
External Factors Weigh On Infrastructure Plays
External Factors Weigh On Infrastructure Plays
Chart 15Service Sector Recovery Underway
Service Sector Recovery Underway
Service Sector Recovery Underway
Inflation risks are trickling into consumer and voter consciousness as Christmas approaches and prices rise at the pump (Chart 16). The Democrats’ two big bills will mitigate the damage they face in next year’s midterm elections – the Senate is still in competition. But a persistent inflation problem will overwhelm their legislative accomplishments. Voters will connect the dots between large deficit spending and inflationary surprises (not to mention any Democratic changes that reinforce the extremely dovish stance of the Fed). The normal political cycle will count heavily against the Democrats in 2022 regardless of inflation. But voters simultaneously face historic spikes in immigration and crime – and the former, at least, will get worse and not better over the next 12 months. Predicting inflation is a mug’s game but wage growth suggests it will remain a substantial risk in 2022 – and the structural shift in favor of big government, even if it is limited big government due to the political cycle, is inflationary on the margin. Chart 16Voters Awakening To Inflation
Voters Awakening To Inflation
Voters Awakening To Inflation
Matt Gertken Vice President Geopolitical Strategy mattg@bcaresearch.com Appendix
Image
Image
Image
Image
Image
Image
Image
Image