Sectors
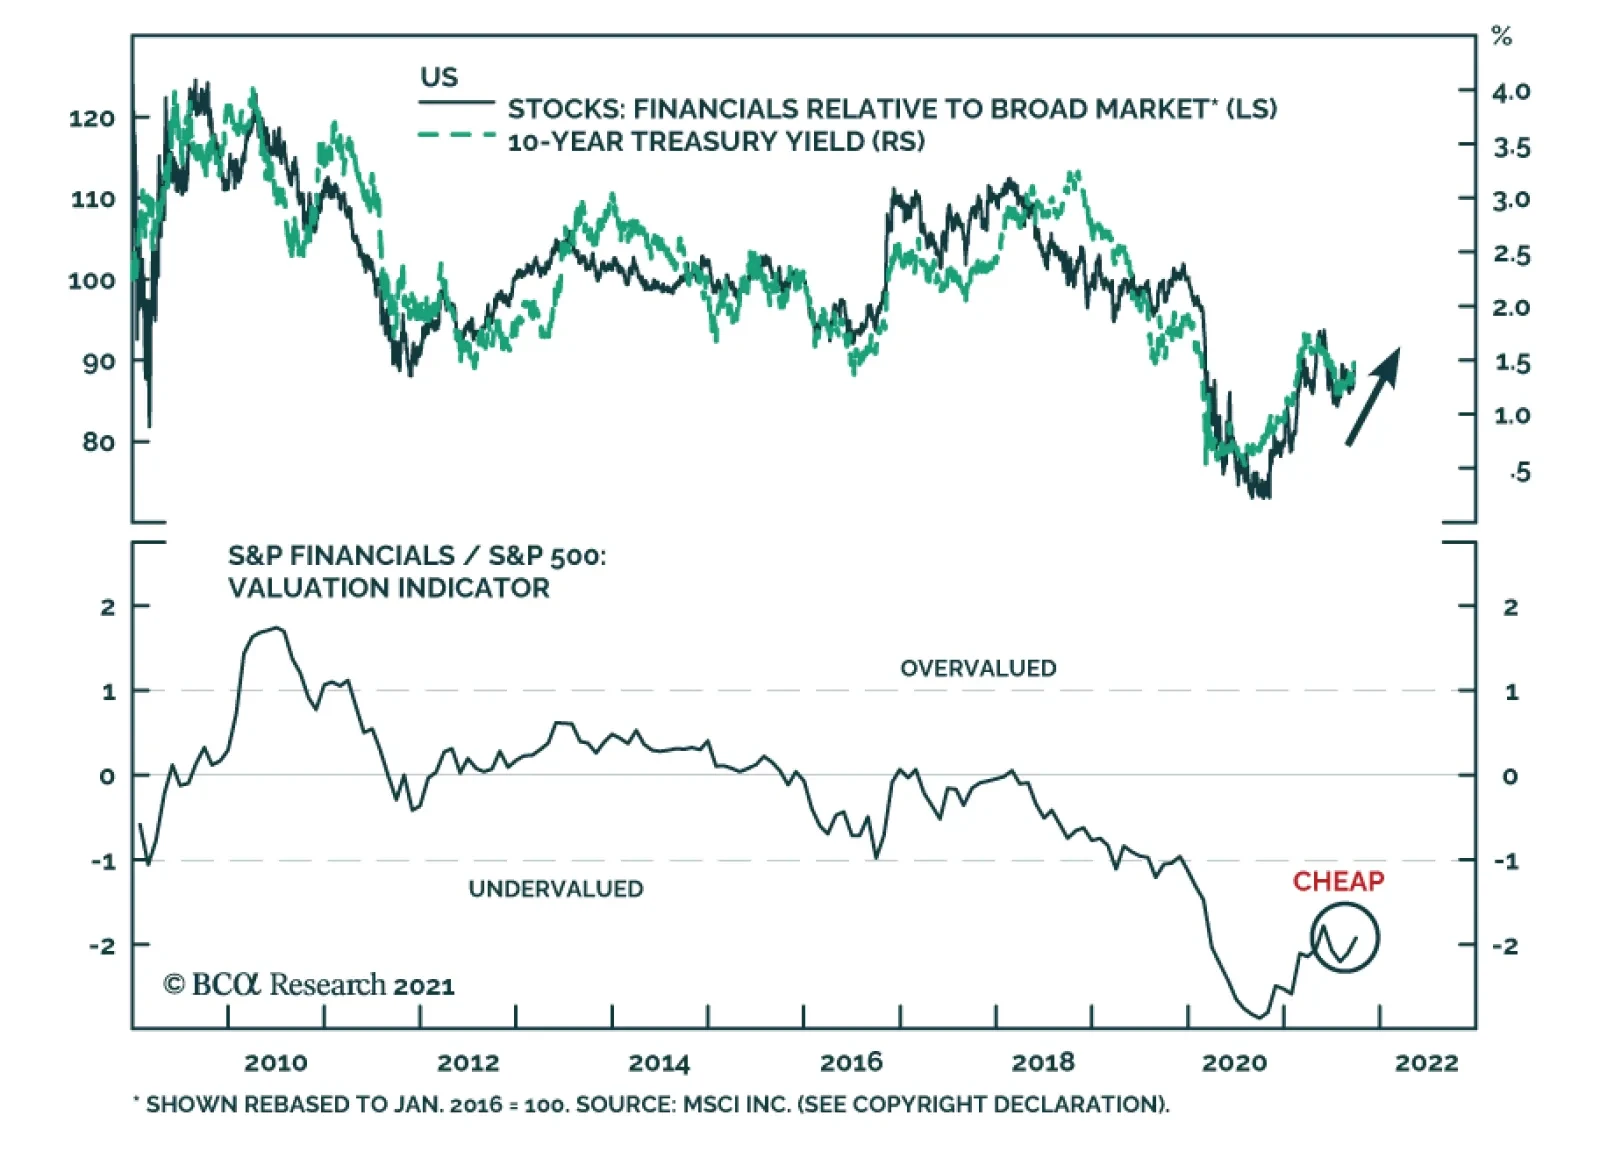
US Financials is among the best performing US equity sectors over the past three months. We expect these positive relative gains to continue. Financials will benefit from rising US bond yields over the coming year. Not only are higher interest rates…

August PPI reading came in at 8.3%. Naturally, many investors are wondering whether the companies will be able to pass their soaring input costs to the customers. An in-depth analysis of margins and pricing power requires a significant research effort. However, below are some examples illustrating our thinking process on the topic. We also included pricing power sector charts in the Appendix. Companies’ ability to hike prices is a function of the elasticity of demand, which is heterogeneous across industries and products. It also depends on product differentiation and competition in the industry. For some categories, such as consumer durables, pricing power has declined as prices reached the upper limit of affordability (Chart 1). As a result, durables goods manufacturers’ pricing power has peaked, and this sector is at a higher risk of margin squeeze. Margins of the Health Care sector have been under pressure for years (Chart 2). This can be tied back to Pharma being under perennial pressure from both politicians aiming to lower prescription drug prices, and from competition from the generics. Meanwhile, the Consumer Discretionary sector is in better shape thanks to pent-up demand for services and discretionary goods – consumers are in good financial health and are able to tolerate marginal prices increases. We expect discretionary and services industries to be able to maintain their margins. Bottom Line: The ability to exert pricing power and pass on costs to customers is highly industry-specific and can not be generalized. CHART 1
CHART 1
CHART 1
CHART 2
CHART 2
CHART 2
Appendix
CHART 3
CHART 3
CHART 4
CHART 4
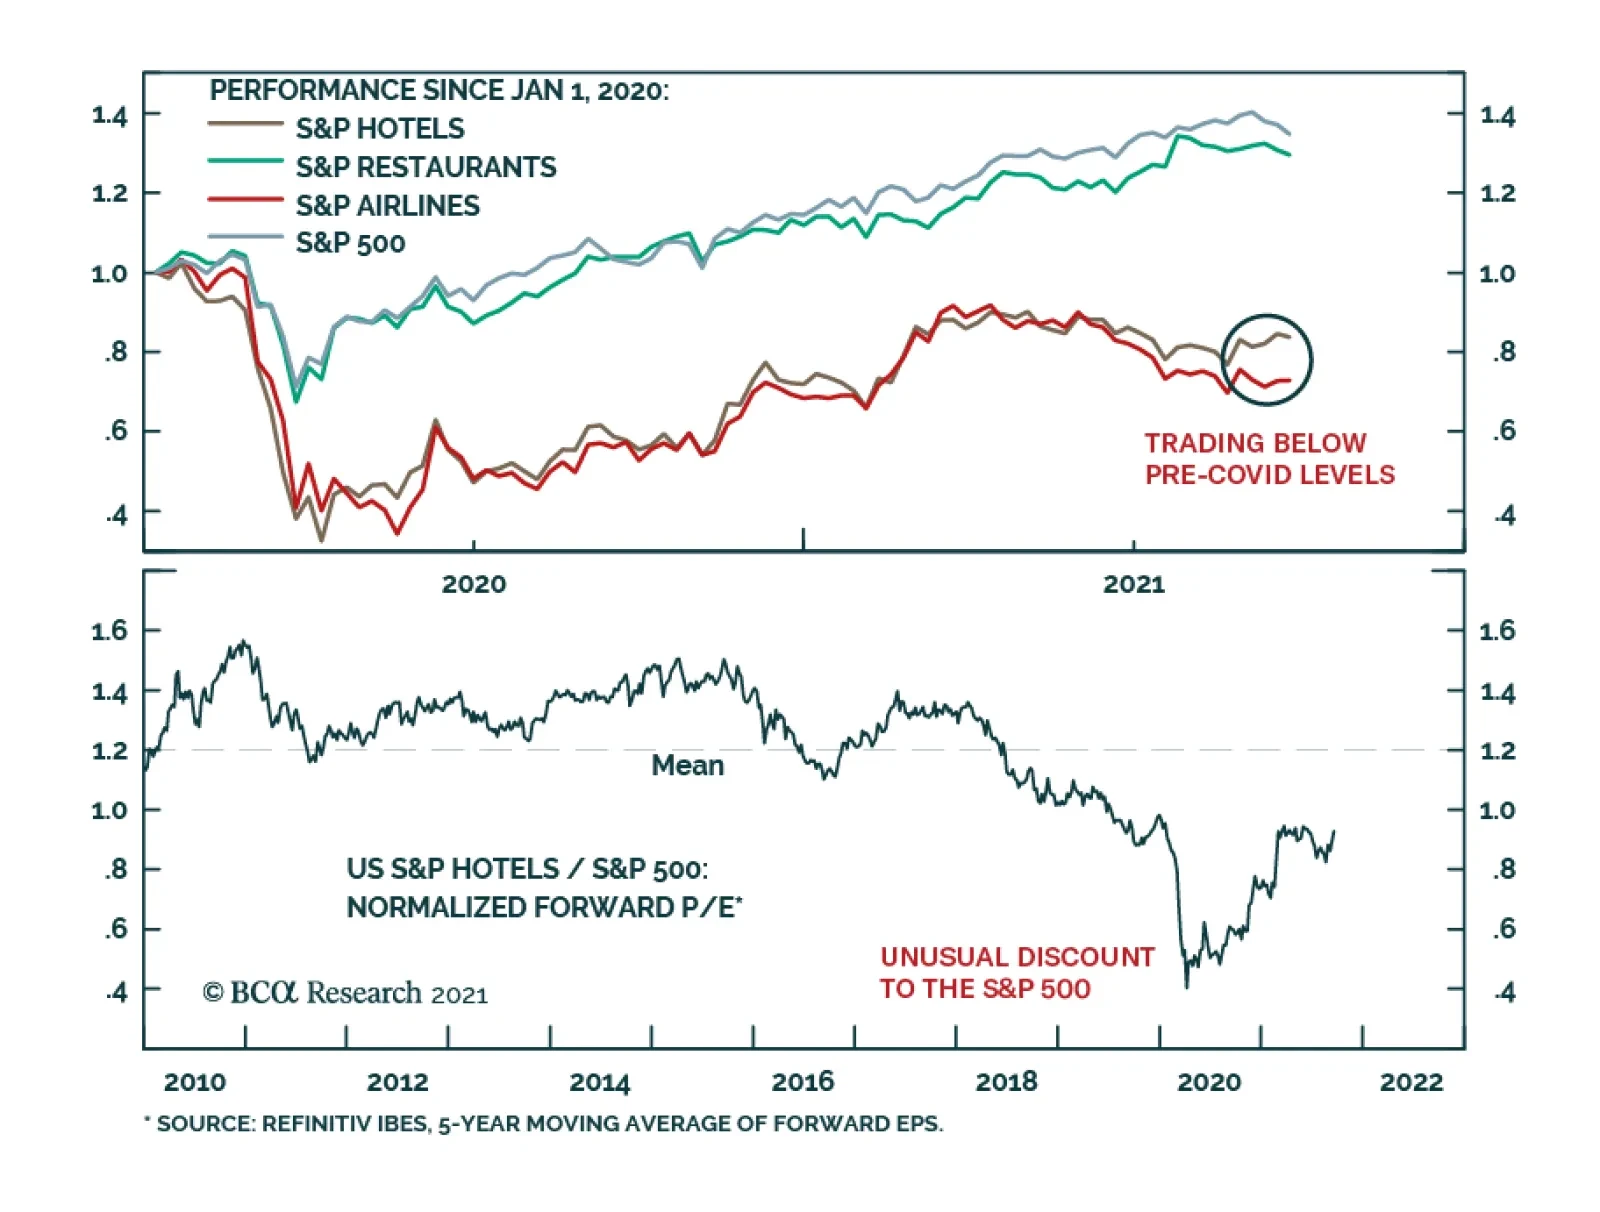
Highlights This is the second part of the publication, in which we provide an in-depth overview of Hotels, Restaurants, and Airlines, or the “travel complex” as we dubbed it. In last week’s report, we provided an overview of the macroeconomic backdrop, the Delta variant trajectory, and a “deep dive” into the hotel industry. We concluded Hotels is a sound tactical and cyclical investment, and we recommended an overweight. Airlines Less profitable trip mix and excess capacity: Domestic travel has rebounded to 2019 levels, while international and corporate travel are still lagging due to government and corporate restrictions (Chart 1). Some of the excess capacity is being redirected to domestic leisure travel, which has higher volume but is far less profitable. Airline cargo growth is a saving grace. The cost side of the airline business has its own challenges. Airlines have high fixed costs as they own or lease aircraft fleets. This creates a heavy financial burden during downturns. The price of jet fuel has increased to pre-pandemic levels. Labor costs are high due to the unionized work force and rising wages. Profitability is elusive: With airline revenues down 27% YoY in August 2021, and costs on the rise, it is hard to envision profitability without a return of international and business travel. Too much debt: Airlines’ net debt has risen significantly since the pandemic. Without positive cash flow generation, it will become harder and harder for them to meet their debt obligations. We have a negative outlook for airlines and are underweight the S&P Airlines index. Restaurants Defensive: Although the S&P Restaurant Industry resides within the pro-cyclical S&P Consumer Discretionary Index, its composition is nothing but defensive as it is dominated by fast-food chains. Profitable and resilient: Despite the havoc wreaked by Covid, the restaurant industry has not stopped being profitable (Chart 2). With any new Covid variant scare, restaurants will just go back to their “drive-throughs” playbook. Over the course of 2021, restaurant spending has risen by more than 40%. We have a positive outlook for fast-food chains and are overweight the S&P Restaurant index. Feature This is the second part of the publication, in which we provide an in-depth overview of Hotels, Restaurants, and Airlines, or the “travel complex” as we dubbed it. These industries share many drivers of profitability as each provides in-person experiences. They are also highly dependent upon public sentiment regarding the potential dangers and likelihood of Covid infections. Further, consumer confidence and financial wellbeing are at the core of this group’s profitability, as the travel complex is a quintessential discretionary spending category. The recovery of the group was coming along quite well until the Delta variant derailed it in late summer, with reports pouring in about dining rooms closing, airline bookings flagging, and hotel occupancy dipping. What is next? In last week’s report, we provided an overview of the macroeconomic backdrop, the Delta variant trajectory, and a “deep dive” into the hotel industry. We concluded that the Hotels, Resorts, and Cruise Lines industry has significant potential to return to its former “glory”: Delta is cresting, financially healthy US consumers are choosing to spend their money on services and experiences, sell-side forecasts are pointing to surging sales, and hotels have substantial pricing power. The industry is a sound tactical and cyclical investment, and we recommend an overweight. This week we will continue with a deep dive into the Restaurant and Airline industries. Sneak Preview: We like restaurants (overweight) but airlines, not so much (underweight). Chart 1Airline Majors' Traffic Still Has Not Recovered To 2019 Level
Travel: Airlines Are Not Ready To Take Off (Part 2)
Travel: Airlines Are Not Ready To Take Off (Part 2)
Chart 2Profitability Is Resilient To Downturns
Profitability Is Resilient To Downturns
Profitability Is Resilient To Downturns
Airlines “To suggest that the airlines should have better prepared for this environment seems akin to suggesting Pompeii should have invested more heavily in firefighting technology.” (JP Morgan, Mar. 22, 2020) Having avoided bankruptcy in 2020 thanks to federal payout support, US passenger airlines recorded $4.3 billion more in pre-tax losses in the first half of 2021. Clearly, this industry’s woes are far from over. Unsurprisingly, airlines have had the worst performance of any industry in the travel complex, underperforming the S&P 500 by 5% over the past year (Chart 3 & Table 1). Importantly, the performance of the industry slumped at the end of the summer, triggered by the Delta variant scare: After several months of steady increases, new ticket sales have dipped. As we noted last week, several major airlines have warned in regulatory filings that their third quarter may not look as rosy as was hoped. American Airlines, Southwest Airlines, and United all noted a deceleration in near-term customer bookings in August and elevated trip cancellations, even in leisure.1 All three have suggested that the Delta variant is having a dampening effect on business. We believe that the Delta variant is cresting. Our base case is that herd immunity is not far off. Of course, the travel complex is vulnerable to any new virus scare (Table 2), and this is a risk that investors need to keep in mind. However, unlike hotels, airlines face multiple other challenges. Chart 3The S&P Airline Industry Index Is Still Under the Pre-pandemic Level
The S&P Airline Industry Index Is Still Under the Pre-pandemic Level
The S&P Airline Industry Index Is Still Under the Pre-pandemic Level
Table 1Performance
Travel: Airlines Are Not Ready To Take Off (Part 2)
Travel: Airlines Are Not Ready To Take Off (Part 2)
Table 2Airline Industry Composition
Travel: Airlines Are Not Ready To Take Off (Part 2)
Travel: Airlines Are Not Ready To Take Off (Part 2)
Competitive Landscape The US airline industry generated total operating revenues of $92.7 billion in 2020, down 48.3% from $179.4 billion in 2019. The industry is dominated by five majors, that are included in the S&P 500 index). Macroeconomic Backdrop For Airlines The airline industry is highly cyclical, and its wellbeing is tightly tied to economic growth. As economic activity improves, business travel tends to increase (except when Covid-related restrictions change the normal course of things). As economic growth translates into higher wages and stronger employment gains, leisure travel also takes off. So does the transportation of goods. As we discussed in Part 1 of the report, the economy is currently in a slowdown stage of the business cycle: Growth is slowing but off high levels. As such, even in the absence of Covid-19 or the Delta variant, Airline sales would continue to grow but at a slow pace. US consumers are financially healthy, and while most of the stimulus money has been spent, more and more people are returning to work. Recently, consumer confidence has soured on the back of a resurgence in Covid infections and rising prices (Chart 4, panel 2). However, domestic airline tickets are still cheap, and only fear of infection is keeping Americans grounded. With Delta cresting, people will go back to flying. Chart 4Airlines Are Highly Cyclical
Airlines Are Highly Cyclical
Airlines Are Highly Cyclical
Key Drivers Of Profitability: Revenue Vs Expenses Revenue While many industries have been hit hard by the pandemic (brick-and-mortar retail, hotels, restaurants) most have turned the corner and are now profitable. Airlines, however, are still struggling (Chart 5). The good news is that losses have been declining, but the bad news is that the financial situation of most airlines is still precarious. Airlines rely on diverse sources of revenue, and thanks to that, business is starting to recover. The following are the key streams: Fares charged to customers In-flight entertainment, food, and beverages Sales of frequent-flyer credits to hotels, auto rental agencies, credit card issuers Auxiliary charges: Baggage checks, choice of seat, extra leg room Cargo and mail Chart 5Airlines' Revenue Remain
Airlines' Revenue Remain
Airlines' Revenue Remain
Chart 6Airline Majors' Traffic Still Has Not Recovered To 2019 Level
Travel: Airlines Are Not Ready To Take Off (Part 2)
Travel: Airlines Are Not Ready To Take Off (Part 2)
Traffic Recovery: Domestic Travel Has Rebounded, While International And Corporate Travel Are Still Lagging Budget airlines are pandemic winners: As of October 2021 compared to October 2019, scheduled available seat miles are down for all the airlines in the S&P 500 index (AAL, LUV, DAL, UAL, and ALK) (Chart 6). Only the budget airlines such as Allegiant, Spirit, and Frontier have a scheduled number of flights above the 2019 watermark. The underlying reason for such a dichotomy is easy to explain. The successful rollout of Covid-19 vaccines in the US has unleashed material pent-up demand for domestic leisure travel, benefiting domestic budget airlines. US domestic seat miles and load factors have recovered to pre-pandemic levels (Chart 7) as consumers have eagerly spent their stimulus checks on travel within the US. Chart 7Domestic Load Factor Has Fallen Below Pre-Pandemic Levels
Travel: Airlines Are Not Ready To Take Off (Part 2)
Travel: Airlines Are Not Ready To Take Off (Part 2)
Major airlines are bleeding cash due to high exposure to international and business travel segments: In the meantime, many government and company-imposed restrictions on international and business flights are still in place. Companies are taking a very cautious approach to office re-openings and employee travel, and Zoom has become embedded as a viable corporate communications alternative and a cost-saving tool. As a result, the airline traffic of the majors with high exposure to international (Chart 8) and business travel (Chart 9), is still below the pre-pandemic level. Some of that capacity is being redirected to domestic leisure travel, which has higher volume but is far less profitable. Chart 8In August 2021, US-International Air Travel* Fell 54% Below 2019 Levels
Travel: Airlines Are Not Ready To Take Off (Part 2)
Travel: Airlines Are Not Ready To Take Off (Part 2)
Chart 9Since Mid-July, Growth Of Overall And Corporate Ticket Sales Has Slowed
Travel: Airlines Are Not Ready To Take Off (Part 2)
Travel: Airlines Are Not Ready To Take Off (Part 2)
Corporate and international travel are the most lucrative revenue segments and are significant in size: Before the pandemic, business travel constituted 30% of all trips. The industry can hardly recover without these segments rebounding. Until that happens, companies will stay unprofitable, and cash burn will continue. Business travel is projected to recover in 2022 at best and 2024 at worst: The US Travel Association projects US business travel to return to the 2019 level in 2024. The Airlines for America Association (A4A) concurs. It projects that airline passenger volumes will return to the 2019 level in 2022 in the best-case scenario and in 2024 in the worst. Airline cargo is a saving grace: With passenger revenues still lagging 2019 levels, many airlines are focusing on the capacity of their cargo units. With global supply chains clogged and shipping costs increasing five-fold over the past few months, this is a profitable niche. Air cargo demand reached its all-time high in 2020 and continues to grow in 2021: US airlines posted a 20.5% increase in demand for international air cargo in July 2021 from the July 2019 actuals (Chart 10). Chart 10For US Airlines, Growth In Air Cargo Continues To Outpace Air Travel By A Large Margin
Travel: Airlines Are Not Ready To Take Off (Part 2)
Travel: Airlines Are Not Ready To Take Off (Part 2)
Airlines Compete On Volume: Airfares Are Low Despite the inflationary environment, the price of airfares is still 18% below its 2019 level (-10% annualized), and that is after 7% YoY price increases in 2021 (Chart 11). These are price levels not seen since the 1990s. With all the spare capacity, former international and business travel is now competing to attract domestic leisure passengers. Making things worse, due to prior commitments, airlines continued to grow their fleets throughout the pandemic closures (Chart 12), further increasing capacity and exacerbating competition for passengers as business and international travel are likely to lag, making peak ticket prices and peak revenue elusive (Chart 13). There is also another matter to consider, which is hardly minor. Airline taxes and fees constitute about a quarter of the price of a ticket. According to an example put together by A4A, the base airline fare of $236 has $64 in multiple taxes and fees, making tickets less affordable. Chart 11Airfares Have Fallen by 10% A Year Since The Beginning Of The Pandemic
Travel: Airlines Are Not Ready To Take Off (Part 2)
Travel: Airlines Are Not Ready To Take Off (Part 2)
Chart 12Capacity Continues To Increase
Travel: Airlines Are Not Ready To Take Off (Part 2)
Travel: Airlines Are Not Ready To Take Off (Part 2)
Chart 13Airfares Are Down 18% From 2019 And 29% From 2014
Travel: Airlines Are Not Ready To Take Off (Part 2)
Travel: Airlines Are Not Ready To Take Off (Part 2)
Sales Growth Analysts expect airline sales growth to stabilize at 60% over the next 12 months. The base effect certainly plays a significant role, but this rate will help the industry to recover. Expenses Airlines have high fixed costs as they own or lease aircraft fleets. This creates a heavy financial burden during downturns, as costs can hardly be cut. Other expenses such as labor and fuel are also sticky. Price Of Jet Fuel Has Increased To Pre-pandemic Levels The cost of jet fuel is one of the most significant input costs for airlines, constituting anywhere between 10% and 30% of revenue (Chart 14). The price of fuel can make a significant difference for an airline’s razor-thin margins. Airlines therefore tend to hedge their fuel exposure. Jet-fuel prices have rebounded to their pre-pandemic level and are up 49% from January 2021 (Chart 14), no longer giving the airline any slack on the cost side. According to Zach Research, at United Airlines the average aircraft fuel price per gallon increased by 66.9% year-over-year to $1.97 in the June quarter. Owing to the uptick in air travel demand witnessed in the June quarter following increased vaccinations, fuel gallons consumed were up 206.4%. Chart 14Price Of Jet Fuel Has Increased To The Pre-pandemic Levels
Price Of Jet Fuel Has Increased To The Pre-pandemic Levels
Price Of Jet Fuel Has Increased To The Pre-pandemic Levels
Chart 15Labor Costs Increased Again
Travel: Airlines Are Not Ready To Take Off (Part 2)
Travel: Airlines Are Not Ready To Take Off (Part 2)
Labor Costs Are Fixed Due To The Unionized Work Force Labor is another significant line item on the expense side of the airline’s income statement. Normally labor costs constitute 30-40% of sales. During the darkest days of the lockdowns, labor expense soared to 60% of sales (Chart 15). With a highly unionized labor force, layoffs and furloughs require significant payouts. There are also many other conditions in the labor contract that must be met. As a result, as sales tanked, labor costs did not change in the same proportion. Even so, airlines reduced their workforce from 458,000 people in 2019 to 363,000 in November 2020 (Chart 15). Now, with sales growing again, airlines have started rehiring. However, with recent wage rises, new employees are more expensive. Profitability With revenue challenged by a less profitable trip mix, excess capacity, and rising fuel and labor costs, airlines have been losing money for over a year now (Chart 16). While the increase in leisure travel and cargo units is helping, it is hard to envision profitability without a return of international and business travel. With airline revenue down 27% YoY in August 2021, and costs on the rise, profitability is still a long way off (Chart 17). Chart 16Airlines Are Unprofitable…
Airlines Are Unprofitable…
Airlines Are Unprofitable…
Chart 17…And Are Burning Cash
…And Are Burning Cash
…And Are Burning Cash
Net Debt Airlines’ net debt has risen significantly since the pandemic, driven by their need to support fixed costs (Chart 18). The increase in net debt was also stimulated by large government support and a low interest-rate environment. The problem is that since airlines are unprofitable, and are burning cash, it is becoming harder and harder for them to meet their debt obligations (Chart 19). While there have not been any high-profile bankruptcies in the US, some European and Asian carriers, such as Norwegian Air and AirAsia Japan Co., had to file for bankruptcy protection. As airlines are expected to continue to burn cash through 2022 their credit ratings have been downgraded (Table 3). We would not be surprised if more bankruptcies or industry consolidations take place in the near term. Chart 18Debt Levels Have Increased Significantly
Debt Levels Have Increased Significantly
Debt Levels Have Increased Significantly
Chart 19Airlines Have Difficulty With Interest Payments
Airlines Have Difficulty With Interest Payments
Airlines Have Difficulty With Interest Payments
Table 3All Airlines Credit Ratings Have Been Downgraded
Travel: Airlines Are Not Ready To Take Off (Part 2)
Travel: Airlines Are Not Ready To Take Off (Part 2)
When Will Airlines Thrive Again While revenue lags, the industry will remain vulnerable to shocks and cost headwinds. However, once international and business travel recovers, sales will pick up, and companies will generate positive cash flow. Cash generation is a necessary condition for financial recovery – once airlines arrest the cash burn, they can shift their efforts towards rebuilding profitability and, eventually, repairing their balance sheets. Valuations And Technicals Airlines are trading at 36x forward earnings, which is optically high. However, the Valuations Indicator suggests that airlines are not expensive relative to their own history (Chart 20). The industry is also modestly oversold (Chart 21). Chart 20Airline Are Not Expensive Relative To Own History…
Airline Are Not Expensive Relative To Own History…
Airline Are Not Expensive Relative To Own History…
Chart 21…And Are Oversold
…And Are Oversold
…And Are Oversold
Investment Implications Airlines are slowly recovering from a malaise induced by the pandemic lockdowns. However, the road to recovery will be long. While domestic leisure and cargo traffic has picked up, it will be another couple of years before international and business travel rebounds to the pre-pandemic levels. With fuel and labor costs on the rise, profitability is elusive without those segments. And, even when airlines return to profitability, it will take them years to repair their indebted balance sheets. What is worse, with current levels of debt burden and negative interest coverage, bankruptcies may not be out of the question for some. While airlines may rally with rates rising and cyclicals outperforming, we are negative on the industry on both a cyclical and structural basis. However, if any of our clients wish to trade this industry, there are several liquid ETFs that represent this space (Table 4). If investors chose to be granular and pick individual stocks in this space, they need to be aware of the individual challenges of each airline and their levels of indebtedness vs cash burn. In short, we have a negative outlook for airlines and are underweighting the industry. Table 4Airline ETFs Are Readily Available
Travel: Airlines Are Not Ready To Take Off (Part 2)
Travel: Airlines Are Not Ready To Take Off (Part 2)
Restaurants: Defensive Cyclicals Industry Composition Although the S&P Restaurant Industry resides within the pro-cyclical S&P Consumer Discretionary Index, its composition is nothing but defensive. In fact, a more appropriate name would have been the S&P Fast-Food Industry, with MCD and SBUX accounting for 70%+ of the industry market cap (Table 5). Table 5Industry Composition
Travel: Airlines Are Not Ready To Take Off (Part 2)
Travel: Airlines Are Not Ready To Take Off (Part 2)
Performance Restaurant Industry performance has been tracking the performance of the S&P 500, lagging the benchmark by only 8% since January 2020 (Chart 22) Chart 22Restaurant Performed Almost In Line With The S&P 500
Restaurant Performed Almost In Line With The S&P 500
Restaurant Performed Almost In Line With The S&P 500
Restaurants Are “Defensive Cyclicals” Since fast-food prices are generally low, fast-food restaurants tend to be what economists call “inferior” goods, i.e., goods whose sales rise when the economy is in a downward spiral. Restaurants tend to outperform in the slowdown stage of the business cycle (Chart 23), are flat during contraction, and underperform during expansions. Consistent with these expectations, fast-food restaurants also came out as winners of Covid lockdowns: Although sales initially dipped, they quickly recovered as fast-food chains reoriented their business toward drive-throughs and other forms of take-out (Chart 24). Chart 23Fast-Food Restaurants Are Defensive
Travel: Airlines Are Not Ready To Take Off (Part 2)
Travel: Airlines Are Not Ready To Take Off (Part 2)
Chart 24Sales Growth Is Recovering
Sales Growth Is Recovering
Sales Growth Is Recovering
Covid While the restaurant business was coming along quite well, concerns emerged at summer’s end that the Delta variant would further delay industry recovery. Chains like McDonald’s and Chick-fil-A announced that they are slowing their dining room re-openings. As data from restaurant analytics firm Black Box Intelligence demonstrates, sales that had grown steadily earlier this summer have fallen.2 We believe that the reaction to the Delta variant is transitory as new infections are cresting. And, in the worst-case scenario, fast-food restaurants in the index will just switch back to their Covid “drive-through playbook,” and will maintain their level of profitability. Restaurant Spending And Profitability Over the course of 2021, US retail sales releases reveal that restaurant spending rose by more than 40%, outpacing the headline number (13%) by a wide margin (Chart 25). While restaurant spending is likely to decelerate over the coming months as pent-up demand for services is satisfied, earnings will continue to improve. This is in line with analyst expectations (Chart 26). Chart 25Restaurant Sales Skyrocketed In 2021
Restaurant Sales Skyrocketed In 2021
Restaurant Sales Skyrocketed In 2021
Chart 26Earnings Will Continue to Grow But At A Slower Pace
Earnings Will Continue to Grow But At A Slower Pace
Earnings Will Continue to Grow But At A Slower Pace
Despite the havoc wreaked by Covid, the restaurant industry has not stopped being profitable, and although margins dipped in the midst of the lockdown, they swiftly rebounded. The 83% YoY print in restaurants FCF is nearly an all-time high reading since the history of the data going back to the 1990s (Chart 27). Debt Is Low Net debt to total assets also echoes the upbeat message highlighting that US dining stocks remain in good financial health (Chart 28). Chart 27Free Cash Flow Is At All-Time High
Free Cash Flow Is At All-Time High
Free Cash Flow Is At All-Time High
Chart 28Debt Is Low
Debt Is Low
Debt Is Low
Valuations And Technicals Valuations are not demanding while technicals suggest that the industry is oversold (Chart 29). Chart 29Restaurants Are Oversold & Undervalued
Restaurants Are Oversold & Undervalued
Restaurants Are Oversold & Undervalued
Investment Implications The current slowdown stage of the business cycle is favorable for the fast-food industry. This industry is profitable and resilient in downturns. It is also attractively valued. The industry is oversold, which represents a favorable entry point for an overweight position. In short, fast-food restaurants are a sound “cyclical defensive”: They are resilient to downturns, highly profitable, and have healthy balance sheets. We have a positive outlook on the industry and are overweight. A Quick Aside: Toast IPO Before we conclude, a brief note on the new Toast (TOST) IPO is in order. While the stock became public only last week and is not a part of the S&P 500, it is an important newcomer to the stock market. The company is a market leader in cloud-based restaurant management software. Toast’s performance is tied to the health of the overall US restaurant industry. Many of the popular restaurants and fast-food chains are among Toast’s clients. Bottom Line We have a negative outlook for Airlines: This highly cyclical industry is on a long-winding path towards recovery, profitability, and deleveraging. Airlines face multiple challenges and headwinds: Fuel and labor costs are rising, while their most profitable revenue segments, international and business travel, are missing in action. Cash burn is still acute, and profitability is elusive despite all the progress made. We are much more positive on the outlook for the Restaurant Index, which represents some of the largest fast-food chains in the nation. This industry thrives during economic slowdown, is resilient to shocks, and is highly profitable. Irene Tunkel Chief Strategist, US Equity Strategy irene.tunkel@bcaresearch.com Footnotes 1 Travel Investors Need More Drive, WSJ, Sep 12, 2021 2 Restaurants Close Dining Rooms Again as Delta-Driven Infections Spread, WSJ, Sep 13, 2021. Recommended Allocation
Highlights The Evergrande crisis is not China’s Lehman moment. Nonetheless, Chinese construction activity will decelerate further in response to this shock. Global equities are frothy enough that a weaker-than-expected Chinese construction sector will remain a near-term risk to stocks prices. European markets are more exposed to this risk than US ones. Tactically, this creates a dangerous environment for cyclicals in general and materials in particular. Healthcare and Swiss stocks would be the winners. Despite these near-term hurdles, we maintain a pro-cyclical portfolio stance, which we will protect with some temporary hedges. We will lift these hedges if the EURO STOXX corrects into the 430-420 zone. A busy week for European central banks confirms our negative stance on EUR/GBP, EUR/SEK, and EUR/NOK. While EUR/CHF has upside, Swiss stocks should outperform Euro Area defensives. Stay underweight UK Gilts in fixed-income portfolios. Feature The collapse of property developer Evergrande creates an important risk for European markets. It threatens to slow Chinese construction activity further, which affects European assets that are heavily exposed to the Chinese real estate sector, directly and indirectly. This risk is mostly frontloaded, as Chinese authorities cannot afford a complete meltdown of the domestic property sector. Moreover, this economy has slowed significantly and more policy support is bound to take place. Additionally, forces outside China create important counterweights that will allow Europe to thrive despite the near-term clouds. While we see more short-term risk for European stocks and cyclical sectors, the 18-month cyclical outlook remains bright. Similarly, European stocks will not outperform US ones when Chinese real estate activity remains a source of downside surprise; but they will afterward. China’s Construction Slowdown Is Not Over The Evergrande crisis is not China’s Lehman moment. Beijing has the resources to prevent a systemic meltdown and understands full well what is at stake. At 160% of GDP, China’s nonfinancial corporate debt towers well above that of other major emerging markets and even that of Japan in the 1980s (Chart 1). If an Evergrande bankruptcy were allowed to topple this debt mountain, China would experience the kind of debt-deflation trap that proved so disastrous in the 1930s. A further deterioration of conditions in Chinese real estate activity is nonetheless in the cards, even if the country avoids a global systemic financial shock. First, the inevitable restructuring of Evergrande will result in losses for bond holders, especially foreign ones. Consequently, risk premia in the Chinese off-shore corporate bonds market will remain wide following the resolution of the Evergrande debacle. While Chinese banks are likely to recover a large proportion of the funds they lent to the real estate giant, they too will face higher risk premia. At the margin, the rising cost of capital will curtail the number of projects real estate developers take on over the coming two to three years. Second, the eventual liquidation of Evergrande will hurt confidence among real estate developers. This process may take many forms, but, as we go to press, the most discussed outcome is a breakup and restructuring where state-owned enterprises and large local governments absorb Evergrande’s operations. Evergrande’s employees, suppliers, and clients who have deposited funds while pre-ordering properties will be made whole one way or the other. However, shareholders and management will not. Wiping out shareholders and senior management will send a message to the operators of other developers, which will negatively affect their risk taking (Chart 2). Chart 1China Cannot Afford A Lehman Moment
China Cannot Afford A Lehman Moment
China Cannot Afford A Lehman Moment
Chart 2Downside To Chinese Construction Activity
Downside To Chinese Construction Activity
Downside To Chinese Construction Activity
Third, one of President Xi Jinping’s key policy objectives is to tame rampant income inequality in the Chinese economy. Rapidly rising real estate prices and elevated unaffordability only worsen this problem. Hence, Beijing wants to avoid blind stimulus that mostly pushes house prices higher but that would have also boosted construction activity. Thus, if credit growth is pushed through the system, the regulatory tightening in real estate will not end. This process is likely to result in further contraction in floor space sold and started. Bottom Line: The Evergrande crisis is unlikely to morph into China’s Lehman moment. However, its fallout on the real estate industry means that Chinese construction activity will continue to contract in the coming six to twelve months or so. Chinese Construction Matters For European Equities The risk of further contraction in Chinese construction activity implies a significant near-term risk for European equities, especially relative to US ones. Even after the volatility of the past three weeks, global equities remain vulnerable to more corrective action. Speculative activity continues to grip the bellwether US market. Our BCA Equity Speculation Index is still around two sigma. Previous instances of high readings did not necessarily herald the end of bull markets; however, they often resulted in sideways and volatile trading, until the speculative excesses dissipated (Chart 3). The case for such volatile trading is strong. The Fed is set to begin its taper at its November meeting. Moreover, an end of the QE program by the middle of next year and the upcoming rotation of regional Fed heads on the FOMC will likely result in a first rate hike by the end of 2022. Already, the growth rate of the global money supply has declined, and the real yield impulse is not as supportive as it once was. Therefore, the deterioration in our BCA Monetary Indicator should perdure (Chart 4), which will heighten the sensitivity of global stocks to bad news out of China. Chart 3Rife With Speculation
Rife With Speculation
Rife With Speculation
Chart 4Liquidity Deterioration At The Margin
Liquidity Deterioration At The Margin
Liquidity Deterioration At The Margin
Chart 5Still Too Happy
Still Too Happy
Still Too Happy
Investor sentiment is also not as washed out as many news stories ascertain. The AAII survey shows that the number of equity bulls has fallen sharply, but BCA’s Complacency-Anxiety Index, Equity Capitulation Indicator and Sentiment composite are still inconsistent with durable market bottoms. Moreover, the National Association of Active Investment Managers’ Exposure Index is still very elevated. When this gauge is combined with the AAII bulls minus bears indicator, it often detects floors in the US dollar-price of the European MSCI index (Chart 5). For now, this composite sentiment measure is flashing further vulnerability for European equities, especially if China remains a source of potential bad news in the coming months. Economic linkages reinforce the tactical risk to European stocks. Chinese construction activity affects the Euro Area industrial production because machinery and transportation goods represent 50% of Europe’s export to China (Chart 6). This category is very sensitive to Chinese real estate activity. Moreover, Europe’s exports to other nations are also indirectly affected by the demand from Chinese construction. Financial markets bear this footprint. Excavator sales in China are a leading indicator of construction activity. Historically, they correlate well with both the fluctuations of EUR/USD and the performance of Eurozone stocks relative to those of the US (Chart 7). Hence, if we anticipate that the problems Evergrande faces will weigh on excavator sales in the coming months, then the euro will suffer and Euro Area stocks could continue to underperform. Chart 6Europe's Exports To China Are Sensitive To Construction Activity
Europe's Exports To China Are Sensitive To Construction Activity
Europe's Exports To China Are Sensitive To Construction Activity
Chart 7A Near-Term Risk To European Assets
A Near-Term Risk To European Assets
A Near-Term Risk To European Assets
Similarly, the fallout from Evergrande’s problem will extend to the performance of European equity sectors. The sideways corrective episode in cyclical relative to defensive shares is likely to continue in the near term. This sector twist remains frothy, and often declines when Chinese credit origination is soft (Chart 8). Materials stocks are the most likely to suffer due to their tight correlation with Chinese excavator sales (Chart 9); meanwhile, healthcare equities will reap the greatest benefit as a result of their appealing structural growth profile and their strong defensive property. Geographically, Swiss stocks should perform best (Chart 9, bottom panel), because they strongly overweigh healthcare and consumer staple names. Moreover, as we recently argued, the SNB’s monetary policy is an advantage for Swiss stocks compared to Eurozone defensives.1 Additionally, Dutch equities, with their 50% weighting in tech and their small 12% combined allocation to industrials and materials, could also enjoy a near-term outperformance as investors digest the sectoral impact of weaker Chinese construction activity. Chart 8The Vulnerability Of Cyclicals/Defensives Remains
The Vulnerability Of Cyclicals/Defensives Remains
The Vulnerability Of Cyclicals/Defensives Remains
Chart 9Responses To Weaker Construction
Responses To Weaker Construction
Responses To Weaker Construction
Bottom Line: No matter how the Evergrande story unfolds, its consequence on Chinese construction activity may still cause market tremors. Global equity benchmarks may be rebounding right now, but, ultimately, they remain vulnerable to this slowdown. Any negative surprise out of China is likely to cause Europe to underperform because of its greater exposure to Chinese construction activity. Investment Conclusion: This Too Shall Pass The risks to the European equity market and its cyclicals sectors will prove transitory and will finish by the end of the year. Beijing will tolerate some pain to the real estate sector, but the stakes are too high to let the situation fester for long. The main problem is China’s large debt. Already sequential GDP growth in the first half of 2021 was worse than the same period in 2020, and credit accumulation is just as weak as in early 2018 (Chart 10). In this context, if real estate activity deteriorates too much, aggregate profits will contract and, in turn, will hurt the corporate sector’s ability to service its debt. Employment and social tensions create another stress point that will force Beijing’s hand. At 47, the non-manufacturing PMI employment index is already well into the contraction zone (Chart 11). Weakness in construction activity will hurt the labor market further. In an environment where protests have been springing up all over China, the Communist Party does not want to see more stress applied to workers. Chart 10In The End, Stimulus Will Come
In The End, Stimulus Will Come
In The End, Stimulus Will Come
Chart 11Worsening Chinese Employment Conditions
Worsening Chinese Employment Conditions
Worsening Chinese Employment Conditions
These two constraints will force Beijing to alleviate the pain caused by a weaker construction sector. As a result, we still expect the Chinese credit and fiscal impulse to re-accelerate by Q2 2022. Developments outside of China will create another important offset that will allow risk assets to thrive once their immediate froth has receded. Strong DM capex will be an important driver of global activity next year. As Chart 12 shows, capex intentions in the US and the Euro Area are rapidly expanding, which augurs well for global investments. Moreover, re-building depleted inventories (Chart 13) will be a crucial component of the solution to global supply bottlenecks. Both activities will add to global demand. As an example, ship orders are already surging. Chart 12DM Capex Intentions Are Firming
DM Capex Intentions Are Firming
DM Capex Intentions Are Firming
Chart 13Don't Forget About Inventories
Don't Forget About Inventories
Don't Forget About Inventories
We maintain a pro-cyclical stance in European markets after weighing the near-term negatives against the underlying positive forces. For now, hedging the tactical risk still makes sense and our long telecommunication / short consumer discretionary equities remain the appropriate vehicle – so does being long Swiss stocks versus Euro Area defensives. However, we will use any correction in the EURO STOXX (Bloomberg: SXXE Index) to the 430-420 zone to unload this protection. Bottom Line: The potential market stress created by a slowdown in Chinese construction activity will be a temporary force. Beijing will not tolerate a much larger hit to the economy, especially as tensions are rising across the country. Thus, even if the stimulus response to the Evergrande crisis will not be immediate, it will eventually come, which will support Chinese economic activity. Additionally, the capex upside and inventory rebuilding in advanced economies will create an offset for slowing Chinese growth. Consequently, while we maintain a pro-cyclical bias over the medium term, we are also keeping in place our hedges in the near term, looking to shed them if SXXE hits the 430-420 zone. A Big Week For Central Banks Chart 14The BoE's Is Listening To The UK's Economic Conditions...
The BoE's Is Listening To The UK's Economic Conditions...
The BoE's Is Listening To The UK's Economic Conditions...
Last week, four European central banks held their policy meetings: The Riksbank, the Swiss National Bank, the Norges Bank, and the Bank of England. No major surprises came out of these meetings, with central banks discourses and policy evolving in line with their respective economies. The BoE veered on the hawkish side, highlighting that rates could rise before its QE program is over. This implies a small possibility of a rate hike by the end of 2021. However, our base case remains that the initial hike will be in the first half of 2022. The BoE is behaving in line with the message from our UK Central Bank Monitor (Chart 14). Moreover, the combination of rapid inflation and strong house price appreciation is incentivizing the BoE to remove monetary accommodation, especially because UK financial conditions are extremely easy (Chart 14, bottom panel). One caution advanced by the MPC is the uncertainty surrounding the impact of the end of the job furlough scheme this month. However, the global economy will be strong enough next spring to mitigate the risks to the UK. The results of last week’s MPC meeting and our view on the global and UK business cycles support the short EUR/GBP recommendation of BCA’s foreign exchange strategist,2 as well as the underweight allocation to UK Gilts of our Global Fixed Income Strategy group.3 The Norges Bank is the first central bank in the G-10 to hike rates and is likely to do so again later this year. While Norwegian core inflation remains low, house prices are strong, monetary conditions are extremely accommodative, and our Norway Central Bank Monitor is surging (Chart 15). The Norwegian central bank will continue to focus on these positives, especially in light of our Commodity and Energy team’s view that Brent will average more than $80/bbl by 2023.4 In this context, we anticipate the NOK to outperform the euro over the coming 24 months. Nonetheless, the near-term outlook for Norwegian stocks remains fraught with danger. Materials account for 17% of the MSCI Norway index and are the sector most vulnerable to a deterioration in Chinese construction activity. The Riksbank continues to disregard the strength of the Swedish economy. Relative to economic conditions, it is one of the most dovish central banks in the world. The Swedish central bank is completely ignoring the message from our Sweden Central Bank Monitor, which has never been as elevated as it is today (Chart 16). Moreover, the inexpensiveness of the SEK means that Swedish financial conditions are exceptionally accommodative. At first glance, this picture is bearish for the SEK. However, easy monetary conditions will cause Sweden’s real estate bubble to expand. Expanding real estate prices and transaction volumes will boost the profits of Swedish financials, which account for 27% of the MSCI Sweden index. Moreover, Swedish industrials remain one of our favorite sectors in Europe, and they represent 38% of the same index. As a result, equity flows into Sweden should still hurt the EUR/SEK cross. Chart 15...And The Norges Bank, To Norway's
...And The Norges Bank, To Norway's
...And The Norges Bank, To Norway's
Chart 16The Riksbank Is Blowing Real Estate Bubbles
The Riksbank Is Blowing Real Estate Bubbles
The Riksbank Is Blowing Real Estate Bubbles
Chart 17The CHF Still Worries The SNB
The CHF Still Worries The SNB
The CHF Still Worries The SNB
Finally, the SNB proved reliably dovish. Our Switzerland Central Bank Monitor is rising fast as inflation and house prices improve (Chart 17). However, the SNB is rightfully worried about the expensiveness of the CHF, which generates tight Swiss financial conditions (Chart 17, bottom panel). Consequently, the SNB will keep fighting off any depreciation in EUR/CHF. Thus, the SNB will be forced to expand its balance sheet because the ECB is likely to remain active in asset markets longer than many of its peers. This process will be key to the outperformance of Swiss stocks relative to other European defensive equities. Mathieu Savary, Chief European Strategist Mathieu@bcaresearch.com Footnotes 1 Please see European Investment Strategy “The ECB’s New Groove,” dated July 19, 2021, available at eis.bcarsearch.com 2 Please see Foreign Exchange Strategy “Why Are UK Interest Rates Still So Low?,” dated March 10, 2021, available at fes.bcarsearch.com 3 Please see European Investment Strategy “The UK Leads The Way,” dated August 11, 2021, available at eis.bcarsearch.com 4 Please see Commodity & Energy Strategy “Upside Price Risk Rises For Crude,” dated September 16, 2021, available at fes.bcarsearch.com Tactical Recommendations
Europe’s Evergrande Problem
Europe’s Evergrande Problem
Cyclical Recommendations
Europe’s Evergrande Problem
Europe’s Evergrande Problem
Structural Recommendations
Europe’s Evergrande Problem
Europe’s Evergrande Problem
Closed Trades
Europe’s Evergrande Problem
Europe’s Evergrande Problem
Currency Performance Fixed Income Performance Equity Performance
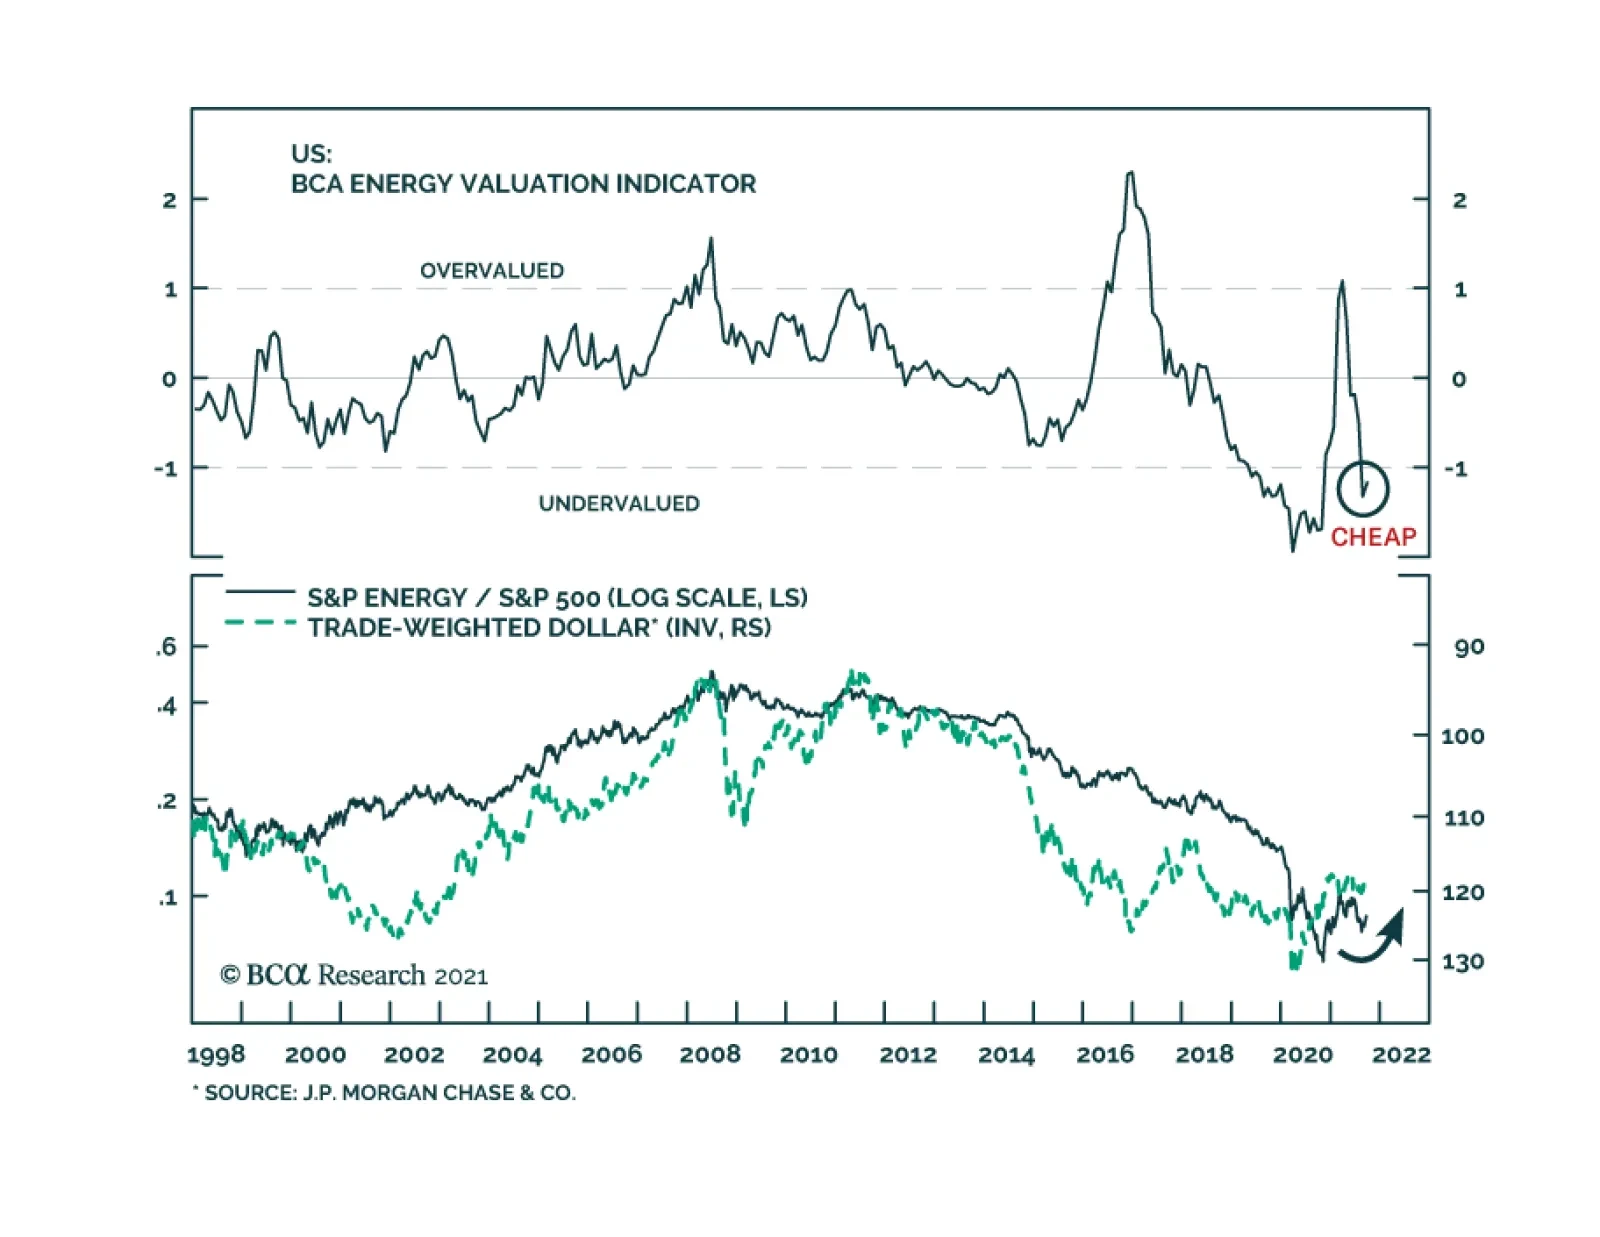
US energy stocks performed poorly earlier this year. They fell 14tween early March and late August. However, the tide seems to be turning in their favor. The energy sector is now leading the benchmark. It is up 12% since August 20 – a period of…
Highlights Asian and European natural gas prices will remain well bid as the Northern Hemisphere winter approaches. An upgraded probability of a second La Niña event this winter will keep gas buyers scouring markets for supplies (Chart of the Week). The IEA is pressing Russia to make more gas available to European consumers going into winter. While Russia is meeting contractual commitments, it is also trying to rebuild its inventories. Gas from the now-complete Nord Stream 2 pipeline might not flow at all this year. High natgas prices will incentivize electric generators to switch to coal and oil. This will push the level and costs of CO2 emissions permits higher, including coal and oil prices. Supply pressures in fossil-fuel energy markets are spilling into other commodity markets, raising the cost of producing and shipping commodities and manufactures. Consumers – i.e., voters – experiencing these effects might be disinclined to support and fund the energy transition to a low-carbon economy. We were stopped out of our long Henry Hub natural gas call spread in 1Q22 – long $5.00/MMBtu calls vs short $5.50/MMBtu calls in Jan-Feb-Mar 2022 – and our long PICK ETF positions with returns of 4.58% and -10.61%. We will be getting long these positions again at tonight's close. Feature European natural gas inventories remain below their five-year average, which, in the event of another colder-than-normal winter in the Northern Hemisphere, will leave these markets ill-equipped to handle a back-to-back season of high prices and limited supply (Chart 2).1 The probability of a second La Niña event this winter was increased to 70-80% by the US Climate Prediction Center earlier this week.2 This raises the odds of another colder-than-average winter. As a result, markets will remain focused on inventories and flowing natgas supplies from the US, in the form of Liquified Natural Gas (LNG) cargoes, and Russian pipeline shipments to Europe as winter approaches. Chart of the WeekSurging Natural Gas Prices Intensify Competition For Supplies
Natgas Markets Continue To Tighten
Natgas Markets Continue To Tighten
Chart 2Natgas Storage Remains Tight
Natgas Markets Continue To Tighten
Natgas Markets Continue To Tighten
US LNG supplies are being contested by Asian buyers, where gas storage facilities are sparse, and European buyers looking for gas to inject into storage as they prepare for winter. US LNG suppliers also are finding ready bids in Brazil, where droughts are reducing hydropower availability. In the first six months of this year, US natgas exports averaged 9.5 bcf/d, a y/y increase of more than 40%. Although Russia's Nord Stream 2 pipeline has been completed, it still must be certified to carry natgas into Germany. This process could take months to finish, unless there is an exemption granted by EU officials. Like the US and Europe, Russia is in the process of rebuilding its natgas inventories, following a colder-than-normal La Niña winter last year.3 Earlier this week, the IEA called on Russia to increase natgas exports to Europe as winter approaches. The risk remains no gas will flow through Nord Stream 2 this year.4 Expect Higher Coal, Oil Consumption As other sources of energy become constrained – particularly UK wind power in the North Sea, where supplies went from 25% of UK power in 2020 to 7% in 2021 – natgas and coal-fired generation have to make up for the shortfall.5 Electricity producers are turning more towards coal as they face rising natural gas prices.6 Increasing coal-fired electric generation produces more CO2 and raises the cost of emission permits, particularly in the EU's Emissions Trading System (ETS), which is the largest such market in the world (Chart 3). Prices of December 2021 ETS permits, which represent the cost of CO2 emissions in the EU, hit an all-time high of €62.75/MT earlier this month and were trading just above €60.00/MT as we went to press. Chart 3Higher CO2 Emissions Follow Lower Renewables Output
Higher CO2 Emissions Follow Lower Renewables Output
Higher CO2 Emissions Follow Lower Renewables Output
Going into winter, the likelihood of higher ETS permit prices increases if renewables output remains constrained and natgas inventories are pulled lower to meet space-heating needs in the EU. This will increase the price of power in the EU, where consumers are being particularly hard hit by higher prices (Chart 4). The European think tank Bruegel notes that even though natgas provides about 20% of Europe's electricity supply, it now is setting power prices on the margin.7 Chart 4EU Power Price Surge Is Inflationary
Natgas Markets Continue To Tighten
Natgas Markets Continue To Tighten
Elevated natgas prices are inflationary, according to Bruegel: "On an annual basis, a doubling of wholesale electricity prices from about €50/megawatt hour to €100/MWh would imply that EU consumers pay up to €150 billion (€50/MWh*3bn MWh) more for their electricity. … Drastic increases in energy spending will shrink the disposable income of the poorest households with their high propensity to consume." This is true in other regions and states, as well. Is the Natgas Price Surge Transitory? The odds of higher natgas and CO2 permit prices increase as the likelihood of a colder-than-normal winter increases. Even a normal winter likely would tax Europe's gas supplies, given the level of inventories, and the need for Russia to replenish its stocks. However, at present, even with the odds of a second La Niña event this winter increasing, this is a probable event, not a certainty. The global natgas market is evolving along lines similar to the crude oil market. Fungible cargoes can be traded and moved to the market with the highest netback realization, after accounting for transportation. High prices now will incentivize higher production and a stronger inventory-injection season next year. That said, prices could stay elevated relative to historical levels as this is occurring. Europe is embarked on a planned phase-out of coal- and nuclear-powered electricity generation over the next couple of years, which highlights the risks associated with the energy transition to a low-carbon future. China also is attempting to phase out coal-fired generation in favor of natgas turbines, and also is pursuing a buildout of renewables and nuclear power. Given the extreme weather dependence on prices for power generated from whatever source, renewables will remain risky bets for modern economies as primary energy sources in the early stages of the energy transition. When the loss of wind, for example, must be made up with natgas generation and that market is tight owing to its own fundamental supply-demand imbalance, volatile price excursions to high levels could be required to destroy enough demand to provide heat in a cold winter. This would reduce support for renewables if it became too-frequent an event. This past summer and coming winter illustrate the risk of too-rapid a phase out of fossil-fueled power generation and space-heating fuels (i.e., gas and coal). Frequent volatile energy-price excursions, which put firms and households at risk of price spikes over an extended period of time, are, for many households, material events. We have little doubt the commodity-market effects will be dealt with in the most efficient manner. As the old commodity-market saw goes, "High prices are the best cure for high prices, and vice versa." All the same, the political effects of another very cold winter and high energy prices are not solely the result of economic forces. Inflation concerns aside, consumers – i.e., voters – may be disinclined to support a renewable-energy buildout if the hits to their wallets and lifestyles become higher than they have been led to expect. Investment Implications The price spike in natgas is highly likely to be a transitory event. Another surge in natgas prices likely would be inflationary while supplies are rebuilding – so, transitory. Practically, this could stoke dissatisfaction among consumers, and add a political element to the transition to a low-carbon energy future. This would complicate capex decision-making for incumbent energy suppliers – i.e., the fossil-fuels industries – and for the metals suppliers, which will be relied upon to provide the literal building blocks for the renewables buildout. Robert P. Ryan Chief Commodity & Energy Strategist rryan@bcaresearch.com Ashwin Shyam Research Associate Commodity & Energy Strategy ashwin.shyam@bcaresearch.com Commodities Round-Up Energy: Bullish US crude oil inventories fell 3.5mm barrels in the week ended 17 September 2021, according to the US EIA. Product inventories built slightly, led by a 3.5mm-build in gasoline stocks, which was offset by a 2.6mm barrel draw in distillates (e.g., diesel fuel). Cumulative average daily crude oil production in the US was down 7% y/y, and stood at 10.9mm b/d. Cumulative average daily refined-product demand – what the EIA terms "Product Supplied" – was estimated at 19.92mm b/d, up almost 10% y/y. Brent prices recovered from an earlier sell-off this week and were supported by the latest inventory data (Chart 5). Base Metals: Bullish Iron ore prices have fallen -55.68% since hitting an all-time high of $230.58/MT in May 12, 2021 (Chart 6). This is due to sharply reduced steel output in China, as authorities push output lower to meet policy-mandated production goals and to conserve power. Even with the cuts in steel production, overall steel output in the first seven months of the year was up 8% on a y/y basis, or 48mm MT, according to S&P Global Platts. Supply constraints likely will be exacerbated as the upcoming Olympic Games hosted by China in early February approach. Authorities will want blue skies to showcase these events. Iron ore prices will remain closer to our earlier forecast of $90-$110/MT than not over this period.8 Precious Metals: Bullish The Federal Open Market Committee is set to publish the results of its meeting on Wednesday. In its last meeting in June, more hawkish than expected forecasts for interest rate hikes caused gold prices to drop and the yellow metal has been trading significantly lower since then. Our US Bond Strategy colleagues expect an announcement on asset purchase tapering in end-2021, and interest rate increases to begin by end-2022.9 Rate hikes are contingent on the Fed’s maximum employment criterion being reached, as expected and actual inflation are above the Fed criteria. Tapering asset purchases and increases in interest rates will be bearish for gold prices. Chart 5
BRENT PRICES BEING VOLATILE
BRENT PRICES BEING VOLATILE
Chart 6
BENCHMARK IRON ORE 62% FE, CFR CHINA (TSI)RECOVERING
BENCHMARK IRON ORE 62% FE, CFR CHINA (TSI)RECOVERING
Footnotes 1 Equinor, the Norwegian state-owned energy-supplier, estimates European natgas inventories will be 70-75% of their five-year average this winter. Please see IR Gas Market Update, September 16, 2021. 2 Please see "ENSO: Recent Evolution, Current Status and Predictions," published by the US Climate Prediction Center 20 September 2021. Earlier this month, the Center gave 70% odds to a second La Niña event in the Northern Hemisphere this winter. Please see our report from September 9, 2021 entitled NatGas: Winter Is Coming for additional background. 3 Please see IEA calls on Russia to send more gas to Europe before winter published by theguardian.com, and Big Bounce: Russian gas amid market tightness. Both were published on September 21, 2021. 4 Please see Nord Stream Two Construction Completed, but Gas Flows Unlikely in 2021 published 14 September 2021 by Jamestown.org. 5 Please see The U.K. went all in on wind power. Here’s what happens when it stops blowing, published by fortune.com on 16 September 2021. Argus Media this week reported wind-power output fell 56% y/y in September 2021 to just over 2.5 TWh. 6 Please see UK power firms stop taking new customers amid escalating crisis, published by Aljazeera; Please see UK fires up coal power plant as gas prices soar, published by BBC. 7 Please see Is Europe’s gas and electricity price surge a one-off?, published by Bruegel 13 September 2021. 8 Please see China's Recovery Paces Iron Ore, Steel, which we published on November 5, 2020. 9 Please see 2022 Will Be All About Inflation and Talking About Tapering, published on September 22, 2021 and on August 10, 2021 respectively. Investment Views and Themes Recommendations Strategic Recommendations Commodity Prices and Plays Reference Table Trades Closed in 2021 Summary of Closed Trades
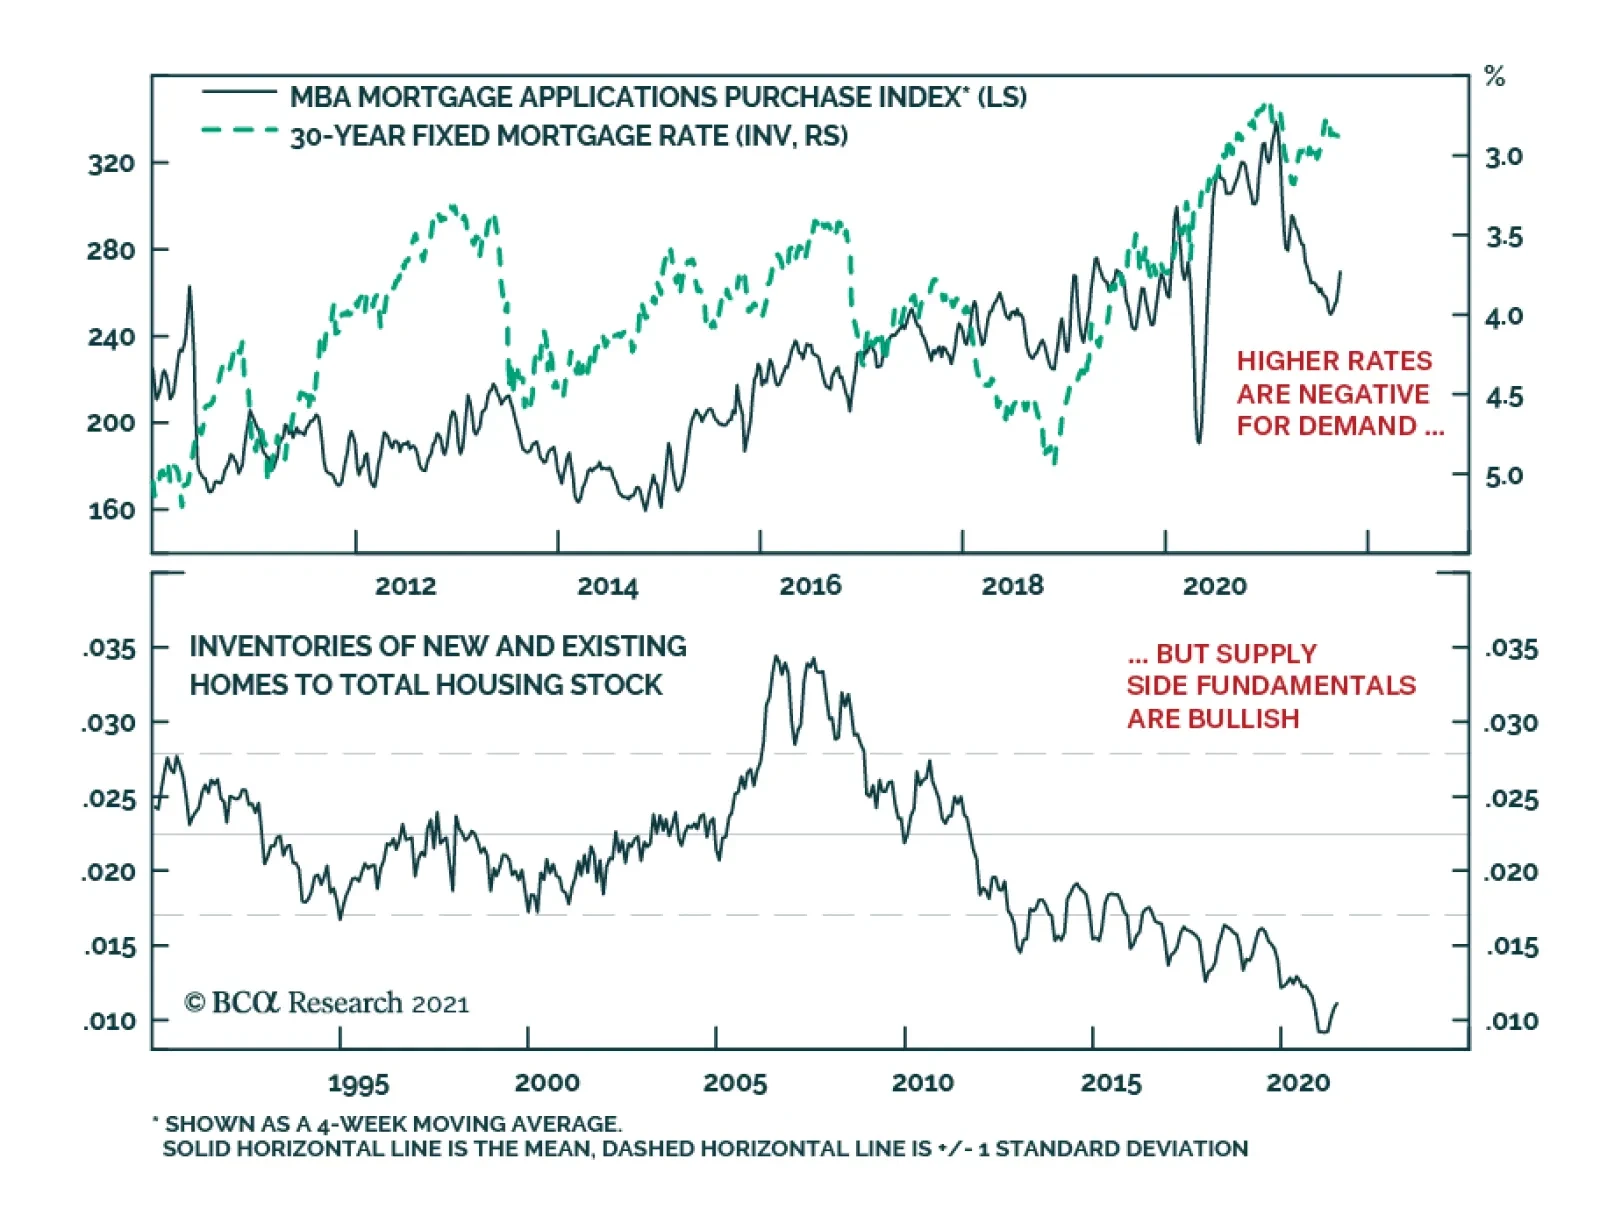
According to the latest MBA weekly survey, mortgage applications increased 4.9% in the week ending September 17. Mortgage applications to purchase a home climbed to the highest level since April. The massive accumulation of household excess savings and the…
BCA Research’s US Equity Strategy service recommends overweighting the Hotels, Resorts, and Cruise Lines industry. The team summarizes this view as follows: The Delta variant is cresting. Their base case is that herd immunity is not far off. Of…
Over the past few days, we have received several questions regarding the decrease in US savings we highlighted on Chart 4 in the most recent Strategy Report. US personal savings have decreased by roughly $4 trillion (SAAR) since their recent peak in March 2021, which raises the question of where all that money went? We must start by looking at how personal savings are computed. Broadly speaking, the savings number is a “stock,” which has income as an inflow and spending outlays as an outflow. Change in either of them changes the level of savings in the economy. The recent decrease in personal savings was due to the decrease in the income component, while spending outlays have remained unchanged. Specifically, the $4 trillion SAAR decrease in savings matches the $4 trillion SAAR decrease in government transfers (Chart 1). The implication is that dissaving merely maintained the same level of consumer spending. Chart 1
CHART 1
CHART 1
In fact, US retail sales have contracted since March 2021, further validating our conclusion that savings did not decrease because of additional spending (Chart 2, top panel). The breakdown of the US retail sales release (Charts 2- 4) shows that the categories which increased are restaurant, miscellaneous retail, clothing stores, food & beverage retail, and gas stations. Spending on durable goods has declined. Chart 2
CHART 2
CHART 2
Chart 3
CHART 3
CHART 3
Chart 4
CHART 4
CHART 4
Bottom Line: The fall in US personal savings from the recent March 2021 peak was driven by a decline in government transfers, and consumers dipping into savings to pay for services and everyday needs.
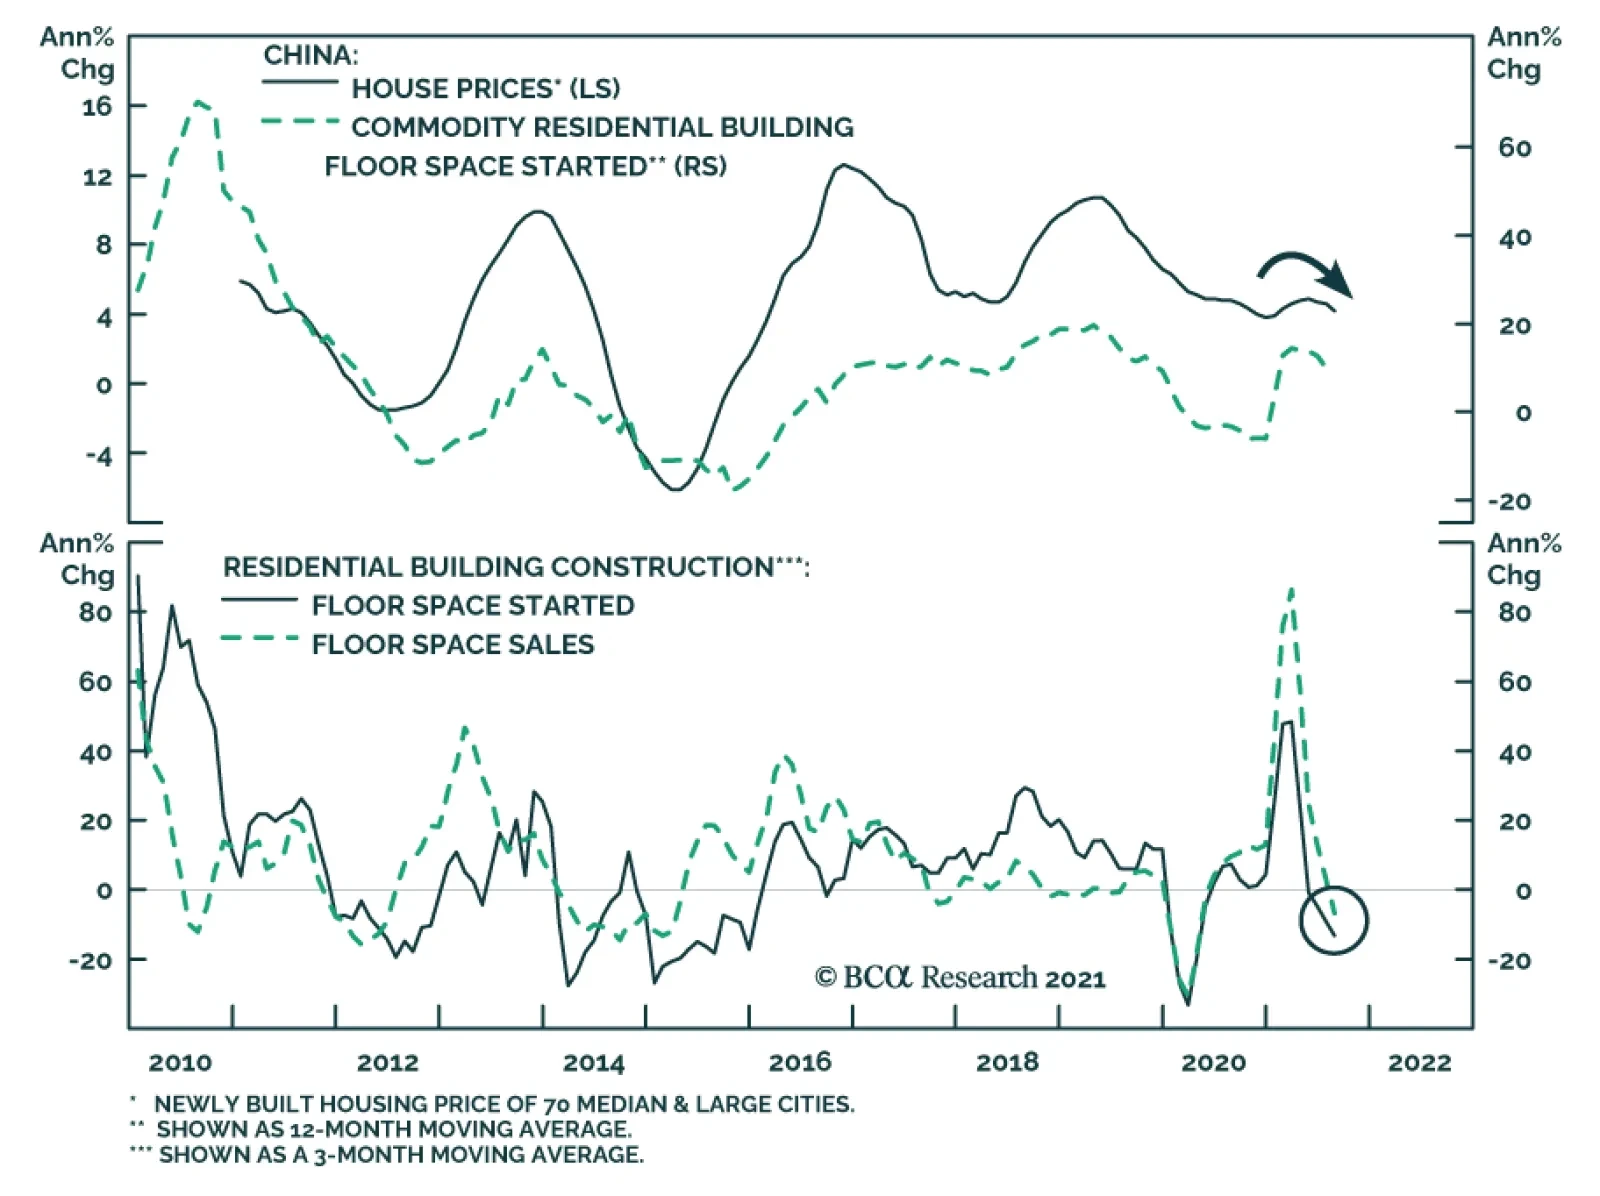
Chinese residential building starts and sales have been contracting since April and July, respectively. Similarly, the level of aggregate building construction activity appears to be rolling over. The Evergrande debacle presents an added downside risk to this…