Sectors
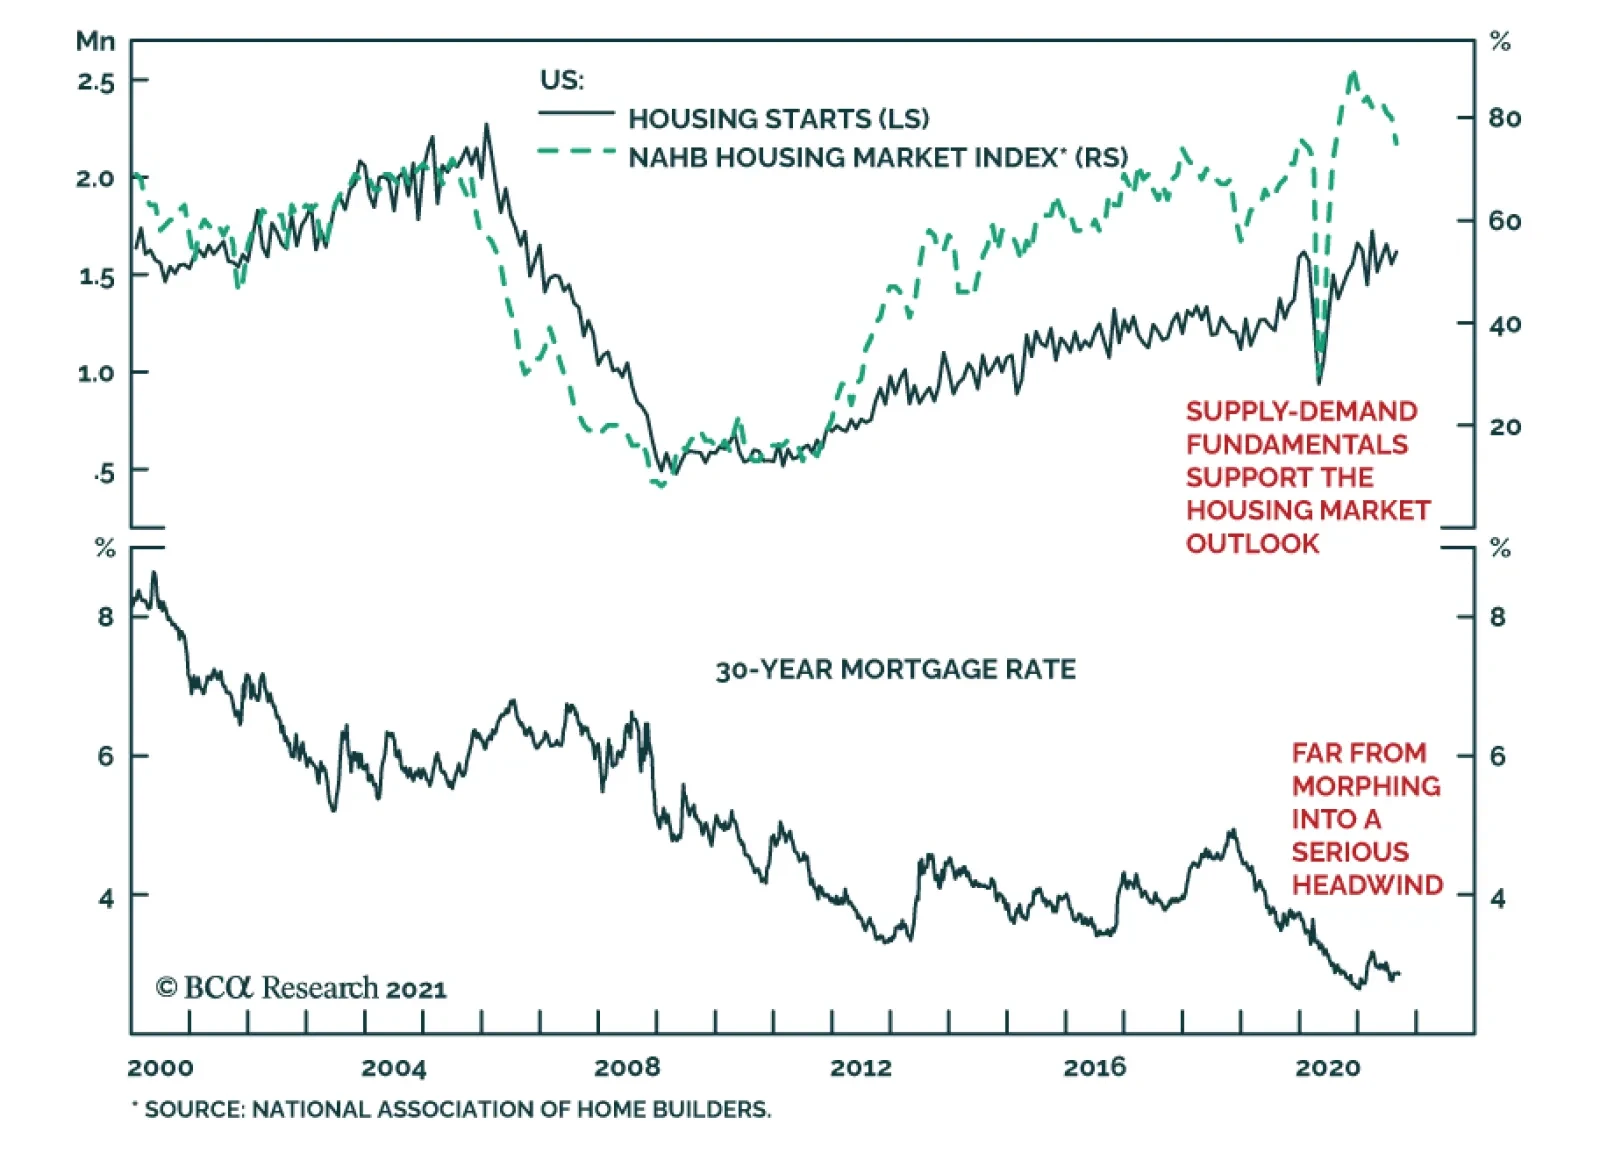
US housing market data surprised to the upside in August. Housing starts increased 3.9% m/m versus expectations of a 1.0% rebound following July’s 6.2% contraction. Similarly, building permits accelerated to 6.0% m/m from 2.3% – beating expectations of a…

Today we take a close look at the historical GICS1 level performance following the taper event in 2013. Chart 1 provides an overview of a price action of the 10-year US Treasury yield, the US dollar, and gold to provide context, while Charts 2 - 4 summarize performance of the S&P sectors. Chart 1
CHART 1
CHART 1
Chart 2
CHART 2
CHART 2
Chart 3
CHART 3
CHART 3
Chart 4
CHART 4
CHART 4
The Fed’s decision to modestly reduce the pace of its asset purchases in December of 2013 was a risk-off event which triggered a decline in Treasury yields and put upward pressure on the dollar. S&P 500 sectors followed the script from a risk-off “playbook” with Technology outperforming on the back of falling Treasury rates, while Financials underperformed. A spike in USD also led to underperformance of the Energy sector. The Consumer Discretionary sector was a notable outlier underperforming the S&P 500 by 6%. However, empirical analysis is hardly helpful in this case as in 2013 Amazon constituted 7.05% of the sector weight compared to 40% today. Finally, the performance of the defensive sectors was mixed as while tapering was perceived by the market as a clear risk-off event, it was also a sign that the economy is strong, and the Fed is comfortable with withdrawing the liquidity crutch. Bottom Line: Investors should not worry about the Fed and tapering as in the US its effect was short-lived and many more years of the bull market have ensued after it.
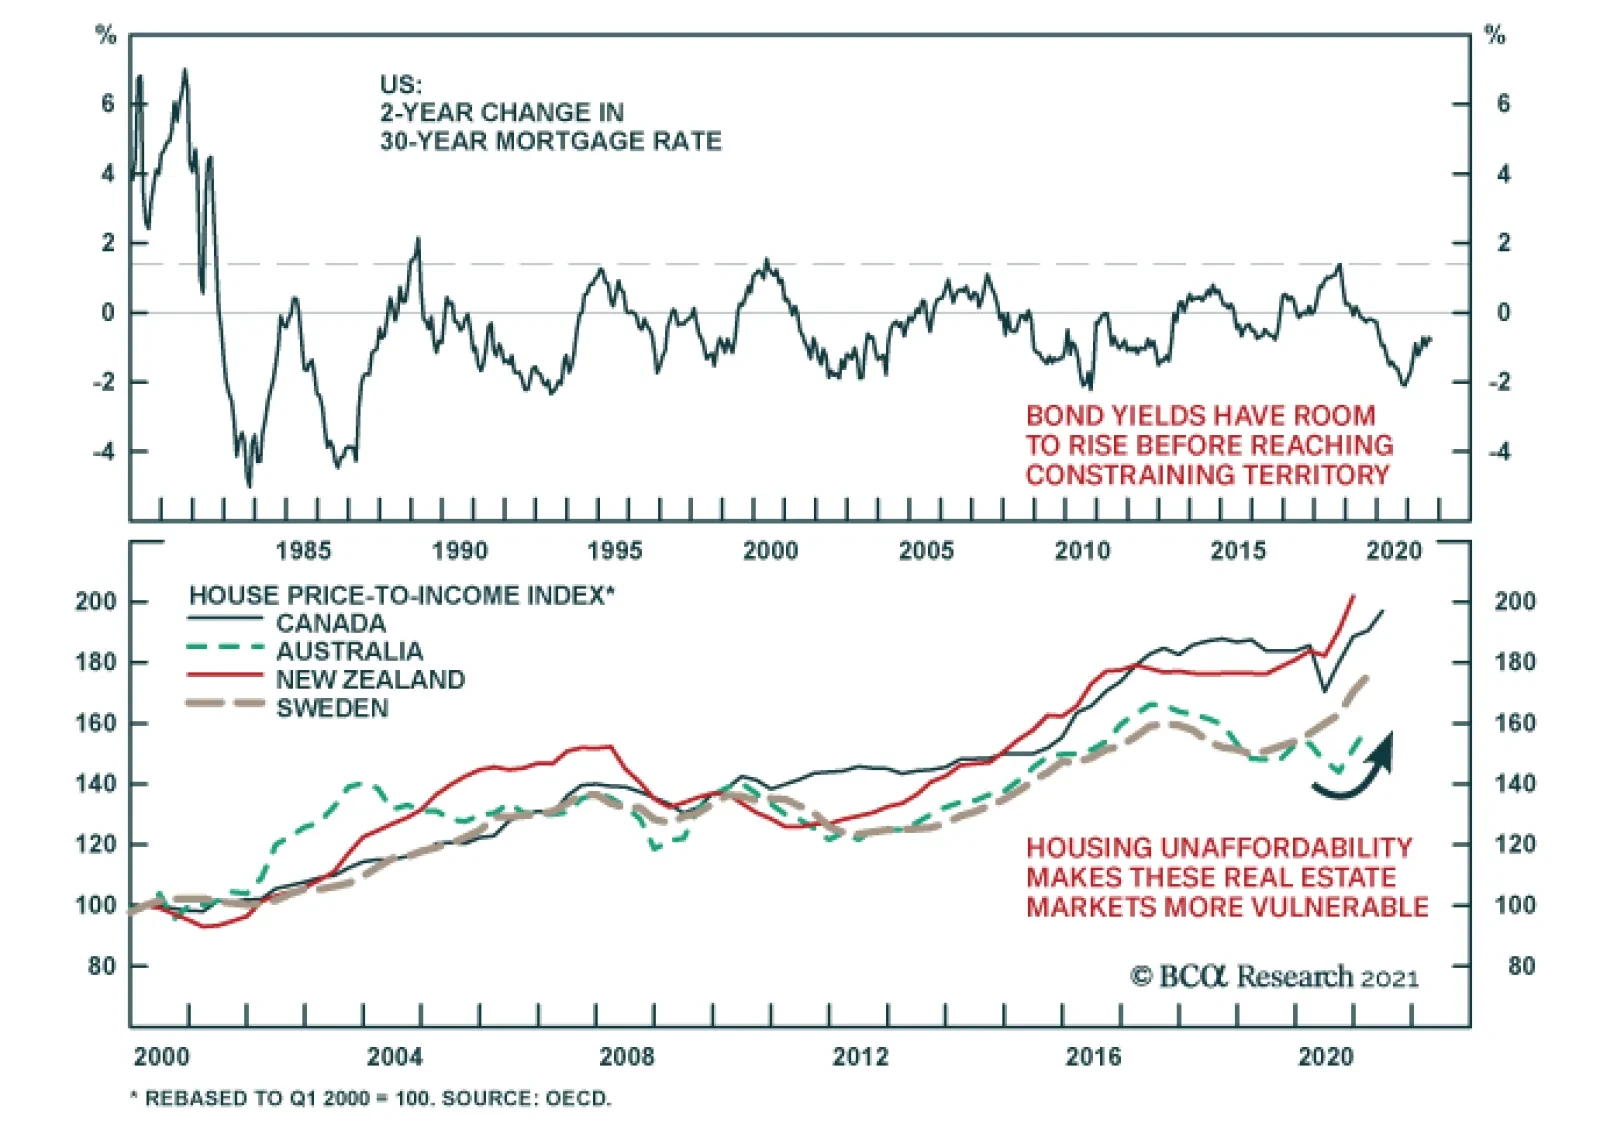
The Evergrade debacle (see Country Focus) underscores the risks facing the global housing market. Ultra-low interest rates are fueling a surge in house prices across the world (see The Numbers). The rapid price increase is making housing increasingly…
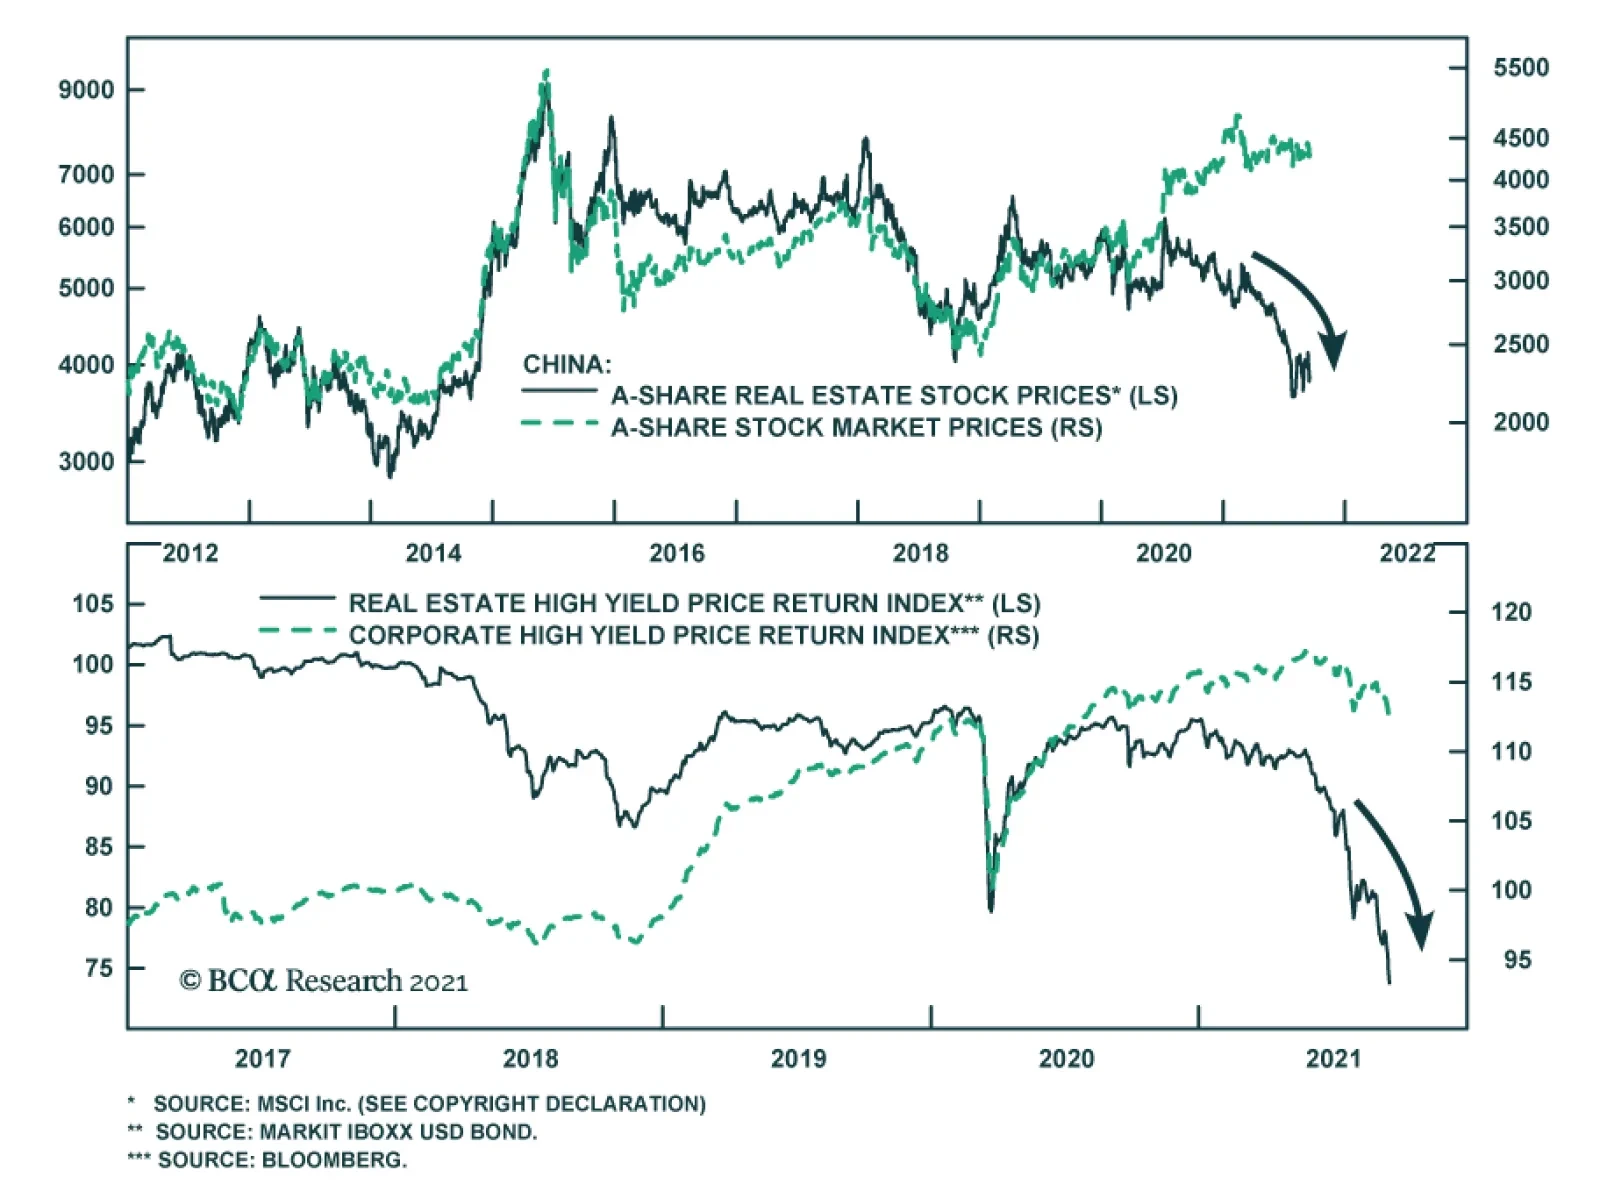
The possibility of Chinese real estate developer Evergrande’s collapse threatens the stability of the country’s economy and financial markets through multiple facets. The company accounts for an outsized share of outstanding high-yield dollar bonds and is…
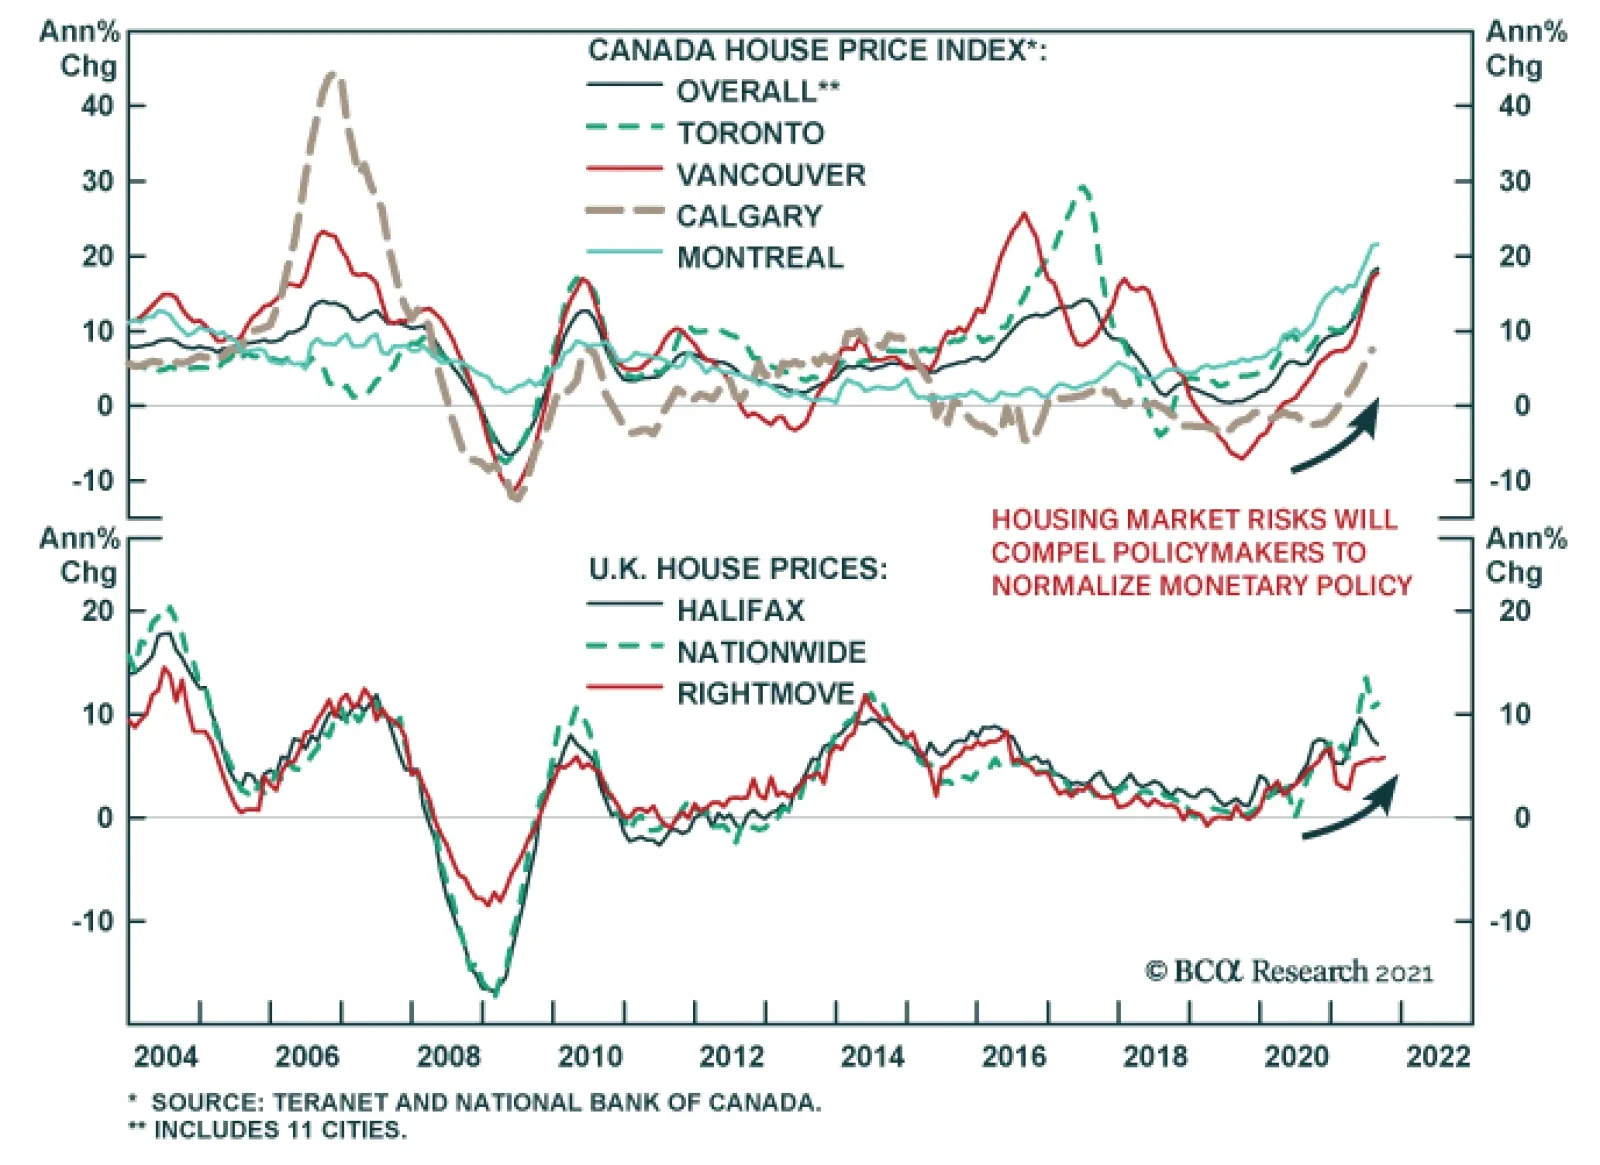
Home prices around the world are continuing their march higher. Canada’s Teranet-National Bank Composite House Price Index accelerated to 18.4% y/y in August from 17.8%. Similarly, the UK’s Rightmove House Price index advanced 5.8% y/y in September from 5.6%.…
Highlights Covid-19 has wreaked havoc in the markets, but the Hotels, Restaurants & Leisure, and Airline industries have been most affected. These industries constitute what we call the “travel complex” as they share common drivers of profitability: First, they have been significantly affected by restrictions imposed on individuals and businesses in response to Covid-19 and, second, they rely on discretionary spending. Recovery of the group was proceeding swimmingly until the Delta variant derailed it in late summer, with reports pouring in about dining rooms closing, airline bookings flagging, and hotel occupancy dipping. What is next? The Delta variant is cresting. Our base case is that herd immunity is not far off. Of course, the travel complex is vulnerable to any new virus scare, and this is a risk investors need to keep in mind. Rising rates will be a mild tailwind for the group, as it tends to outperform in that regime. But this is not a key driver of its performance. Consumer confidence and financial wellbeing are at the core of this group’s profitability. So far, Americans still have money to spare and generally prefer to spend it on services. It is disconcerting that the Consumer Confidence Indicator has turned, but we are not too alarmed just yet: Jobs are still plentiful, and Americans are going back to work. August retail sales surprised on the upside. In Part 1 of the report this week, we take a deep dive into the Hotel, Resort, and Cruise Lines industry. We find the industry attractive for the following reasons: Hotel occupancy has increased, and the amount of money consumers are prepared to spend in hotel stays has surged. Sales are expected to increase by 75%, albeit from low levels, over the next 12 months. Hotels have also discovered many new sources of revenue. Earnings growth is impossible to estimate since last year the industry was losing money; however, margins have just turned positive. Companies also have significant pricing power to pass on expenses to their guests, and have the ability to mend their margins, eventually going back to the historical 20%. Lastly, the industry is cheap relative to its own history on a forward PE basis. According to our Technical Indicator, it is also oversold. The Hotels, Resorts, and Cruise Lines industry has a significant potential to return to its former “glory”, and we believe that it is a sound tactical and cyclical investment. We recommend overweighing this industry. NB: Please stay tuned for Part 2 of the report, on Restaurants and Airlines, next week. Feature Part 1: Hotels, Resorts And Cruise Lines In this two-part publication, we will provide an in-depth overview of Hotels, Restaurants, and Airlines. These industries constitute what we call the “travel complex” as they share many common drivers of profitability: First, they are the industries most exposed to Covid-related fears as well as corresponding government health directives, and, second, they rely on the discretionary spending of both consumers and businesses. In this publication, we will examine the macroeconomic backdrop for the entire travel complex, and then zoom into the Hotels, Resorts, and Cruise Lines industry (“Hotels”). Next week, we will provide an in-depth overview of Restaurants and Airlines. Sneak preview: We are bullish on Hotels and are overweight this industry in our portfolio. Hotels, Restaurant And Leisure, Along With Airlines, Were The Poster Child For Post-Covid Recovery… Covid-19 has wreaked havoc in the markets, but the travel complex was most affected. Airlines, hotels, and restaurants have suffered tremendous losses, and all have required government bailouts either directly, or indirectly through the Paycheck Protection Program (PPP). The travel complex rebounded mightily as the vaccine became widely available in February, and Americans suffering from cabin fever boarded planes, traveled, and ate out (Chart 1). Chart 1Hotels And Airlines Are Still Trading Below Their Pre-Covid Levels
Hotels And Airlines Are Still Trading Below Their Pre-Covid Levels
Hotels And Airlines Are Still Trading Below Their Pre-Covid Levels
Table 1Travel Complex Is Lagging S&P 500
Travel: Extend Your Hotel Stay (Part 1)
Travel: Extend Your Hotel Stay (Part 1)
…Everything Changed This Summer All these positive developments began to reverse over the summer as Delta made its appearance in the US, and even the vaccinated succumbed to fears of infection. Airlines were one of the worst performers in the index. Hotels and restaurants were doing better, but their performance did not shoot the lights out either (Table 1). Restaurants: According to a National Restaurant Association survey of 1,000 adults, in recent weeks nearly one in five Americans say they are no longer going out to restaurants, 9% have canceled existing plans to eat out, and 37% of adults said they ordered delivery or takeout instead of dining in a restaurant. Chains like McDonald’s and Chick-fil-A are slowing their dining room reopenings. As data from restaurant analytics firm Black Box Intelligence demonstrate, sales that had grown steadily earlier this summer have fallen.1 Airlines: Several major airlines have warned in regulatory filings that their third quarter may not look as rosy as hoped. United Airlines has noted a deceleration in customer bookings, while Southwest Airlines reported a continued softness in bookings—even in leisure—and elevated trip cancelations. Similarly, American Airlines has said that, after a strong July, it saw a softness in near-term bookings in August and an increase in near-term cancelations. All three have suggested that the Delta variant is having a dampening effect on business.2 Hotels: Marriott International said that revenue per available room in August of 2021 was down 27% from the 2019 level – a drop from the 23% decline seen in July. However, the CEO of the company sounded sanguine: “The trends seem to be stabilizing as we get into the early days of September”. Most of the decline came from lockdowns in China. The most recent data shows revenue per available room was down 44 percent off 2019 levels — not ideal but an improvement from the 57 percent decline seen a week prior.3 With bad news abundant, the natural question is whether these industries are still a good tactical and cyclical investment. Delta Variant Clearly, a resurgence in infections has had an adverse effect on the travel complex. However, there are early signs that the Covid-19 Delta variant is cresting (Chart 2). Around 75% of the U.S. population has had at least one vaccine shot. Globally, 31.5 million doses/day are being administered. At this rate, it will take just eight months to vaccinate 75% of the global population. Herd immunity is not far off. Our base case is that Covid-19 and its multiple variants are unlikely to disappear, but consumers and businesses are learning how to live with it. We believe that the surge of Delta infections will subside over the fall, and the entire travel complex will continue to recuperate from the Covid-inflicted damage. Of course, the resurgence of Covid-19 cases and newer variants could undermine a recovery. This is a risk investors need to monitor. Chart 2The Covid-19 Delta Variant Is Cresting
The Covid-19 Delta Variant Is Cresting
The Covid-19 Delta Variant Is Cresting
Macroeconomic Backdrop Rising Rates Are A Tailwind For The Travel Complex Direction and rate of change in yields dictate which US equity sectors and industries will do well. There are many crosscurrents in both economic data and Fed speak currently that obscure the answer to this question. Analysis of the performance of travel industries by rates regime suggests that all of them tend to do better when rates are rising, as higher rates indicate stronger economic growth (Chart 3). Airlines are most sensitive to an economic slowdown and will underperform most if rates stay “lower for longer”. Consumers Still Have Money To Spend On Services But Less Than Before Chart 3Travel Outperforms When Rates Are Rising
Travel: Extend Your Hotel Stay (Part 1)
Travel: Extend Your Hotel Stay (Part 1)
Travel is a quintessential representation of discretionary spending on services. Consumers travel and eat out when they are confident about the future and have a healthy income and excess savings. Chart 4Disposable Income And Savings Are Returning To Trend
Disposable Income And Savings Are Returning To Trend
Disposable Income And Savings Are Returning To Trend
The helicopter money drop has increased consumer income and padded their savings. However, income gains were not permanent and, recently, disposable income has returned to trend (Chart 4, Panel 1). Further, much of the excess savings has been spent (Chart 4, Panel 2). In another unpleasant twist, over the past few months, wage gains (4.8%) have lagged price increases (5.2%), reducing the purchasing power of American consumers. In response to these developments, the consumer mood has soured: The Consumer Confidence Indicator has slumped to a six-month low of 114 from 125 a month earlier. The next 12-month inflation expectations have surged to 6.5%. While it is disconcerting that consumer confidence has turned, we are not too alarmed just yet: Jobs are still plentiful, and Americans are likely to go back to work as the majority of children are now attending schools in person. In short, Americans are not destitute, but the pattern of spending is normalizing and returning to the pre-pandemic trend. The August retail sales print at 0.7% surprised on the upside and proves that US consumers have not tightened their belts. It is also a positive for the travel complex that demand for services exceeds demand for goods: Consumer expenditure on goods is above trend and has recently turned, while spending on services is below pre-pandemic levels, and the rebound is running its course (Chart 5). Inflation Is Not A Concern For The Travel Complex CPI readings for the travel complex this summer looked outright scary: In July, airfares were up 19% YoY and the price of hotel stays was up 24% YoY. These numbers have come down to 6.7% and 19.6% in August. Indeed, these readings make us wonder whether travel is still affordable to consumers. The answer is a resounding “yes” – reported surges in prices are a function of a base effect and, compared to the same time two years ago, the two-year CAGR of prices looks reasonable for all the industries (Chart 6). Chart 6Price Increases For The Travel Complex Are Moderate
Travel: Extend Your Hotel Stay (Part 1)
Travel: Extend Your Hotel Stay (Part 1)
Chart 5Real Spending On Services Is At Pre-Pandemic Levels: Room For Further Rebound
Real Spending On Services Is At Pre-Pandemic Levels: Room For Further Rebound
Real Spending On Services Is At Pre-Pandemic Levels: Room For Further Rebound
Analysis By Industry: Hotels, Resorts, And Cruise Lines Hotels is a $55B industry4 which is forecast to produce 31.4% growth in 2021 (Table 2). Its market cap is $239Bn and it constitutes 0.6% of the S&P 500 index. The US Hotel industry suffered about $125 billion5 in aggregate lost revenues due to the pandemic in 2020. Hotel operators were in total cash-conservation mode – slashing capex budgets by 75%, suspending dividends, and raising capital. Some 670,000 workers lost their jobs or were furloughed – only half of these workers have returned so far (Chart 7). Table 2Hotels (GICS 4) Constituents
Travel: Extend Your Hotel Stay (Part 1)
Travel: Extend Your Hotel Stay (Part 1)
After a tough year, Hotels have now mostly reopened. Demand is expected to surge by 31.4% YoY in 2021, and per room revenue has reached $94, higher than the pre-Covid-19 level. Many hotels have returned to profitability. However, hotel occupancy in the US is yet to return to the pre-pandemic level: It currently stands at around 50% compared to 70% plus pre-Covid (Chart 8). Chart 7Industry Was Decimated By Covid And Is Recovering Slowly
Industry Was Decimated By Covid And Is Recovering Slowly
Industry Was Decimated By Covid And Is Recovering Slowly
Chart 8Occupancy Rates Are Returning Back To Normal
Occupancy Rates Are Returning Back To Normal
Occupancy Rates Are Returning Back To Normal
Sources Of Revenue Hotels started to recover during the first half of 2021 and revenues are expected to continue to surge to well above the pre-pandemic level in 2022. Analysts expect hotel sales to rebound by 75% over the next 12 months (Chart 9). There are multiple sources of revenue, and a reduction in business travel and international tourism is likely to be replaced by other creative options. Leisure Travel: Significant pent-up demand has been driving a recovery in hotel stays, but it is mostly in leisure travel. According to AHLA, 56% of consumers say they expect to travel for leisure, roughly the same amount as in an average year. Consumer spending on hotels has rebounded and is close to the pre-pandemic normal (Chart 10). Chart 9Blockbuster Sales Growth Is Expected (Off Low Base)
Blockbuster Sales Growth Is Expected (Off Low Base)
Blockbuster Sales Growth Is Expected (Off Low Base)
Chart 10Consumers Eagerly Spend On Hotels
Consumers Eagerly Spend On Hotels
Consumers Eagerly Spend On Hotels
Business travel is still lagging. According to AHLA, business travel was down by 85% compared to 2019 through April 2021, and since then has only begun ticking up slightly. However, going forward, this trend may turn as companies start positioning their in-person visits as a competitive advantage. Bleisure travel: A new post-Covid trend has developed: Workers combine business travel with leisure, prolonging hotel stays. Another creative idea is “working from a hotel” packages to appeal to remote workers tired of being cooped up at home. International tourism: Covid-related restrictions in the rest of the world, and especially cessation of travel from China, is still denting hotel revenue. With global vaccination rates improving by the day, this segment won’t take long to rebound. Profitability While there is forecast to be a pronounced rebound in hotel sales growth over the next 12 months, it is less obvious whether and when the industry will return to its former levels of profitability (Chart 11). After all, not only was the travel complex damaged by the pandemic, but now hotel operators also incur additional Covid-related cleaning expenses. Currently, analysts expect the next 12 months EPS to rebound to about a quarter of January 2020 trailing EPS ($10 vs $34). While this looks measly, from an investment standpoint it presents an opportunity as eventually, albeit slowly, earnings will return to trend. Historical earnings growth is not calculable as the industry was losing money until very recently. Chart 11Earnings Are Expected To Grow Again
Earnings Are Expected To Grow Again
Earnings Are Expected To Grow Again
Margins And Pricing Power Margins crossed the zero threshold in Q2-2021, but are still almost 20 percentage points below the long-term average (Chart 12). While hotel costs have increased with the pandemic, this industry has significant pricing power to pass on its costs to consumers (Chart 13). Chart 12The Hotel Industry Has Returned To Profitability
The Hotel Industry Has Returned To Profitability
The Hotel Industry Has Returned To Profitability
Chart 13Hotels Have Significant Pricing Power And Can Pass Extra Costs To Guests
Hotels Have Significant Pricing Power And Can Pass Extra Costs To Guests
Hotels Have Significant Pricing Power And Can Pass Extra Costs To Guests
Valuations And Technicals The Hotels industry is trading at 30x forward PE and on a 5-year normalized basis, it is trading with a discount to the S&P 500, which is unusual (Chart 14). In terms of our Technical Indicator, the industry is somewhat oversold, and now looks more attractive than it did earlier this year (Chart 15). Chart 14Hotels Are Trading With A Discount To S&P 500 Which Is Unusual
Hotels Are Trading With A Discount To S&P 500 Which Is Unusual
Hotels Are Trading With A Discount To S&P 500 Which Is Unusual
Chart 15Hotels Are Slightly Oversold
Hotels Are Slightly Oversold
Hotels Are Slightly Oversold
Cruise Lines Cruise Lines were the worst-hit and the slowest to recover among the sub-industries, but they are expected to make a comeback in 2022 with a significant surge in revenue growth. Most of the drivers for these companies are similar to Hotels and Resorts – but recovery is delayed due to restrictions that kept cruise ships anchored much longer than initially expected. Investment Implications We stay with our overweight in Hotels, Resorts, and Cruise Lines. We will summarize the reasons: The Delta variant is cresting. Our base case is that herd immunity is not far off. Of course, the industry is also vulnerable to any new virus scare, and this is a risk that investors need to keep in mind. Rising rates will be a mild tailwind for the industry, as it tends to outperform in that regime. But this is not a key driver of its performance. Consumer confidence and financial wellbeing are at the core of Hotel profitability. So far, Americans still have money to spare and prefer to spend it on services. It is disconcerting that the Consumer Confidence Indicator has turned, but we are not too alarmed just yet: Jobs are still plentiful, and Americans are going back to work. Hotel occupancy has increased, and the amount of money consumers are prepared to spend on hotel stays has surged. Sales are expected to increase by 75%, albeit from lower levels, over the next 12 months. Hotels have also discovered many new sources of revenue. Historical earnings growth is not available as until recently the industry was losing money; however, margins have just turned positive. Companies also have the significant pricing power to pass on expenses to their guests and have the ability to mend their margins, eventually going back to the historical 20%. Lastly, the industry is cheap relative to its own history on a forward PE basis. According to our Technical indicator, it is also oversold. The Hotels, Resorts, and Cruise Lines industry has significant potential to return to its former “glory”, and we believe that it is a sound tactical and cyclical investment. We recommend overweighing this industry. Bottom Line The Hotels, Resorts, and Cruise Lines industry has been severely damaged by the pandemic, and the road to recovery may be long. It is also vulnerable to any new virus scare. However, with Delta cresting, financially healthy US consumers choosing to spend their money on services and experiences, sell-side forecasts pointing to surging sales, and companies possessing substantial pricing power mean that we are bullish on the industry. Irene Tunkel Chief Strategist, US Equity Strategy irene.tunkel@bcaresearch.com Footnotes 1 Restaurants Close Dining Rooms Again as Delta-Driven Infections Spread, WSJ, September 13, 2021. 2 Travel Investors Need More Drive, WSJ, September 12, 2021. 3 Hotel Industry News: Marriott CEO Sees Hotels Bouncing Back Quickly After Delta Variant Slump, Skift, September 9, 2021. 4 IBISWorld, August 23, 2021. 5 Oxford Economics. Recommended Allocation
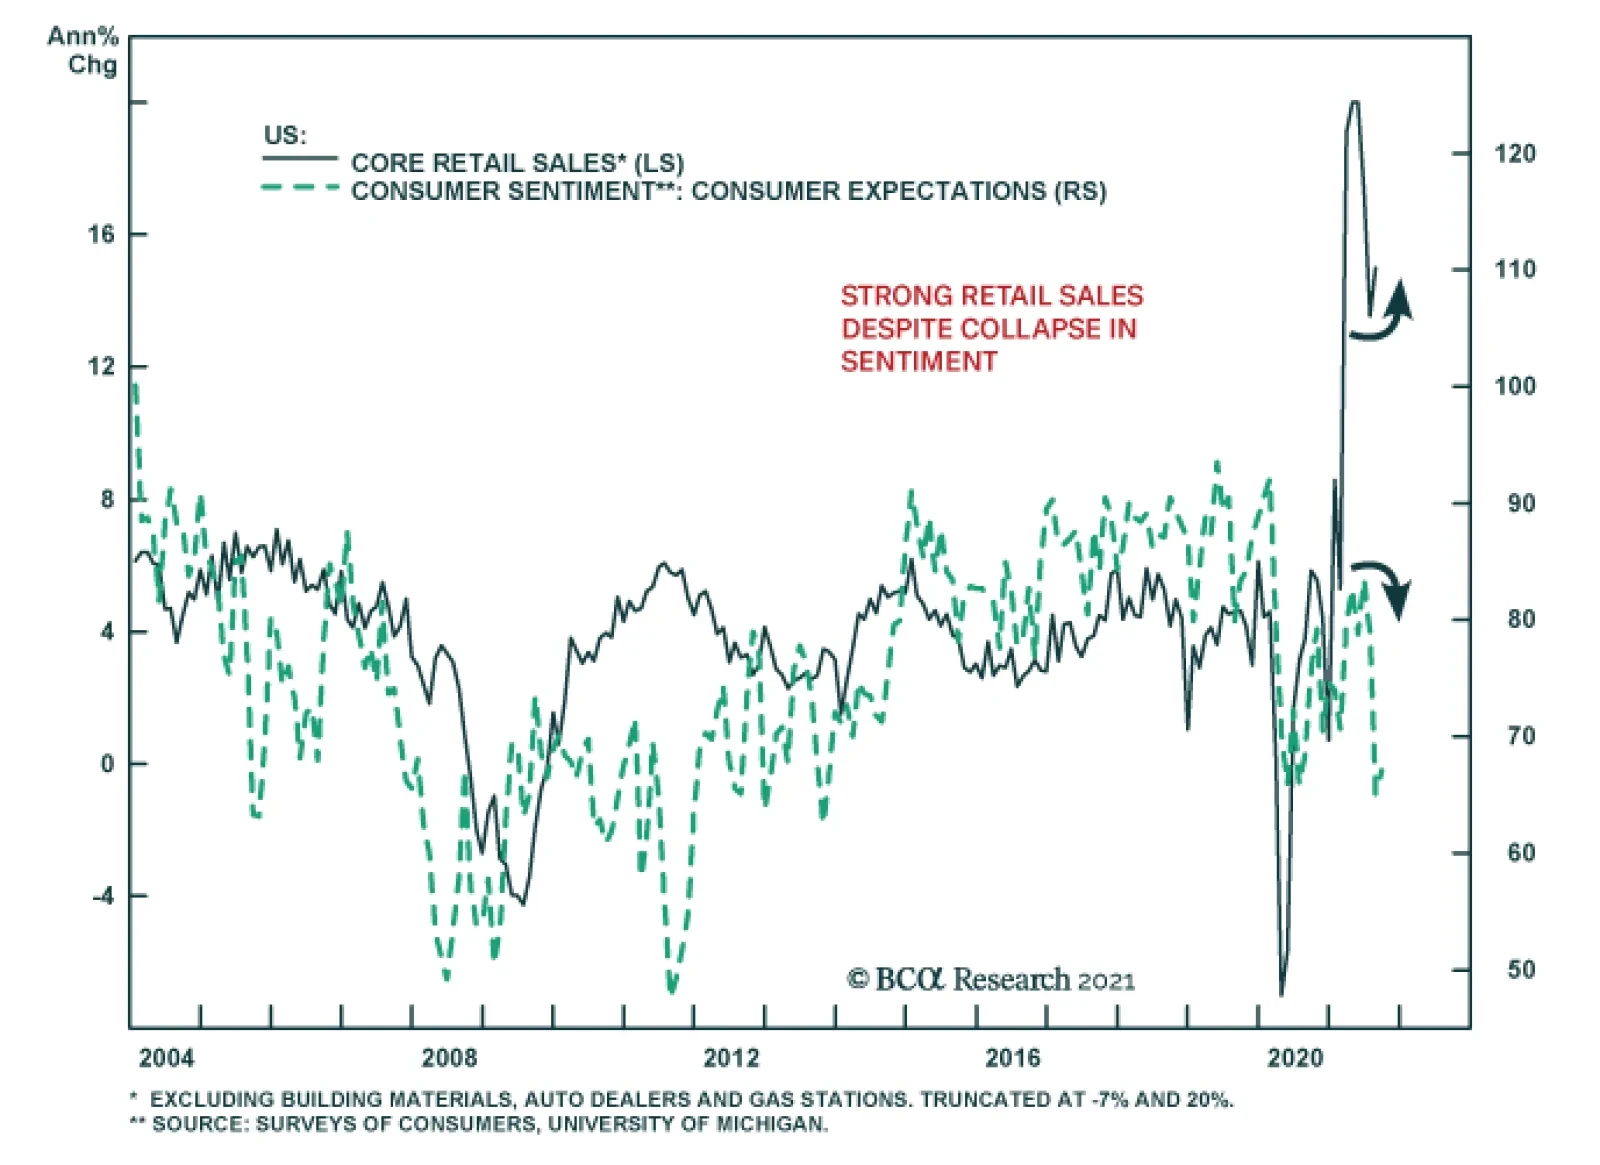
Friday’s preliminary University of Michigan Consumer Sentiment survey revealed that American households experienced a minor improvement in confidence in August. The headline index ticked up 0.7 points to 72. The minor increase reflects a two-point improvement…
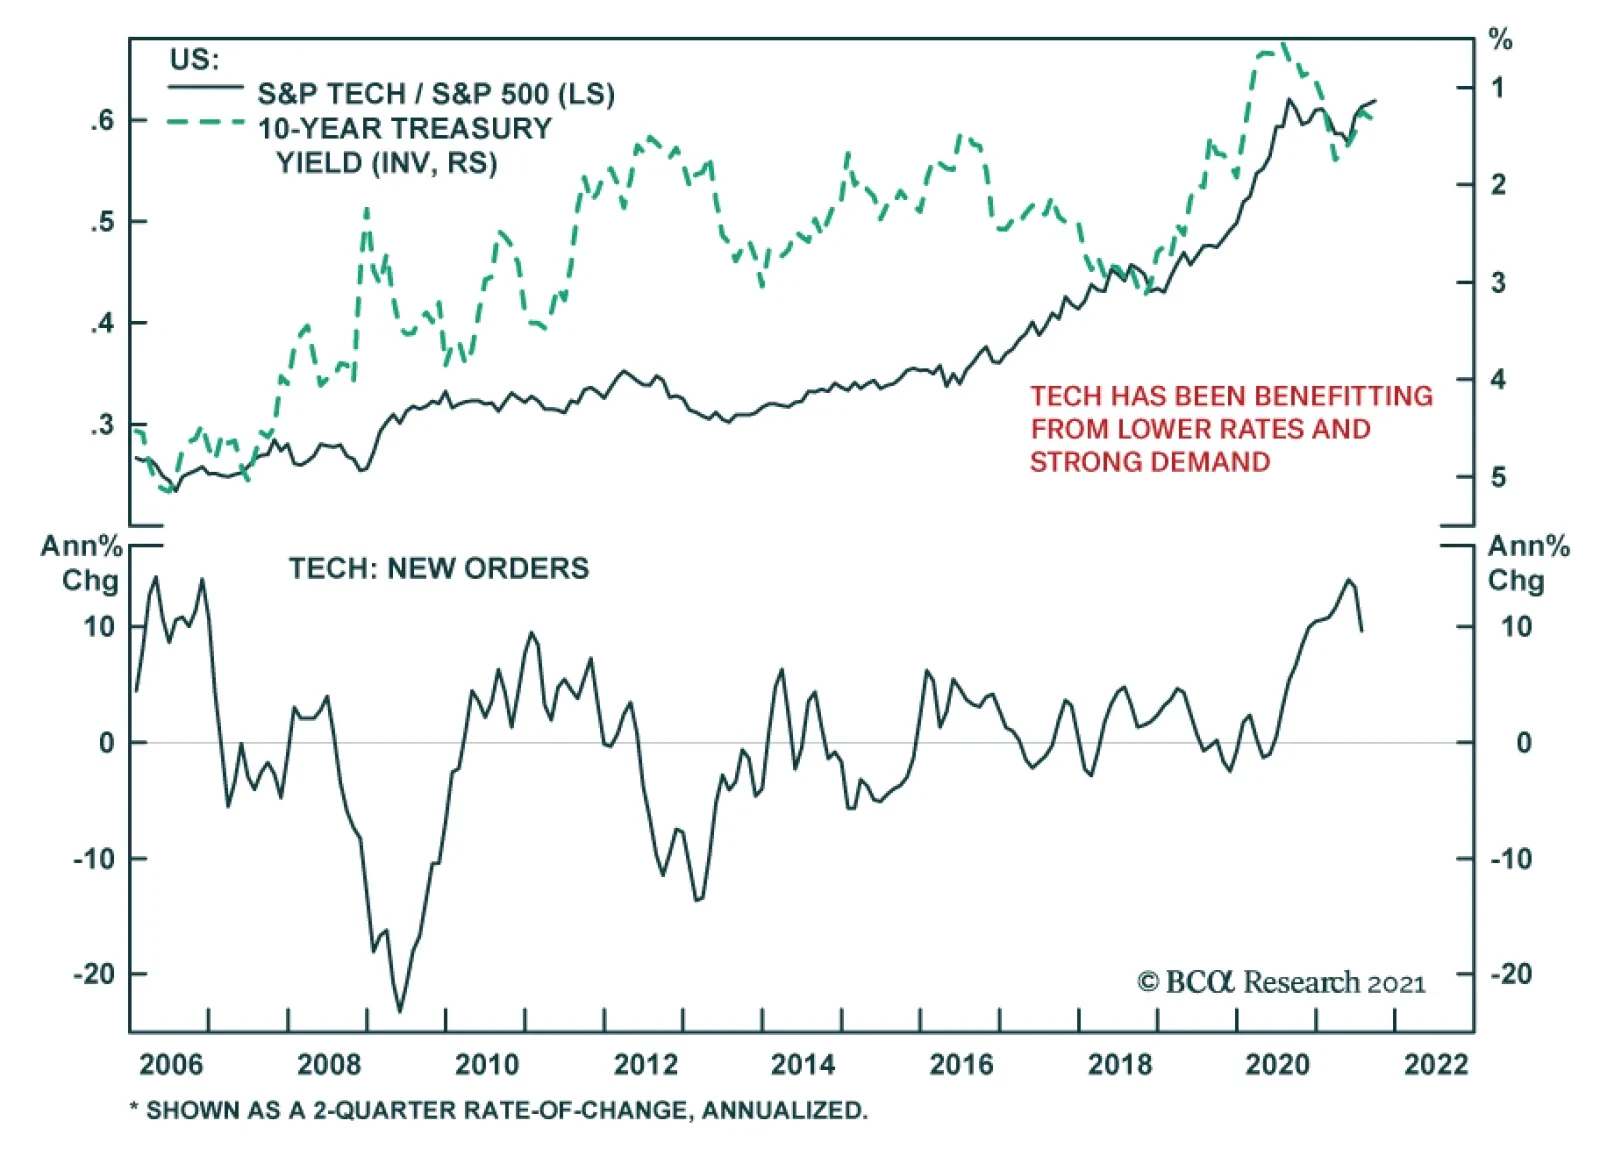
The rally in US Treasurys since March has been positive for tech stocks. The S&P 500 tech sector outperformed the benchmark by 6.58% since then. This strong performance has occurred despite elevated inflation prints and the Fed’s plan to begin normalizing…
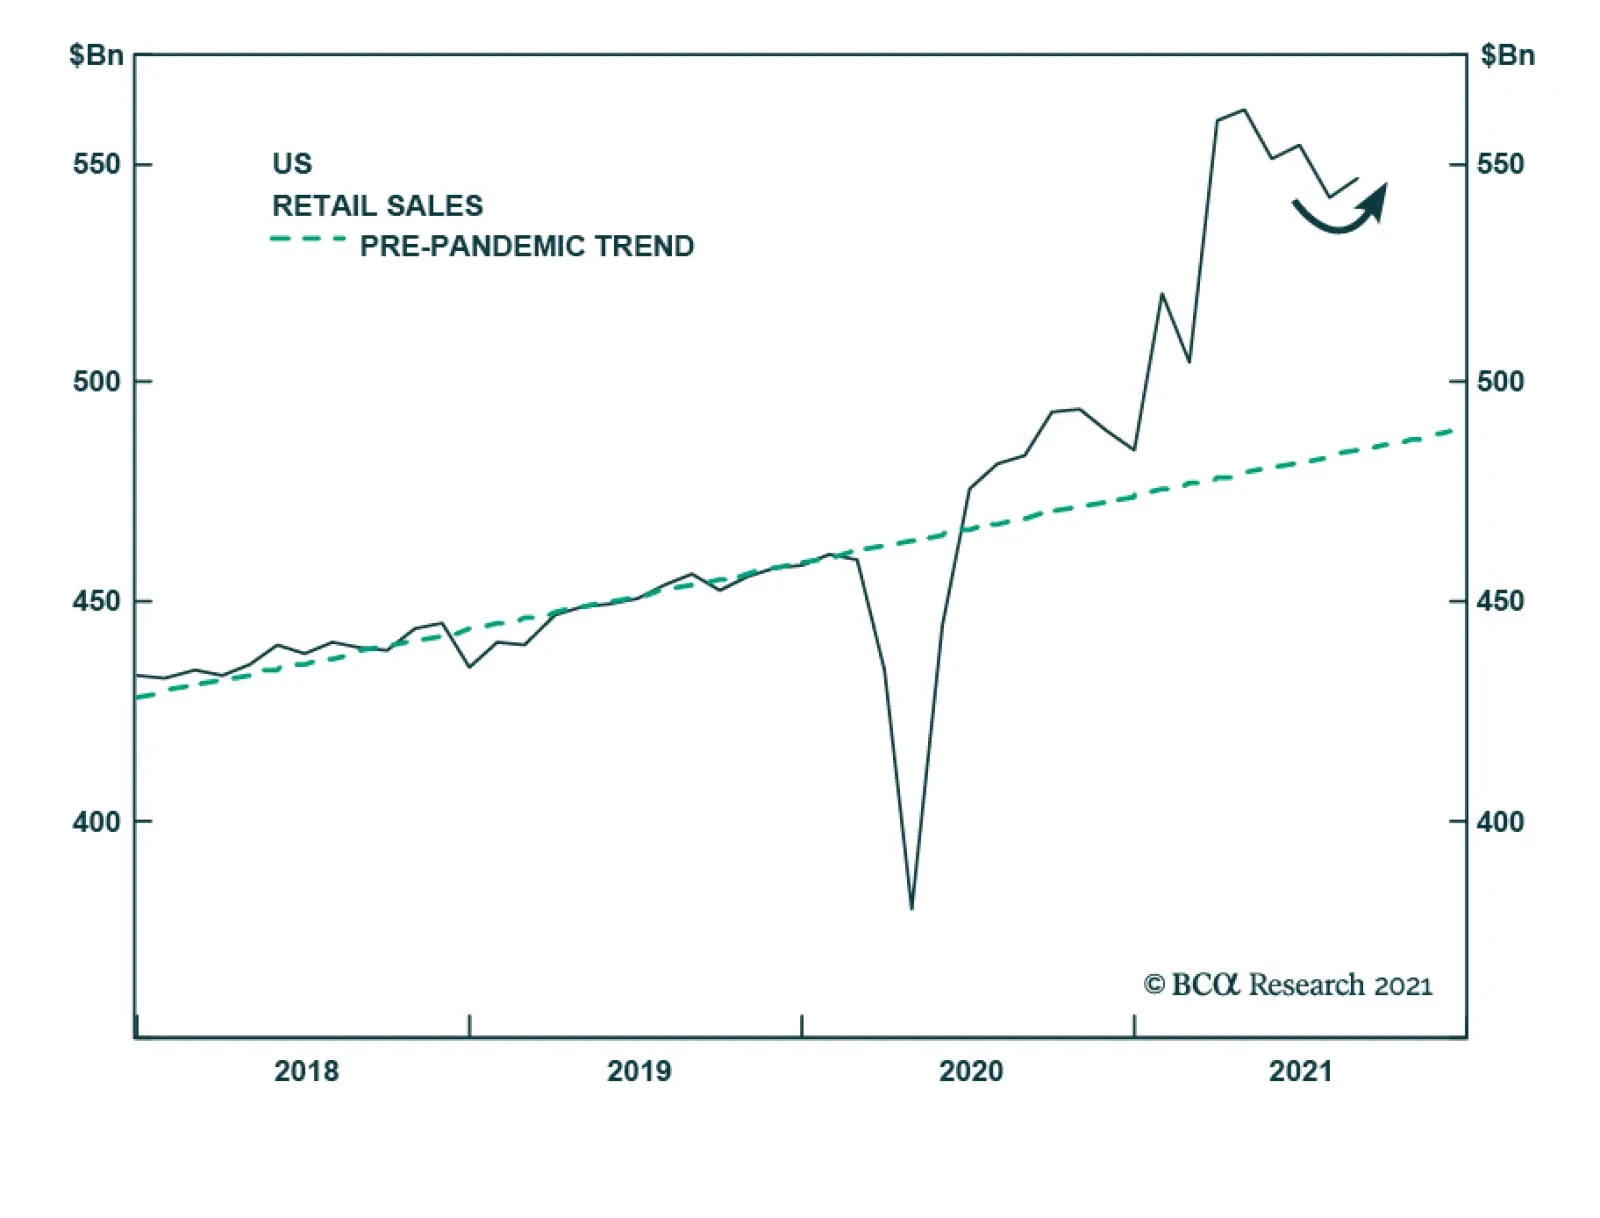
US retail sales for August delivered a positive surprise. The headline number grew 0.7% m/m following the prior month’s downwardly revised decline of 1.8%. Similarly, the retail sales control group expanded 2.5% m/m from a downwardly revised 1.9 decrease. …
Highlights The odds of a stronger recovery in EM oil demand next year are rising, as vaccines using mRNA technology are manufactured locally and become widely available.1 This will reduce local lock-down risks in economies relying on less efficacious COVID-19 vaccines – or lacking them altogether – thereby increasing mobility, economic activity and oil demand. Our global crude oil balances estimates are little changed to the end of 2023, which leaves our price expectations mostly unchanged: 4Q21 Brent prices are expected to average $70.50/bbl, while 2022 and 2023 prices average $75 and $80/bbl, respectively (Chart of the Week). The balance of risks to the crude oil market remain to the upside in our estimation. In addition to a higher likelihood of better-than-expected EM demand growth, we expect OPEC 2.0 production discipline to hold, and for the price-taking cohort outside the coalition to continue prioritizing investors' interests. We remain long commodity index exposure – S&P GSCI and COMT – and, at tonight's close, will be getting long the DFA Dimensional Emerging Core Equity Market ETF (DFAE) on the back of increasing local mRNA vaccine production in EM economies. Feature As local production of COVID-19 vaccines employing mRNA technology spreads throughout EM economies, the odds of a stronger-than-expected recovery in oil demand next year will increase. The buildout of production and distribution facilities for this technology is progressing quickly in Asia – e.g., Chinese mRNA tech joint ventures are expected to be in production mode in 4Q21 – Latin America, Africa, and the Middle East.2 Accelerated availability of more efficacious vaccines globally will address the "fault lines" identified by the IMF in its July 2021 update. In that report, the Fund notes a major downside risk to its global GDP growth expectation of 6% this year remains slower-than-expected vaccine rollouts to emerging and developing economies.3 The other major risk identified by the Fund is too-rapid a winddown of policy support in DM economies, which would lead to tighter financial conditions globally. Our global demand expectation is driven by GDP estimates from the IMF and World Bank. The implication of that assumption is the powerful recovery in DM oil demand seen this year will slow while EM demand picks up next year (Chart 2). We proxy DM oil demand with OECD oil consumption and EM demand with non-OECD consumption. We continue to expect overall oil demand to recover by just over 5.0mm b/d this year and 4.4mm b/d next year (Table 1). Chart of the WeekOil Forecasts Hold Steady
Oil Forecasts Hold Steady
Oil Forecasts Hold Steady
Chart 2Higher EM Oil Demand Expected in 2022
Higher EM Oil Demand Expected in 2022
Higher EM Oil Demand Expected in 2022
Table 1BCA Global Oil Supply - Demand Balances (MMb/d, Base Case Balances) To Dec23
Upside Price Risk Rises For Crude
Upside Price Risk Rises For Crude
Global Oil Supply To Remain Steady Hurricane Ida will have removed ~ 30mm barrels of US offshore oil output by the time losses are fully tallied, based on IEA estimates. Even so, in line with the US EIA, we expect offshore US oil production will recover from the damage caused by the storm in 4Q21 and be back at ~ 1.7mm b/d on average over the quarter. This will allow oil prices to ease slightly from current elevated levels over the balance of the year. Inland, US shale-oil output remains on track to average ~ 9.06mm b/d this year, 9.55mmb/d in 2022 and 9.85mmb/d in 2023, in our modeling (Chart 3). We expect production in the Lower 48 states of the US to remain mostly steady going forward. Production from finishing drilled-but-uncompleted (DUCs) shale-oil wells is the lowest it's been since 2013. Output from these wells will remain relatively low for the rest of the year. This supply was developed during the COVID-19 pandemic, as it was cheaper to bring on than new drilling. For 2022 and 2023 overall, our model points to a slow build-up in US shale-oil output as drilling increases. Going into 2022, we expect continued production discipline from OPEC 2.0, and for the coalition to continue to manage output in line with actual demand it sees from its customers. The 400k b/d being returned monthly to the market over August 2021 to mid-2022 will accommodate demand increases. However, it will be monitored closely in the event demand fails to materialize, as has been OPEC 2.0's wont over the course of the pandemic. Chart 3US Shale-Oil Output Mostly Stable
US Shale-Oil Output Mostly Stable
US Shale-Oil Output Mostly Stable
Oil Markets To Remain Balanced We see markets remaining balanced to the end of 2023, with OPEC 2.0 maintaining its production-management strategy – keeping the level of supply just below the level of demand – and the price-taking cohort led by US shale-oil producers remaining focused on maintaining margins so as to provide competitive returns to investors. On the demand side, EM growth will pick up as DM growth slows. Given our fundamental view, global crude oil balances estimates are little changed to the end of 2023 (Chart 4). This allows inventories to continue to draw this year and next, then to slowly rebuild as production increases toward the end of 2023 (Chart 5). Falling inventories will keep the Brent forward curve backwardated – i.e., prompt-delivery oil will trade higher than deferred-delivery oil. Chart 4Markets Remain Balanced...
Markets Remain Balanced...
Markets Remain Balanced...
Chart 5...And Oil Inventory Continues To Draw
...And Oil Inventory Continues To Draw
...And Oil Inventory Continues To Draw
The backwardated forward curve means OPEC 2.0 producers will continue to realize higher delivered prices on their crude oil than the marginal shale-oil producer, which hedges its production 1-2 years forward to stabilize revenue. This is the primary benefit to the member states in the producer coalition: a backwardated curve pricing closer to marginal cost limits the amount of revenue available to shale-oil producers, and thus restrains output to that which is profitable at the margin. Investment Implications Our supply-demand outlook keeps our price expectations mostly unchanged from last month's forecast. We expect 4Q21 Brent prices to average $70.50/bbl, while 2022 and 2023 prices average $75 and $80/bbl, respectively, as can be seen in the Chart of the Week. WTI prices will continue to trade $2-$4/bbl below Brent over this interval. With fundamentals continuing to support a backwardated forward curve in Brent and WTI, we continue to favor long commodity-index exposure, which benefits from this structure.4 Therefore, we remain long the S&P GSCI and the COMT ETF, which is an optimized version of the GSCI that concentrates on positioning in backwardated futures contracts. The upside risk to oil prices resulting from increasing local production of mRNA vaccines in EM economies that had relied on less efficacious vaccines undoubtedly will increase mobility and raise oil demand, if, as appears likely, the impact of this localization is realized in the near term. This also could boost commodity demand generally, if it allows trade and GDP growth to accelerate in EM economies, which supports our long commodity-index view. The rollout of mRNA technology into EM economies also suggests EM GDP growth could increase at the margin with locally produced mRNA vaccines becoming more available. This would redound to the benefit of trade and economic activity generally.5 It also could help unsnarl the movement of goods globally. The wider implications of a successful expansion of locally produced mRNA vaccines leads us to recommend EM equity exposure on a tactical basis. At tonight's close, we will be getting long the DFA Dimensional Emerging Core Equity Market ETF (DFAE). As this is tactical, we will use a tight stop (10%) for this recommendation. Robert P. Ryan Chief Commodity & Energy Strategist rryan@bcaresearch.com Ashwin Shyam Research Associate Commodity & Energy Strategy ashwin.shyam@bcaresearch.com Commodities Round-Up Energy: Bullish Natural gas demand is surging globally. Record-breaking heat waves in the US are driving demand for gas-fired generation required to meet space-cooling demand. In addition, in the June-August period, the US saw record LNG exports. Europe and Asia are competing for the fuel as both prepare for winter. Brazil also has been a strong bid for LNG, as drought there has reduced hydropower supplies. In Europe, natural gas inventories were drawn hard this past winter as LNG supplies were bid away to Asia to meet space-heating demand. This is keeping Europe well bid now as winter approaches (Chart 6). The US Climate Prediction Center last week gave 70-80% odds of a second La Niña for the Northern Hemisphere winter. Should it materialize, it could again drive cold artic air into their markets, as it did last winter, and push natgas demand higher. Our recommendation to get long 1Q22 $5.00/MMBtu calls vs short 1Q22 $5.50/MMBtu calls last week was up 17% as of Tuesday's close. We remain long. Base Metals: Bullish The slide in iron ore prices from its ~ $230/MT peak earlier this year can be attributed to weak Chinese demand, and the possibility of its persistence through the winter and into next year (Chart 7). The world’s largest steel-producing nation is aiming to limit steel output to no higher than 2020 levels, in a bid to reduce industrial pollution. According to mining.com, provincial governments have directly asked local steel mills to curb output. Regulation in this sector in China will continue to reduce prices of iron ore, a key raw material in steel production. Precious Metals: Bullish The lower-than-expected reading on the US core CPI earlier this week weighed on the USD, and propelled gold prices above the $1,800/oz mark. While markets expected lower consumer prices for August to diminish the Fed’s resolve to taper asset purchases by year-end, we do not think the lower month-on-month CPI number will delay tapering. The timing of the Fed's initial rate hike – expected by markets to occur after the tapering of the central bank's asset-purchase program – will depend on the US labor force reaching "maximum employment." According to BCA Research's US Bond Strategy, this criterion will be met in late-2022 or early-2023. Low-interest rates, coupled with persistent inflation until then, will be bullish for gold prices. Chart 6
Upside Price Risk Rises For Crude
Upside Price Risk Rises For Crude
Chart 7
CHINA IMPORTED IRON ORE GOING DOWN
CHINA IMPORTED IRON ORE GOING DOWN
Footnotes 1 Please see Everest to bring Canadian biotech's potential Covid shots to China, other markets published on September 13, 2021 by indiatimes.com. 2 Examples of this include Brazil's Eurofarma to make Pfizer COVID-19 shots for Latin America, published by reuters.com; Biovac Institute to be first African company to produce mRNA vaccines, published be devex.com; and mRNA Vaccines Mark a New Era in Medicine, posted by supertrends.com. The latter report also discusses the application of mRNA technology to other diseases like malaria. 3 Please see Fault Lines Widen in the Global Recovery published 27 July 2021 by the Fund. 4 Backwardation is the source of roll yield for long-index exposure. This is due to the design of these index products, which buy forward then – in backwardated markets – roll out of futures contract as they approach physical delivery at a higher level and re-establish their exposure in a deferred contract. 5 The lower realized efficacy of Sinopharm and Sinovac COVID-19 vaccines and high reinfection rates in economies using these vaccines are one of the key risks to our overall bullish commodity view. Please see Assessing Risks To Our Commodity Views, which we published on July 8, 2021. It is available at ces.bcaresearch.com. Investment Views and Themes Recommendations Strategic Recommendations Tactical Trades Commodity Prices and Plays Reference Table Trades Closed in 2021 Summary of Closed Trades