Sectors

Please note that next Friday September 24 at 10am EDT, we will host a webcast featuring a debate between my colleague Peter Berezin and me. The topic of debate is whether investors should overweight EM in a global portfolio. Please join us by registering via this link. Highlights Chinese internet companies’ ROE will drop, warranting lower equity valuations. However, their ROE and equity multiples will not fall to the levels of listed state-owned enterprises (SOEs). Evergrande’s partial default on its liabilities will likely reinforce credit tightening that has been underway in China over the past 12 months. EM ex-TMT stocks also remain vulnerable. Continue underweighting EM in global equity and credit portfolios. Feature This is the September issue of Charts That Matter. We begin by addressing the issues concerning Chinese internet companies that have been subject to intense debate among investors. We then present key charts on overall EM and various asset classes along with brief commentary. Are Chinese Internet Stocks Investable? There is an ongoing debate in the investment community as to whether Chinese equities in general and Chinese TMT stocks in particular will remain investable. Our short answer is: they will remain investable but mind their valuations. In our opinion, “investable” means that they will from time to time offer medium- and long-term investment opportunities. Our hunch is that they may do so in the future. Nevertheless, we do not think that Chinese TMT stocks presently offer a good buying opportunity. In fact, their share prices have material downside from current levels. In our recent report and webcast, we identified the primary risks to Chinese platform companies: Higher uncertainty about their business model = a higher equity risk premium. Government regulating their profitability like those of mono- and oligopolies = low multiples. These companies performing their social duties in the form of redistributing profits from shareholders to Chinese peoples. Beijing’s involvement in their management and in the prioritization of national and geopolitical objectives over shareholder interests. Risks of delisting from US stock exchanges. Although these companies will remain investable, investors should bear these risks in mind and give careful consideration to what multiples they pay for such stocks. Going forward, Chinese platform companies’ return on equity will be considerably lower than they have been or what their current multiplies imply. A lower return on equity warrants a lower equity multiple. Chart 1Chinese Growth Stocks Are Not Cheap
Chinese Growth Stocks Are Not Cheap
Chinese Growth Stocks Are Not Cheap
On the whole, the current valuations of Chinese internet stocks are still high. Chart 1 shows trailing and 12-month forward P/E ratios for Chinese MSCI Growth Investable Index at 34 and 31, respectively. A downshifting return on equity and high uncertainty around these businesses herald lower equity valuations to come. Besides, in the case of several companies, there are also political underpinnings of this regulatory crackdown. In the case of Alibaba, a mainland government official has recently noted that Alibaba’s chairman, Jack Ma, has been acquiring media companies across the country, and now owns nearly 30 provincial-level media companies, as well as the South China Morning Post in Hong Kong. Beijing will not tolerate the control of or influence over domestic media from anyone outside the inner leadership circle. In this context, it is probable that Alibaba’s businesses will remain subject to severe regulatory pressures. How much lower should these companies’ multiples drop to become attractive? Meaningfully lower, but not to the level of multiples of listed state-owned enterprises (SOEs). Here are two reasons why these platform companies will not trade at multiples of SOEs in China: First, many existing SOEs operate in cyclical industries – commodities, industrials, autos, and banks – that structurally have low equity multiples. By contrast, platform companies operate in non-cyclical sectors that structurally have lower business cycle volatility and, therefore, should trade at higher equity multiples than cyclical industries. Second, many SOEs often had losses because they operated in non-oligopolistic industries. Faced with intense competition they had to cut prices to support volumes and employment. By contrast, platform companies’ profitability will be suppressed and capped by new government policies, but they will remain profitable because they operate in oligopolistic industries. In short, platform companies’ ROEs will be higher than those of traditional/”old-economy” SOEs. All in all, our bias is that platform companies’ valuation multiples will contract further but will not be as low as Chinese, Russian, or Brazilian SOEs have been. Bottom Line: Investors should be mindful of further de-rating in Chinese TMT/platform company stocks. These stocks are not yet out of woods. On Property Market Clampdown And Evergrande's Default Evergrande will likely default on some of its liabilities but there will be a bailout or roll-over of its other debt. Is the partial default by Evergrande, a very large Chinese property developer, a sign of a bottom in Chinese offshore equity and bond markets or will it produce a full-blown credit crisis in China? This is a valid question because both outcomes are possible: a partial bankruptcy can be a culmination of all existing negatives and can trigger policy stimulus that will produce an economic recovery and a major rally (an example of this is the LTCM crisis in the US in 1998); or a partial bankruptcy can lead to a credit crunch escalation becoming a systemic event. An example of this is Lehman Brothers’ bankruptcy in 2008. We will assign the highest probability to a third scenario: the well-telegraphed Evergrande default might not create a systemic crisis or crash. However, it will likely reinforce chronic credit tightening that has been underway in China over the past 12 months. This is negative for China and EM risk assets. Predicting the trajectory and speed of market adjustments – a crisis (wholesale selloff) versus a regular bear market interrupted by short-term rebounds – is impossible. That said, investors should stay put for now. On another note, during our webcast last week, a client asked whether restrictions on property developers’ leverage will hinder their ability and willingness to build. In turn, limited property supply will likely push up property prices, which is contrary to Beijing’s goals of curbing property price inflation. So, why are authorities pursuing this clampdown on property developers? Chart 2Property Starts And Prices Are Positively Correlated
Property Starts And Prices Are Positively Correlated
Property Starts And Prices Are Positively Correlated
This is a very good question, and we have the following observations. In our view, authorities are clamping down on property developers’ leverage because historically there was a strong positive correlation between property starts and house prices (Chart 2). The basis for this positive correlation is that when property developers start more projects, they raise expectations via aggressive marketing of higher prices in future. As a result, people become more inclined to buy houses. In fact, more supply has not precluded property prices from surging and vice versa, as shown in Chart 2. Provided housing valuations (the house price-to-income ratios) are exceptionally high in China and high-income households have been buying multiple apartments, we can argue that (speculative) expectations for higher prices in the future have often been an important driver of demand. So, authorities are probably hoping to break this speculative cycle where higher prices breed higher prices. Aggressive marketing on the part of property developers – creating an atmosphere of euphoria around new property launches – has been an essential driver for surging house price expectations. Hence, authorities’ reasoning is that curbing property developers’ relentless debt financed expansion activity is essential for both (1) to restrain excessive house prices inflation (a social stability goal) and (2) to reduce risks of a future credit crisis (a financial stability goal). Finally, with many households/investors who own multiple properties (that are vacant rather than rented out), authorities hope that diminished expectations for future house price appreciation will bring some of these vacant properties to the market. If this occurs, the supply of residential properties for sale and rent will not drop dramatically despite lower starts by property developers. It is also critical to assess the implications of the ongoing carnage in Chinese offshore corporate bonds, where the epicenter of the selloff is property companies. The fact that property developers are experiencing a credit crunch and will be forced to deleverage has implications for China’s business cycle and other EM economies. Chart 3 illustrates that the periods of rising emerging Asian USD corporate bond yields (shown inverted on the chart) coincide with lower emerging Asian ex-TMT share prices. The link is as follows: the ongoing credit stress and deleveraging by mainland property developers means less construction and diminished demand for raw materials and industrial goods as well as possibly household white goods. There are thus negative implications not only for emerging Asian non-TMT stocks but also for overall EM. Bottom Line: Property construction in China will continue contracting (Chart 4). This will weigh on raw materials and industrial goods demand in China and beyond it. Chart 3Rising Emerging Asian Corporate Bond Yields Point To Lower Asian ex-TMT Stocks
Rising Emerging Asian Corporate Bond Yields Point To Lower Asian ex-TMT Stocks
Rising Emerging Asian Corporate Bond Yields Point To Lower Asian ex-TMT Stocks
Chart 4Chinese Housing: Sales And Starts Are Contracting
Chinese Housing: Sales And Starts Are Contracting
Chinese Housing: Sales And Starts Are Contracting
Arthur Budaghyan Chief Emerging Markets Strategist arthurb@bcaresearch.com Have EM Stocks Bottomed? Investor sentiment on EM equities has plunged close to its previous lows. However, this is a necessary but not sufficient condition to issue a buy recommendation. Critically, EM narrow money growth points to EPS deceleration in the next nine months. Yet, analysts’ net EPS revisions remain elevated and have not yet dropped to negative levels. Our bias is that EM net EPS revisions will be downgraded in the coming months. From a technical perspective, the EM equity index has failed to break above its 200-day moving average. This is a negative technical signal. Chart 5
Have EM Stocks Bottomed?
Have EM Stocks Bottomed?
Chart 6
Have EM Stocks Bottomed?
Have EM Stocks Bottomed?
Chart 7
Have EM Stocks Bottomed?
Have EM Stocks Bottomed?
Chart 8
Have EM Stocks Bottomed?
Have EM Stocks Bottomed?
EM Underperformance Is Broad-Based Not only have EM TMT stocks massively underperformed their global peers, but also EM ex-TMT stocks have been underperforming their global counterparts. Besides, the EM equal-weighted stock index has failed to break above its previous highs. Failure to break above a resistance line is often a bad omen. Finally, EM ex-TMT share prices correlate with the average of AUD, NZD and CAD, and the latter remains in a corrective phase. Chart 9
EM Underperfomance Is Broad-Based
EM Underperfomance Is Broad-Based
Chart 10
EM Underperfomance Is Broad-Based
EM Underperfomance Is Broad-Based
Chart 11
EM Underperfomance Is Broad-Based
EM Underperfomance Is Broad-Based
Red Flags For EM Periods of rising EM USD corporate bond yields coincide with lower EM share prices. EM corporate USD bond yields are rising (shown inverted below) and we expect more upside. Either US Treasury bond yields will rise and EM corporate spreads will stay broadly constant, or EM credit spreads will widen and US Treasury yields will stay range-bound. Either of these scenarios will produce higher EM corporate bond yields and, thereby, herald lower EM equity prices. Further, a breakdown in platinum prices is also raising a red flag for EM risk assets. Chart 12
Red Flags For EM
Red Flags For EM
Chart 13
Red Flags For EM
Red Flags For EM
Have Chinese And Asian Stocks Hit An Air Pocket? Relative performance of emerging Asian equities versus the global stock index has broken below its previous lows. Technically, this entails a protracted period of underperformance. Neither emerging Asian ex-TMT nor Chinese investable ex-TMT share prices have been able to break above their major resistance lines. Failure to break above a resistance line is often a bad omen. Meantime, Chinese onshore stocks and corporate bonds have not sold off enough so that authorities panic and stimulate aggressively. Chart 14
Have Chinese And Asian Stocks Hit An Air Pocket?
Have Chinese And Asian Stocks Hit An Air Pocket?
Chart 15
Have Chinese And Asian Stocks Hit An Air Pocket?
Have Chinese And Asian Stocks Hit An Air Pocket?
Chart 16
Have Chinese And Asian Stocks Hit An Air Pocket?
Have Chinese And Asian Stocks Hit An Air Pocket?
Chart 17
Have Chinese And Asian Stocks Hit An Air Pocket?
Have Chinese And Asian Stocks Hit An Air Pocket?
The US Dollar As A Litmus Test EM risk assets negatively correlate with the US dollar. The broad trade-weighted US dollar is holding above its 200-day moving average. Plus, investor sentiment on the greenback remains negative. Finally, the US dollar moves inversely with relative performance of global cyclical sectors versus global defensives (the dollar is shown inverted on chart below). The ongoing slowdown in China is bullish for the US dollar because the US economy is the least vulnerable to China’s economy. Overall, we expect the US dollar to continue firming in the coming months. Chart 18
The US Dollar As A Litmus Test
The US Dollar As A Litmus Test
Chart 19
The US Dollar As A Litmus Test
The US Dollar As A Litmus Test
Chart 20
The US Dollar As A Litmus Test
The US Dollar As A Litmus Test
Global Mining Stocks, Commodity Currencies And Commodity Prices The share prices of BHP and Rio Tinto have fallen dramatically in absolute terms. This reflects the plunge in iron ore prices and might also be a harbinger of a broader selloff in industrial metals. Further, the average of AUD, NZD and CAD also signals a correction in the broad commodities price index. Chart 21
Global Mining Stocks, Commodity Currencies And Commodity Prices
Global Mining Stocks, Commodity Currencies And Commodity Prices
Chart 22
Global Mining Stocks, Commodity Currencies And Commodity Prices
Global Mining Stocks, Commodity Currencies And Commodity Prices
Chart 23
Global Mining Stocks, Commodity Currencies And Commodity Prices
Global Mining Stocks, Commodity Currencies And Commodity Prices
Is This Decoupling Sustainable? Industrial metals prices were historically correlated with the Chinese business cycle but have decoupled since early this year. Several commodity prices – like coal, steel and aluminum – have shot up due to production shutdowns as a part of the Chinese government’s decarbonization policies. However, it will be extraordinary if commodity prices continue advancing amid a protracted slowdown in China’s old economy. Chart 24
Is This Decoupling Sustainable?
Is This Decoupling Sustainable?
Chart 25
Is This Decoupling Sustainable?
Is This Decoupling Sustainable?
Chinese Commodity Imports Have Contracted Reflecting a demand slowdown and the government’s willingness to dampen commodity price inflation, China has been shrinking its imports of several commodities. It has also released some of its strategic reserves for oil and certain industrial metals. High commodity prices are hurting profit margins of manufacturing and industrial companies leading them to lower output. Beijing is determined to curb and bring down key commodity prices to lessen the negative impact on overall growth and employment. Chart 26
Chinese Commodity Imports Have Contracted
Chinese Commodity Imports Have Contracted
Chart 27
Chinese Commodity Imports Have Contracted
Chinese Commodity Imports Have Contracted
Chinese Stimulus: How Fast And How Large? In recent months, China has been injecting more liquidity into the banking system. Rising commercial banks’ excess reserves at the PBOC point to a bottom in the credit impulse in Q4 of this year. However, the credit impulse leads the business cycle by about nine months. This implies that the economy will not revive before Q2 next year at best. In fact, the aggregate building floor area started and the installation of electricity transmission lines are already contracting and will continue shrinking till Q2 next year. Chart 28
Chinese Stimulus: How Fast And How Large?
Chinese Stimulus: How Fast And How Large?
Chart 29
Chinese Stimulus: How Fast And How Large?
Chinese Stimulus: How Fast And How Large?
Chart 30
Chinese Stimulus: How Fast And How Large?
Chinese Stimulus: How Fast And How Large?
Chart 31
Chinese Stimulus: How Fast And How Large?
Chinese Stimulus: How Fast And How Large?
An Inflation Dichotomy Between China And The US In China, consumer price inflation remains largely contained. However, in the US core consumer price inflation measures are still rising and are above 2%. An optimal exchange rate adjustment to redistribute inflation pressures from the US into China will require a stronger US dollar and a weaker RMB. Chart 32
An Inflation Dichotomy Between China And The US
An Inflation Dichotomy Between China And The US
Chart 33
An Inflation Dichotomy Between China And The US
An Inflation Dichotomy Between China And The US
Inflation And Monetary Tightening In EM ex-China Core measures of inflation have been rising in many Eastern European and Latin American economies. Their central banks will hike interest rates further. This will hurt their domestic demand at a time when the recovery in these economies has been underwhelming. Monetary and fiscal tightening will offset benefits from reopening as their vaccination rates ameliorate. Chart 34
Inflation And Monetary Tightening In EM ex-China
Inflation And Monetary Tightening In EM ex-China
Chart 35
Inflation And Monetary Tightening In EM ex-China
Inflation And Monetary Tightening In EM ex-China
Chart 36
Inflation And Monetary Tightening In EM ex-China
Inflation And Monetary Tightening In EM ex-China
Chart 37
Inflation And Monetary Tightening In EM ex-China
Inflation And Monetary Tightening In EM ex-China
What Drives EM Credit Markets? We downgraded our allocation to EM credit, currencies and equities from neutral to underweight on March 25, 2021. This strategy remains intact. The outlook for the key drivers of EM credit – EM/China business cycles and EM exchange rates – remains downbeat. In fact, EM credit markets – both investment grade and high-yield – have been underperforming their US counterparts and this trend will persist. Chart 38
What Drives EM Credit Markets?
What Drives EM Credit Markets?
Chart 39
What Drives EM Credit Markets?
What Drives EM Credit Markets?
Chart 40
What Drives EM Credit Markets?
What Drives EM Credit Markets?
Chart 41
What Drives EM Credit Markets?
What Drives EM Credit Markets?
Our Relative Equity Value Strategies We have been recommending investors go long Chinese A shares / short Chinese investable stocks since March 4, 2021 and this strategy has been extremely profitable. The same is true for the short Chinese property developers / long overall index and short Chinese investable value stocks versus global value stocks strategies. Finally, our recommendation to be long global industrials / short global materials has so far been flat but we expect it to play out for the reasons elaborated in the linked report. Chart 42
Our Relative Equity Value Strategies
Our Relative Equity Value Strategies
Chart 43
Our Relative Equity Value Strategies
Our Relative Equity Value Strategies
Chart 44
Our Relative Equity Value Strategies
Our Relative Equity Value Strategies
Chart 45
Our Relative Equity Value Strategies
Our Relative Equity Value Strategies
Retail Equity Mania In Korea And Taiwan The retail mania continues in the Korean and Taiwanese stock markets. Retail investors are the main buyers while foreign investors and domestic institutional investors have been scaling back their exposure. Surging margin loans and equity trading volumes in Korea confirm ongoing equity euphoria. We continue overweighting Korean stocks and are neutral on Taiwanese stocks within an EM equity portfolio. The difference in our strategy is due to the potential geopolitical risks that Taiwan is facing. Chart 46
Retail Equity Mania In Korea And Taiwan
Retail Equity Mania In Korea And Taiwan
Chart 47
Retail Equity Mania In Korea And Taiwan
Retail Equity Mania In Korea And Taiwan
Chart 48
Retail Equity Mania In Korea And Taiwan
Retail Equity Mania In Korea And Taiwan
Chart 49
Retail Equity Mania In Korea And Taiwan
Retail Equity Mania In Korea And Taiwan
The Semi Cycle And Risks To The Absolute Performance Of Korean And Taiwanese Stocks DRAM and NAND prices have rolled over. This is a near-term risk to the absolute performance of Korean tech stocks. However, if global industrial stocks outperform, as we expect, Korean share prices will outperform the EM equity benchmark because the KOSPI is a good proxy play on global industrials within the EM universe. Although global semiconductor shortages remain widespread, the 6-month outlook for Taiwanese technology companies has rolled over too. Chart 50
The Semi Cycle And Risks To The Absolute Performance Of Korean And Taiwanese Stocks
The Semi Cycle And Risks To The Absolute Performance Of Korean And Taiwanese Stocks
Chart 51
The Semi Cycle And Risks To The Absolute Performance Of Korean And Taiwanese Stocks
The Semi Cycle And Risks To The Absolute Performance Of Korean And Taiwanese Stocks
Chart 52
The Semi Cycle And Risks To The Absolute Performance Of Korean And Taiwanese Stocks
The Semi Cycle And Risks To The Absolute Performance Of Korean And Taiwanese Stocks
Chart 53
The Semi Cycle And Risks To The Absolute Performance Of Korean And Taiwanese Stocks
The Semi Cycle And Risks To The Absolute Performance Of Korean And Taiwanese Stocks
Footnotes Equities Recommendations Currencies, Credit And Fixed-Income Recommendations
Following this week’s CPI release, we update our Corporate Pricing Power Indicator (CPPI). As a reminder, we calculate industry group pricing power from the relevant CPI, PPI, PCE and commodity prices growth rates for each of the 60 industry groups we track. Table 1 on the next page highlights short-term pricing power trends and each industry's spread to overall inflation. 83% of the industries we cover are lifting selling prices, at a faster clip than overall inflation. Commodity-sensitive industries dominate the top of Table 1 with steel and energy industries leading the way with 75% to 10% price increase as they have enjoyed a slingshot post-COVID-19 recovery. One notable exception is the forest products industry with a tape reading of -47% due to the ongoing bear market in lumber futures. We expect the rest of the commodity complex to give up leadership as headwinds from a slowdown in China filter through the global markets. Pricing power of auto manufacturers is also on the rise – empty dealership lots and reduced supply result in a significant upward pressure on prices. There is already evidence that price increases and shortages in supply are starting to discourage consumers from making purchases. Meanwhile, most other consumer goods and services categories populate the middle of the Pricing Power table, suggesting that there is a limit to companies’ ability to raise consumer prices without damaging the demand. We also note that it is reassuring that prices of semiconductors have come down, as it may be an early indication that supply chain is starting to unclog and shortages, such as the one in semiconductors, are starting to resolve. Finally, yesterday was Lehman Bankruptcy Day – 13 years have passed. Time flies. Bottom Line: Outside of commodities and building materials, price increases are moderating. Table 1
Updating Corporate Pricing Power Indicator
Updating Corporate Pricing Power Indicator
Highlights Since June, 6 structured recommendations achieved their profit targets: short building and construction (XLB) versus healthcare (XLV); long USD/CAD; long USD/HUF; long Nike versus L’Oréal; short corn versus wheat; and short marine transport versus market. Additionally, short AMC Entertainment expired in profit, while short Australian versus Canadian 30-year bonds expired flat. Within the open trades, 3 are in profit. Against this, 2 structured recommendations hit their stop-losses: short Austria versus Chile; and short lead versus platinum. Additionally, short France versus Japan expired in loss. Within the open trades, 6 are in loss. This results in a ‘win ratio’ at a very pleasing 59 percent. Even more commendably, the 9 unstructured recommendations have all anticipated reversals or exhaustions – most notably for the ZAR, BRL, and stocks versus bonds. Feature Chart of the WeekFractal Fragility Correctly Signalled The Exhaustion Of Stocks Versus Bonds
Fractal Fragility Correctly Signalled The Exhaustion Of Stocks Versus Bonds
Fractal Fragility Correctly Signalled The Exhaustion Of Stocks Versus Bonds
A major advance in our understanding of financial markets is that the Efficient Market Hypothesis (EMH) is only partly true. The market is efficient only when a wide spectrum of investment horizons is setting the price, signified by the market having a rich fractal structure. The market is efficient only when a wide spectrum of investment horizons is setting the price, signified by the market having a rich fractal structure. The eponymous Fractal Market Hypothesis (FMH) teaches us that when the fractal structure becomes extremely fragile, the information and interpretation of longer-term investors is missing from the recent price setting. Meaning that the market has become inefficient. When the longer-term investors do re-enter the price setting process, the question is: will they endorse the most recent trend as a justification of a change in the fundamentals. In which case, the trend will continue. Or will they reject it as an unjustified deviation from a fundamental anchor. In which case, the trend will reverse. In most cases, it is the latter: a rejection and a reversal. As most investors are unaware of the FMH, it gives a competitive advantage to the few investors that use it to signal a potential countertrend reversal. On this basis, we have used it – and continue to use it – to identify countertrend investment opportunities with truly excellent results. Fractal Trade Update This a brief review and update of the 29 short-term trades that we have recommended since our last update on 3rd June 2021, including recommendations that were open on that date. The 29 recommendations have comprised 20 structured trades – which include profit-targets, symmetrical stop-losses, and expiry dates – plus a further 9 recommendations without structured exit points. In summary, 6 structured recommendations achieved their profit targets: short building and construction (XLB) versus healthcare (XLV); long USD/CAD; long USD/HUF; long Nike versus L’Oréal; short corn versus wheat; and short marine transport versus market. Additionally, short AMC Entertainment expired in profit, while short Australian versus Canadian 30-year bonds expired flat. Within the open trades, 3 are in profit. Against this, 2 structured recommendations hit their stop-losses: short Austria versus Chile; and short lead versus platinum. Additionally, short France versus Japan expired in loss. Within the open trades, 6 are in loss. This results in a ‘win ratio’ at a very pleasing 59 percent – counting a win as achieving the profit target, a loss as hitting the (symmetrical) stop-loss, and pro-rata for partial wins and losses. Even more commendably, the 9 unstructured recommendations have all anticipated reversals or exhaustions. The sections below review the structured and unstructured recommendations in chronological order. The 20 Structured Trades 1. 6th May: Short Building and Construction (PKB) vs. Healthcare (XLV) Achieved its profit target of 15 percent. 2. 6th May: Short MSCI France vs. Japan Expired after three months in partial loss but went on to become very profitable – implying that a longer holding period was required (Chart I-2). Chart I-2Short France Versus Japan Became Very Profitable
Short France Versus Japan Became Very Profitable
Short France Versus Japan Became Very Profitable
3. 13th May: Long USD/CAD Achieved its profit target of 3.7 percent and went on to reach a high-water mark of 5.7 percent. 4. 20th May: Long 10-year T-bond vs. TIPS Open, in profit, having reached a high-water mark of 2.7 percent (versus a 3.6 percent target). 5. 3rd June: Short MSCI Austria vs. Chile Hit its stop-loss of 7 percent, albeit after previously reaching a high-water mark of 5.3 percent – implying that the profit target needed to be tighter. 6. 10th June: Short AMC Entertainment Expired at a 4 percent profit, having reached a high-water mark of 65.3 percent (versus a 100 percent target) (Chart I-3). Chart I-3Fractal Analysis Works Very Well For Meme Stocks
Fractal Analysis Works Very Well For Meme Stocks
Fractal Analysis Works Very Well For Meme Stocks
7. 10th June: Long USD/HUF Achieved its 3 percent profit target, before continuing to a high-water mark of 7.6 percent (Chart I-4). Chart I-4HUF/USD Corrected By 7.6 Percent
HUF/USD Corrected By 7.6 Percent
HUF/USD Corrected By 7.6 Percent
8. 17th June: Long Nike vs. L’Oréal Achieved its 9 percent profit target, before continuing to a high-water mark of 31.3 percent (Chart I-5). Chart I-5L’Oréal Underperformed Nike By 31 Percent
L'Oreal Underperformed Nike By 31 Percent
L'Oreal Underperformed Nike By 31 Percent
9. 24th June: Short Corn vs. Wheat Achieved its 12 percent profit target, before continuing to a high-water mark of 38.7 percent (Chart I-6). Chart I-6Corn Underperformed Wheat By 39 Percent
Corn Underperformed Wheat By 39 Percent
Corn Underperformed Wheat By 39 Percent
10. 1st July: Short US REITs vs. Utilities Open, in profit, having reached a high-water mark of 3 percent (versus a 5 percent target). 11. 8th July: Short Marine Transport vs. Market Achieved its profit target of 16.5 percent. 12. 15th July: Short Lead vs. Platinum Hit its stop loss of 6.4 percent. 13. 15th July: Short Australia vs. Canada 30-year T-Bonds Expired flat. 14. 5th August: Short Tin vs. Platinum Open, in loss, albeit having reached a high-water mark of 9.3 percent (versus a 16.5 percent target). 15. 12th August: Long MSCI Hong Kong vs. MSCI World Open, in loss. 16. 12th August: Long New Zealand vs. Netherlands Open, in loss. 17. 19th August: Short India vs. China Open, in loss (Chart I-7). Chart I-7The Outperformance Of India Versus China Is Fractally Fragile
The Outperformance Of India Versus China Is Fractally Fragile
The Outperformance Of India Versus China Is Fractally Fragile
18. 26th August: Short Sugar vs. Soybeans Open, in loss. 19. 2nd September: Short Aluminum vs. Gold Open, in loss (Chart I-8). Chart I-8The Outperformance Of Base Metals Versus Precious Metals Is Fractally Fragile
The Outperformance Of Base Metals Versus Precious Metals Is Fractally Fragile
The Outperformance Of Base Metals Versus Precious Metals Is Fractally Fragile
20. 9th September: Short US Medical Equipment vs. Healthcare Services Open, in profit. The 9 Unstructured Trades 1. 10th June: Short ZAR/USD ZAR/USD subsequently corrected by 12 percent. 2. 24th June: Short Copper Copper’s rally subsequently exhausted. 3. 1st July: Short MSCI ACWI vs. 30-year T-bond The rally in stocks versus bonds has subsequently exhausted (Chart of the Week). 4. 8th July: Short BRL/COP BRL/COP subsequently corrected by 4 percent. 5. 8th July: Short Saudi Tadawul All-Share vs. FTSE Malaysia All Share KLCI The rally in Saudi Arabian equities versus Malaysian equities subsequently exhausted. 6. 12th August: Long NOK/GBP NOK/GBP has subsequently rallied by 3 percent. 7. 26th August: Short Hungary vs. EM Hungary’s outperformance is losing steam. 8. 26th August: Short USD/PLN USD/PLN subsequently corrected by 3 percent. 9. 2nd September: Short Trade Weighted US Dollar Index The dollar rally is meeting near-term resistance. Dhaval Joshi Chief Strategist dhaval@bcaresearch.com Mohamed El Shennawy Research Associate Fractal Trading System Fractal Trades 6-Month Recommendations Structural Recommendations Closed Fractal Trades Closed Trades Asset Performance Equity Market Performance Indicators To Watch - Bond Yields Chart II-1Indicators To Watch - Bond Yields ##br##- Euro Area
Indicators To Watch - Bond Yields - Euro Area
Indicators To Watch - Bond Yields - Euro Area
Chart II-2Indicators To Watch - Bond Yields ##br##- Europe Ex Euro Area
Indicators To Watch - Bond Yields - Europe Ex Euro Area
Indicators To Watch - Bond Yields - Europe Ex Euro Area
Chart II-3Indicators To Watch - Bond Yields ##br##- Asia
Indicators To Watch - Bond Yields - Asia
Indicators To Watch - Bond Yields - Asia
Chart II-4Indicators To Watch - Bond Yields ##br##- Other Developed
Indicators To Watch - Bond Yields - Other Developed
Indicators To Watch - Bond Yields - Other Developed
Indicators To Watch - Interest Rate Expectations Chart II-5Indicators To Watch - Interest Rate Expectations
Indicators To Watch - Interest Rate Expectations
Indicators To Watch - Interest Rate Expectations
Chart II-6Indicators To Watch - Interest Rate Expectations
Indicators To Watch - Interest Rate Expectations
Indicators To Watch - Interest Rate Expectations
Chart II-7Indicators To Watch - Interest Rate Expectations
Indicators To Watch - Interest Rate Expectations
Indicators To Watch - Interest Rate Expectations
Chart II-8Indicators To Watch - Interest Rate Expectations
Indicators To Watch - Interest Rate Expectations
Indicators To Watch - Interest Rate Expectations
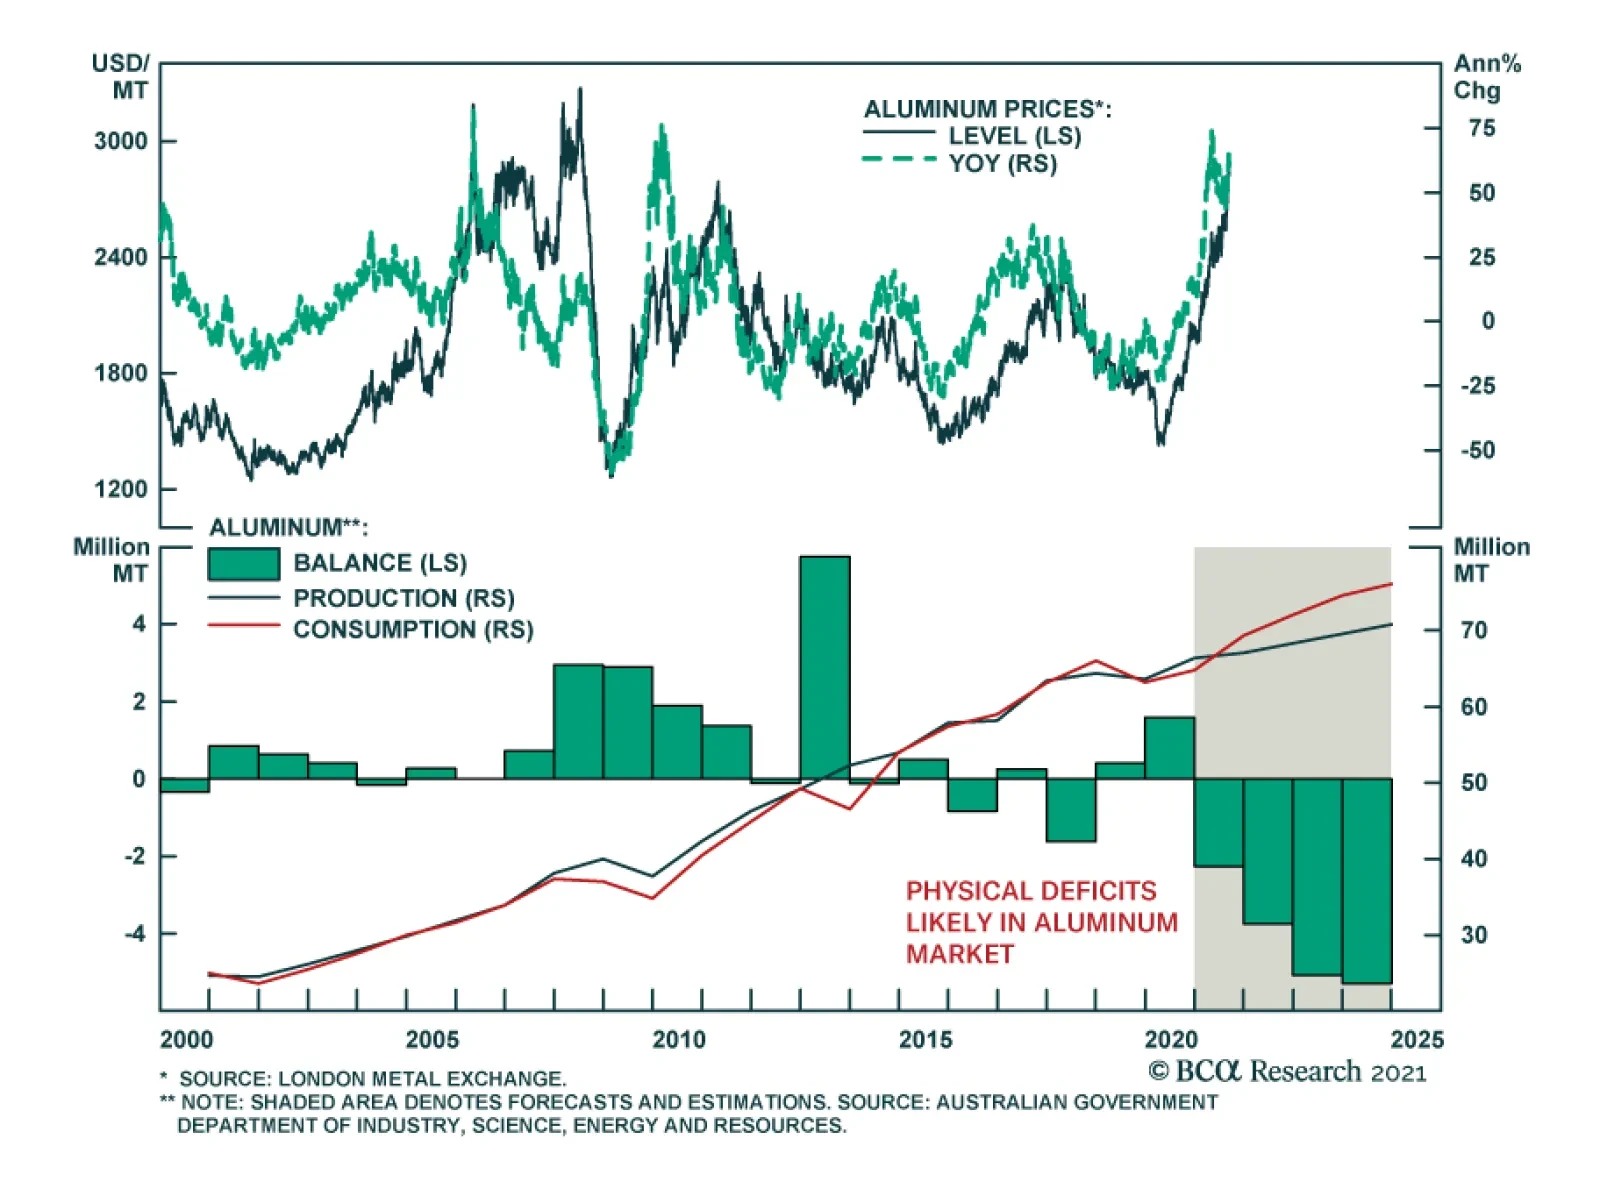
Aluminum prices recently accelerated sharply following several months of relative inactivity. The recent rally was triggered by fears of a disruption in bauxite supplies - the primary source of aluminum - following a military coup in Guinea earlier this…
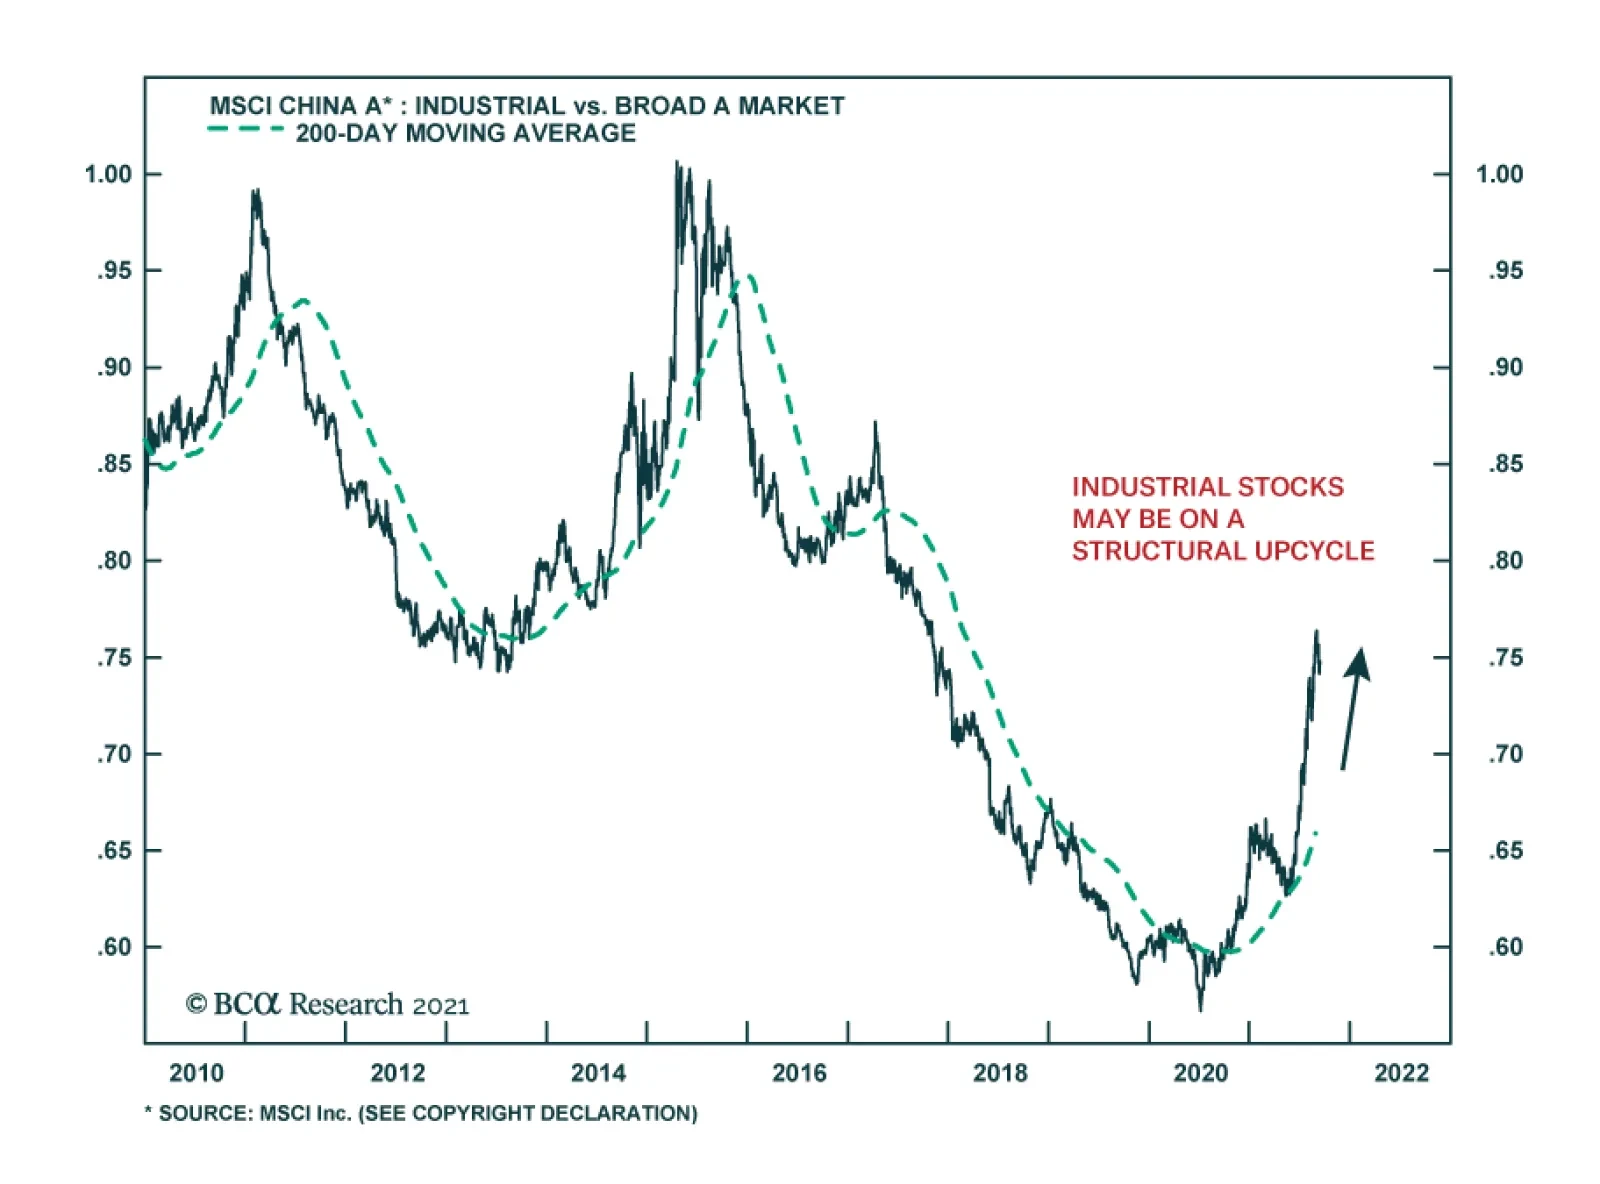
BCA Research's China Investment Strategy service recommends a new trade: long Chinese industrial stocks/short A-shares. Chinese onshore stocks in the infrastructure, materials, and industrial sectors recently advanced strongly in the expectation that…
Looking At PPI
Looking At PPI
Last week’s PPI release came in strong, beating expectations and posting its eighth consecutive print of a higher-than-forecasted YoY increase. The release confirms that supply chains remain clogged and that businesses are forced to hike prices to offset pricing pressures. Anecdotally, the Suez Canal was briefly blocked once again last week as if foreshadowing more supply-side pain ahead. PPI internals also send the same message with goods inflation outpacing both the headline number and the services inflation (see chart). Given that service-producing industries are less reliant on raw materials, we expect the same divergence between goods and services PPI to hold over the coming several prints. Meanwhile our house view remains that the ongoing inflationary spike will be transitory in nature, and as businesses replenish inventories, inflation data will stabilize at lower levels. Please stay tuned for tomorrow’s Sector Insight report where we will update our Corporate Pricing Power table.
Highlights Investors are caught in the crosscurrents of inconsistent economic data and contradictory trends, which obscure the answer to the most important questions of the day: What will be the direction and rate of change of yields? The answer will dictate which US equity sectors and styles are to do well (Chart 1). In this report, we aim to cut through the noise and organize all the considerations and the economic data into two neat buckets: “lower for longer” vs “rates are about to rise”. “Rates Are About To Rise” vs “Lower For Longer” Arguments Fed Talk: Fed Chair Jay Powell’s Jackson Hole speech all but promised to start tapering in the coming months. However, this speech had many caveats, leaving the Fed with substantial latitude for the timing of the decision. Covid-19 Variants: The Covid-19 Delta variant is cresting, and it is unlikely that its transmission is a threat to global growth. However, Delta is the third prominent Covid-19 variant, and more vaccine-resistant variants may emerge, disrupting recovery, and derailing all plans for monetary tightening. Unemployment Rate: The unemployment rate has come down to 5.2% in August. There are also labor shortages. However, August payroll disappointed. African American unemployment remains at 8.8%. Inflation: Inflation has been running hot of late. Supply chain disruptions and upward pressure on wages perpetuate price increases. However, much of the inflation spike observed over the past several months was due to the base effect, which is rolling over. Economic Growth: The US economy is in good health: Pent-up demand for goods and services remains strong, manufacturing is booming. However, US economic data has been disappointing recently and most of the economic indicators have turned. GDP growth estimates have been downgraded. The Consumer Is Healthy But In A Bad Mood: Consumers have money to spend, and demand remains high. However, stimulus spending has peaked, which may dent consumer spending. The consumer confidence reading has slumped to a six-month low. It is apparent from this analysis that predicting the timing of tapering is close to impossible, as too much depends on the September employment report, the future rate of Covid-19 infections, potential emergence of variants, and the further patterns of inflation and supply disruption. Investment Implications: Barbell Approach To Portfolio Construction Considering the level of uncertainty in the markets, we recommend a barbell approach for portfolio construction, i.e., having an overweight in the portfolio to sectors that outperform when rates go up, such as Financials, and selected Cyclicals, and have overweights to parts of the market that benefit from “lower for longer” such as Growth, Technology, and Health Care. Feature The “easy” phase of the recovery, “the tide that lifts all boats”, supported by a torrent of ultra-easy monetary and fiscal stimulus is in the rearview mirror, leaving investors to guess the timing of Fed tapering and its implications for the different segments of the stock market. While the US equity market defies gravity, volatility is likely to make a comeback this fall thanks to near-term economic uncertainty, interest-rate uncertainty, and Covid risk (Chart 2). Chart 1Barbell Portfolio: Choose Outperformers From Each Regime
Barbell Portfolio Or Safety First
Barbell Portfolio Or Safety First
Chart 2Policy Uncertainty Is On The Rise
Policy Uncertainty Is On The Rise
Policy Uncertainty Is On The Rise
Investors are caught in the crosscurrents of inconsistent economic data and contradictory trends, which obscure the answer to the most important questions of the day: When will the Fed start tapering and where will the Treasury rates end the year? The direction and rate of change in yields will dictate which US equity sectors and styles are to do well: Growth or Value, Small or Large, Cyclicals or Defensives. The Fed has stated clearly that it has twin goals: To target average inflation and a low rate of unemployment. Yet, there is a lot of uncertainty around how long the Fed will tolerate “transitory inflation”, and what the target rate for unemployment might be. The “bad news is good news” theme is gaining prominence. Disappointing economic data points to a slowdown in recovery, which is certainly bad news. Yet, slower growth is likely to translate into a slowdown in employment gains, delaying the commencement of tapering, keeping rates rises at bay, and supporting equity prices. This sounds simple enough except for the worst-case scenario being stagflation, whereby growth slowdown is accompanied by rampant inflation, which would leave the Fed with no choice but to tighten monetary policy even if it constricts flagging growth. In this report, we aim to cut through the noise and organize all the considerations and the economic data into two neat buckets: “lower for longer” vs “rates are about to rise”. We also propose a barbell portfolio allocation for downside protection as it is not yet clear which of the possible scenarios will materialize. We are overweight Growth, Technology, Health Care, Financials, Industrials, and Consumer Services. Economic Crosscurrents Fed Speak Rates Are About To Rise The Fed has broadcasted its plans for tapering well in advance, and Fed Chair Jay Powell’s Jackson Hole speech all but promised to start tapering bond buying in the coming months. Lower For Longer Uncertain timetable: Chairman Powell’s speech had many caveats for tapering, leaving the Fed with substantial latitude for the timing of the decision. Further, Chairman Powell explicitly separated the decision to taper from the timing of the first rate hike, which is conditioned on full employment being “a long way off”. Further, tapering is tightening when it becomes a signal on the Fed’s monetary policy – the Fed went out of its way to reassure the markets that this is not the case. Covid-19 Variants Rates Are About To Rise Delta variant infections have peaked: There are early signs that the Covid-19 Delta variant is cresting (Chart 3). Around 75% of the US population has had at least one vaccine shot. Vaccinated persons are less likely to end up in a hospital even if infected. Covid-19 won’t disappear, but US consumers and businesses are learning how to live with it. Hence, worries about Covid are unlikely to keep the Fed on hold for much longer. We, too, are sanguine about the risk that Delta variant transmission is a threat to global growth. Chart 3The Covid-19 Delta Variant Is Cresting
The Covid-19 Delta Variant Is Cresting
The Covid-19 Delta Variant Is Cresting
Lower For Longer New mutations are likely: Delta is the third prominent Covid-19 variant, and more vaccine-resistant variants may emerge, disrupting recovery, and derailing all plans for monetary tightening. Also, while the spread of the Delta variant is unlikely to trigger another lockdown, consumers may curtail their activities out of fear of infection, adversely affecting demand for goods and services, and stalling recovery. There are some signs that the new wave of Delta variant infections has dented consumer spending. Delta may also be behind the disappointing August jobs report, which could be a harbinger of a slowdown in employment gains. Unemployment Rate Rates Are About To Rise Unemployment rate is falling swiftly: The unemployment rate has come down to 5.2% in August. BCA estimates that at 750,000 average monthly job gains, the pre-pandemic level of unemployment can be reached in the summer of 2022, with the first rate hike in December 2022, which is somewhat earlier than consensus – the futures market is pricing in January 2023. Labor shortages: Companies are still struggling to fill job openings: There are 10.9 million job openings but only 8.5 million job seekers (Chart 4). Shortage of labor puts upward pressure on wages and increases companies’ costs, driving up inflation. Chart 4There Are More Job Openings Then Job Seekers
There Are More Job Openings Then Job Seekers
There Are More Job Openings Then Job Seekers
Lower For Longer Disappointing jobs report: August payrolls grew only by 235,000. This low number may have resulted from the Delta hit to service industries. Next month’s report will be a decisive data point for the Fed’s tapering timing decision. Are there fundamental issues behind this number, such as Covid fears, flagging recovery, or skills mismatch between workers and jobs available? The African American unemployment rate remains elevated at 8.8%, which is still 2.8% above the pre-pandemic level (compared to the 5.2% total unemployment rate, which is only 1.7% above the 2020 pre-pandemic level), (Chart 5). The Fed is focused not only on the overall level of unemployment but also on an equitable unemployment rate across racial groups. Chart 5The African American Unemployment Rate Remains Elevated
The African American Unemployment Rate Remains Elevated
The African American Unemployment Rate Remains Elevated
Inflation Rates Are About To Rise Inflation is here to stay: Inflation has been running hot of late. The US consumer price index rose by 5.3% yoy in both June and July—a spike the Fed calls transitory. BCA agrees but believes that over the longer term, inflation will be higher than the pre-pandemic average. The Fed is coming close to admitting that inflation is becoming a problem and has been around longer than was initially expected. Supply chain disruptions are still rampant: There are significant backlogs of goods (Chart 6), and shipping costs have soared in recent months: Container freight costs have increased nearly five-fold from pre-pandemic levels. It will take time for supply chains to normalize, with most industry participants expecting the situation to improve only in 2022. Supply chain disruptions drive up inflation and, unless progress is made, lead to stagflation. Companies continue raising prices: Pricing power remains at an all-time high, with 45% of companies planning to pass surging labor and supply costs on to consumers. This leads to broadening of inflation across categories, with even trimmed mean inflation indicators significantly overshooting 2% (Chart 7). Chart 6US Manufacturers Have Work Cut Out For Them
US Manufacturers Have Work Cut Out For Them
US Manufacturers Have Work Cut Out For Them
Chart 7Trimmed Mean Inflation Is Overshooting 2%
Trimmed Mean Inflation Is Overshooting 2%
Trimmed Mean Inflation Is Overshooting 2%
Lower For Longer: Inflation is transitory: Much of the inflation spike observed over the past several months was due to the base effect, which is rolling over. The consumer categories where prices have risen fastest are services most affected by the pandemic, such as airline tickets and hotels – these prices remain at pre-pandemic levels. Other elevated prices are due to supply disruptions, such as cars and durable goods – these readings are stickier and will go away only once supply chains normalize. Further, while 45% of companies intend to raise prices, the Corporate Pricing Power Indicator has turned, which may suggest that the vicious cycle of inflation may come to a halt (Chart 8). And lastly, divergence between CPI and PPI inflation, indicates that PPI will come down in the near future (Chart 9). Chart 8Corporate Pricing Power Has Reached Its Limit
Corporate Pricing Power Has Reached Its Limit
Corporate Pricing Power Has Reached Its Limit
Chart 9Divergence Between PPI And CPI Has To Close
Divergence Between PPI And CPI Has To Close
Divergence Between PPI And CPI Has To Close
Economic Growth Rates Are About To Rise US economy is in good health: GDP growth expectations are 6.3% for this year and about 4.3% in 2022. Pent-up demand for goods and services remains strong. ISM PMI Orders components are on the rise. Inventories are depleted and need to be replenished, offering further support for industrial activity in the US (Chart 10A). Philly Fed survey shows that about 40% of respondents plan to increase their capex expenditure (Chart 10B). Strong manufacturing activity is likely to translate into further robust employment gains. Chart 10AAre At All Time Low And Need To Be Replenished
Are At All Time Low And Need To Be Replenished
Are At All Time Low And Need To Be Replenished
Chart 10BCapex Intentions Are On The Rise
Capex Intentions Are On The Rise
Capex Intentions Are On The Rise
Lower For Longer: US economic data has been disappointing recently: Much of the good economic news has been priced in, and the Citigroup Economic Surprise Index is negative. Most of the economic indicators have turned, confirming that the surge in growth has run its course and the macroeconomic environment is normalizing. GDP growth estimates have been downgraded (Chart 11). The Conference Board Economic Indicator has turned, confirming that the US economy is in a slowdown stage of the business cycle (Chart 12). Prolonged friction of supply bottlenecks and transportation disruption may put the brakes on economic growth. Chart 11GDP Growth Estimates Downgraded
GDP Growth Estimates Downgraded
GDP Growth Estimates Downgraded
Chart 12US Economy Is Slowing
US Economy Is Slowing
US Economy Is Slowing
Consumer Is Healthy But In A Bad Mood Rates Are About To Rise Consumers have money to spend: There is still about $2 trillion in excess savings, and considering backlogs of orders across industries, pent-up demand remains high. Lower For Longer Fiscal Tightening: Stimulus spending has peaked. Supplemental federal unemployment benefits of $300 a week expired as of Sept. 6. This may dent consumer spending unless millions of unemployed rejoin the labor force. The rub is in the fact that, with an extra $300 per week, 48% of workers were making more money not working than while employed, according to a recent paper published by the JPMorgan Chase & Co. Institute. Consumer mood has soured: Consumer confidence has slumped to a six-month low of 114 from 125 a month earlier (Chart 13). Many consumers have also postponed durable goods and house purchases discouraged by soaring prices and low inventories (Chart 14). Consumers are also worried about rising prices and expect inflation to exceed 6.5% within 12 months. Chart 13Consumer Mood Has Soured
Consumer Mood Has Soured
Consumer Mood Has Soured
Chart 14Soaring Prices And Low Inventories Discourage Purchases
Soaring Prices And Low Inventories Discourage Purchases
Soaring Prices And Low Inventories Discourage Purchases
Investment Implications It is apparent from this analysis that predicting the timing of tapering is close to impossible, as too much depends on the September employment report, the future rate of Covid-19 infections, the potential emergence of variants, and the further patterns of inflation and supply disruption. How do different assets react to rate hikes? In case the “Lower for Longer” scenario dominates, Growth and Defensives will outperform. Specifically, sectors like Consumer Staples, Health Care, Communications, and Technology will thrive in this environment (Chart 15). If rates start rising, we expect Value, Small Caps, and Cyclicals to outperform, specifically, Financials, Consumer Discretionary, and Industrials. Chart 15Barbell Portfolio: Choose Outperformers From Each Regime
Barbell Portfolio Or Safety First
Barbell Portfolio Or Safety First
US Equity Sector Strategy Positioning We recommend pursuing a barbell approach to portfolio construction: A mix of Growth sectors that benefit from low rates, and economically sensitive Cyclicals, which are geared to higher growth and rising rates. Rates Are About To Rise We are overweight cyclicals in our portfolio in case the economy keeps growing apace, US consumers prove to be undeterred by fears of Covid-19 variant(s), and market expectations shift towards imminent tapering. We are overweight Consumer Services and Industrials. Lower for longer We have been overweight Growth, Technology, and Media & Entertainment in our portfolio since June 2021. While the rates outlook remains uncertain and “lower for longer” is a realistic scenario, we will stick to this positioning while Covid variants are lurking, and growth slowing. For the same reason, we are also overweight Health Care (defensive growth). Underweights We are underweight Consumer Staples, Utilities, and Telecom as these sectors are bond proxies, and at this point it is unlikely that rates will move much lower from here. Our base case is stable or higher. We are also underweight Materials, and Metal & Mining specifically, as this sector is exposed to a Chinese growth slowdown, which suppresses demand for industrial metals. Changes in Positioning Upgrade Financials to an overweight from equal weight. Financials thrive in an environment of rising rates and a steepening yield curve when tapering arrives. From a broader investment perspective, Financials and Banks are cheap, trading at 14x and 12.2x forward earnings respectively. Further, commitment to returning cash to shareholders will benefit investors with a long-term investment horizon. We stay neutral on Insurance as the magnitude of the fallout from Hurricane Ida is still unknown, but it is already clear that payouts will be sizeable. Downgrade Energy to equal-weight from overweight. Although energy, in principle, should do well in the environment of rising rates, we don’t see much upside to this investment. Crude oil has come off its recent highs, with Brent trading at $73 a barrel compared to $76 at the beginning of August. Although demand will continue to recover and supply is somewhat constrained by the OPEC 2.0 agreement, our energy strategists see limited upside to oil prices over the next 12 months, with a forecast of Brent to average $73 a barrel in 2022 (Chart 16). Chart 16Limited Upside For Oil For The Next Year
Limited Upside For Oil For The Next Year
Limited Upside For Oil For The Next Year
Bottom Line The Fed has been clear in communicating that we are drawing closer and closer to the doom day of tapering, yet there are so many countertrends in the market that it is not clear which will dominate and how soon tapering will commence. Our working assumption is that it starts in December 2021 / January 2022. Considering that markets are forward-looking, repositioning for tapering may start in advance, but there is also a danger of being too early if economic growth, inflation, and employment gains surprise on the downside and tapering is delayed. Considering the level of uncertainty in the markets, we recommend a barbell approach to portfolio construction, i.e., having an overweight in the portfolio to sectors that outperform when rates go up, such as Financials and Cyclicals, and have overweights to parts of the market that benefit from “lower for longer” such as Growth, Technology, and Health Care. Irene Tunkel Chief Strategist, US Equity Strategy irene.tunkel@bcaresearch.com Recommended Allocation
Highlights Germany’s election on September 26 is more of an opportunity than a risk for global investors. Coalition formation will prolong uncertainty but the key takeaway is that early or aggressive fiscal tightening is off the table for Germany … and hence the EU. Germany’s left wing is surprising to the upside as predicted, but it is the Social Democrats rather than the Greens who have momentum in the polls. This is a market-positive development. A coalition of only left-wing parties is entirely possible, but there is a 65% chance that the Christian Democrats (or Free Democrats) will take part in the next coalition to get a majority government. This would constrain business unfriendly outcomes. The German economy is likely to slow for the remainder of 2021, but the outlook for 2022 remains bright as the current headwinds facing the country will dissipate, especially if the risk of an aggressive fiscal drag is low. The underperformance of German equities relative to their Eurozone counterparts is long in the tooth. A combination of valuation, earnings momentum and technical factors suggests that German stocks will beat their peers next year. German equities will also outperform Bunds, which offer particularly unattractive prospective returns. Feature Germany’s federal election will be held on September 26. Our forecast that the left wing will surprise to the upside remains on track, albeit with the Social Democrats rather than the Greens surging to the forefront of opinion polls (Chart 1). However, the precise composition of the next government is very much in the air. Chart 1German Election: Social Democrats Take The Lead
German Election: Social Democrats Take The Lead
German Election: Social Democrats Take The Lead
Our quantitative German election model – which we introduce in this special report – predicts that the ruling Christian Democratic Union will outperform their current 21% standing in opinion polls, winning as much as 33% of the popular vote. Subjectively, this seems like an overestimation, but it goes to show that outgoing Chancellor Angela Merkel’s popularity, a historically strong voting base, and the economic recovery will help the party pare its losses this year. This finding, combined with the strong momentum for the Social Democrats, suggests that the election outcome will not be decisive. Germany will end up with either a grand coalition that includes Merkel’s Christian Democrats or a left-wing coalition that lacks a majority in parliament.1 Investors should note that none of the election outcomes are hugely disruptive to domestic or foreign policy. The status quo is unexciting but not market-negative, while a surprise left-wing victory would mean more reflation in the short run but a roll back of some pro-business policies in the long run. More broadly Germany has established a national consensus that rests on European integration, looser fiscal policy, renewable energy, and qualified engagement with autocratic powers like Russia and China. The chief takeaway is that fiscal policy will not be tightened too soon – and could be loosened substantially. Germany’s Fiscal Question Outgoing Chancellor Angela Merkel is stepping down after ruling Germany since 2005. The Christian Democratic Union, and its Bavarian sister party the Christian Social Union, together form the “Union” that is hard to beat in German elections, having occupied the chancellor’s office for 57 out of 72 years. However, both the Christian Democrats and the Social Democrats, their main rivals, have been shedding popular vote share since 1990, as other parties like the Greens, Free Democrats, the Left, and Alternative for Germany have gained traction (Table 1). Table 1Germany: Traditional Parties Lose Vote Share Over Time
German Election: Winds Of Change
German Election: Winds Of Change
The Great Recession and European sovereign debt crisis ushered in a new geopolitical and macroeconomic context that Merkel reluctantly helped Germany and the EU navigate. Germany’s clashes with the European periphery ultimately resulted in deeper EU integration, in accordance with Germany’s grand strategy and Merkel’s own strategy. But just as the euro crisis receded, a series of shocks elsewhere threatened to upend Germany’s position as one of the biggest economic winners of the post-Cold War world. The sluggish aftermath of the financial crisis, the Russian invasion of Crimea, the Syrian refugee crisis, the Brexit referendum, and President Trump’s election in the US sparked a retreat from globalization, a direct threat to an export-oriented manufacturing economy like Germany. In the 2017 election the Union lost 13.4 percentage points compared to the 2013 election. Minor parties have gradually gained ground since then. However, through a coalition with the Social Democrats, Merkel and her party managed to retain control of the government. This grand coalition eased the country’s fiscal belt in response to the trade war and global slowdown in 2019, signaling Germany’s own shift away from fiscal austerity. Then COVID-19 struck, prompting a much larger fiscal expansion to tide over the economy amid social lockdowns. Germany was not the largest EU member in terms of fiscal stimulus but nor was it the smallest (Chart 2). It joined with France to negotiate a mutual debt plan to rescue the broader EU economy and deepen integration. Chart 2Germany’s Fiscal Stimulus Ranks In The Middle Of Major Countries
German Election: Winds Of Change
German Election: Winds Of Change
Germany’s pro-EU perspective has been reinforced by Brexit and is not on the ballot in 2021. Immigration and terrorism have temporarily subsided as voter concerns. The focus of the 2021 election is how to get through the pandemic and rebuild the German economy for the future. For investors the chief question is whether conservatives will have enough sway in the next government to try to semi-normalize policy and consolidate budgets in the coming years, or whether a left-wing coalition will take charge, expanding on Germany’s proactive fiscal turn. The latter has consequences for broader EU fiscal normalization as well since Germany is traditionally the prime enforcer of deficit limits. The latest opinion polls point to more proactive fiscal policy. The country’s left-leaning ideological bloc has taken the lead (Chart 3A) and the Social Democratic leader Olaf Scholz has sprung into first place among the chancellor candidates (Chart 3B). Chart 3AGermany: Voting Intentions Favor Left-Leaning Parties
Germany: Voting Intentions Favor Left-Leaning Parties
Germany: Voting Intentions Favor Left-Leaning Parties
Chart 3BSocial Democrats Likely To Take Chancellery
German Election: Winds Of Change
German Election: Winds Of Change
Scholz has served as finance minister and is the face of the country’s recent fiscal stimulus efforts. Public opinion is clearly rewarding him for this stance as well as his party, which was previously in the doldrums.2 The Social Democrats and Greens are calling for more fiscal expansion as well as wage hikes and tax hikes (wealth redistribution) in pursuit of social equality and a greener economy (Table 2). If the Christian Democrats retain a significant role in the future coalition, these initiatives will be blunted – not to say halted entirely. But if the left parties put together a ruling coalition without the Christian Democrats, then they will be able to launch more ambitious tax-and-spend policies. Opinion polls show that voters still slightly favor coalitions that include the Christian Democrats, although momentum has shifted sharply in favor of a left-wing coalition (Chart 4). Table 2German Party Platforms
German Election: Winds Of Change
German Election: Winds Of Change
Chart 4Voters Evenly Split On Whether Next Coalition Should Include CDU
German Election: Winds Of Change
German Election: Winds Of Change
This shift is what we forecast in previous reports but now the question is whether the left-wing parties can actually win enough seats to put together a majority coalition. That is a tall order. Our quantitative election model suggests that the Christian Democrats, having suffered a long overdue downgrade in expectations, will not utterly collapse when the final vote is tallied. While we do not expect them to retain the chancellorship, momentum will have to shift even further in the opposition’s favor over the next two weeks to produce a majority coalition that excludes the Union. Our Quantitative German Election Model Our model is based off the work of Norpoth and Geschwend, who created a simple linear model to predict the vote share that incumbent governing parties or coalitions will obtain in impending elections.3 Their model utilizes three explanatory variables and has a sample size of 18 previous elections, covering elections from 1953 to 2017. Our model updates their original work to make estimates for the 2021 election. Unlike our US Political Strategy Presidential Model, which makes use of both political and economic explanatory variables in real time, our German election model makes predictions based solely on historical political variables, all of which display a high degree of correlation with popular vote share. We will look at economic factors that may affect the election later in this report. The Three Explanatory Variables 1. Chancellor Approval Rating: This variable captures the short-term support rate of the incumbent chancellor. A positive relationship exists between chancellor approval and vote share: higher approval equates to higher vote share for the incumbent party. Merkel’s approval stands at 64% today which is a boon for the otherwise beleaguered Christian Democrats (Chart 5). Chart 5Merkel's Coattails A Boon But Not Enough To Save Her Party
Merkel's Coattails A Boon But Not Enough To Save Her Party
Merkel's Coattails A Boon But Not Enough To Save Her Party
2. Long-term partisanship: This variable shows the long-term support rate of voters for specific parties or coalitions in past elections. It is measured as the average vote share of the incumbent party over the past three elections. A positive relationship with vote share exists here too: higher historical partisanship equates to a higher share of votes in forthcoming elections, and vice versa. This variable clearly gives a boost to the Christian Democrats – although it could overrate them based on past performance, as occurred in 2017 when they underperformed the model’s prediction.4 3. “Time For Change”: This is a categorical variable measured by how many terms the parties or coalition have held office leading into an election. This variable has a negative relationship with vote share outcomes. The longer an incumbent party or coalition holds office, the less vote share they will receive. Effectively, our model punishes parties that hold office for long periods of time. In this case that would be the long-ruling Christian Democrats. Model Estimation And Results Our model is estimated by the following simple equation: Popular Vote Share = constant + ßChancellor Approval Rating + ßLong-Term Partisanship + ßTime For Change Estimating the above model for the 2021 election predicts that the Union will win 32.7% of the vote share (Table 3). If this prediction came true, it would suggest that the ruling party performed almost exactly the same as in 2017. In other words, the party’s strong voter base combined with Merkel’s long coattails are expected to shore up the party. This flies in opinion polling, however, so we think the model is overestimating the Christian Democrats. Table 3Our German Election Quant Model Says CDU Will Not Collapse
German Election: Winds Of Change
German Election: Winds Of Change
Note that even if the Union performs this well, it still will not win enough seats to govern on its own. Potential Union-led coalitions are shown in Table 3, excluding the Social Democrats (see below). For a majority government, a coalition with the Free Democrats and the Greens would need to be formed. This coalition would equate to 53% of the vote share. Otherwise, to obtain a majority, the Union would have to team up with the Social Democrats, which is today’s status quo. We can use the same methodology to predict the vote share for the Social Democrats. We use the support rate of Social Democratic chancellor-candidate Olaf Scholz and calculate the long-term partisanship variable using past Social Democratic vote shares. In this case our model predicts that the Social Democrats will win 22.1% of the vote. If this result were to come true, it would not be enough for the party to govern own its own. Potential Social Democratic-led coalitions are shown in Table 4. The best coalition would be with the Greens and either the Left or the Free Democrats. But in this case the Social Democrats cannot form a government with a vote share above 50%, unless it pairs up with the Christian Democrats. Table 4Our German Election Quant Model Says SPD Has Not Yet Won It All
German Election: Winds Of Change
German Election: Winds Of Change
In other words, either the left-wing parties must build on their current momentum and outperform their historical record in the final election tally, or they will need to form a coalition with the Christian Democrats. This kind of left-wing surge is precisely what we have predicted. But the model helps put into perspective how difficult it will be for the left-leaning parties to get a majority. Scholz is single-handedly trying to overcome the long downtrend of the Social Democrats. His party is rising at the expense of the Greens, and the Left, which puts a lid on the total left-wing coalition size. If these three parties all beat the model and slightly surpass their top vote share in recent memory (SPD at 26%, Greens at 11%, and the Left at 12%), they still only have 49% of the vote. While our model is reliant on historical political data, it is a robust predictor for past election results (Chart 6). The average vote share error between the predicted and realized outcomes over from 1953 to 2013 is 1.7 percentage points. The problem with relying on the model is that the Christian Democrats have broken down from their long-term trend in opinion polls. And while Merkel’s approval is strong, she is no longer on the ballot and her hand-picked successor, Armin Laschet, is floundering in the polls (see Chart 3B above). Chart 6Our German Election Quant Model Has Solid Track Record, But Merkel’s High Approval Rating Caused Overestimate In 2017 And May Do So In 2021
German Election: Winds Of Change
German Election: Winds Of Change
In short, the model is probably overrating the Union but it is also calling attention to the extreme difficulty of the left-wing parties forming a majority coalition. Scholz may have to form a coalition with the Free Democrats or pursue another grand coalition. And if the Social Democrats fail to get the largest vote share, German President Frank-Walter Steinmeier may ask Armin Laschet to try to form a government first. Still, Scholz is the most likely chancellor when all is said and done. Election Model Takeaway Our German election model predicts that the Union will receive 32.9% of the popular vote, while the Social Democrats will receive 22.1%. At the same time, the left-leaning parties, specifically the Social Democrats, clearly have the momentum. Therefore the model may be overrating the incumbent party. But it still calls attention to a high level of uncertainty, the likelihood of a messy election outcome, and a tricky period of coalition formation. The Social Democrats will have to pull off a major surprise, outperforming both history and our model, to lead a majority government without the Christian Democrats.5 We still think this is possible. But we will stick with our earlier subjective probabilities: 65% odds that the Christian Democrats take part in the next coalition, 35% odds that they do not. Bottom Line: The chancellorship will go to the Social Democrats but the coalition will constrain the business unfriendly aspects of their agenda. This is positive for Germany’s corporate earnings outlook. Macro Outlook: A Temporary Economic Dip Our election model does not account for the economic backdrop and hence ignores the “pocketbook voter.” Germany is recovering from the pandemic, which is marginally supportive for an otherwise faltering ruling party. However, the economic data is only good enough to suggest that the Union will not utterly collapse. A rise in unemployment, inflation, and the combination of the two (the “Misery Index”) is a tell-tale sign that the incumbent party will suffer a substantial defeat (Chart 7). However the German economy’s loss of momentum is temporary. Growth will re-accelerate in early 2022. The timing is politically inconvenient for the ruling party but positive news for investors. German economic confidence is deteriorating. The Ifo Business Climate survey has rolled over, lowered by a meaningful decline in the Expectations Survey. Additionally, consumer confidence is turning south, despite already being low (Chart 8). Chart 7Spike In German Misery Index A Tell-Tale Sign Of Poor Election For Incumbent Party
Spike In German Misery Index A Tell-Tale Sign Of Poor Election For Incumbent Party
Spike In German Misery Index A Tell-Tale Sign Of Poor Election For Incumbent Party
Chart 8Deteriorating German Confidence
Deteriorating German Confidence
Deteriorating German Confidence
A combination of factors weighs on German confidence: First, global supply chain bottlenecks are hurting growth. The automotive industry, which is paralyzed by a global chip shortage, accounts for about 20% of industrial production, and its output is once again declining after a sharp but short-lived rebound last year (Chart 9). Similarly, inventories of finished goods are collapsing, which is hurting growth today (Chart 9, second panel). Second, the Delta variant of COVID-19 is causing a spike in infections. The rise in cases prevents containment measures from easing as much as expected, while it also hurts the willingness of households to go out and spend their funds (Chart 9, third panel). Third, German real wages are weak. Negotiated wages are only growing at a 1.7% annual rate, and wages and salaries are expanding at 2.1% annually. Meanwhile, German headline CPI runs at 3.9%. The declining purchasing power of German households accentuates their current malaise. Three crucial forces counterbalance these negatives: First, German house prices are growing at a 9.4% annual rate, which is creating a potent, positive wealth effect (Chart 10). Chart 9Germany's Headwinds
Germany's Headwinds
Germany's Headwinds
Chart 10A Strong Wealth Effect
A Strong Wealth Effect
A Strong Wealth Effect
Second, German household credit remains robust. According to the Bundesbank, the strength in household credit mostly reflects the strong demand for mortgages. Historically, a healthy housing sector is an excellent leading indicator of economic vigor. Third, the Chinese credit impulse is too depressed for Beijing’s political security. The recent decline in the credit impulse to -2.4% of GDP reflects a policy decision in the fall of 2020 to trim down the credit expansion. As a result, Chinese economic growth is slowing. For example, both the Caixin Manufacturing and Services PMIs stand below 50, at post-pandemic lows of 49.2 and 46.7, respectively. In July authorities became uncomfortable and cut the Reserve Requirement Ratio as well as interbank rates to free liquidity and stabilize the economy. A boom is not forthcoming, but the drag on global activity will ebb by next year. Including the headwinds and tailwinds to the economy, German activity will slow down for the remainder of the year before improving anew in 2022. Our election case outlined above – that the conservatives will lose the chancellorship and either be excluded from power or greatly diminished in the Bundestag – means that fiscal policy will not be tightened abruptly and will not create a material risk to this outlook. Chart 11Vaccines Work
Vaccines Work
Vaccines Work
Many of the headwinds will dissipate. The Delta-wave of COVID-19 will diminish. Already, Germany’s R0 is tentatively peaking, which normally precedes a drop in daily new cases. Moreover, Germany’s vaccination campaign is progressing, which limits the impact of the current wave on hospitalization and intensive care-unit usage (Chart 11). Inflation will peak in Germany, which will salvage real wages. As European Investment Strategy wrote last Monday,6 European inflation remains concentrated in sectors linked to commodity prices or directly affected by bottlenecks. Instead, trimmed-mean CPI is muted (Chart 12), which implies that underlying inflationary pressures are small, especially as wage gains are still well contained. Moreover, the one-off impact of the end of the German VAT rebate will also pass. Finally, a stabilization and eventual revival of the Chinese credit impulse will put a floor under German exports, industrial production, and capex (Chart 13). For now, the previous decline in the Chinese credit impulse is consistent with slower German output growth for the remainder of 2021. However, next year, the German industrial sector will start to feel the effect of the current efforts to improve Chinese liquidity conditions. Chart 12Narrow European Inflation
Narrow European Inflation
Narrow European Inflation
Bottom Line: The German economy is set to deteriorate for the remainder of 2021. However, as the current wave of COVID-19 infections ebbs, real wages recover, and China’s credit impulse stabilizes, Germany’s economic activity will re-accelerate in 2022, especially if the upcoming election does not generate a meaningful fiscal shock. We do not think it will. Chart 13China: From Headwinds To Tailwind?
China: From Headwinds To Tailwind?
China: From Headwinds To Tailwind?
Market Implications: German Stocks To Shine German equities are set to outperform their European counterparts and will significantly beat Bunds over the coming 18 months. During the past 5 months, the German MSCI index has underperformed the rest of the Eurozone by 6.2%. The poor performance of German equities is worse than meets the eye. If we adjust for sectoral differences by building equal sector-weight indexes, Germany has underperformed the Euro Area by 22% since early 2017 (Chart 14). Chart 14Not Delivering The Goods
Not Delivering The Goods
Not Delivering The Goods
This underperformance is long in the tooth and should reverse because of four important dynamics. First, German equities are cheap relative to the European benchmark. As Chart 15 highlights, the relative performance of German stock prices has lagged that of profits. This underperformance is also true once we account for the different sectoral composition of the German market. As a result, Germany is cheap on a forward price-to-earnings, price-to-sales, and price-to-book basis versus the Euro Area. Additionally, analysts embed significantly lower long-term and one-year expected growth rates of earnings in Germany than in the rest of the Eurozone, which depresses the German PEG ratios. Second, German operating metrics do not justify the valuation discount of German equities. The return on equity of German stocks stands at 11.39%, which is similar to that of the Euro Area. Profit margins are also comparable, at 5.91% and 5.74%, respectively. However, German firms utilize their capital more efficiently, and their asset turnover stands at 0.3 times compared to 0.2 times for the Eurozone average. Meanwhile, German non-financial firms are less indebted than their Eurozone competitors, which implies that Germany’s return on assets is greater than that of Europe at large (Chart 16). Chart 15Lagging Prices, Not Earnings
Lagging Prices, Not Earnings
Lagging Prices, Not Earnings
Chart 16Why The Discount?
Why The Discount?
Why The Discount?
Third, the drivers of earnings support a German outperformance. Over the past thirty years, commodity prices led the performance of German stocks relative to that of the rest of the Eurozone (Chart 17). While the near-term outlook for natural resource prices is muddy, BCA’s commodity strategists expect Brent prices to average more than $80/bbl in 2023 and industrial metals to outperform energy over the coming years.7 Additionally, German Services PMI are bottoming compared to that of the Eurozone. Over the past decade, this process preceded periods of outperformance by German stocks (Chart 18). Similarly, the collapse in the Chinese credit impulse relative to the robust domestic economic activity in Europe is well reflected in the underperformance of German shares. The Eurozone’s Service PMI is near all-time highs and unlikely to improve further; however, the Chinese credit impulse should recover in the coming quarters. This phenomenon will help German stocks (Chart 19). Chart 17Commodity Bulls Pull Germany
Commodity Bulls Pull Germany
Commodity Bulls Pull Germany
Chart 18German Vs European Activity Matters
German Vs European Activity Matters
German Vs European Activity Matters
Chart 19German Vs Chinese Activity Matters
German Vs Chinese Activity Matters
German Vs Chinese Activity Matters
The German MSCI index is also oversold. The 52-week rate of change of its performance compared to the rest of the Eurozone plunged to its lowest reading since the introduction of the euro in 1999 (Chart 20). Meanwhile, the 13-week rate of change remains low but has begun to improve (not shown). This combination usually heralds a forthcoming rebound in German relative performance. In relation to equities, German Bunds remain an unappealing investment. Based on historical experience, the current yield of -0.36% offered by German 10-year bonds condemns investors to negative returns over the next five years (Chart 21). Chart 20Oversold!
Oversold!
Oversold!
Chart 21Bounded Bunds' Returns
Bounded Bunds' Returns
Bounded Bunds' Returns
Even if realized inflation ebbs in Germany and Europe, inflation expectations remain low and an eventual return to full employment will force CPI swaps higher, especially if the ECB maintains easy monetary conditions and invites further risk-taking in the Eurozone. The global economic cycle will also move from a friend to a foe for Bunds. As Chart 22 illustrates, the recent deceleration in global export growth was consistent with the fresh uptick in the returns of German paper. However, if Chinese credit flows stabilize by year-end and reaccelerate in 2022 while supply-chain bottlenecks dissipate, global export growth will improve. This should hurt Bund prices, especially as the long-term terminal rate proxy embedded in the German curve remains too low. As a result, not only should Bunds underperform German equities, but the German yield curve will also steepen further relative to that of the US, where the Fed will lift the short-end of the curve faster than the ECB. Chart 22Economic Momentum And Bunds Prices
Economic Momentum And Bunds Prices
Economic Momentum And Bunds Prices
Bottom Line: The underperformance of German equities relative to those of the rest of the Eurozone is well advanced, which makes German stocks a bargain. The current deceleration in global and German growth will not extend beyond 2021, which suggests that German stocks prices should converge toward their earnings outperformance next year. Our political forecast suggests that the odds of an early or aggressive fiscal retrenchment are very low. Additionally, German equities will outperform Bunds, which offer particularly poor prospective returns. Matt Gertken Vice President Geopolitical Strategy mattg@bcaresearch.com Mathieu Savary Senior Vice President Mathieu@bcaresearch.com Guy Russell Research Analyst GuyR@bcaresearch.com Jingnan Liu Research Associate JingnanL@bcaresearch.com Footnotes 1 Note that minority governments are rare and have a bad reputation in Germany, partly as a result of the series of weak governments leading up to the 1932 election and Nazi rule. 2 In addition, while the center-left parties can work with the far-left in the Bundestag, the center-right parties cannot work with the far-right Alternative for Germany. Indeed the slightest imputation of a willingness to work with Alternative for Germany cost Merkel’s first pick for successor, Annegret Kramp-Karrenbauer, her job. 3 See: Norpoth, Helmut & Gschwend, Thomas (2010) The chancellor model: Forecasting German elections, International Journal of Forecasting. 26. 42-53. 4 Our model performs well in back-testing but 2017 was an outlier. It correctly predicted the Union to win the highest share of the popular vote but overestimated that vote by seven percentage points. Our only short-term variable, the chancellor’s approval rate, caused a deviation from long-term voting trends. Our other two variables capture medium and long-term effects, which clearly favored the Union. The implication is that Merkel’s high approval rating today could give a misleading impression about the Christian Democrats’ prospects. 5 If they are forced to rely on the Free Democrats instead, that will also constrain the most anti-business elements of their agenda. 6 Please see BCA Research European Investment Strategy Weekly Report, "The ECB Taper Dilemma", dated September 6, 2021, available at eis.bcareseach.com. 7 Please see BCA Research Commodity & Energy Strategy Weekly Report, "Permian Output Approaches Pre-Covid Peak", dated August 19, 2021, available at ces.bcareseach.com.
Highlights The equity risk premium has turned negative for the first time since 2002. It follows that any significant rise in bond yields will cause risk-asset prices to collapse, quickly flipping any incipient inflationary shock into a deflationary shock. Shorting bonds yielding 2 percent is a ‘widow maker’ trade, as anybody who has tried this with a long list of government bonds has learned to their cost, the most recent being UK gilts. Hence, the next on the list for the ‘widow maker’ is shorting the US 30-year T-bond which is now yielding 2 percent. In fact, the US 30-year T-bond is a must-own structural investment. Fractal analysis: Medical equipment versus healthcare services. Feature Chart of the WeekThe Equity Risk Premium Turns Negative For The First Time Since 2002
The Equity Risk Premium Turns Negative For The First Time Since 2002
The Equity Risk Premium Turns Negative For The First Time Since 2002
Mainstream investments are now priced to deliver negative, zero, or at best, feeble long-term investment returns. Mainstream investments are now priced to deliver negative, zero, or at best, feeble long-term investment returns. For example, the US 10-year Treasury Inflation Protected Security (TIPS) and the UK 10-year index linked gilt are yielding -1.3 percent and -2.8 percent respectively. Meaning that anybody who buys and holds these bonds to redemption is guaranteed a deeply negative 10-year real return. Meanwhile, in nominal yield space, 10-year government bonds yield -0.35 percent in Germany and Switzerland, 0.7 percent in the UK, and 1.3 percent in the US. What about equities? Unlike a bond’s redemption yield, equities do not offer a guaranteed long-term return for buy-and-hold investors. So, some analysts assume that the equity market’s earnings yield is the proxy for this long-term return. According to these analysts, the US equity market’s earnings yield of 4.4 percent means that it will deliver a prospective long-term real return of 4.4 percent per annum. Compared to the 10-year TIPS real yield of -1.3 percent, they argue that this offers an excess return or ‘equity risk premium’ of a comfortable +5.7 percent. Therefore, claim these analysts, equities are reasonably valued, relative to bonds, and in absolute terms. But as we will now demonstrate, this analysis is deeply flawed. The Equity Risk Premium Has Turned Negative The equity market’s earnings yield is a valuation metric, so clearly there is some connection between it and the prospective return delivered by the equity market. Nevertheless, the crucial point to grasp is that: The equity market’s earnings yield does not equal its prospective return. Charts I-2 - I-3 should make this point crystal clear. As you can see, the earnings yield rarely equals the delivered prospective 10-year return, either real or nominal. When the earnings yield is elevated, the prospective return turns out higher. Conversely, when the earnings yield is depressed, as now, the prospective return turns out to be much lower. Chart I-2The Equity Market's Earnings Yield Does NOT Equal Its Prospective Return, Either In Real Terms...
The Equity Market's Earnings Yield Does NOT Equal Its Prospective Return, Either In Real Terms...
The Equity Market's Earnings Yield Does NOT Equal Its Prospective Return, Either In Real Terms...
Chart I-3...Or In Nominal ##br##Terms
...Or In Nominal Terms
...Or In Nominal Terms
Therefore, to take the current earnings yield of 4.4 percent and subtract the real bond yield of -1.3 percent to derive an equity risk premium of +5.7 percent is analytically flawed, just as it is analytically flawed to subtract apples from oranges. To derive the equity risk premium, the correct approach is first to translate the earnings yield into a prospective 10-year return based on the established mathematical relationship between these variables. Chart I-4 does this and shows that, based on a very tight mathematical relationship through the past thirty five years, an earnings yield of 4.4 percent translates into a prospective 10-year nominal return of just 1 percent. Chart I-4We Must Mathematically Map The Earnings Yield Into A Prospective Return...
We Must Mathematically Map The Earnings Yield Into A Prospective Return...
We Must Mathematically Map The Earnings Yield Into A Prospective Return...
Having translated the earnings yield into a prospective 10-year nominal return of 1 percent, we can now make an apples-for-apples comparison with the 10-year T-bond yield of 1.3 percent (Chart I-5). Chart I-5...And Only Then Subtract The Bond Yield
...And Only Then Subtract The Bond Yield
...And Only Then Subtract The Bond Yield
Derived correctly therefore, the equity risk premium has turned negative for the first time since 2002 (Chart of the Week). We deduce that the equity market is very richly valued both in absolute terms and relative to bonds. And crucially, that this rich valuation is contingent on bond yields remaining ultra-low, or going even lower. Shorting Bonds Yielding 2 Percent Is A ‘Widow Maker’ All of which brings us to one of the most pressing questions we get from clients. When a bond is offering a feeble yield, what is the point in owning it? Maybe the best people to answer are the casualties of the now infamous ‘widow maker’ trades. The original widow maker trade was the idea that the yield on the Japanese Government Bond (JGB), at 2 percent, was so feeble that there was no point in owning it. Furthermore, with massive Japanese fiscal stimulus coming down the pike, the ‘no-brainer’ investment strategy was not just to disown the JGBs, but to take an outright short position, as it seemed that the only direction that JGB yields could go was up. In fact, JGB yields did not go up, they continued to trend down. As feeble yields became even feebler, the owners of the short positions got carried out of their careers, feet first. Meanwhile, those investors who owned 30-year JGBs yielding a ‘feeble’ 2 percent in 2013 reaped returns of 75 percent, and even now, are sitting on handsome profits of 55 percent. Some people protest that Japan is an exceptional and isolated case, rather than a template for economies which will not repeat their putative policy-errors. Such protests have always struck us as factually wrong, blinkered, and even prejudiced. Nevertheless, let’s indulge these prejudices with a simple rejoinder – forget Japan, what about Switzerland, or the UK? (Chart I-6) Chart I-6Shorting Bonds Yielding 2 Percent Is A 'Widow Maker'
Shorting Bonds Yielding 2 Percent Is A 'Widow Maker'
Shorting Bonds Yielding 2 Percent Is A 'Widow Maker'
Just like the JGB widow maker, anybody who shorted UK gilts yielding 2 percent is nursing heavy losses. Meanwhile, those investors who owned 30-year UK gilts yielding a ‘feeble’ 2 percent in 2018 reaped returns of 40 percent, and even now are sitting on tidy profits of 30 percent. Just like the JGB widow maker, anybody who shorted UK gilts yielding 2 percent is nursing heavy losses. Bear in mind that a 30-year bond yielding a feeble 2 percent will deliver a cumulative return of more than 80 percent to redemption. And that if the feeble yield becomes even feebler, this return will get front-end loaded, creating widow makers for the short positions and spectacular gains for the long positions, as witnessed in JGBs and UK gilts. The 30-Year T-Bond Is A Must-Own Structural Investment The next candidate for the widow maker is shorting the US 30-year T-bond, which is yielding, you guessed it, 2 percent. Remember that while Japan may not be a great template for the US, the UK certainly is – because the US and UK have very similar economic, financial, political, social, and cultural structures. Until recently therefore, bond yields in the US and UK were moving in near-perfect lockstep (Chart I-7). Chart I-7The Difference Between US And UK Bond Yields Is Just That The UK Has Had One More Deflationary Shock
The Difference Between US And UK Bond Yields Is Just That The UK Has Had One More Deflationary Shock
The Difference Between US And UK Bond Yields Is Just That The UK Has Had One More Deflationary Shock
So, what happened? The one word answer is: Brexit. The recent difference between US and UK bond yields is simply that the UK has had one more deflationary shock than the US. Put the other way around, the US is just one deflationary shock away from a UK level of bond yields – meaning the 30-year yield not at 2 percent, but at 1 percent. But why can’t the next shock be an inflationary shock resulting in much higher yields? The simple answer is that the equity risk premium has turned negative for the first time since 2002. Moreover, as we pointed out in The Road To Inflation Ends At Deflation the extremely rich valuation of $300 trillion of global real estate is also highly contingent on ultra-low bond yields. It follows that any significant rise in bond yields will collapse the value of $500 trillion of risk-assets. In a $90 trillion global economy, this will quickly flip any incipient inflationary shock into a deflationary shock. Any significant rise in bond yields will collapse the value of $500 trillion of risk-assets. We conclude that the US 30-year T-bond is a must-own structural investment. Fractal Analysis Update As hospitals have rushed to clear their backlog of non-pandemic treatments and procedures, medical equipment stock prices have surged. This is particularly true for US medical equipment (ticker IHI) which, since June, is up by 25 percent versus US healthcare services (Iqvia, Veeva, or loosely proxied by ticker XHS). Given that the backlog of treatments will eventually clear, and that the intense rally is now extremely fragile on its 65-day fractal structure (Chart I-8), a recommended countertrend trade is to short US medical equipment versus healthcare services. Set the profit target and symmetrical stop-loss at 8.5 percent. Chart I-8The Intense Rally In Medical Equipment Stocks Has Become Fragile
The Intense Rally In Medical Equipment Stocks Has Become Fragile
The Intense Rally In Medical Equipment Stocks Has Become Fragile
Dhaval Joshi Chief Strategist dhaval@bcaresearch.com Fractal Trading System Fractal Trades 6-Month Recommendations Structural Recommendations Closed Fractal Trades Closed Trades Asset Performance Equity Market Performance Indicators To Watch - Bond Yields Chart II-1Indicators To Watch - Bond Yields ##br##- Euro Area
Indicators To Watch - Bond Yields - Euro Area
Indicators To Watch - Bond Yields - Euro Area
Chart II-2Indicators To Watch - Bond Yields ##br##- Europe Ex Euro Area
Indicators To Watch - Bond Yields - Europe Ex Euro Area
Indicators To Watch - Bond Yields - Europe Ex Euro Area
Chart II-3Indicators To Watch - Bond Yields ##br##- Asia
Indicators To Watch - Bond Yields - Asia
Indicators To Watch - Bond Yields - Asia
Chart II-4Indicators To Watch - Bond Yields ##br##- Other Developed
Indicators To Watch - Bond Yields - Other Developed
Indicators To Watch - Bond Yields - Other Developed
Indicators To Watch - Interest Rate Expectations Chart II-5Indicators To Watch - Interest Rate Expectations
Indicators To Watch - Interest Rate Expectations
Indicators To Watch - Interest Rate Expectations
Chart II-6Indicators To Watch - Interest Rate Expectations
Indicators To Watch - Interest Rate Expectations
Indicators To Watch - Interest Rate Expectations
Chart II-7Indicators To Watch - Interest Rate Expectations
Indicators To Watch - Interest Rate Expectations
Indicators To Watch - Interest Rate Expectations
Chart II-8Indicators To Watch - Interest Rate Expectations
Indicators To Watch - Interest Rate Expectations
Indicators To Watch - Interest Rate Expectations
Feature Chart 1Chinese Offshore Stocks Tumbled Amid Regulatory Crackdowns
Chinese Offshore Stocks Tumbled Amid Regulatory Crackdowns
Chinese Offshore Stocks Tumbled Amid Regulatory Crackdowns
Relative to the global equity index, onshore and offshore Chinese stocks have fallen by 18% and 32%, respectively, since their peaks in mid-February (Chart 1). The panic sell-off in the offshore market, which saw greater losses due to its high concentration in internet stocks, appears to be overdone and may technically rebound in the near term. However, any short-term bounce in Chinese stocks from oversold levels will likely be short-lived (Chart 2). The crackdown on new economy companies reflects socio-political and economic shifts in China, which raises the odds that the restrictions will continue with further actions focused on social welfare and healthcare. August’s official PMIs and economic data indicate a broad-based softening in China’s domestic demand and production. However, compared with 2018/19 when the US-China trade war exacerbated the deterioration in an already slowing economy, the economy now remains well supported by strong exports. Moreover, the magnitude of the slowdown has not exceeded policymakers’ pain thresholds (Chart 3). Chart 2Tactical Bounce Was Short-Lived In Previous Downturns
Tactical Bounce Was Short-Lived In Previous Downturns
Tactical Bounce Was Short-Lived In Previous Downturns
Chart 3China's Economic Recovery Losing Steam, But From An Elevated Level
China's Economic Recovery Losing Steam, But From An Elevated Level
China's Economic Recovery Losing Steam, But From An Elevated Level
In 2018/19, stimulus was measured and the authorities did not meaningfully relax limits on bank lending standards and shadow banking. Furthermore, China recently reiterated its cross-cycle macro policy setting, which means that policymakers will not use significant stimulus to achieve high and short-term economic growth. Given financial stability measures that aim to contain risks associated with the housing market and hidden local government debt, any monetary and fiscal easing will likely help to stabilize credit growth instead of substantially boosting it this year. For the time being, China’s financial assets continue to face downside risks stemming from a confluence of a weakening business cycle and ongoing regulatory tightening. Thus, we recommend investors maintain an underweight allocation to Chinese equities within a global equity portfolio. Qingyun Xu, CFA Associate Editor qingyunx@bcaresearch.com A Shining Moment For Chinese Small And Medium Caps Small and medium-cap (SMID-cap) stocks have outperformed large-caps since February and the recent regulatory restrictions have intensified the situation. The CSI500 index, which comprises 500 SMID-cap companies, has outperformed the large-cap CSI300 by 34% since mid-February (Chart 4, top panel). Uncertainties surrounding the pandemic and corporate earnings growth have fueled extreme dislocations between large-cap and SMID-cap stocks last year. Large-cap stocks were the main contributors to China’s stock rallies in the second half of last year, while the valuation premia in small cap stocks was compressed to near decade lows (Chart 4, bottom panel). Chart 4A Low Valuation Premia And More Policy Support May Further Lift Prices Of SMID-Caps
A Low Valuation Premia And More Policy Support May Further Lift Prices Of SMID-Caps
A Low Valuation Premia And More Policy Support May Further Lift Prices Of SMID-Caps
Chart 5SMID-Caps Tend To Outperform Large-Caps In Late Business Cycle
SMID-Caps Tend To Outperform Large-Caps In Late Business Cycle
SMID-Caps Tend To Outperform Large-Caps In Late Business Cycle
Historically, SMID-caps tend to outperform large-caps in the late cycle of an economic recovery (Chart 5). The spate of regulatory changes aimed at monopolistic behaviors in various sectors has curbed investors’ appetite for the industry leaders. In addition, the government’s increasing efforts to support small and medium corporates (SMEs) will help to shore up confidence in those companies. Therefore, small and medium caps will likely continue to outperform large-cap stocks this year. Fiscal Support: How Much Room In 2H? The July Politburo meeting pledged more fiscal support for the economy later in 2021 and into 2022. We expect local government bond (LGB) issuance to accelerate: a 4.47 trillion RMB new local government bond issuance quota was approved for 2021, including 820 billion in general bonds and 3.65 trillion in special purpose bonds (SPBs). By end-August, 2.37 trillion new local government bonds had been issued, which was only 53% of the entire year’s goal. However, there are some constraints that will likely reduce the reflationary effects on the economy. First, the quota for LGB issuance approved by the National People’s Congress is 16% lower than last year, but the amount of LGBs maturing this year is 30% higher. Therefore, even though this year’s gross LGB issuance has kept pace with that of last year, more than half of the LGBs issued from January to August was used for debt repayment (Chart 6). The move by local governments to use a large portion of their bond issuance quota to pay off existing debt resembles the situation in 2018 when a financial de-risking campaign encouraged local governments to reduce the stockpile of their leverage. As noted in last week’s report, infrastructure investment and the economy did not rebound in 2H2018, even though LGB issuance picked up (Chart 7). Chart 6More Than Half Of LGBs Issued This Year Has Been Used For Debt Repayment
Chinese Small And Medium Caps Are Finding Their Shining Moment
Chinese Small And Medium Caps Are Finding Their Shining Moment
Chart 7Improvement In Infrastructure Investment Was Short-Lived In 2019
Improvement In Infrastructure Investment Was Short-Lived In 2019
Improvement In Infrastructure Investment Was Short-Lived In 2019
Even if we assume that local governments will use all of their remaining bond quota by year end, the gross monthly average in local government bond issuance will be around 580 billion, only slightly higher than in 2H 2020. Secondly, infrastructure investment is discouraged by stringent regulations to approve projects (including project assessment and debt repayment ability) and the accountability of local officials for project failures. Approvals for infrastructure projects remain at the lowest level since March last year (Chart 8). Finally, SPBs made up only about 15% of overall infrastructure spending in the past three years, while the majority came from public-private partnerships (PPP) financing, revenues from government-managed funds, government budgets and bank loans. Falling proceeds from land transfers have dragged down government-managed funds (Chart 9). In addition, government expenditures show no signs of a material increase (Chart 9, bottom panel). Chart 8Infrastructure Investment Will Remain Subdued
Infrastructure Investment Will Remain Subdued
Infrastructure Investment Will Remain Subdued
Chart 9Government Expenditures Remain Muted
Government Expenditures Remain Muted
Government Expenditures Remain Muted
As discussed in previous reports, local government bonds issuance only accounts for 12% of total social financing. As such, without a sizeable acceleration in bank loans, enhanced LGB issuance would not be enough to prompt a substantial increase in infrastructure investment growth. Our argument is underscored by the structural downshift in infrastructure investment since 2017 (Chart 7, top panel). Therefore, additional local government bond issuance this year will help to stabilize but not boost credit growth. August PMIs Confirm Slowing Economic Activity China's official PMIs eased further in August. The non-manufacturing index fell to contractionary territory of 47.5, below the expectation of a more muted 1.3-point decline to 52.0. Similarly, the manufacturing PMI eased by 0.3 points to 50.1, which is a hair above the 50 boom-bust line. Together, weakness in both sectors pushed down the composite index to 48.9 (Chart 10). Stringent restrictions designed to halt rising rates in COVID-19 infections explain much of the deterioration in China’s service-sector activity. The sector will likely rebound in September with the easing in infection levels (Chart 11). Chart 10PMIs Show Slowing Economic Activity
PMIs Show Slowing Economic Activity
PMIs Show Slowing Economic Activity
Chart 11Lingering COVID Effects Curb Service-Sector Recovery In 2H21
Lingering COVID Effects Curb Service-Sector Recovery In 2H21
Lingering COVID Effects Curb Service-Sector Recovery In 2H21
Meanwhile, the construction PMI surprisedly rebounded sharply in August (Chart 10, bottom panel). However, investors should be cautious not to read too much into the idiosyncratic month-on-month moves suggested by the construction PMI. Instead, construction activity has moderated significantly and is set to slow further, hinting at plunged excavator sales and real estate investment in construction (Chart 12). Chart 12Construction Activity Is Unlikely To Pick Up Meaningfully This Year
Construction Activity Is Unlikely To Pick Up Meaningfully This Year
Construction Activity Is Unlikely To Pick Up Meaningfully This Year
It is clear that China’s economy is losing momentum, but greater economic weakness will be needed for policymakers to stimulate meaningfully. Export Sector Remains A Bright Spot China’s exports remain robust. Export growth picked up in August from July on a year-over-year basis. Although the improvement in August reflects a base effect, exports in level reached a new high (Chart 13). Both skyrocketed exports container freight index and strong Korean exports suggest that global demand for Chinese manufacturing goods remains resilient (Chart 14). Even though manufacturing PMIs from developed markets have rolled over, they remain elevated and should continue to support China’s exports (Chart 15). Chart 13Chinese August Exports In Level Reached A New High
Chinese Small And Medium Caps Are Finding Their Shining Moment
Chinese Small And Medium Caps Are Finding Their Shining Moment
Chart 14Exports Will Remain Robust In The Rest Of The Year...
Exports Will Remain Robust In The Rest Of The Year...
Exports Will Remain Robust In The Rest Of The Year...
In contrast to resilient exports, China’s official PMI export new orders subindex has declined for five consecutive months. Even though falling PMI new export orders subindex heralds a slowing in exports growth, a reading of below the 50 boom-bust threshold in the former does not suggest a contraction in the growth rate of the latter. Furthermore, the month-over-month nature of PMI new export orders subindex tends to overstate the volatility in exports. The divergence between the PMI new export orders subindex and real export growth also occurred in 2018/19 during the height of the US-China trade war when export orders were volatile (Chart 16). Chart 15...And Will Continue To Benefit From Strong Global Demand
...And Will Continue To Benefit From Strong Global Demand
...And Will Continue To Benefit From Strong Global Demand
Chart 16A Divergence Between PMI New Export Orders And Export Growth
A Divergence Between PMI New Export Orders And Export Growth
A Divergence Between PMI New Export Orders And Export Growth
Regulatory Tightening In Real Estate Sector Stringent regulations in housing since the beginning of the year have started to cool the sector (Chart 17). However, home prices inflation in tier-one cities is still elevated (Chart 18). Thus, we expect the controls on housing and among property developers will remain in place for the next 6 to 12 months. Chart 17Housing Sector Is Cooling...
Housing Sector Is Cooling...
Housing Sector Is Cooling...
Chart 18...But Housing Prices In First-Tier Cities Keep Rising At A Faster Rate
...But Housing Prices In First-Tier Cities Keep Rising At A Faster Rate
...But Housing Prices In First-Tier Cities Keep Rising At A Faster Rate
Industrial Profits: Rising Prices, Falling Production China’s industrial profit growth remained solid in July despite the waning low base effect. Manufacturing producer prices continued to rise, offsetting weaker production growth (Chart 19). In addition, a low interest-rate environment helped to lift profits in the manufacturing sector by reducing debt servicing costs. While we expect weakening domestic demand and peaking producer prices to weigh on corporate profits in the rest of this year, profit growth is rolling over from a lofty height and will not likely drop sharply in the coming months (Chart 20). In addition, producer prices will likely remain at a historically high level in the next six months given robust global demand for raw materials and persistent global supply shortages. Chart 19Rising Prices And Low Interest Rates Helped To Offset Falling Industrial Production
Rising Prices And Low Interest Rates Helped To Offset Falling Industrial Production
Rising Prices And Low Interest Rates Helped To Offset Falling Industrial Production
Chart 20Peaking Producer Prices Will Weigh On Corporate Profits
Peaking Producer Prices Will Weigh On Corporate Profits
Peaking Producer Prices Will Weigh On Corporate Profits
Meanwhile, there is a large gap between the prices for producer goods and consumer goods, suggesting that manufacturers in mid-to-downstream industries have not been able to fully pass on rising input costs to domestic consumers (Chart 21). Profit growth continues to be disproportionally stronger in the upstream industrial producers than in the downstream industries, while the profit margin in the manufacturing sector remains much more muted (Chart 22). Chart 21Inflation Passthrough From Manufacturers To Domestic Consumers Remains Limited
Inflation Passthrough From Manufacturers To Domestic Consumers Remains Limited
Inflation Passthrough From Manufacturers To Domestic Consumers Remains Limited
Chart 22Profit Growth In Upstream Industries Still Outpaces Manufacturing Sector
Profit Growth In Upstream Industries Still Outpaces Manufacturing Sector
Profit Growth In Upstream Industries Still Outpaces Manufacturing Sector
Table 1
Chinese Small And Medium Caps Are Finding Their Shining Moment
Chinese Small And Medium Caps Are Finding Their Shining Moment
Table 2
Chinese Small And Medium Caps Are Finding Their Shining Moment
Chinese Small And Medium Caps Are Finding Their Shining Moment
Footnotes Market/Sector Recommendations Cyclical Investment Stance