Soft Drinks
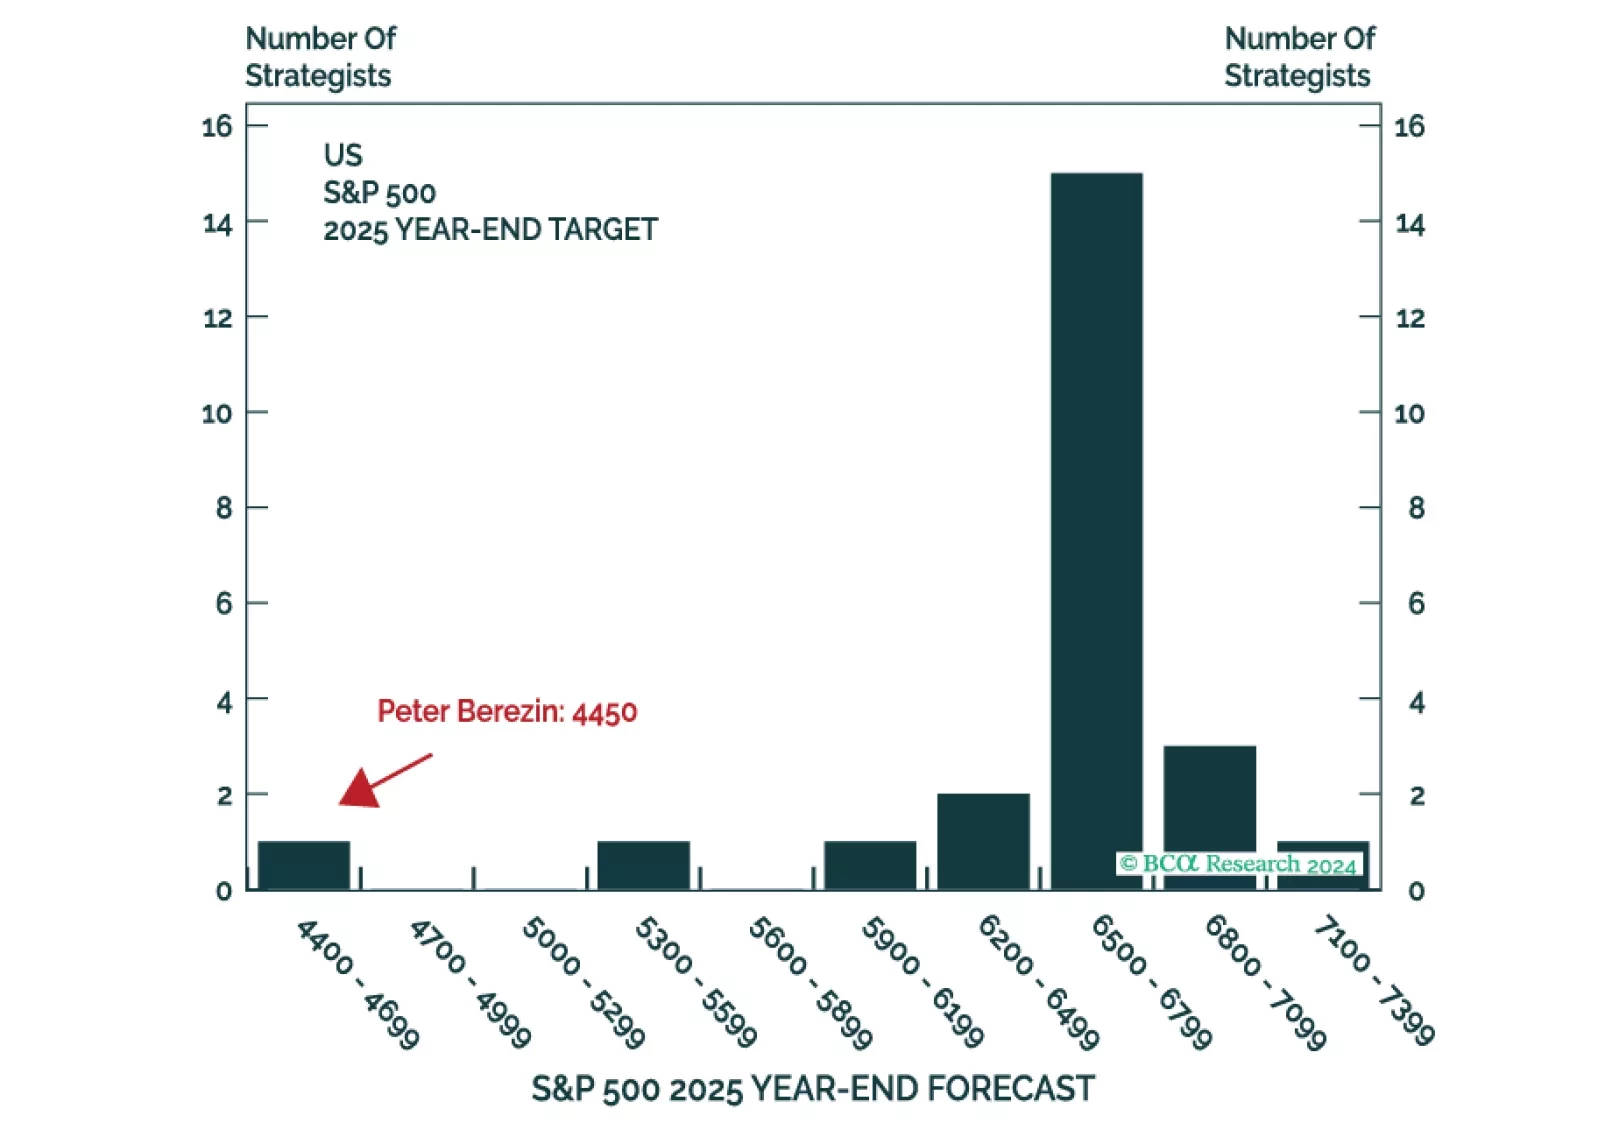
This is the time of the year when strategists are busy sending out their annual outlooks. Here on the Global Investment Strategy team, we decided to go one step further. Rather than pontificating about what could happen in 2025, we decided to harness the power of the multiverse to tell you what did happen (in at least one highly representative timeline).
Next week, please join me for a Webcast on Tuesday, December 17 at 10:30 AM EST (3:30 PM GMT, 4:30 PM CET) to discuss the economy and financial markets.
And with that, I will sign off for the year. I wish you and your loved ones a very happy and healthy 2025. We will be back in the first week of January with our MacroQuant Model Update.

Neutral (Downgrade Alert) Soft drinks have taken a beating recently and we are on the lookout for an oversold bounce before we go underweight this consumer goods sub-group, especially given our short-term cautious outlook. Our technical indicator also made a new 20-year low and is well below the level consistent with previous reversals, underscoring that a counter-trend bounce is a high probability event (bottom panel). On the earnings’ front, while KO’s and PEP’s earnings were on the bright side, leading macro indicators signal that investors will be better off to avoid this defensive consumer staples sub-index. Importantly, safe-haven soft drink stocks that tend to be very stable cash flow generators both in good times and in bad, fare worse during the early stages of an economic expansion. As growth transitions from scarcity to abundance, investors start to shed staples exposure including soft drinks (ISM shown inverted, middle panel). Bottom Line: The S&P soft drinks index is on our downgrade watchlist. The ticker symbols for the stocks in this index are: BLBG: S5SOFD – KO, PEP, MNST. For more details, please refer to this Monday’s Strategy Report.
Highlights Portfolio Strategy Rising demand for packaging materials, increasing industry pricing power along with compelling relative valuations signal that ignored containers and packaging stocks are a hidden gem within the S&P materials sector. Stay overweight. Softening industry activity coupled with an absence of an export relief valve at a time when the economy is on track to fire on all cylinders, compel us to put the S&P soft drinks index on our downgrade watch list. Recent Changes There are no changes to our portfolio this week. Table 1 Feature Equity market euphoria has taken over with the SPX vaulting to fresh all-time highs on numerous occasions over the past two weeks. An easy Fed and ultra-loose fiscal policies remain the key macro drivers of this bull market. While the economy is on track to boom in 2021, leading economic indicators will soon be running into trouble and will have to come off the boil. The ISM manufacturing and services readings are at nose bleed levels, raising some eyebrows of how much further they can rise (Chart 1). The looming $2.4tn infrastructure bill following on the heels of the $900bn and $1.9tn fiscal easing packages since late-December are also likely fully reflected in the exuberant equity prices. As we showed two weeks ago, already more than two Fed hikes are priced in the OIS market over the next 24 months, and four by the end of 2023 (Chart 2)! Chart 1As Good As It Gets Chart 2Explaining US Dollar Strength S&P 500 twelve-month and five-year forward EPS estimates have crested and so have net earnings revisions (Chart 3). The SPX’s annual rate of change cannot go any higher for the remainder of the year (second panel, Chart 1) and breadth is as good as it gets with both SPX percent of stocks trading above their 50 and 200 day moving averages closing in on 100% (Chart 4). Chart 3Cresting Euphoria? Chart 4Extended Breadth? The VIX recently melted below 16, junk yields hit all-time lows and the high-yield option adjusted spread multi-year lows (Chart 5). With regard to market internals, looking underneath the SPX hood is revealing. We recently booked handsome gains of 17% in our cyclicals/defensives portfolio bent and moved to the sidelines. This ratio has since ticked down, and so has the small/large ratio. As a reminder, we cemented gains north of 16% early in the year on the size bias and have been neutral since January 12, 2021. Even our long “Back-To-Work”/short “COVID-19 Winners” pair trade has hit a wall and we recently set a 5% rolling stop in order to protect profits of over 20% since our second inception in early February (Chart 6). Chart 5Complacency Reigns Supreme Chart 6Running Out Of Steam Finally, a number of key macro indicators we track are keeping us alert and make us uneasy with the recent stampede into stocks. EURUSD was the first to peak early in January, then gold bullion stalled and finally the South Korean Kospi index peaked. Tack on the recent relative EM stock market underperformance and the risk is that these growth hypersensitive indicators are sniffing out some trouble, potentially an ex-US economic soft-patch. Thus, some caution is warranted until all of these key indicators break out of their recent funk (Charts 7 & 8). Chart 7Three Macro Assets To Closely Monitor Chart 8Running Out Of Stimulus This week we update our SPX dividend discount model (DDM) for the fifth year running, along with the SPX EPS/multiple sensitivity analysis and the SPX forward equity risk premium (ERP). All three ways point to an SPX fair value near 4,050. As a reminder, we have been, and remain, very conservative in our DDM assumptions. Again this year we assume that no buybacks will occur, a long held assumption of ours, i.e. we pencil in a steady divisor in the coming five-year time frame. 2026 is our terminal year when dividend growth settles at 6.6%, 60bps below the long-term average (bottom panel, Chart 9). Our 8.2% discount rate mirrors the corporate junk bond yield historical average. First off, remarkably, the SPX full year 2020 dividend went up 4 cents/share on a year-over-year basis, and blew out even the most optimistic estimates we had last April! While financials chopped their dividends following the Fed’s guidance, the S&P energy sector maintained their dividends as we predicted last spring. Impressively, we posited that XOM and CVX would sustain their dividend aristocrats status (i.e. minimum of 25 consecutive years of rising dividend payouts), which was controversial at the time, and subsequently these two US oil majors diverged from their European peers. Moreover, while a lot of pundits used the GFC as a close parallel, the 9/11 accelerated recession proved the most accurate historical episode from a dividend perspective (bottom panel, Chart 9), and we would not be surprised if a jump in dividend growth similar to the post 9/11 recession takes root. Chart 9Resilient SPX Dividends Continuing from last year, this year we use two different dividend growth approaches: our own estimates and alternatively the S&P 500 dividend futures derived growth. Tables 2 & 3 summarize the results. Table 2SPX Dividend Discount Model: Using USES Dividend Growth Assumptions Table 3SPX Dividend Discount Model: Using S&P Dividend Futures Growth Assumptions Table 4SPX EPS & Multiple Sensitivity Our own dividend growth estimates result in an SPX 4,050 fair value target (Table 2). Our assumptions are not as pessimistic as the SPX dividend futures, which result in an SPX 2,900 fair value (Table 3, please click here if you would like to receive our DDM and insert your own assumptions). Table 5Forward Equity Risk Premium Analysis In order to complement our SPX 4,050 fair value estimate, Tables 4 & 5 highlight our sensitivity analysis and forward ERP fair value estimates. Our starting point is the Street’s $203.1 EPS estimate for calendar 2022 and the backed out SPX forward P/E of 20.3. Similarly, for the forward ERP analysis we use the sell-side’s 2022 EPS estimate along with a forward 10-year US Treasury yield of 2% and an equilibrium ERP near 300bps on the back of: the Fed’s commitment to stay extremely accommodative, melting volatility, collapsing policy uncertainty and soaring ISM manufacturing (Charts 10 & 11). Chart 10Booming Economy… Chart 11…Translates Into Melting ERP This dual analysis corroborates the SPX DDM model’s 4,050 fair value and suggests that the SPX is fully valued at the current juncture, leaving little, if any, wiggle room for any mishaps. Our two key macro risks for the remainder of the year remain China’s looming slowdown and the Fed’s tapering, warning that some near-term caution is warranted. This week we update a niche materials subsector and set a downgrade on a consumer staples consumer goods subgroup. Stick With Containers And Packaging Containers and packaging stocks now comprise roughly 13% of the S&P materials index, represent a niche group within a niche sector and were we not already overweight we would not hesitate to commit capital to this index. In a nutshell, Chart 12 captures the attractiveness of container and packaging stocks. These neglected materials stocks are a play on rising pricing power due to insatiable demand for containerboard and other packaging materials. Tack on executives cost discipline and a profit margin expansion story will surprise analysts and investors alike and serve as a catalyst for a durable rerating phase (bottom panel, Chart 12). In more detail, packaged food exports coupled with consumer outlays on food and beverages are soaring. Expanding food manufacturing shipments corroborate this upbeat demand backdrop and signal that the path of least resistance is higher for ultra-pessimistic sell-side analysts’ top and bottom line growth estimates (Chart 13). Chart 12What’s Not To Like? Chart 13Upbeat Demand… Booming intermodal rail carloads gauging the retail industry’s demand also underpin container and packaging manufacturers’ profits (middle panel, Chart 14). Similarly the CASS freight index that tracks the health of different US freight industries is surging and confirms that relative profits will rebound in the back half of the year (bottom panel, Chart 14). Beyond the vigorous recovery in food manufacturing as per the Fed’s latest IP release that is a boon for packaging producers (bottom panel, Chart 15), COVID-19 ramifications also represent a rising source of demand for the industry. COVID-19 has served as an accelerant to the ongoing trend of non-store retail sales grabbing an ever increasing share of total retail sales. As internet sales garner a larger slice of the overall pie, the implication is that demand for boxes and other packaging materials like bubble wrap is increasing at a healthy clip (second panel, Chart 15). Chart 14...Everywhere… Chart 15…One Looks Finally, from a world perspective, global export volumes have vaulted to fresh all-time highs (third panel, Chart 15) and global readings of manufacturing PMIs have reached escape velocity. The upshot is that as trade picks up steam and bottlenecks and shortages get resolved likely in the back half of 2021, export volumes will remain buoyant further boosting the allure of container and packaging equities. Netting it all out, rising demand for packaging materials, increasing industry pricing power along with compelling relative valuations signal that ignored containers and packaging stocks are a hidden gem within the S&P materials sector. Bottom Line: Stay overweight the S&P containers and packaging index. The ticker symbols for the stocks in this index are: BLBG: S5CONP– WRK, SEE, IP, AVY, BLL, PKG, AMCR. Put Soft Drinks On Downgrade Alert Soft drinks have taken a beating recently and we are on the lookout for an oversold bounce before we go underweight this consumer goods sub group, thus today we set a downgrade alert. While PEP’s earnings were on the bright side, leading macro indicators signal that investors will be better off to avoid this defensive consumer staples sub-index. Importantly, safe-haven soft drink stocks that tend to be very stable cash flow generators both in good times and in bad, fare worse during the early stages of an economic expansion. As growth transitions from scarcity to abundance, investors start to shed staples exposure including soft drinks (ISM shown inverted, middle panel, Chart 16). Similarly on the operating front, our Beverage Industry Activity Proxy has crested of late and warns that sinking relative profits growth estimates will likely prove accurate (bottom panel, Chart 16). True, sell-side analysts appear to have thrown in the towel on this consumer goods subgroup with both 12-month and five-year forward profit growth estimates plunging to multi-year lows (middle panel, Chart 17). But, relative valuations have followed down the path of this EPS drubbing, and the relative forward P/E ratio is trading 14% below the historical mean (bottom panel, Chart 17). Chart 16Some Yellow Flags Chart 17De-rating Blues Actual profits and revenues have made a full circle owing to the sizable jump during the pandemic induced stay-at-home bonanza, however, such a stellar growth repeat remains elusive for 2021. This is especially true if the export relief valve remains firmly closed for the industry. Already there is a sizable gap between the smart rebound in the Asian currency index, but industry exports are still trying to achieve positive year-over-year momentum (Chart 18). The relative tick down in soft drink industrial production (IP), according to the Fed’s latest IP release, corroborates our view that there is an element of stealing demand from the future due to COVID-19, and top line growth will likely surprise to the down side, especially given the soaring reading from the ISM manufacturing survey (ISM shown inverted, bottom panel, Chart 19). Chart 18Export Valve is Blocked Chart 19Roaring Economy Weighs On Defensives Nevertheless, we are patient before pulling the trigger and downgrading to a below benchmark allocation, as not only technicals are washed out, but also three additional indicators keep us on the sidelines, at least, for now: First, if there is even a mild economic relapse, the 10-year US Treasury yield will be the first to sniff it out and the recent pause in the bond market’s selloff is cause for minor concern (top panel, Chart 20). Second, industry shipments, while a lagging indicator remain resilient (middle panel, Chart 20). Finally, soft drinks pricing power is also robust and there is tentative evidence that beverage producers have been successful in passing on at least part of their rising input costs – mostly commodity related inflation (bottom panel, Chart 20). Netting it all out, softening industry activity coupled with an absence of an export relief valve at a time when the economy is on track to fire on all cylinders, compel us to put the S&P soft drinks index on our downgrade watch list. Bottom Line: Set a downgrade alert on the S&P soft drinks index. The ticker symbols for the stocks in this index are: BLBG: S5SOFD – KO, PEP, MNST. Chart 20But There Are Some Substantial Offsets Anastasios Avgeriou US Equity Strategist anastasios@bcaresearch.com Current Recommendations Current Trades Strategic (10-Year) Trade Recommendations Size And Style Views February 24, 2021 Stay neutral cyclicals over defensives January 12, 2021 Stay neutral small over large caps June 11, 2018 Long the BCA Millennial basket The ticker symbols are: (AAPL, AMZN, UBER, HD, LEN, MSFT, NFLX, SPOT, ABNB, V). January 22, 2018 Favor value over growth
S&P Hypermarkets (Overweight) Upgraded from Neutral S&P Soft Drinks (Neutral) Upgraded from Underweight As a follow up to our yesterday’s Insight where we outlined some of our reasons to go underweight the S&P technology sector, today we focus on two defensive sub-sectors that will benefit from the spreading cracks in the U.S. economy: S&P hypermarkets and S&P soft drinks. Both sub-sectors enjoy deteriorating macroeconomic conditions, which are currently reflected in the steep fall in U.S. economic data surprises, the drubbing of the 10-year U.S. treasury yield, melting inflation and rapidly contracting ISM PMI numbers (see chart) Bottom Line: Stick with defensive consumer stocks. For a more detailed discussion on S&P hypermarkets and S&P soft drinks, please see our July 15 Weekly Report and “Bubbling Up” Insights,1 respectively. For the complete list of our recent moves, please see our Monday’s Weekly Report. 1 Please see BCA U.S. Equity Strategy Insight Reports, “Bubbling Up (Part I)” and “Bubbling Up (Part II)”, dated July 24, 2019 available at uses.bcaresearch.com.

In the previous Insight we highlighted a number of firming beverage industry operating metrics, however, soft drinks industrial production itself is still waving a yellow flag. In fact, relative output is contracting at the steepest pace in two decades. …
As our U.S. Equity Strategy team continues to shift its portfolio away from cyclical and toward defensive exposure, it is upgrading the S&P soft drinks index from underweight to neutral. This defensive pure-play consumer goods sub-sector sparkles during…
Neutral While in the previous Insight we highlighted a number of firming beverage industry operating metrics, soft drinks industrial production is still waving a yellow flag. In fact, relative output is contracting at the steepest pace in two decades (middle panel). A quick inventory check explains part of this softness. Beverage inventories continue to expand and this supply overhang will continue to weigh on output until inventory clears all channels (not shown). Finally, soft drinks stocks are trading at a 37% premium to the broad market and near the top end of the historical range. While this frothy valuation backdrop is worrisome, should earnings continue to surprise to the upside as we expect in the coming quarters then soft drink equities will grow into their pricey valuations. Bottom Line: Upgrade the S&P soft drinks index from underweight to neutral and lock profits of 5.5% since inception. The ticker symbols for the stocks in this index are: BLBG: S5SOFD - PEP, KO, MNST.
Neutral As we continue shifting our portfolio away from cyclical and toward defensive exposure, we are upgrading the S&P soft drinks index from underweight to neutral, locking in a relative gain of 5.5% since inception. This defensive pure-play consumer goods sub-sector sparkles during economic slumps and heightened policy uncertainty (ISM shown inverted, second panel). Despite the broad-based slowing inflation data, both the soft drinks industry’s CPI and PPI measures continue growing at a healthy pace (bottom panel). PEP and KO results reflected this rising pricing power backdrop, as both companies had success in passing these price hikes down the supply chain. Moreover, relative beverage shipments have likely troughed, and similar to overall non-discretionary sales outshining discretionary retail sales (not shown), signal that a brighter demand backdrop looms. Importantly, our beverage industry activity proxy corroborates this message pointing to a recovery in relative profit growth (third panel). However, there are a couple of thorny issues that are still keeping us at bay and preventing us from lifting exposure all the way to overweight (please see the next Insight).
Underweight S&P soft drinks index heavyweight Coke reported its results last week and though it beat earnings estimates, the stock offered its worst performance in more than a decade. This is despite solid pricing gains for the industry as a whole (second panel) and for Coke in particular. The reason for the fall was weak guidance for the year ahead; Coke flagged weakening EM consumer trends and currency headwinds as the key culprits behind the softening results. This jives with the pain all consumer products exporters are feeling (third panel), perhaps more acutely by Coke given the majority of their revenues are derived overseas. Regardless of a supportive pricing environment, S&P soft drinks sector EPS growth has been trailing the broad market for the better part of the last ten years (fourth panel). Even with the recent drubbing the index has taken, it continues to sport a more than 20% premium to the broad market (bottom panel). Stay underweight. The ticker symbols for the stocks in this index are: BLBG: S5SOFD - PEP, KO, DPS, MNST.
Underweight The S&P soft drinks index popped in late October, driven by better than expected Q3 results, mostly at Coke. In truth, pricing power has been staging a fairly steady recovery since falling off a cliff in 2016, though it has recently rolled over (second panel). More important to the index is the structural underperformance in earnings growth (third panel). While pricing improvements seem to be helping close the gap, the industry has nearly a decade of uninterrupted earnings deficit relative to the broad market. As such, the recent recovery in the S&P soft drinks index without an accompanying EPS lift has driven sector valuations to a 40% premium to the S&P 500 (bottom panel). Considering the stalling pricing efforts, U.S. dollar strength and a generalized global trade slowdown, this seems overly optimistic. Stay underweight. The ticker symbols for the stocks in this index are: BLBG: S5SOFD - PEP, KO, MNST.