South Korea

BCA Research’s Emerging Markets Strategy service recommends overweighting Korea within an EM equity portfolio. Korean equity valuations are neutral in absolute and relative terms. Hence, other factors rather than valuations will be the major drivers of…
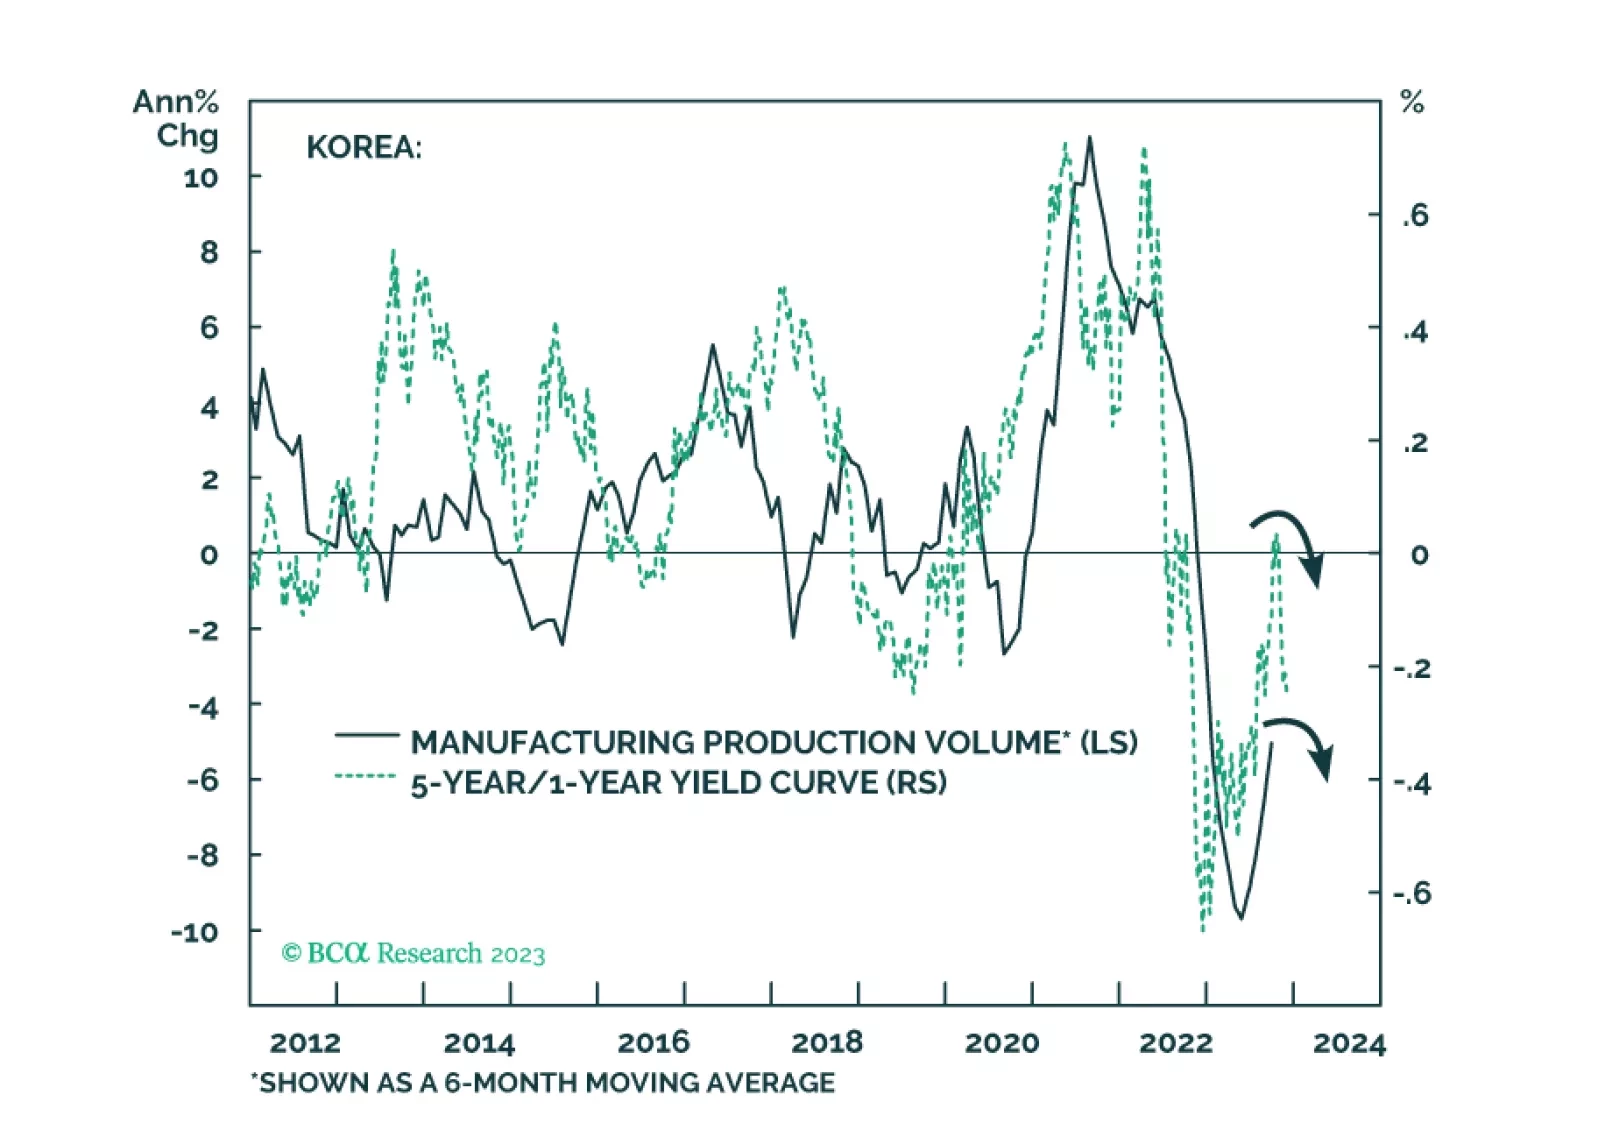
The recent increase in Korean exports will likely prove to be a mid-cycle rebound within a cyclical downtrend. Korea’s households and enterprises are among the most indebted globally, and their debt service ratio is among the highest in the world. Korea’s 10-year bond yields have peaked. We discuss opportunities in Korean stocks as well as in fixed income and currency markets.
According to BCA Research's Emerging Markets Strategy service, investors should focus on fluctuations in final demand rather than inventories. A common narrative endorsed by many market participants is that inventory restocking worldwide will support the…
South Korean exports are the latest in a series of Asian trade data suggesting that the global trade cycle is bottoming. The 5.1% y/y increase in October marks the first return to growth since September 2022. Among South Korea's major trade partners, sales to…

The global economy will not enjoy an “immaculate disinflation” but will suffer a very maculate one due to China’s growth slowdown and restrictive monetary policy in the developed world. Investors should stay overweight low-beta assets.
South Korean exports in the first 20 days of July corroborate the signal from Taiwanese export orders that Asian trade conditions remain weak. The former declined by -15.3% y/y, undoing the optimism following a 5.3% y/y increase in the first 20 days of June.…
Executive Summary New Orders Of Chips Are Downbeat Emerging Asian semiconductor (semi) stocks have rallied considerably. While momentum could push them higher in the short term, stock prices are vulnerable to the downside due to shrinking demand over the next six months. We expect global semi demand to continue contracting, but the pace of decline will moderate in 2023H2. While demand has increased briskly for Artificial Intelligence-type semiconductors, this will not be enough to lift aggregate global chip sales out of contraction. Meanwhile, geopolitical headwinds will persist and spark more disruptions of the worldwide semiconductor supply chain. Nevertheless, the structural outlook for global semiconductor demand remains constructive. Bottom Line: The AI-fueled surge in semi share prices is not sustainable and will correct later this year. We are waiting for a better entry point to take advantage of structural tailwinds. Meanwhile, a boost in AI chip demand will marginally bring more orders to the Taiwan Semiconductor Manufacturing Company Ltd. (TSMC). We are upgrading Taiwanese tech from underweight to neutral within the EM equity benchmark. In addition, we remain overweight Korean tech stocks and the Korean Composite Stock Price Index (KOSPI) within the EM equity benchmark. Feature Chart 1Semiconductor Stocks vs. Sales: A Significant Divergence Semi stock prices have been rallying strongly since last October, even though sales of global semis are still in a deep downswing (Chart 1). We believe the rally in Asian semi stocks cannot be justified due to the poor semi demand outlook for 2023H2. AI-related chips only account for a tiny share (2%-3%) of world semi sales. A significant upsurge in the demand for AI chips will not be able to lift global semi sales out of contraction for the rest of this year. Semi consumption for smartphones, personal computers (PCs) and servers will continue to shrink. Meanwhile, recent semi export restrictions imposed by Japan and China’s ban on Micron will hamper worldwide semi sales this year. Hence, Asian semi stock prices will likely relapse in 2023H2 as the reality of disappointing global chip demand sets in. Global Semi Demand: A Bleak Outlook In 2023H2 The ongoing shrinkage in international semiconductor sales has been broad-based, with the deepest reduction having occurred in China (Chart 2). Furthermore, the magnitude of the decline in global semiconductor sales is the largest since 2009. According to the most recent S&P Global Electronics PMI report, the global electronics sector continued to signal shrinking demand in May, with new orders down for the tenth time in the past eleven months (Chart 3, top panel). The new orders component of the Taiwanese semiconductor PMI dropped below 40 after failing to move above the neutral 50 line (Chart 3, bottom panel). Chart 2Semiconductor Sales Are Contracting Across Regions Chart 3New Orders Of Chips Are Downbeat We expect world semi sales to continue contracting in 2023H2, based on the following factors: Domestic semi demand in China will fail to recover in the next six months. At best it will stagnate at a very low level. Given that China accounts for one-third of the world’s semi usage, global semi demand will not improve as long as China’s demand remains very weak. Both Taiwanese export orders from mainland China and mainland China’s semiconductor imports are still in a deep contraction (Chart 4). Despite China’s reopening, domestic sales of smartphones, PCs and other electronic goods in April were significantly below their pre-pandemic levels in April 2019 (Table 1). Chart 4Declining Semiconductor Demand In China Table 1China: Consumer Electronics Sales Chart 5Chinese Consumers Still Prefer To Save Than To Spend Chinese consumers still prefer to save rather than spend and invest (Chart 5). Last week’s EMS/CIS joint report pointed out that Chinese households are showing symptoms of a liquidity trap. High debt-servicing costs along with downbeat sentiment will curb the household demand for credit. Semi demand in the world outside China will also face recovery challenges in the next six months. Imports of Chinese electronic products by US and EU countries have plunged (Chart 6). Shrinking demand for consumer goods will impede the revival of semi consumption in the developed world, which accounts for over one-third of global semi sales (Chart 7). A review of major semiconductor-consuming sectors below also paints a dismal picture for global semi demand in the coming six months. Chart 6Falling US And EU Imports Of Electronics Chart 7DM Demand For Consumer Goods Will Continue Shrinking Mobile phones, traditional PCs and tablets: These electronic goods account for about 40% of global semi sales. Despite price cuts and heavy promotions from vendors, consumer demand remained sluggish due to overconsumption in previous years and slumping global growth. Thus, global shipments of mobile phones and PCs plunged by about 14% and 30%, respectively, in the first quarter from a year earlier. We expect international shipments of smartphones and PCs to continue to shrink, albeit more moderately, in the next six months. Given that China accounts for the lion’s share of the world’s shipments of mobile phones and PCs, the country’s production of these goods can be used as a proxy for their global shipments. The decline of the former indicates that global demand remains in deep contraction (Chart 8). Servers: Many companies facing macroeconomic uncertainties have not invested, which has resulted in a reduction in IT spending. This aspect has surfaced in a slowing demand for servers. Trendforce in May predicted a nearly 3% year-on-year drop in worldwide server shipment volumes in 2023. Nonetheless, the AI enthusiasm will drastically boost AI server sales this year. Last week Trendforce predicted a nearly 40% surge year-on-year in AI server shipments in 2023, raising AI servers’ share of total server shipments to about 9%. As servers account for only 10% of global semi sales, a 40% surge in AI server sales will boost global semi sales by a mere 0.4% this year compared with last year. Automotive: Auto output levels in major producing countries have been on an upward trajectory as the chip shortage in this sector has eased (Chart 9). In the second half of this year, we expect moderate growth in auto chip shipments due to high borrowing costs dampening the pace of auto sales in both developed and emerging markets. Chart 8Plunging Chinese Phone And PC Output Chart 9Auto Production Will Continue To Increase, Albeit At A Slower Rate Chart 10Inventory Adjustment Is Not Over Yet Industrial electronics: Global manufacturing production will likely remain in contraction for the rest of this year. Nevertheless, given the structural tailwinds for industrial electronics (more use of Internet of Things chips), we expect the growth of industrial electronic sales to slow to mid-single digits in the short term. Automobiles, servers and industrial electronics, which together account for about 30% of global semi sales, will experience positive but subdued growth (0-5%) for the rest of this year. However, such an increase will not be enough to offset ebbing demand in the consumer electronic goods sector in the next six months. Ongoing inventory digestion: Customer and channel inventories have come down, but some of them are still higher than normal (Chart 10). In recent earnings calls, major semiconductor companies mentioned that an inventory adjustment will continue to weigh on semi sales in 2023H2. In addition, companies whose inventories are at normal levels will be cautious in making orders to avoid an inventory buildup in view of heightened macroeconomic uncertainty. Geopolitical headwinds: US-China tensions persist and will cause more disruptions on the global semi supply chain. For example, the US banned exports of advanced node (sub-14 nanometer) chipmaking equipment to China last September. Thus, US semiconductor equipment makers including Applied Materials, Lam and KLA have seen sharp drops in their sales to China (Table 2). Japanese chipmaking tool companies will also face dramatic declines in their sales to China when Japan’s semi export ban takes effect on July 23, 2023. In addition, China’s ban on Micron will curtail that company’s semi sales this year. Bottom Line: Worldwide semi sales will continue to shrink through the rest of 2023 or at best stagnate at a very low level. Chart 11 shows that Taiwan’s semiconductor new export orders, which generally lead global semi sales by about three months, remain in a deep contraction. Table 2US Semi Equipment Producers' Shipments To China Chart 11Taiwan's Semiconductor New Export Orders Point To Lingering Contraction In Global Semiconductor Sales A Divergence Between Share Prices And Sales Chart 12A Similar Divergence Between Semiconductor Share Prices And Sales In 2019 A similar divergence between semi share prices and sales occurred in 2019 (Chart 12). In that episode, the 5G hype pushed up semi stock prices. However, the current driver is an AI frenzy triggered by the release of ChatGPT and other large language models. While AI development is structurally positive and will underpin long-term global semi demand, its contribution to semi sales is very limited in the short term. We think there are low odds that global semiconductor producers' stock prices will continue to rally through the second half of 2023. Our reasons are as follows: AI chips only account for about 2-3% of global semi sales, much lower than the one-third share for smartphone chips. The surge in AI chip demand helps only a few companies while the boom in smartphone chips benefited a much larger pool of semiconductor players. Nvidia is the major beneficiary as revenues from its data center business grew by 14% year-on-year in the first quarter of the year. This is because many cloud service providers (CSPs) and enterprises buy Nvidia’s AI chips to use in existing data centers to improve operating performances and efficiencies. By contrast, new data centers, which can benefit more chip companies by using a wider variety of chips, are experiencing slower growth. This year, major CSPs constrained their data center investments as revenue growth in their cloud divisions decelerated. Hence, since the release of ChatGPT at the end of November 2022, two major data center chip suppliers – AMD and Intel – have not yet seen any gain in sales. AMD revenues from its data center & AI group remained almost flat in 2023Q1 and Intel’s plunged by 38% year-on-year in the same period. Chart 13China: No Restocking Of Chips This Time China boosted its overseas purchases of processor and controller chips in 2019H2 and 2020 to build up domestic inventory. However, the country is now in a destocking process (Chart 13). While it was difficult for China to produce processor and controller chips in 2019, this time China can produce many of these items banned by Japan. In addition, the value of such items is much lower than that of processor & controller chips. Bottom Line: Semi producers' stock prices will likely relapse due to bleak fundamentals in the next six months. Ramifications For Taiwanese And Korean Markets Chart 14High-Performance Computing Chips Drive TSMC Sales The rally in global semiconductor stocks will not be justified by improving sales for the rest of this year. We have low conviction on share prices US semiconductor design companies that may sustain their frenzy. We have a higher conviction that the share prices of Taiwanese and Korean semi producers will relapse in absolute terms in 2023H2. For TSMC, there is one positive: a boost in AI chip demand will bring more orders and improve the company’s capacity utilization rate in its 5nm and 7nm fabrication plants. The high-performance computing (HPC) sector has far exceeded the smartphone sector to account for the largest share of TSMC’s revenues in 2023Q1 (44% vs. 34%) (Chart 14). A year ago, HPC’s share was 41%, marginally higher than the 40% share for smartphones. However, we still believe Taiwanese tech is more vulnerable to the downside in absolute terms for the following reasons: A contraction in global smartphone and PC sales in the next six months will hurt TSMC’s top and bottom lines. After all, smartphone makers, smartphone chip designers and PC chipmakers accounted for over 50% of TSMC’s revenues last year. In comparison, only 6.3% of TSMC sales were from Nvidia in 2022. Chart 15Memory Chips Demand And Prices Still Face Some Downside Taiwan remains the epicenter of US-China tensions. Chinese authorities have become increasingly confrontational with the US. Taiwan holds the most advanced chipmaking technology which mainland China needs to advance its long-term strategic policies. Tensions between the US and China have escalated as the Japanese and Dutch governments joined the US to impose restrictive policies curbing tech development in China. Such an escalation has increased the policy uncertainty between Beijing and Taiwan, and the pressure may negatively impact Taiwanese tech stocks. For Korea’s Samsung and Hynix, the memory market is in a free fall due to plummeting demand (Chart 15). We expect more downside in Korean semi stock prices in absolute terms. Nonetheless, Korean tech stocks will benefit on the margin from the following factors: First, China’s ban on Micron will benefit Samsung and SK Hynix as 18% of Micron’s sales in 2022 came from China. Second, Micron announced late last year that it would reduce memory chip supply and make more cuts to its capital spending plan. This may slow the pace of the decline in global memory prices. Overall, we expect the Korean and Taiwanese equity indexes to decline in absolute terms in the months ahead like the majority of EM bourses. Nevertheless, we expect the KOSPI to outperform the EM benchmark and the Taiwanese stock index to be in line with EM stocks for the following reasons: Chart 16Multi-Year Theme: Favor Global Industrials Semiconductor stocks are an early cyclical play. They start outperforming the overall equity benchmark in the late stage of the global manufacturing downturn, which we expect to happen later this year. In contrast, EM ex-China domestic demand is in the early stages of a downturn. Hence, many EM bourses dominated by domestic plays will underperform in the months ahead. The overall Korean and Taiwanese export sectors will benefit from a cheapening currency. However, a depreciating currency will not help the profits of companies exposed to domestic demand. Finally, the KOSPI is a play on our multi-year theme of favoring global industrials relative to other sectors (Chart 16). Bottom Line: In absolute terms, both Taiwanese and Korean semi stock prices will likely relapse in the next six months. Within the EM equity benchmark, we are upgrading Taiwanese tech stocks from underweight to neutral while remaining overweight Korean tech stocks and the KOSPI. Ellen JingYuan He Associate Vice President ellenj@bcaresearch.com
The Global Manufacturing PMI was unchanged at 49.6 in May – below the 50 boom-bust line for the ninth consecutive month. The details of the release were mixed. On the one hand, the Production sub-component rose to an 11-month high of 51.5. On the other hand,…
Recent Asian trade data do not provide any optimism that the global manufacturing slump is nearing its end. South Korean exports collapsed by 16.1% y/y in the first 20 days of May. While the decline was broad-based, sales to China were particularly weak,…
Macro and geopolitical risks may spoil the narrow window for a stock market rally before recessionary trends rise to the fore.