Sorry, you need to enable JavaScript to visit this website.
Skip to main content

Soybeans

The annual Prospective Plantings report released by the US Department of Agriculture (USDA) last week was slightly bullish for corn, neutral for soybeans, and slightly bearish for wheat. It forecasts a 5% drop in corn acreage, a 3% increase in soybean…
Prices of agricultural commodities have come under intensified downward pressure this year. Corn, soybean, and wheat prices have fallen by 8.6%, 8.3%, and 4.9% respectively so far this year. Multiple factors are behind the selloff. First, ag prices…

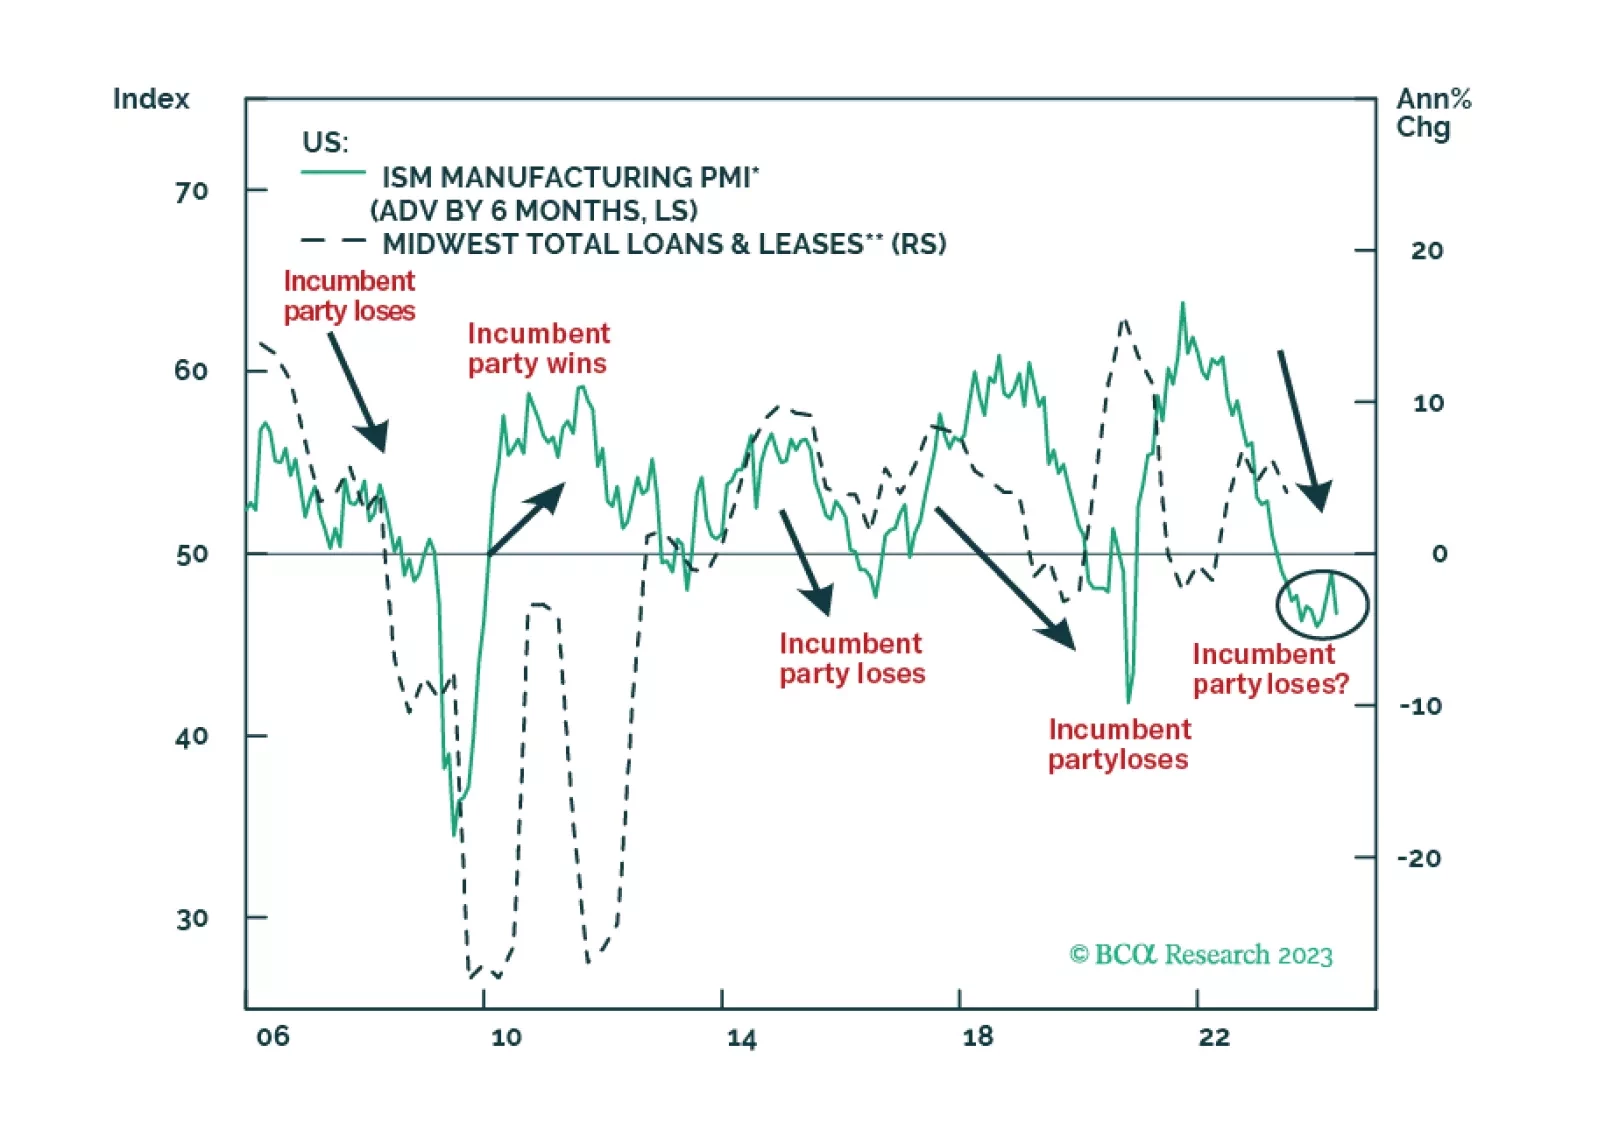
President Biden is facing foreign challenges on three fronts and these challenges are coalescing around the critical states of the Midwest. Take risks off the table and stay defensive in 2024.

Wheat, corn, and soybean all traded lower at the Chicago Board of Trade on Wednesday following the US Department of Agriculture’s latest release of its monthly World Agricultural Supply and Demand Estimates (WASDE) – down 4.2%, 3.5%, and 2.4%, respectively. …
Highlights The surge in energy prices going into the Northern Hemisphere winter – particularly coal and natgas prices in China and Europe – will push inflation and inflation expectations higher into the end of 1Q22 (Chart of the Week).  Over the medium-term, similar excursions into the far-right tails of price distributions will become more frequent if capex in hydrocarbon-based energy sources continues to be discouraged, and scalable back-up sources of energy are not developed for renewables. It is not clear China will continue selectively relaxing price caps for some large electricity buyers, which came close to bankrupting power utilities this year and contributed to power shortages.  The current market set-up favors long commodity index products like the S&P GSCI and the COMT ETF.  We remain long both. Higher energy and metals prices also will work in favor of long-only commodity index exposure over the medium term. Longer-term supply-chain issues will be sorted out. Still, higher costs will be needed to incentivize production of the base metals required to decarbonize electricity production globally, and  to keep sufficient supplies of fossil fuels on hand to back up renewable generation.  This will cause inflation to grind higher over time. Feature Back in February, we were getting increasingly bullish base metals on the back of surging demand from China. Most other analysts were looking for a slowdown.1 The metals rally earlier this year drew attention away from the fact that China had fundamentally altered its energy supply chain, when it unofficially banned imports of Australian thermal coal. It also altered global energy flows and will, over the winter, push inflation higher in the short run. Building new supply chains is difficult under the best of circumstances. But last winter had added dimensions of difficulty: A La Niña drawing arctic weather into the Northern Hemisphere and driving up space-heating demand; flooding in Indonesia, which limited coal shipments to China; and a manufacturing boom that pushed power supplies to the limit. Over the course of this year, Chinese coal inventories fell to rock-bottom levels and set off a scramble for liquified natural gas (LNG) to meet space-heating and manufacturing demand last winter (Chart 2).2 Chart of the WeekEnergy-Price Surge Will Lift Inflation Energy-Price Surge Will Lift Inflation Energy-Price Surge Will Lift Inflation Chart 2Coal Shortage China China Power Outages: Another Source Of Downside Risk Coal Shortage China China Power Outages: Another Source Of Downside Risk Coal Shortage China While this was evolving, the volume of manufactured exports from China was falling (Chart 3), even while the nominal value of these exports was rising in USD terms (Chart 4).  This is a classic inflationary set-up: More money chasing fewer goods.  This is occurring worldwide, as supply-chain bottlenecks, power rationing and shortages, and falling commodity inventories keep supplies of most industrial commodities tight.  China's export volumes peaked in February 2021, and moved lower since then.  This likely persists going forward, given the falloff of orders and orders in hand (Chart 5). Chart 3Volume Of China's Exports Falls … Inflation Surges, Slows, Then Grinds Higher Inflation Surges, Slows, Then Grinds Higher Chart 4… But The Nominal USD Value Rises Inflation Surges, Slows, Then Grinds Higher Inflation Surges, Slows, Then Grinds Higher Chart 5China's Official PMIs, Export And In-Hand Orders Weaken Inflation Surges, Slows, Then Grinds Higher Inflation Surges, Slows, Then Grinds Higher Space-heating and manufacturing in China are both heavily reliant on coal. Space-heating north of the Huai River is provided for free, or is heavily subsidized, from coal-fired boilers that pump heat to households and commercial establishments. This is a practice adopted from the Soviet Union in the 1950s and expanded until the 1980s, according to Fan et al (2020).3 Manufacturing pulls its electricity from a grid that produces 63% of its power from coal. China's coal output had been falling since December 2020, which complicated space heating and electricity markets, where prices were capped until this week. This meant electricity generators could not recover skyrocketing energy costs – coal in particular – and therefore ran the risk of bankruptcy.4 The loosening of price caps is now intended to relieve this pressure. Competition For Fuels Will Continue Europe was also hammered over the past year by a colder-than-normal winter brought on by a La Niña event, which sharply drew natgas inventories. The cold weather lingered into April-May, which slowed efforts to refill storage, and set off a scramble to buy up LNG cargoes (Chart 6). Chart 6The Scramble For Natgas Continues Inflation Surges, Slows, Then Grinds Higher Inflation Surges, Slows, Then Grinds Higher This competition has lifted global LNG prices to record levels, and continues to drive prices higher. Longer-term, the logic of markets – higher prices beget higher supply, and vice versa – virtually assures supply chains will be sorted out. However, the cost of energy generally will have to increase to incentivize production of the base metals needed to pull off the decarbonization of electricity production globally, and to keep sufficient supplies of fossil fuels on hand to back up renewable generation. This will cause inflation to grind higher over time. Decarbonization is a strategic agenda for leading governments, especially China and the European Union. China is fully committed to renewables for fear of pollution causing social unrest at home and import dependency causing national insecurity abroad. In the EU, energy insecurity is also an argument for green policy, which is supported by popular opinion. The US has greater energy security than these two but does not want to be left behind in the renewable technology race – it is increasing government green subsidies. The current set of ruling parties will continue to prioritize decarbonization for the immediate future. Compromises will be necessary on a tactical basis when energy price pressures rise too fast, as with China’s latest measures to restart coal-fired power production. The strategic direction is unlikely to change for some time. Investment Implications Over time, a structural shift in forward price curves for oil, gas and coal – e.g., a parallel shift higher from current levels – will be required to incentivize production increases. This would provide hedging opportunities for the producers of the fuels used to generate electricity, and the metals required to build the infrastructure needed by the low-carbon economies of the future. We continue to expect markets to remain tight on the supply side, which will make backwardation – i.e., prices for prompt-delivery commodities trade higher than those for deferred delivery – a persistent feature of commodities for the foreseeable future.  This is because inventories will remain under pressure, making commodity buyers more willing to pay up for prompt delivery. The current market set-up favors long commodity index products like the S&P GSCI and the COMT ETF. We remain long both, given our expectation. Over the short term, inflation will be pushed higher by the rise in coal and gas prices.   Robert P. Ryan Chief Commodity & Energy Strategist rryan@bcaresearch.com   Commodities Round-Up Energy: Bullish According to the Energy Information Administration (EIA), industrial consumption of natgas in the US is on track to surpass its five-year average this year. Over the January-July period, US natgas consumption average 22.4 BCF/d, putting it 0.2 BCF/d over its five-year average (2016-2020). US industrial consumption of natgas peaked in 2018-19 at just over 23 BCF/d, according to the EIA (Chart 7). The EIA expects full-year 2021 industrial consumption of natgas to be 23.1 BCF/d, which would tie it with the previous peak levels. Base Metals: Bullish Following a sharp increase in refined copper usage in China last year resulting from a surge in imports, the International Copper Study Group (ICSG) is expecting a 5% decline this year on the back of falling imports. Globally, the ICSG expects refined copper consumption to be unchanged this year, and rise 2.4% in 2022. Refined copper production is expected to be 25.9mm MT next year vs. 24.9mm MT this year. Consumption is forecast to grow to 25.6mm MT next year, up to 700k MT from the 24.96mm MT usage expected this year. Precious Metals: Bullish Lower-than-expected job growth in the US pushed gold prices higher at the end of last week on the back of expectations the Fed will continue to keep policy accessible as employment weakened. All the same, gold prices remain constrained by a well-bid USD, which continues to act as a headwind, and only minimal weakening of the 10-year US bond yield, which dipped slightly below the 1.61% level hit earlier in the week (Chart 8). Ags/Softs: Neutral This week's USDA World Agricultural Supply and Demand Estimates (WASDE) were mostly neutral for grains and bearish for soybeans. Global ending bean stocks are expected to rise almost 5.4% in the USDA's latest estimate for ending stocks in the current crop year, finishing at 104.6mm tons. Corn and rice ending stocks were projected to rise 1.4% and less than 1%, ending the crop year at 301.7mm tons and 183.6mm tons, respectively. According to the department, global wheat ending stocks are the lone standout, expected to fall 2.1% to 277.2mm tons, the lowest level since the 2016/17 crop year. Chart 7 Inflation Surges, Slows, Then Grinds Higher Inflation Surges, Slows, Then Grinds Higher Chart 8 Uncertainty Weighs On Gold Uncertainty Weighs On Gold   Footnotes 1     Please see Copper Surge Welcomes Metal Ox Year, which we published on February 11, 2021.  It is available at ces.bcaresearch.com. 2     China’s move to switch to Indonesian coal at the beginning of this year to replace Aussie coal was disruptive to global markets.  As argusmedia.com reported, this was compounded by weather-related disruptions in Indonesian exports earlier this year.  It is worthwhile noting, weather-related delays returned last month, with flooding in Indonesia's coal-producing regions again are disrupting coal shipments.  We expect these new trade flows in coal will take a few more months to sort out, but they will be sorted. 3    Please see Maoyong Fan, Guojun He, and Maigeng Zhou (2020), " The winter choke: Coal-Fired heating, air pollution, and mortality in China," Journal of Health Economics, 71: 1-17.  4    In August and September, the South China Morning Post reported coal-powered electric generators petitioned authorities to relax price caps, because they faced bankruptcy from not being able to recover the skyrocketing cost of coal. Please see China coal-fired power companies on the verge of bankruptcy petition Beijing to raise electricity prices, published by scmp.com on September 10, 2021. This month, Shanxi Province, which provides about a third of China's domestically produced coal, was battered by flooding, which forced authorities to shut dozens of mines, according to the BBC. Please see China floods: Coal price hits fresh high as mines shut published by bbc.co.uk on October 12, 2021. Power supplies also were lean because of the central government's so-called dual-circulation policies to reduce energy consumption and the energy intensity of manufacturing. This is meant to increase self-reliance of the state. Please see What is behind China’s Dual Circulation Strategy? Published by the European think tank Bruegel on September 7, 2021.   Investment Views and Themes Strategic Recommendations
Highlights US crude oil output will continue its sharp recovery before leveling off by mid-2022, in our latest forecast (Chart of the Week). The recovery in US production is led by higher Permian shale-oil production, which is quietly pushing toward pre-COVID-19 highs while other basins languish. Permian output in July was ~ 143k b/d below the basin's peak in Mar20, and likely will surpass its all-time high output in 4Q21. Overall US shale-oil output remains ~ 1.1mm b/d below Nov19's peak of 9.04mm b/d, but we expect it to end the year at 7.90mm b/d and to average 8.10mm b/d for 2022. We do not expect US crude oil production to surpass its all-time high of 12.9mm b/d of Jan20 by the end of 2023. Instead, exploration & production (E&P) companies will continue to prioritize shareholders' interests. This means larger shares of free cashflow will go to shareholders, and not to drilling for the sake of increasing output. While our overall balances estimates remain largely unchanged from last month, we have taken down our expectation for demand growth this year by close to 360k b/d and moved it into 2022, due to continuing difficulties containing the COVID-19 Delta variant. Our Brent crude oil forecasts for 2H21, 2022 and 2023 remain largely unchanged at $70, $73 (down $1) and $80/bbl. WTI will trade $2-$3/bbl lower. Feature Chart 1US Crude Recovery Continues US Crude Recovery Continues US Crude Recovery Continues Global crude oil markets are at a transition point. The dominant producer – OPEC 2.0 – begins retuning 400k b/d every month to the market from the massive 5.8mm b/d of spare capacity accumulated during the COVID-19 pandemic. For modeling purposes, it is not unreasonable to assume this will be a monthly increment returned to the market until the accumulated reserves are fully restored. This would take the program into 2H22, per OPEC's 18 July 2021 communique issued following the meeting that produced this return of supply. Thereafter, the core group of the coalition able to increase and sustain higher production – Kuwait, the UAE, Iraq, KSA and Russia – is expected to meet higher demand from their capacity.1 There is room for maneuver in the OPEC 2.0 agreement up and down. We continue to expect the coalition to make supply available as demand dictates – a data-dependent strategy, not unlike that of central banks navigating through the pandemic. This could stretch the return of that 5.8mm b/d of accumulated spare capacity further into 2H22 than we now expect. The pace largely depends on how quickly effective vaccines are distributed globally, particularly to EM economies over the course of this year and next. US Shale Recovery Led By Permian Output While OPEC 2.0 continues to manage member-state output – keeping the level of supply below that of demand to reduce global inventories – US crude oil output is quietly recovering. We expect this to continue into 1H22 (Chart 2). Chart 2Permian Output Recovers Strongly Permian Output Approaches Pre-Covid Peak Permian Output Approaches Pre-Covid Peak The higher American output in the Lower 48 states primarily is due to the continued growth of tight-oil shale production in the low-cost Permian Basin (Chart 3). This has been aided in no small part by the completion of drilled-but-uncompleted (DUC) wells in the Permian and elsewhere. Chart 3E&Ps Favor Permian Assets Permian Output Approaches Pre-Covid Peak Permian Output Approaches Pre-Covid Peak Since last year’s slump, the rig count has increased; however, compared to pre-pandemic levels, the number of rigs presently deployed are not sufficient to sustain current production. The finishing of DUC wells means that, despite the low rig count during the pandemic, shale oil supply has not dipped by a commensurate amount. This is a major feat, considering shale wells’ high decline rates. Chart 4US Producers Remain Focused On Shareholder Priorities US Producers Remain Focused On Shareholder Priorities US Producers Remain Focused On Shareholder Priorities DUCS have played a large role in sustaining overall US crude oil production. According to the EIA, since its peak in June 2020, DUCs in the shale basins have fallen by approximately 33%. As hedges well below the current market price for shale producers roll off, and DUC inventories are further depleted, we expect to see more drilling activity and the return of more rigs to oil fields. We do not expect US crude oil output to surpass its all-time high of 12.9mm b/ of Jan20 by the end of 2023. Instead, exploration & production (E&P) companies will continue to prioritize shareholders' interests. This means only profitable drilling supporting the free cashflow that allows E&Ps to return capital to shareholders will receive funding. US oil and gas companies have a long road back before they regain investors' trust (Chart 4).   Demand Growth To Slow We expect global demand to increase 5.04mm b/d y/y in 2021, down from last month's growth estimate of 5.4mm b/d. We have taken down our expectation for demand growth this year by ~ 360k b/d and moved it into 2022, because of reduced mobility and local lockdowns due to continuing difficulties in containing the COVID-19 Delta variant, particularly in Asia (Chart 5).2 We continue to expect the global rollout of vaccines to increase, which will allow mobility restrictions to ease, and will support demand. This has been the case in the US, EU and is expected to continue as Latin America and other EM economies receive more efficacious vaccines. Thus, as DM growth slows, EM oil demand should pick up (Chart 6). Chart 5COVID-19 Delta Variant's Spread Remains Public Health Challenge Permian Output Approaches Pre-Covid Peak Permian Output Approaches Pre-Covid Peak Chart 6EM Demand Growth Will Offset DM Slowdown EM Demand Growth Will Offset DM Slowdown EM Demand Growth Will Offset DM Slowdown Net, we continue to expect demand for crude oil and refined products to grind higher, and to be maintained into 2023, as mobility rises, and economic growth continues to be supported by accommodative monetary policy and fiscal support. If anything, the rapid spread of the Delta variant likely will predispose central banks to continue to slow-walk normalizing monetary policy and interest rates. Global Balances Mostly Unchanged Chart 7Oil Markets To Remain Balanced Oil Markets To Remain Balanced Oil Markets To Remain Balanced Although we have shifted part of the demand recovery into next year, at more than 5mm b/d of growth, our 2021 expectation is still strong. This is expected to continue next year and into 2023 although not at 2021-22 rates. Continued production restraint by OPEC 2.0 and the price-taking cohort outside the coalition will keep the market balanced (Chart 7). We expect OPEC 2.0's core group of producers – Kuwait, the UAE, Iraq, KSA and Russia – will continue to abide by the reference production levels laid out in 18 July 2021 OPEC communique. Capital markets can be expected to continue constraining the price-taking cohort's misallocation of resources. These factors underpin our call for balanced markets (Table 1), and our view inventories will continue to draw (Chart 8). Table 1BCA Global Oil Supply - Demand Balances (MMb/d, Base Case Balances) To Dec23 Permian Output Approaches Pre-Covid Peak Permian Output Approaches Pre-Covid Peak Our balances assessment leaves our price expectations unchanged from last month, with Brent's price trajectory to end-2023 intact (Chart 9). We expect Brent crude oil to average $70, $73 and $80/bbl in 2H21, 2022 and 2023, respectively. WTI is expected to trade $2-$3/bbl lower over this interval. Chart 8Inventories Will Continue To Draw Inventories Will Continue To Draw Inventories Will Continue To Draw Chart 9Brent Prices Trajectory Intact Brent Prices Trajectory Intact Brent Prices Trajectory Intact   Investment Implications Balanced oil markets and continued inventory draws support our view Brent and refined-product forward curves will continue to backwardate, even if the evolution of this process is volatile. As a result, we remain long the S&P GSCI and the COMT ETF, which is optimized for backwardation. We continue to wait for a sell-off to get long the SPDR S&P Oil & Gas Exploration & Production ETF (XOP ETF).   Robert P. Ryan Chief Commodity & Energy Strategist rryan@bcaresearch.com Ashwin Shyam Research Associate Commodity & Energy Strategy ashwin.shyam@bcaresearch.com Commodities Round-Up Energy: Bullish The US EIA expects natural gas inventories at the end of the storage-injection season in October to be 4% below the 2016-2020 five-year average, at 3.6 TCF. At end-July, inventories were 6% below the five-year average (Chart 10). Colder-than-normal weather this past winter – particularly through the US Midwest and Texas natural gas fields – affected production and drove consumption higher this past winter, which forced inventories lower. Continued strength in LNG exports also are keeping gas prices well bid, as Asian and European markets buy fuel for power generation and to accumulate inventories ahead of the coming winter. Base Metals: Bullish The main worker’s union at Chile's Escondida mine, the largest in the world, and BHP reached an agreement on Friday to avoid a strike. The mine is expected to constitute 5% of total mined global copper supply for 2021. China's refined copper imports have been falling for the last three months (Chart 11). Weak economic data – China reported slower than expected growth in retail sales and manufacturing output for July – contributed to lower import levels.  Precious Metals: Bullish Gold has been correcting following its recent decline, ending most days higher since the ‘flash crash’ last Monday, facilitated by a drop in real interest rates. The Jackson Hole Symposium next week will provide insights to market participants regarding the Fed’s future course of action and if it is in fact nearing an agreement to taper asset purchases. According to the Wall Street Journal, some officials believe the program could end by mid-2022 on the back of strong hiring reports. This was corroborated by minutes of the FOMC meeting which took place in July, which suggested a possibility to begin tapering the program by year-end. While the Fed stressed there was no mechanical relationship between the tapering and interest rate hikes, this could be bearish for gold, as real interest rates and the bullion move inversely. On the other hand, political uncertainty and a potential economic slowdown in China will support gold prices. Ags/Softs: Neutral Grain and bean crops are in slightly worse shape this year vs the same period in 2020, according to the USDA. The Department reported 62% of the US corn crop was in good to excellent condition for the week ended 15 August 2021, compared to 69% for the same period last year. 57% of the soybean crop was in good-to-excellent shape for the week ending on the 15th vs 72% a year ago. Chart 10 US WORKING NATGAS IN STORAGE GOING DOWN US WORKING NATGAS IN STORAGE GOING DOWN Chart 11 Permian Output Approaches Pre-Covid Peak Permian Output Approaches Pre-Covid Peak Footnotes 1 Please see our report of 22 July 2021, OPEC 2.0's Forward Guidance In New Baselines, which discusses the longer-term implications of this meeting and the subsequent communique containing the OPEC 2.0 core group's higher reference production levels. It is available at ces.bcareserch.com. 2 S&P Global Platts notes China's most recent mobility restrictions throughout the country will show up in oil demand figures in the near future. We expect similar reduced mobility as public health officials scramble to get more vaccines distributed. Please see Asia crude oil: Key market indicators for Aug 16-20 published 16 August 2021 by spglobal.com. Investment Views and Themes Strategic Recommendations Commodity Prices and Plays Reference Table Trades Closed In 2021 Summary of Closed Trades
Highlights Going into the new crop year, we expect the course of the broad trade-weighted USD to dictate the path taken by grain and bean prices (Chart of the Week). Higher corn stocks in the coming crop year, flat wheat stocks and lower rice stocks will leave grain markets mostly balanced vs the current crop year.  Soybean stocks and carryover estimates from the USDA and International Grains Council (IGC) are essentially unchanged year-on-year (y/y). In the IGC's estimates, changes in production, trade, and consumption for the major grains and beans largely offset each other, leaving carryovers unchanged. Supply-demand fundamentals leave our outlook for grains and beans neutral.  This does not weaken our conviction that continued global weather volatility will tip the balance of price risk in grains and beans over the coming year to the upside. Our strategically bearish USD view also tips the balance of price risk in grains – and commodities generally – to the upside. We believe positioning for higher-volatility weather events and a lower US dollar is best done with index products like the S&P GSCI and the COMT ETF, which tracks a version of the GSCI optimized for backwardation.  Feature Chart of the WeekUSD Will Drive Global Grain Markets USD Will Drive Global Grain Markets USD Will Drive Global Grain Markets Chart 2Opening, Closing Grain Stocks Will Be Largely Unchanged Global Grain, Bean Markets Balanced; USD Expected To Drive '21/22 Prices Global Grain, Bean Markets Balanced; USD Expected To Drive '21/22 Prices Going into the new crop year, opening and closing stocks are expected to remain flat overall vs the current crop years, with changes in production and consumption largely offsetting each other in grain and bean markets (Chart 2).1 This will leave overall prices a function of weather – which no one can predict – and the path taken by the USD over the coming year. The IGC's forecast calls for mostly unchanged production and consumption for grains and beans globally, with trade volumes mostly flat y/y. This leaves global end-of-crop-year carryover stocks essentially unchanged at 594mm tons. The USDA expects wheat ending stocks at the end of the '21/22 crop year up a slight 0.5%; rice down ~ 4.5%, and corn up ~ 4%. Below we go through each of the grain and bean fundamentals, and assess the impact of COVID-19 on global trade in these commodities. We then summarize our overall view for the grain and bean complex, and our positioning recommendations. Rice The IGC forecasts higher global rice production and consumption, and, since they expect both to change roughly by the same amount, ending stocks are projected to remain unchanged in the '21/22 crop year relative to the current year (Chart 3). The USDA, on the other hand, is expecting global production to increase by ~ 1mm MT in the new crop year, with consumption increasing by ~ 8mm MT. This leaves ending inventories for the new crop year just under 8mm MT below '20/21 ending stocks, or 4.5%. Chart 3Global Rice Balances Roughly Unchanged Global Rice Balances Roughly Unchanged Global Rice Balances Roughly Unchanged Corn The IGC forecasts global corn production will rise 6.5% to a record high in the '21/22 crop year, while global consumption is expected to increase 3.6%. Trade volumes are expected to fall ~ 4.2%, leaving global carryover stocks roughly unchanged (Chart 4). In the USDA's modelling, global production is expected to rise 6.6% in the '21/22 crop year to 1,195mm MT, while consumption is projected to rise ~ 2.4% to 1,172mm MT. The Department expects ending balances to increase ~ 11mm MT, ending next year at 291.2mm MT, or just over 4% higher. Chart 4Corn Balances Y/Y Remain Flat Corn Balances Y/Y Remain Flat Corn Balances Y/Y Remain Flat Wheat The IGC forecasts global wheat production in the current crop year will increase by ~ 16mm MT y/y, which will be a record if realized. Consumption is expected to rise 17mm MT, with trade roughly unchanged. This leaves expected carryover largely unchanged at ~ 280mm MT globally (Chart 5). The USDA's forecast largely agrees with the IGC's in its ending-stocks assessment for the new crop year. Global wheat production is expected to increase 16.6mm MT y/y in '21/22, and consumption will rise ~ 13mm MT, or 1.7% y/y. Ending stocks for the new crop year are expected to come in at just under 292mm MT, or 0.5% higher. Chart 5Ending Wheat Stocks Mostly Unchanged Ending Wheat Stocks Mostly Unchanged Ending Wheat Stocks Mostly Unchanged Soybeans Both the IGC and USDA expect increases in soybean ending stocks for the '21/22 crop year. However, the USDA’s estimates for ending stocks are nearly double the IGC projections.2 We use the IGC's estimates in Chart 6 to depicts balances. USDA - 2021/22 global soybean ending stocks are set to increase by ~3 mm MT to 94.5 mm MT, as higher stocks from Brazil and Argentina are partly offset by lower Chinese inventories. US production is expected to make up more than 30% of total production, rising 6% year-on-year. Chart 6Higher Bean Production Meets Higher Consumption Higher Bean Production Meets Higher Consumption Higher Bean Production Meets Higher Consumption Impact Of COVID-19 On Ags Trade Global agricultural trade was mostly stable throughout the COVID-19 pandemic. China was the main driver for this resilience, accounting for most of the increase in agricultural imports from 2019 to 2020. Ex-China, global agricultural trade growth was nearly zero. During this period, China was rebuilding its hog stocks after an outbreak of the African Swine Flu, which prompted the government to grant waivers on tariffs in key import sectors, which increased trade under the US-China Phase One agreement. As a result, apart from COVID-19, other factors were influencing trade. Arita et. al. (2021) attempted to isolate the impact of COVID on global agricultural trade.3 Their report found that COVID-19 – through infections and deaths – had a small impact on global agricultural trade. Government policy restrictions and reduced mobility in response to the pandemic were more detrimental to agricultural trade flows than the virus itself in terms of reducing aggregate demand. Policy restrictions and lower mobility reduced trade by ~ 10% and ~ 6% on average over the course of the year. Monthly USDA data shows that the pandemic was not as detrimental to agricultural trade as past events. Rates of decline in global merchandise trade were sharper during the Great Recession of 2007 – 2009 (Chart 7). Many agricultural commodities are necessities, which are income inelastic. Furthermore, shipping channels for these types of commodities did not require substantial human interactions, which reduced the chances of this trade being a transmission vector for the virus, when governments declared many industries using and producing agricultural commodities as necessities. This could explain why agricultural trade was spared by the pandemic. Amongst agricultural commodities, the impact of the pandemic was heterogenous. For necessities such as grains or oilseeds, there was a relatively small effect, and in few instances, trade actually grew. For example, trade in rice increased by ~4%. The value of trade in higher-end items, such as hides, Chart 7COVID-19 Spares Ag Trade Global Grain, Bean Markets Balanced; USD Expected To Drive '21/22 Prices Global Grain, Bean Markets Balanced; USD Expected To Drive '21/22 Prices Chart 8Grains Rallied During Pandemic Global Grain, Bean Markets Balanced; USD Expected To Drive '21/22 Prices Global Grain, Bean Markets Balanced; USD Expected To Drive '21/22 Prices tobacco, wine, and beer fell during the pandemic. This was further proof of the income inelasticity of many agricultural products which kept global trade in this sector resilient. Indeed, the UNCTAD estimates global trade for agriculture foods increased 18% in 1Q21 relative to 1Q19. Over this period, Bloomberg's spot grains index was up 47.08% (Chart 8). Investment Implications We remain neutral grains and beans based on our assessment of the new crop-year fundamentals. That said, we have a strong-conviction view global weather volatility will tip the balance of price risk in grains over the coming year to the upside. Our strategically bearish USD view also tips the balance of price risk in grains – and commodities generally – to the upside. Weather-induced grain and bean prices volatility is supportive for our recommendations in the S&P GSCI and the COMT ETF, which tracks a version of the GSCI optimized for backwardation. These positions are up 5.8% and 7.9% since inception, and are strategic holdings for us.   Robert P. Ryan Chief Commodity & Energy Strategist rryan@bcaresearch.com Ashwin Shyam Research Associate Commodity & Energy Strategy ashwin.shyam@bcaresearch.com   Commodities Round-Up Energy: Bullish US natural gas prices remain well supported by increased power-generation demand due to heat waves rolling through East and West coasts, lower domestic production and rising exports. The US EIA estimates natgas demand for July rose 3.9 bcf/d vs June, taking demand for the month to 75.8 bcf/d. Exports – pipeline and LNG – rose 0.4 bcf/d to 18.2 bcf/d, while US domestic production fell to 92.7 bcf/d, down 0.2 bcf/d from June's levels. As US and European distribution companies and industrials continue to scramble for gas to fill inventories, we expect natgas to remain well bid as the storage-injection season winds down. We remain long 1Q22 call spreads, which are up ~214% since the position was recommended April 8, 2021 (Chart 9). Base Metals: Bullish Labor and management at BHP's Escondida copper mine – the largest in the world – have a tentative agreement to avoid a strike that would have crippled an already-tight market. The proposed contract likely will be voted on by workers over the next two days, according to reuters.com. Separately, the head of a trade group representing Chile's copper miners said prices likely will remain high over the next 2-3 years as demand from renewables and electric vehicles continues to grow. Diego Hernández, president of the National Society of Mining (SONAMI), urged caution against expecting a more extended period of higher prices, however, mining.com reported (Chart 10). We remain bullish base metals generally, copper in particular, which we expect to remain well-bid over the next five years. Precious Metals: Bullish US CPI for July rose 0.5% month-over-month, suggesting the inflation spike in June was transitory. While lower inflation may reduce demand for gold, it will allow the Fed to continue its expansionary monetary policy. The strong jobs report released on Friday prompted markets and some Fed officials to consider tapering asset purchases sooner than previously expected. The jobs report also boosted an increasing US dollar. A strong USD and an increase in employment were negative for gold prices on Monday. There also were media reports of a brief “flash crash” caused by an attempt to sell a large quantity of gold early in the Asian trading day, which swamped available liquidity at the time. This also was believed to trigger stops and algorithmic trading programs, which exacerbated the move. The potential economic impact of the COVID-19 Delta variant is the only unequivocally supportive development for gold prices. Not only will this increase safe-have demand for gold, but it will also prevent the Fed from being too hasty in tapering its asset purchases and subsequently raising interest rates. Chart 9 Natgas Prices Recovering Natgas Prices Recovering Chart 10 Copper Prices Going Down Copper Prices Going Down Footnotes 1     The wheat crop year in the US begins in June; the rice crop year begins this month; and the corn and bean crop years begin in September. 2     Historical data indicate this difference is persistent, suggesting different methods of calculating ending stocks.  The USDA estimates ending stocks for the '21/22 crop year will be 94.5mm tons, while the IGC is projecting a level of 53.8mm.  3    Please refer to ‘Has Global Agricultural Trade Been Resilient Under Coronavirus (COVID-19)? Findings from an Econometric Assessment. This is a working paper published by Shawn Arita, Jason Grant, Sharon Sydow, and Jayson Beckman in May 2021.   Investment Views and Themes Strategic Recommendations Tactical Trades Commodity Prices and Plays Reference Table Trades Closed in 2021 Summary of Closed Trades Image
Highlights Global shortages of medical equipment – including medicines – are frontloaded until emergency production kicks in. As the crisis abates, political recriminations between the US and China will surge. The US will seek to minimize medical supply exposure to China going forward, a boon for India and Mexico. China has escaped the COVID-19 crisis with minimal impact on food supply. Pork prices are surging due to African Swine Flu, but meat is a luxury. Still, the “Misery Index” is spiking and this will increase social instability. Food insecurity, inflation, and large current account deficits suggest that emerging market currencies will remain under pressure. Turkey and South Africa stand to suffer while we remain overweight Malaysia. Feature Chart 1Collapse In Economic Activity Collapse In Economic Activity Collapse In Economic Activity With a third of the world population under some form of lockdown, general activity in the world’s manufacturing powerhouses has collapsed (Chart 1). The breakdown is a double whammy on market fundamentals. On the supply side, government-mandated containment efforts force workers in non-essential services to stay home while, on the demand side, households confined to their homes are unable to spend. Acute demand for medical supplies is causing shortages, while supply disruptions threaten states that lack food security. While global monetary and fiscal stimulus will soften the blow (Chart 2), the economic shock is estimated to be a 2% contraction in real GDP for every month of strict isolation. If measures are extended beyond April, markets will sell and new stimulus will be applied. Already the US Congress is negotiating the $1-$2 trillion infrastructure package that we discussed in our March 4 report, and cash handouts will be ongoing. When the dust settles the political fallout will be massive. Authoritarian states like China and especially Iran will face greater challenges maintaining domestic stability. Democracies like Italy and the US, which lead the COVID-19 case count, are the most likely to experience a change in leadership (Chart 3). Initially the ruling parties of the democracies are receiving a bump in opinion polling, but this will fade as households will be worse off and will likely vent their grievances at the ballot box. Chart 2 Chart 3 Until a vaccine or treatment is discovered, medical equipment and social distancing are the only weapons against the pandemic. National production is (rightly) being redirected from clothing and cars to masks and ventilators to meet the spike in demand. Will the supply shock cause shortages in food and medicine – essential goods for humankind? In this report we address the impact of COVID-19 on global supply security and assess the market implications. Medical Equipment Shortages Will Spur Protectionism Chart Policymakers are fighting today’s crisis with the tools of the 2008 crisis, but a lasting rebound in financial markets will depend on surmounting the pandemic, which is prerequisite to economic recovery (Table 1). As the US faces the peak of its COVID-19 outbreak, public health officials and doctors are raising the alarm on the shortage of medical supplies. A recent US Conference of Mayors survey reveals that out of the 38% of mayors who say they have received supplies from their state, 84.6% say they are inadequate (Chart 4). Italy serves as a warning: A reported 8% of the COVID-19 cases there are doctors and health professionals, often treating patients without gloves or with compromised protective gear. These workers are irreplaceable and when they succumb the virus cannot be contained. In the US, doctors and nurses are re-using masks and sometimes treating patients behind a mere curtain, highlighting the supply shortage. While the shortages are mainly driven by a surge in demand from both medical institutions and households, they also come from the supply side, particularly China. Factory closures and transportation disruptions in China earlier this year, coupled with Beijing’s government-mandated export curbs, reduced Chinese exports, a major source of US and global supplies (Chart 5). Chart 4 Chart 5 Other countries have imposed restrictions on exports of products used in combating the spread of COVID-19. Following export restrictions by the French, German, and Czech governments in early March, the European Commission intervened on March 15 to ensure intra-EU trade. It also restricted exports of protective medical gear outside of the EU. At least 54 nations have imposed new export restrictions on medical supplies since the beginning of the year.1 Both European and Chinese measures will reduce supplies in the US, the top destination for most of these halted exports (Chart 6). Chart 6 Thus it is no wonder that the Trump administration has rushed to cut import duties and boost domestic production. The administration has released strategic stockpiles and cut tariffs on Chinese medical equipment used to treat COVID-19. With the whole nation mobilized, supply kinks should improve greatly in April. After a debacle in rolling out test kits (Chart 7), the US is rapidly increasing its testing capabilities to manage the crisis, with over a million tests completed as of the end of March (Chart 8). Meanwhile a coalition of companies is taking shape to make face masks. The president has invoked the defense production act to force companies to make ventilators. Chart 7 Chart 8 However, with the pandemic peaking in the US, the hardest-hit regions will continue experiencing shortages in the near term. Shortages are prompting public outcry against the US government for its failure to anticipate and redress supply chain vulnerabilities that were well known and warned against. A report in The New York Times tells how Mike Bowen, owner of Texas-based mask-maker Prestige Ameritech, has advised the past three presidents about the danger in the fact that the US imports 95% of its surgical masks. “Aside from sitting in front of the White House and lighting myself on fire, I feel like I’ve done everything I can,” he said. He is currently inundated with emergency orders from US hospitals. The same report tells of a company called Strong Manufacturers in North Carolina that had to cut production of masks because it depends on raw materials from Wuhan, China, where the virus originated.2 The Trump administration will suffer the initial public uproar, but the US government will also seek to reduce import dependency going forward, and it will likely deflect some of the blame by focusing on the supply risks posed by China. Beijing, for its part, is launching a propaganda campaign against the US to distract from its own failures at home (some officials have even blamed the US for the virus). Meanwhile it is cranking up production and shipping medical supplies to crisis hit areas like Italy to try to repair its global image after having given rise to the virus. In addition, the city of Shenzhen is sending 1.2 million N95 masks to the US on the New England Patriots’ team plane. Even Russia is sending small donations. But these moves work to propagandistic efforts in these countries and will ultimately shame the Americans into taking measures to improve self-sufficiency. Bottom Line: The most important supply shortage amid the global pandemic is that of medical equipment. While these shortages will abate sooner rather than later, the supply chain vulnerabilities they have exposed will trigger new policies of supply redundancy and import substitution. The US in particular will seek to reduce dependency on China. That COVID-19 is aggravating rather than reducing tensions between these states, despite China’s role as a key supplier in a time of need, highlights the secular nature of their rising tensions. The US-China Drug War Shortages of pharmaceuticals are also occurring, despite the fact that the primary pandemic response is necessarily “non-pharmaceutical” (e.g. social distancing). The US Food and Drug Administration (FDA) announced the first COVID-19 related drug shortage in the US on February 27. While the specific drug was not disclosed, the announcement notes that “the shortage is due to an issue with manufacturing of an active pharmaceutical ingredient used in the drug.”3 The FDA is monitoring 20 other (non-critical) drugs potentially at risk of shortages because the sole source is China. The global spread of the pandemic will increase these shortages. On March 3 India announced export restrictions on 26 drugs, including paracetamol and several antibiotics, due to supply disruptions caused by the Chinese shutdown. While Chinese economic activity has since picked up, India is now among the string of countries under a nationwide lockdown. Similar measures enforced across Europe will also hamper the production and transportation of these goods. The implication is that even if Chinese drugs return to market, supplies further down the chain and from alternative suppliers will take a hit. The risk that this will evolve into a drug shortage depends on the intensity of the outbreak. Drug companies generally hold 3-6 months’ worth of inventories. Consequently, while inventories are likely to draw as supplies are disrupted, consumers may not experience an outright shortage immediately. In the US, as with equipment and protective gear, the government’s strategic stockpile will buffer against shortfalls in supplies of critical drugs. COVID-19 is aggravating rather than reducing US-China tensions. Nevertheless the supply chain is getting caught up in the larger US-China strategic conflict. Even before the pandemic, the US-China trade war brought attention to the US’s vulnerabilities to China’s drug exports. This dispute is not limited to illicit drugs, as with China’s production of the opioid fentanyl, but also extends to mainstream medicines, as highlighted in the selection of public statements shown in Table 2. Chart Chart 9 How much does the US rely on China for medicine? According to FDA data, just over half of manufacturing facilities producing regulated drugs in finished dosage form for the US market are located abroad, with China’s share at 7% (Chart 9).4 The figures are higher for manufacturing facilities producing active pharmaceutical ingredients, though still not alarming – 72% of the facilities are located abroad, with 13% in China. Of course, high-level data understate China’s influence. The complex nature of global drug supply chains means that the source of finished dosage forms masks dependencies and dominance higher up the supply chain (Figure 1). Chart For instance, active pharmaceutical ingredients produced in Chinese facilities are used as intermediate goods by finished dosage facilities in India as well as China. The FDA reports that Indian finished dosage facilities rely on China for three-quarters of the active ingredients in their generic drug formulations, which are then exported to the US and the rest of the world. Any supply disruption in China – or any other major drug producer – will lead to shortages further down the supply chain. Chart 10 Chinese influence becomes more apparent when the sample is restricted to generic prescription drugs. These are especially relevant because nearly 70% of Americans are on at least one prescription drug, of which more than 90% are dispensed in the generic form. In this case, 87% of ingredient manufacturers and 60% of finished dosage manufacturers are located outside the US, with 17% of ingredient facilities and 8% of dosage facilities in China (Chart 10). Of all the facilities that manufacture active ingredients that are listed on the World Health Organization’s Essential Medicines List – a compilation of drugs that are considered critical to the health system – 71% are located aboard with 15% located in China (Chart 11). Moreover, manufacturers are relatively inflexible when adapting to market conditions and shortages. Drug manufacturing facilities generally operate at above 80% of their capacity and are thus left with little immediate capacity to ramp up production in reaction to shortages elsewhere. In addition, manufacturers face challenges in changing ingredient suppliers – there is no centralized source of information on them, and additional FDA approvals are required. The US will look to reduce its dependency on China for its drug supplies regardless of 2020 election outcome. China also has overwhelming dominance in specific categories. The Council on Foreign Relations reports that China makes up 97% of the US antibiotics market.5 Other common drugs that are highly dependent on China for supplies include ibuprofen, acetaminophen, hydrocortisone, penicillin, and heparin (Chart 12). Chart 11 Chart 12 Taking it all together, US vulnerability can be overstated. Consider the following: Of the 370 drugs on the Essential Medicines List that are marketed in the US, only three are produced solely in China. None of these three are used to treat top ten causes of death in the United States. Import substitution is uneconomical. Foreign companies, especially Chinese companies, are attractive due to their lower costs and lax regulations. While China’s influence extends higher up the supply chain, this is true for US markets as well as other consumer markets. While China can cut off the US from the finished dosages it supplies, it cannot do the same for the ingredients that are used by facilities in other countries and eventually make their way to the US in finished dosage form. Americans are demanding that drug prices be reduced and an obvious solution is looser controls on imports. The recent activation of the Defense Production Act shows that the US can take action to boost domestic production in emergencies. Nevertheless, China is growing conspicuous to the American public due to general trade tensions and COVID-19. As it moves up the value chain, it also threatens increasing competition for the US and its allies. Hence the US government will have a strategic reason to cap China’s influence that is also supported by corporate interests and popular opinion. This will lead to tense trade negotiations with China and meanwhile the US will seek alternative suppliers. China will not want to lose market share or leverage over the United States, so it may offer trade concessions at some point to keep the US engaged. Ultimately, however, strategic tensions will catalyze US policy moves to reduce the cost differential with China and promote its rivals. Pressure on China over its currency, regulatory standards, and scientific-technological acquisition will continue regardless of which party wins the White House in 2020. The Democrats would increase focus on China’s transparency and adherence to international standards, including labor and environmental standards. Both Republicans and Democrats will try to boost trade with allies. The key beneficiaries will be India, Southeast Asia, and the Americas. Taiwan’s importance will grow as a middle-man, but so will its vulnerability to strategic tensions. Bottom Line: The US and the rest of the world are suffering shortfalls of equipment necessary to combat COVID-19. There is also a risk of drug shortages stemming from supply disruptions and emergency protectionist policies. These shortages look to be manageable, but they have exposed national vulnerabilities that will be reduced in future via interventionist trade policies. While the US and Europe will ultimately manage the outbreak, the political fallout will be immense. The US will look to reduce its dependency on China. This will increase investment in non-China producers of active pharmaceutical ingredients, such as India and Mexico. The US tactics against China will vary according to the election result, but the strategic direction of diversifying away from China is clear and will have popular impetus in the wake of COVID-19. Food Security In addition to the challenges posed by COVID-19 on medical supplies, food – another essential good – also faces risk of shortages. China is a case in point. Food prices there were on the rise well before the COVID-19 outbreak, averaging 17.3% in the final quarter of 2019. However inflation was limited to pork and its substitutes – beef, lamb and poultry – and reflected a reduction in pork supplies on the back of the African Swine Flu outbreak. While year-on-year increases in the prices of pork and beef averaged 102.8% and 21.0%, respectively, grain, fresh vegetable, and fresh fruit prices averaged 0.6%, 1.5%, and -5.0% in Q42019 (Chart 13). Chart 13Chinese Inflation Has (Thus far) Been Contained To Pork Chinese Inflation Has (Thus far) Been Contained To Pork Chinese Inflation Has (Thus far) Been Contained To Pork Chart 14China's Misery Index Is Spiking - A Political Liability China's Misery Index Is Spiking - A Political Liability China's Misery Index Is Spiking - A Political Liability However China’s COVID-19 containment measures had a more broad-based impact on food supplies, threatening to push up China’s Misery Index (Chart 14). Travel restrictions, roadblocks, quarantined farm laborers, and risk-averse truck drivers introduced challenges not only in ensuring supplies were delivered to consumers, but also to daily farm activity and planting. The absence of farm inputs needed for planting such as seeds and fertilizer, and animal feed for livestock, was especially damaging in regions hardest hit by the pandemic. Livestock farmers already struggling with swine flu-related reductions in herd sizes were forced to prematurely cull starving animals, cutting the stock of chicken and hogs. Now as the country transitions out of its COVID-19 containment phase and moves toward normalizing activity (Chart 15), food security is top of the mind. Authorities are emphasizing the need to ensure sufficient food supplies and adopt policies to encourage production.6 This is especially important for crops due to be planted in the spring. Delayed or reduced plantings would weight on the quality and quantity of the crops, pushing prices up. Chart 15 With food estimated to account for 19.9% of China’s CPI basket – 12.8% of which goes towards pork (Chart 16) – a prolonged food shortage, or a full-blown food crisis, would be extremely damaging to Chinese families and their pocketbooks. Chart 16 However, apart from soybeans and to a lesser extent livestock, China’s inventories are well stocked (Chart 17) and are significantly higher than levels amid the 2006-2008 and 2010-2012 food crises. Inventories have been built up specifically to provide ammunition precisely in times of crisis. Corn and rice stocks are capable of covering consumption for nearly three quarters of a year, and wheat stocks exceeding a year’s worth of consumption. Thus, while not completely immune, China today is better able to weather a supply shock. Moreover, with the exception of soybeans, China is not overly dependent on imports for agricultural supplies (Chart 18). Chart 17   Chart 18 As the COVID-19 epicenter shifts to the US and Europe, farmers there are beginning to face the same challenges. Reports of delays in the arrival of shipments of inputs such as fertilizer and seeds have prompted American farmers to prepare for the worst and order these goods ahead of time. Chart 19 While these proactive measures will help reduce risks to supply, farmers in Europe and parts of the US who typically rely on migrant laborers will need to search for alternative laborers as the planting season nears. Just last week France’s agriculture minister asked hairdressers, waiters, florists, and others that find themselves unemployed to take up work in farms to ensure food security. As countries become increasingly aware of the risks to food supplies, some have already introduced protectionist measures, especially in the former Soviet Union: The Russian agriculture ministry proposed setting up a quota for Russian grain exports and has already announced that it is suspending exports of processed grains from March 20 for 10 days. Kazakhstan suspended exports of several agricultural goods including wheat flour and sugar until at least April 15. On March 27, Ukraine’s economy ministry announced that it was monitoring wheat export and would take measures necessary to ensure domestic supplies are adequate. Vietnam temporarily suspended rice contracts until March 28 as it checked if it had sufficient domestic supplies. The challenge is that, unlike China, inventories in the rest of the world are not any higher than during the previous food crisis and do not provide much of a buffer against supply shortfalls (Chart 19). Higher food prices would be especially painful to lower income countries where food makes up a larger share of household spending (Chart 20). In addition to using their strategic food stockpiles, governments will attempt to mitigate the impact of higher food prices by implementing a slew of policies: Chart 20 Trade policies: Producing countries will want to protect domestic supplies by restricting exports – either through complete bans or export quotas. Importing countries will attempt to reduce the burden of higher prices on consumers by cutting tariffs on the affected goods. Consumer-oriented policies: Importing countries will provide direct support to consumers in the form of food subsidies, social safety nets, tax reductions, and price controls. Producer-oriented policies: Governments will provide support to farmers to encourage greater production using measures such as input subsidies, producer price support, or tax exemptions on goods used in production. While these policies will help alleviate the pressure on consumers, they also result in greater government expenditures and lower revenues. Thus, subsidizing the import bill of a food price shock can weigh on public finances, debt levels, and FX reserves. Currencies already facing pressure due to the recessionary environment, such as Turkey, South Africa and Chile will come under even greater downward pressure. Food inventories ex-China are insufficient to protect against supply shortages. Bottom Line: COVID-19’s logistical disruptions are challenging farm output. This is especially true when transporting goods and individuals across borders rather than within countries. This will be especially challenging for food importing countries, as some producers have already started erecting protectionist measures and this will result in an added burden on government budgets that are already extended in efforts to contain the economic repercussions of the pandemic. Investment Implications Chart 21Ag Prices Inversely Correlated With USD Ag Prices Inversely Correlated With USD Ag Prices Inversely Correlated With USD China will continue trying to maximize its market share and move up the value chain in drug production. At the same time, the US is likely to diversify away from China and try to cap China’s market share. This will result in tense trade negotiations regardless of the outcome of the US election. The COVID-19 experience with medical shortages and newfound public awareness of potential medical supply chain vulnerabilities means that another round of the trade war is likely. Stay long USD-CNY. Regarding agriculture, demand for agricultural commodities is relatively inelastic. This inelasticity should prevent a complete collapse in prices even amid a weak demand environment. Thus given the risk on supplies, prices face upward pressure. However, not all crops are facing these same market dynamics. While wheat and rice prices have started to move in line with the dynamics described above, soybeans and to a greater extent corn prices have not reacted as such (Chart 21). In the case of soybeans, we expect demand to be relatively muted. China accounts for a third of the world’s soybean consumption. 80% of Chinese soybeans are crushed to produce meal to feed China’s massive pork industry. However, the 21% y/y decline in pork output in 2019 on the back of the African Swine Flu outbreak will weigh on demand and mute upward pressures on supplies. Demand for corn will also likely come in weak. The COVID-19 containment measures and the resulting halt in economic activity reduce demand for gasoline and, as a consequence, reduce demand for corn-based ethanol, which is blended with gasoline. In addition to the above fundamentals, ag prices have been weighed down by a strong USD which makes ex-US exporters relatively better off, incentivizing them to raise exports and increase global supplies. A weaker USD – which we do not see in the near term – would help support ag prices. It is worth noting that if there is broad enforcement of protectionist measures, then producers will not be able to benefit from a stronger dollar. In that case we may witness a breakdown in the relationship between ag prices and the dollar. In light of these supply/demand dynamics, we expect rice and wheat prices to be well supported going forward and to outperform corn and soybeans.   Roukaya Ibrahim Editor/Strategist Geopolitical Strategy RoukayaI@bcaresearch.com   Matt Gertken Vice President Geopolitical Strategist mattg@bcaresearch.com   Footnotes 1 See "Tackling COVID-19 Together: The Trade Policy Dimension," Global Trade Alert, University of St. Gallen, Switzerland, March 23, 2020. 2 See Rachel Abrams et al, "Governments and Companies Race to Make Masks Vital to Virus Fight," The New York Times, March 21, 2020. 3 The announcement also notes that there are other alternatives that can be used by patients. See "Coronavirus (COVID-19) Supply Chain Update," US FDA, February 27, 2020. 4 All regulated drugs include prescription (brand and generic), over the counter, and compounded drugs. 5 Please see Huang, Yanzhong, "The Coronavirus Outbreak Could Disrupt The US Drug Supply," Council on Foreign Relations, March 5, 2020. 6 The central government ordered local authorities to allow animal feed to pass through checkpoints amid the lockdowns. In addition, Beijing has relaxed import restrictions by lifting a ban on US poultry products and announcing that importers could apply for waivers on goods tariffed during the trade war such as pork and soybeans. The lifting of these restrictions also serves to help China meet its phase one trade deal commitments. Please see "Coronavirus hits China’s farms and food supply chain, with further spike in meat prices ahead," South China Morning Post, dated February 21, 2020.
Highlights Given that rising crop yields have been the main vehicle through which global supply of agricultural commodities grew to meet expanding demand, the risks posed to yields due to climate change are non-trivial. The impact of climate change will manifest itself in the form of two simultaneous trends: the gradual rise in temperatures alongside more frequent and severe weather events. While the latter will threaten immediate supply, the former is a slower moving process, and its net negative impact is unlikely to manifest before 2030. The implications of climate change on agriculture producers are non-uniform. Low-latitude countries with economies that are highly dependent on the agriculture sector will suffer most. Expect greater volatility in agriculture prices as the frequency of weather events will raise uncertainty. Feature The steady expansion of global population and rising per-capita calorie consumption has directly translated to growing demand for agricultural products of all types. However, these demand-side pressures increasingly will be met with disruptions to global supply of agricultural commodities, as the impact of climate change raises uncertainty. In any given year, the aggregate decisions of farmers all over the world – i.e., the choice of which crops to plant and how much acreage to dedicate to each crop – determine the supply and market prices of ags. In this competitive market, each farmer attempts to maximize his or her welfare by planting the crops that are expected to yield the greatest profit. Chart 12010/11 Shock Highlights Ag Vulnerability To Weather 2010/11 Shock Highlights Ag Vulnerability To Weather 2010/11 Shock Highlights Ag Vulnerability To Weather The collective action of these producers in reaction to perceived demand generally leads to stable prices, especially for staple commodities such as grains and oilseeds, which differ from industrial commodities in that they are not highly correlated with global business cycles. Demand trends are long-term and slow moving, and typically do not result in abrupt price pressures, as farmers have time to adjust and adapt to changing consumer preferences. Unforeseen, weather-induced supply-side shocks, therefore, are the main source of sudden price changes in ag markets. Such a shock was dramatically on display during the drought-induced crop failures in major grain and cereal producing regions in the most recent global food crisis of 2010/11. While this massive supply shock was not the first of its kind (Chart 1, on page 1), it highlighted the vulnerability of ag markets to weather risks and specifically the evolving environment under climate change. A 2019 study quantifies the impact of shifting weather patterns on the agricultural market, finding that year-to-year changes in climate factors during the growing season explain 20%-49% of change in corn, rice, soybean, and wheat yields, with climate extremes accounting for 18%-43% of this variation.1 In theory, the impact can manifest in several ways, sometimes contradictory: Extreme weather events: An increase in the frequency and intensity of droughts or floods which threaten to wipe out crops or reduce yields, creating unpredictable supply shocks. The gradual rise in temperature: Each crop has cardinal temperatures – defined by the minimum, maximum and optimum – that determine its boundaries for growth. Increases in temperatures induced by global warming may push the boundary, reducing yields in some regions. Changes in precipitation patterns: In many areas precipitation is projected to increase – both in short bursts and over longer periods. This will lead to greater soil erosion resulting in deterioration in the quality of soil. In other regions, precipitation will decrease, and drought is expected to become more frequent.2 Moreover, the interaction of these factors – along with other region-specific variables – will amplify the impact on crops: Rising temperatures and greater precipitation will result in greater amounts of water in the atmosphere, producing increased water vapor and greater cloud cover. This will reduce solar radiation, and will harm crop productivity. Elevated atmospheric carbon dioxide and CO2 fertilization: Greater CO2 concentrations brought on by continued growth in air pollution are positive for crops as they stimulate photosynthesis and plant growth. However, the impact differs across crops with plants such as soybeans, rice and wheat set to benefit relatively more than plants such as corn.3 Moreover, elevated atmospheric CO2 levels can help crops respond to environmental stresses and reduce yield losses due to ozone and crop water loss through partial stomatal closure and a reduction in ozone penetration into leaves. Temperature changes and the magnitude and intensity of precipitation impact soil moisture and surface runoff. Indirect effects of climate change – weeds, pests and pathogens – also present challenges as they require changes to management practices and may raise farming costs required. The impact of climate change on agriculture markets is already evident in increasing intensity and frequency of extreme weather events. The confluence of these factors, and the region- and crop-specific nature of these variables, makes it impossible to estimate the impact of evolving climate conditions on ag products with great accuracy. Nevertheless, our research suggests that the impact of climate change on ag markets will create opportunities in this evolving and highly uncertain market. Abrupt Shocks Amid Gradual Warming: The Long And Short View The impact of climate change on agriculture markets is already evident in the increasing intensity and frequency of extreme-weather events such as heatwaves, floods, and droughts. Charts 2A, 2B, and 2C, illustrate the impact of major weather events in crop-producing regions of the U.S. on yields, production and acreage for the crop year in which the events took place. Chart 2AExtreme Weather Events Reduce U.S. Corn Supplies … Extreme Weather Events Reduce U.S. Corn Supplies Extreme Weather Events Reduce U.S. Corn Supplies Chart 2B… Soybean Supplies … Extreme Weather Events Reduce U.S. Soybean Supplies Extreme Weather Events Reduce U.S. Soybean Supplies Chart 2C… And Wheat Supplies In A Big Way Extreme Weather Events Reduce U.S. Wheat Supplies In A Big Way Extreme Weather Events Reduce U.S. Wheat Supplies In A Big Way Chart 3Climate-Induced U.S. Supply Shocks Associated With Price Spikes Climate-Induced U.S. Supply Shocks Associated With Price Spikes Climate-Induced U.S. Supply Shocks Associated With Price Spikes   While the individual losses are a function of the magnitude of the event, the events highlighted translate to a 16%, 10%, and 7% decline in corn, soybean, and wheat yields, respectively. These supply disruptions generally do not extend beyond the event year, as the new crop year offers farmers a clean slate to raise output and maximize profits. Given that the U.S. is a major global supplier of these crops, extreme weather events and the subsequent supply reductions lead to non-negligible price pressures (Chart 3). While crop conditions thus far have failed to deteriorate in trend (Chart 4), greater frequency and intensity of weather events raise the probability of a decline in overall crop and could lower supply.   Chart 4Crop Conditions Have Generally Held Up Climate Change Special Series: An Introduction Climate Change Special Series: An Introduction Expanding the analysis to other major crop-producing regions of the world, we find that once again, extreme-weather events are associated with a decline in yields and production in the corresponding crop year (Chart 5). This exercise also indicates that the impact of droughts is significantly more pronounced than the impact of floods.4 While the weather-induced supply shocks described above are unpredictable, abrupt, and have an immediate impact on output and prices, the gradual warming of temperatures is a slow-moving process. Consequently, the impact will manifest in the form of gradual changes that are difficult to capture and quantify, especially given the mitigating effect of CO2 fertilization – i.e., higher yields resulting from higher CO2 in the atmosphere. Nonetheless, rising temperatures will become a serious risk in crop-planting regions both in the U.S. and globally (Chart 6). While rising temperatures are expected to bring about increasingly more wide-ranging supply disruptions (Chart 7), the net impact over the coming decade is not a clear negative. Chart 5Weather Events, Especially Droughts, Hurt Global Supplies Climate Change Special Series: An Introduction Climate Change Special Series: An Introduction Chart 6Rising Global Temperatures Will Pose A Serious Risk … Climate Change Special Series: An Introduction Climate Change Special Series: An Introduction Chart 7… Especially Above The 2°C Mark Climate Change Special Series: An Introduction Climate Change Special Series: An Introduction One study expects the positive impact of CO2 fertilization on yields to overwhelm the negative effect of rising temperatures over the coming decade (Table 1). Elsewhere, studies forecast different responses, with some predicting incremental yield gains over the coming decade before temperatures rise to levels that overwhelm the benefits of greater CO2. Similarly, according to the FAO’s assessment, the net negative impact of climate change on global crop yields will only become apparent with a high degree of certainty post-2030.5 Table 1Estimates For The Response Of Global Average Crop Yields To Warming And CO2 Changes Over The Next Decades Climate Change Special Series: An Introduction Climate Change Special Series: An Introduction Bottom Line: Given that rising crop yields have been the main vehicle through which global ag supply grew to meet expanding demand, the risks posed to yields due to climate change are non-trivial. Supply disruptions generally do not extend beyond the event year, as the new crop year offers farmers a clean slate to raise output and maximize profits. The impact will manifest itself in the form of two simultaneous trends: the gradual rise in temperatures alongside more frequent and severe weather events. While the latter will threaten immediate supply, the former is a slower moving process, and its net negative impact is unlikely to manifest before 2030. The Winners … And Losers Rising temperatures are expected to result in a negligible impact on ag markets over the coming decade; yet this finding is not uniform across all regions. The FAO study cited above finds that by 2030, the projected impact on crop yields will be slightly net negative in developing countries. However, in developed countries, the effect will be net positive. In terms of global supply, the impact of climate change over the coming decade is expected to remain relatively contained, affecting certain regions at various times without causing major global disruptions. That said, as global warming and extreme weather persist, the ramifications will begin to extend beyond individual regions, and will cause supply shocks on a global scale. In part, this can be explained by a greater potential for net reductions in crop yields in warmer, low-latitude areas and semi-arid regions of the world.6 This non-uniform impact will create relative winners and losers. Producers located in temperate regions – where climate change does not yet pose as serious a threat – are set to profit from their increased role in global supply. Conversely, tropical regions are much more vulnerable to climate change. This is especially true for those whose economies are highly dependent on agriculture (Chart 8). Chart 8Agricultural Economies In Tropical Regions Are Most Vulnerable Climate Change Special Series: An Introduction Climate Change Special Series: An Introduction On net, the overall economies of DM countries – which generally are not economically dependent on agriculture and are located in northern regions – will be relatively more insulated from the impact of climate change on the agriculture sector. Aside from the impact on producers, the implications on consumers are also region-dependent. Clearly the direct impact of climate change on global agriculture will be higher food prices, which directly impacts the food component of inflation generally. As a result, consumers who spend a large share of their income to food – generally consumers in lower income countries – will be hardest hit (Chart 9). Chart 9Higher Food Prices Disproportionately Hurt Consumers In Lower Income Countries Climate Change Special Series: An Introduction Climate Change Special Series: An Introduction In theory, a food supply shock is transitory, and given that food is usually excluded from core inflation gauges targeted by central banks, monetary policy should not react to these price spikes. All the same, aside from this direct impact on inflation, food inflation can also pass-through into other components of the CPI basket, for example through wage pressures or inflation expectations. This would lead to a more persistent impact on core inflation, forcing policy makers to react to these transitory forces, complicating the monetary policy response function for these countries. Given that inflation expectations are less well-anchored in lower income economies and that food makes up a larger share of consumption expenditures in these economies, they are most vulnerable to weather-induced food shocks. Chart 10Subsidies Partially Insulate Against International Shocks Climate Change Special Series: An Introduction Climate Change Special Series: An Introduction In countries where food prices are highly subsidized, the impact of higher global food prices will not immediately translate to higher domestic prices. This explains why there is no one-to-one relationship between global food prices and domestic food prices (Chart 10). Instead, the higher prices are absorbed by the governments, resulting in an expansion in government expenditures. This distorts the local food market, as it prevents demand from adjusting to the higher prices, and could potentially result in an undershoot in inventories that makes global markets even more vulnerable to further supply shocks. Bottom Line: The implications of climate change on ag producers are non-uniform. While higher-latitude regions are set to benefit, at least in the short-run, low-latitude countries with economies that are highly dependent on the agriculture sector will suffer most. On the consumer side, individuals who spend a large share of their income on food are set to suffer most. While consumers in countries that subsidize the crops will be protected from the immediate inflation risk, they may feel a delayed impact due to an increase in budget expenditures needed to cover the larger import bill. Mitigation Efforts While the potential impact of climate change on the agriculture sector can be large, it will be at least partially managed through adoption of mitigation policies (Diagram 1). Diagram 1Adaptation Reduces Vulnerability Climate Change Special Series: An Introduction Climate Change Special Series: An Introduction A key question in determining the extent of this behavior is whether warming temperatures and the increased occurrence and intensity of extreme events will be sufficient to justify a major acceleration of investment in agriculture. These efforts would range from simple management changes on the part of farmers to technological advances that raise the productivity of farming or reduce the vulnerability of farmers to climate change. For example, farmers across the U.S. have been planting corn and soybeans earlier in the spring, resulting in an advancement in planting dates (Chart 11). The earlier planting has also been accompanied by a longer growing season with the average number of days in the season increasing. Farmers are also adapting by altering their decisions on which crops to plant. For example, since soybean and corn are planted in many of the same regions of the U.S., farmers often plant more soybeans than corn when experiencing weather shocks. Chart 11Weather Events, Especially Droughts, Hurt Global Supplies Climate Change Special Series: An Introduction Climate Change Special Series: An Introduction The agriculture sector is also using more efficient machinery that can plant and harvest crops much faster as well as developing heartier seeds and more potent fertilizers. In turn, farmers will alter their decision making by selecting crop varieties or species that are more resistant to heat and drought. Or they will change fertilizer rates, amounts and timing of irrigation, along with other water-management techniques. Farmers also are making wider use of integrated pest and pathogen management techniques, in order to raise the effectiveness of pest, disease, and weed control. Given that the number of firms in the agriculture sector are fewer in developed markets than in the rest of the world, management decisions can be more easily implemented in the former. Farmers across the U.S. have been planting corn and soybeans earlier in the spring, resulting in an advancement in planting dates. On the other hand, emerging market countries where ag output is driven by numerous individual farmers will have a more difficult time implementing policies. Individual farms may not have the means to support themselves, which raises the potential impact of climate change. What is more, climate-change mitigation efforts may require projects, programs, or funds set aside by the government to support these efforts. This is more likely to occur in wealthier developed countries. Bottom Line: Adaptation and mitigation measures on the part of farmers have the potential to reduce the impact of climate change. That said, farmers in richer countries with the funds and institutions in place to support the ag sector likely will fare better. Investment Implications Over the coming decade, the ramifications of climate change are likely to be contained to a regional level. Although global supply will be vulnerable to regional disruptions, the impact will, in part, be mitigated by inventories, which have been rising for years. These stocks will create a buffer against unpredictable supply shocks (Chart 12). Chart 12Higher Inventories Needed To Buffer Against Unpredictable Shocks Climate Change Special Series: An Introduction Climate Change Special Series: An Introduction However, given that the global soybean market resembles an oligopoly with Brazil, the U.S., and Argentina accounting for 81% of global supply, global soybean prices will be more vulnerable to supply events in these regions than other crops (Chart 13). Chart 13Soybeans Most Vulnerable To Shocks Affecting Major Producers Climate Change Special Series: An Introduction Climate Change Special Series: An Introduction At the other end of the spectrum, global wheat markets will be relatively more insulated from isolated weather events impacting any one major producer as each of these regions contributes a relatively small share to global wheat output. This analysis also finds that yields and supply generally recover in the crop year following an extreme climate event. This implies that while the extent of damage from these events can be severe, they are not persistent unless the increasing frequency of extreme events leads to a secular change. Aside from the price impact, the weather and temperature changes will manifest in the form of greater volatility in supply, translating to greater price volatility. Options-implied volatilities for corn, wheat and soybeans have been on a general downtrend since the two major global food scares in 2007/08 and 2010/11 (Chart 14). We expect the trend to reverse going forward as the frequency of weather events will create greater price uncertainty. We summarize the findings of this report in Table 3 (Appendix, on page 16). Chart 14Volatility Will Go Up Climate Change Special Series: An Introduction Climate Change Special Series: An Introduction Roukaya Ibrahim Editor/Strategist RoukayaI@bcaresearch.com Jeremie Peloso Research Analyst JeremieP@bcaresearch.com Amr Hanafy Research Associate AmrH@bcaresearch.com Hugo Bélanger Senior Analyst HugoB@bcaresearch.com Isabelle Dimyadi Research Associate Isabelled@bcaresearch.com Appendix Table 2Extreme Weather Events In The U.S. Climate Change Special Series: An Introduction Climate Change Special Series: An Introduction Table 3Summary Table Climate Change Special Series: An Introduction Climate Change Special Series: An Introduction Footnotes 1 Please see Vogel et al, The effects of climate extremes on global agricultural yields, Environ. Res. Lett 14 054010, 2019. 2 As a consequence of greenhouse gas emissions precipitation is expected to increase in high altitude regions such as much of the U.S. and decrease in subtropical regions such as the southwest U.S., Central America, southern Africa, and the Mediterranean basin. 3 Plants can be broken down into either C3 or C4 based on the way they assimilate atmospheric CO2 into different physiological components. While rising CO2 causes C3 plants to raise the rate of photosynthesis and reduce the respiration rate, C4 plants do not experience a rise in photosynthesis since  photosynthesis is already saturated. For example, studies show that soybean yields increased 12%-15% under 550 ppm vs. 370 ppm CO2 concentrations while corn experienced negligible yield increases. 4 Please see Lesk C., P. Rowhani, and N. Ramankutty, Influence of extreme weather disasters on global crop production, Nature, 529(7584), 84-87, 2016. 5 Please see The State Of Food And Agriculture: Climate Change, Agriculture, And Food Security, Food and Agriculture Organization of the United Nations, 2016. 6 Please see Stevanovic et al., The impact of high-end climate change on agricultural welfare, Sci-Adv 2(8), 2016.
The steady expansion of global population and rising per-capita calorie consumption has directly translated to growing demand for agricultural products of all types. However, these demand-side pressures increasingly will be met with disruptions to global supply of agricultural commodities, as the impact of climate change raises uncertainty. In any given year, the aggregate decisions of farmers all over the world – i.e., the choice of which crops to plant and how much acreage to dedicate to each crop – determine the supply and market prices of ags. In this competitive market, each farmer attempts to maximize his or her welfare by planting the crops that are expected to yield the greatest profit. The collective action of these producers in reaction to perceived demand generally leads to stable prices, especially for staple commodities such as grains and oilseeds, which differ from industrial commodities in that they are not highly correlated with global business cycles. Demand trends are long-term and slow moving, and typically do not result in abrupt price pressures, as farmers have time to adjust and adapt to changing consumer preferences. Unforeseen, weather-induced supply-side shocks, therefore, are the main source of sudden price changes in ag markets. Such a shock was dramatically on display during the drought-induced crop failures in major grain and cereal producing regions in the most recent global food crisis of 2010/11. While this massive supply shock was not the first of its kind (Chart 1), it highlighted the vulnerability of ag markets to weather risks and specifically the evolving environment under climate change. A 2019 study quantifies the impact of shifting weather patterns on the agricultural market, finding that year-to-year changes in climate factors during the growing season explain 20%-49% of change in corn, rice, soybean, and wheat yields, with climate extremes accounting for 18%-43% of this variation.1 In theory, the impact can manifest in several ways, sometimes contradictory: Chart 12010/11 Shock Highlights Ag Vulnerability To Weather 2010/11 Shock Highlights Ag Vulnerability To Weather 2010/11 Shock Highlights Ag Vulnerability To Weather Extreme weather events: An increase in the frequency and intensity of droughts or floods which threaten to wipe out crops or reduce yields, creating unpredictable supply shocks. The gradual rise in temperature: Each crop has cardinal temperatures – defined by the minimum, maximum and optimum – that determine its boundaries for growth. Increases in temperatures induced by global warming may push the boundary, reducing yields in some regions. Changes in precipitation patterns: In many areas precipitation is projected to increase – both in short bursts and over longer periods. This will lead to greater soil erosion resulting in deterioration in the quality of soil. In other regions, precipitation will decrease, and drought is expected to become more frequent.2 Moreover, the interaction of these factors – along with other region-specific variables – will amplify the impact on crops: Rising temperatures and greater precipitation will result in greater amounts of water in the atmosphere, producing increased water vapor and greater cloud cover. This will reduce solar radiation, and will harm crop productivity. Elevated atmospheric carbon dioxide and CO2 fertilization: Greater CO2 concentrations brought on by continued growth in air pollution are positive for crops as they stimulate photosynthesis and plant growth. However, the impact differs across crops with plants such as soybeans, rice and wheat set to benefit relatively more than plants such as corn.3 Moreover, elevated atmospheric CO2 levels can help crops respond to environmental stresses and reduce yield losses due to ozone and crop water loss through partial stomatal closure and a reduction in ozone penetration into leaves. Temperature changes and the magnitude and intensity of precipitation impact soil moisture and surface runoff. Indirect effects of climate change – weeds, pests and pathogens – also present challenges as they require changes to management practices and may raise farming costs required. The confluence of these factors, and the region- and crop-specific nature of these variables, makes it impossible to estimate the impact of evolving climate conditions on ag products with great accuracy. Nevertheless, our research suggests that the impact of climate change on ag markets will create opportunities in this evolving and highly uncertain market. Abrupt Shocks Amid Gradual Warming: The Long And Short View The impact of climate change on agriculture markets is already evident in increasing intensity and frequency of extreme-weather events. The impact of climate change on agriculture markets is already evident in the increasing intensity and frequency of extreme-weather events such as heatwaves, floods, and droughts. Charts 2A, 2B, and 2C, illustrate the impact of major weather events in crop-producing regions of the U.S. on yields, production and acreage for the crop year in which the events took place. While the individual losses are a function of the magnitude of the event, the events highlighted translate to a 16%, 10%, and 7% decline in corn, soybean, and wheat yields, respectively. These supply disruptions generally do not extend beyond the event year, as the new crop year offers farmers a clean slate to raise output and maximize profits. Chart 2AExtreme Weather Events Reduce U.S. Corn Supplies Extreme Weather Events Reduce U.S. Corn Supplies Extreme Weather Events Reduce U.S. Corn Supplies Chart 2BExtreme Weather Events Reduce U.S. Soybean Supplies Extreme Weather Events Reduce U.S. Soybean Supplies Extreme Weather Events Reduce U.S. Soybean Supplies Chart 2CExtreme Weather Events Reduce U.S. Wheat Supplies In A Big Way Extreme Weather Events Reduce U.S. Wheat Supplies In A Big Way Extreme Weather Events Reduce U.S. Wheat Supplies In A Big Way Chart 3Climate-Induced U.S. Supply Shocks Associated With Price Spikes Climate-Induced U.S. Supply Shocks Associated With Price Spikes Climate-Induced U.S. Supply Shocks Associated With Price Spikes Given that the U.S. is a major global supplier of these crops, extreme weather events and the subsequent supply reductions lead to non-negligible price pressures (Chart 3). While crop conditions thus far have failed to deteriorate in trend (Chart 4), greater frequency and intensity of weather events raise the probability of a decline in overall crop and could lower supply. Chart 4Crop Conditions Have Generally Held Up Agriculture In The Age Of Climate Change Agriculture In The Age Of Climate Change Expanding the analysis to other major crop-producing regions of the world, we find that once again, extreme-weather events are associated with a decline in yields and production in the corresponding crop year (Chart 5). This exercise also indicates that the impact of droughts is significantly more pronounced than the impact of floods.4 The net impact of rising temperatures over the coming decade is not a clear negative. While the weather-induced supply shocks described above are unpredictable, abrupt, and have an immediate impact on output and prices, the gradual warming of temperatures is a slow-moving process. Consequently, the impact will manifest in the form of gradual changes that are difficult to capture and quantify, especially given the mitigating effect of CO2 fertilization – i.e., higher yields resulting from higher CO2 in the atmosphere. Nonetheless, rising temperatures will become a serious risk in crop-planting regions both in the U.S. and globally (Chart 6). While rising temperatures are expected to bring about increasingly more wide-ranging supply disruptions (Chart 7), the net impact over the coming decade is not a clear negative. Chart 5Weather Events, Especially Droughts, Hurt Global Supplies Agriculture In The Age Of Climate Change Agriculture In The Age Of Climate Change Chart 6Rising Global Temperatures Will Pose A Serious Risk … Agriculture In The Age Of Climate Change Agriculture In The Age Of Climate Change   One study expects the positive impact of CO2 fertilization on yields to overwhelm the negative effect of rising temperatures over the coming decade (Table 1). Elsewhere, studies forecast different responses, with some predicting incremental yield gains over the coming decade before temperatures rise to levels that overwhelm the benefits of greater CO2. Similarly, according to the FAO’s assessment, the net negative impact of climate change on global crop yields will only become apparent with a high degree of certainty post-2030.5 Chart 7… Especially Above The 2 ℃ Mark Agriculture In The Age Of Climate Change Agriculture In The Age Of Climate Change Table 1Estimates For The Response Of Global Average Crop Yields To Warming And CO2 Changes Over The Next Decades Agriculture In The Age Of Climate Change Agriculture In The Age Of Climate Change Bottom Line: Given that rising crop yields have been the main vehicle through which global ag supply grew to meet expanding demand, the risks posed to yields due to climate change are non-trivial. The impact will manifest itself in the form of two simultaneous trends: the gradual rise in temperatures alongside more frequent and severe weather events. While the latter will threaten immediate supply, the former is a slower moving process, and its net negative impact is unlikely to manifest before 2030. The Winners … And Losers Rising temperatures are expected to result in a negligible impact on ag markets over the coming decade; yet this finding is not uniform across all regions. The FAO study cited above finds that by 2030, the projected impact on crop yields will be slightly net negative in developing countries. However, in developed countries, the effect will be net positive. In terms of global supply, the impact of climate change over the coming decade is expected to remain relatively contained, affecting certain regions at various times without causing major global disruptions. That said, as global warming and extreme weather persist, the ramifications will begin to extend beyond individual regions, and will cause supply shocks on a global scale. In part, this can be explained by a greater potential for net reductions in crop yields in warmer, low-latitude areas and semi-arid regions of the world.6 This non-uniform impact will create relative winners and losers. Producers located in temperate regions – where climate change does not yet pose as serious a threat – are set to profit from their increased role in global supply. Conversely, tropical regions are much more vulnerable to climate change. This is especially true for those whose economies are highly dependent on agriculture (Chart 8). Chart 8Agricultural Economies In Tropical Regions Are Most Vulnerable Agriculture In The Age Of Climate Change Agriculture In The Age Of Climate Change On net, the overall economies of DM countries – which generally are not economically dependent on agriculture and are located in northern regions – will be relatively more insulated from the impact of climate change on the agriculture sector. Aside from the impact on producers, the implications on consumers are also region-dependent. Clearly the direct impact of climate change on global agriculture will be higher food prices, which directly impacts the food component of inflation generally. As a result, consumers who spend a large share of their income to food – generally consumers in lower income countries – will be hardest hit (Chart 9). Chart 9Higher Food Prices Disproportionately Hurt Consumers In Lower Income Countries Agriculture In The Age Of Climate Change Agriculture In The Age Of Climate Change In theory, a food supply shock is transitory, and given that food is usually excluded from core inflation gauges targeted by central banks, monetary policy should not react to these price spikes. All the same, aside from this direct impact on inflation, food inflation can also pass-through into other components of the CPI basket, for example through wage pressures or inflation expectations. This would lead to a more persistent impact on core inflation, forcing policy makers to react to these transitory forces, complicating the monetary policy response function for these countries. Given that inflation expectations are less well-anchored in lower income economies and that food makes up a larger share of consumption expenditures in these economies, they are most vulnerable to weather-induced food shocks. Individuals who spend a large share of their income on food are set to suffer most. In countries where food prices are highly subsidized, the impact of higher global food prices will not immediately translate to higher domestic prices. This explains why there is no one-to-one relationship between global food prices and domestic food prices (Chart 10). Instead, the higher prices are absorbed by the governments, resulting in an expansion in government expenditures. This distorts the local food market, as it prevents demand from adjusting to the higher prices, and could potentially result in an undershoot in inventories that makes global markets even more vulnerable to further supply shocks Chart 10Subsidies Partially Insulate Against International Shocks Agriculture In The Age Of Climate Change Agriculture In The Age Of Climate Change Bottom Line: The implications of climate change on ag producers are non-uniform. While higher-latitude regions are set to benefit, at least in the short-run, low-latitude countries with economies that are highly dependent on the agriculture sector will suffer most. On the consumer side, individuals who spend a large share of their income on food are set to suffer most. While consumers in countries that subsidize the crops will be protected from the immediate inflation risk, they may feel a delayed impact due to an increase in budget expenditures needed to cover the larger import bill. Mitigation Efforts While the potential impact of climate change on the agriculture sector can be large, it will be at least partially managed through adoption of mitigation policies (Diagram 1). Diagram 1Adaptation Reduces Vulnerability Agriculture In The Age Of Climate Change Agriculture In The Age Of Climate Change A key question in determining the extent of this behavior is whether warming temperatures and the increased occurrence and intensity of extreme events will be sufficient to justify a major acceleration of investment in agriculture. These efforts would range from simple management changes on the part of farmers to technological advances that raise the productivity of farming or reduce the vulnerability of farmers to climate change. For example, farmers across the U.S. have been planting corn and soybeans earlier in the spring, resulting in an advancement in planting dates (Chart 11). The earlier planting has also been accompanied by a longer growing season with the average number of days in the season increasing. Farmers are also adapting by altering their decisions on which crops to plant. For example, since soybean and corn are planted in many of the same regions of the U.S., farmers often plant more soybeans than corn when experiencing weather shocks. Chart 11Farmers Are Planting Earlier In The Season Agriculture In The Age Of Climate Change Agriculture In The Age Of Climate Change The agriculture sector is also using more efficient machinery that can plant and harvest crops much faster as well as developing heartier seeds and more potent fertilizers. In turn, farmers will alter their decision making by selecting crop varieties or species that are more resistant to heat and drought. Or they will change fertilizer rates, amounts and timing of irrigation, along with other water-management techniques. Farmers also are making wider use of integrated pest and pathogen management techniques, in order to raise the effectiveness of pest, disease, and weed control. Given that the number of firms in the agriculture sector are fewer in developed markets than in the rest of the world, management decisions can be more easily implemented in the former. On the other hand, emerging market countries where ag output is driven by numerous individual farmers will have a more difficult time implementing policies. Individual farms may not have the means to support themselves, which raises the potential impact of climate change. What is more, climate-change mitigation efforts may require projects, programs, or funds set aside by the government to support these efforts. This is more likely to occur in wealthier developed countries. Bottom Line: Adaptation and mitigation measures on the part of farmers have the potential to reduce the impact of climate change. That said, farmers in richer countries with the funds and institutions in place to support the ag sector likely will fare better. Investment Implications Over the coming decade, the ramifications of climate change are likely to be contained to a regional level. Although global supply will be vulnerable to regional disruptions, the impact will, in part, be mitigated by inventories, which have been rising for years. These stocks will create a buffer against unpredictable supply shocks (Chart 12). Chart 12Higher Inventories Needed To Buffer Against Unpredictable Shocks Agriculture In The Age Of Climate Change Agriculture In The Age Of Climate Change However, given that the global soybean market resembles an oligopoly with Brazil, the U.S., and Argentina accounting for 81% of global supply, global soybean prices will be more vulnerable to supply events in these regions than other crops (Chart 13). At the other end of the spectrum, global wheat markets will be relatively more insulated from isolated weather events impacting any one major producer as each of these regions contributes a relatively small share to global wheat output. This analysis also finds that yields and supply generally recover in the crop year following an extreme climate event. This implies that while the extent of damage from these events can be severe, they are not persistent unless the increasing frequency of extreme events leads to a secular change. Aside from the price impact, the weather and temperature changes will manifest in the form of greater volatility in supply, translating to greater price volatility. Options-implied volatilities for corn, wheat and soybeans have been on a general downtrend since the two major global food scares in 2007/08 and 2010/11 (Chart 14). We expect the trend to reverse going forward as the frequency of weather events will create greater price uncertainty. Chart 13Soybeans Most Vulnerable To Shocks Affecting Major Producers Agriculture In The Age Of Climate Change Agriculture In The Age Of Climate Change   Chart 14Volatility Will Go Up Agriculture In The Age Of Climate Change Agriculture In The Age Of Climate Change   Roukaya Ibrahim, Editor/Strategist Commodity & Energy Strategy RoukayaI@bcaresearch.com Jeremie Peloso, Research Analyst U.S. Bond Strategy JeremieP@bcaresearch.com Hugo Bélanger, Senior Analyst Commodity & Energy Strategy HugoB@bcaresearch.com Amr Hanafy, Research Associate Global Asset Allocation AmrH@bcaresearch.com Isabelle Dimyadi, Research Associate Isabelled@bcaresearch.com     Appendix Table 2Extreme Weather Events In The U.S. Agriculture In The Age Of Climate Change Agriculture In The Age Of Climate Change   Footnotes 1      Please see Vogel et al, The effects of climate extremes on global agricultural yields, Environ. Res. Lett 14 054010, 2019. 2      As a consequence of greenhouse gas emissions precipitation is expected to increase in high altitude regions such as much of the U.S. and decrease in subtropical regions such as the southwest U.S., Central America, southern Africa, and the Mediterranean basin. 3           Plants can be broken down into either C3 or C4 based on the way they assimilate atmospheric CO2 into different physiological components. While rising CO2 causes C3 plants to raise the rate of photosynthesis and reduce the respiration rate, C4 plants do not experience a rise in photosynthesis since photosynthesis is already saturated. For example, studies show that soybean yields increased 12%-15% under 550 ppm vs. 370 ppm CO2 concentrations while corn experienced negligible yield increases. 4      Please see Lesk C., P. Rowhani, and N. Ramankutty, Influence of extreme weather disasters on global crop production, Nature, 529(7584), 84-87, 2016. 5      Please see The State Of Food And Agriculture: Climate Change, Agriculture, And Food Security, Food and Agriculture Organization of the United Nations, 2016. 6      Please see Stevanovic et al., The impact of high-end climate change on agricultural welfare, Sci-Adv 2(8), 2016.

Related Topics