Steel
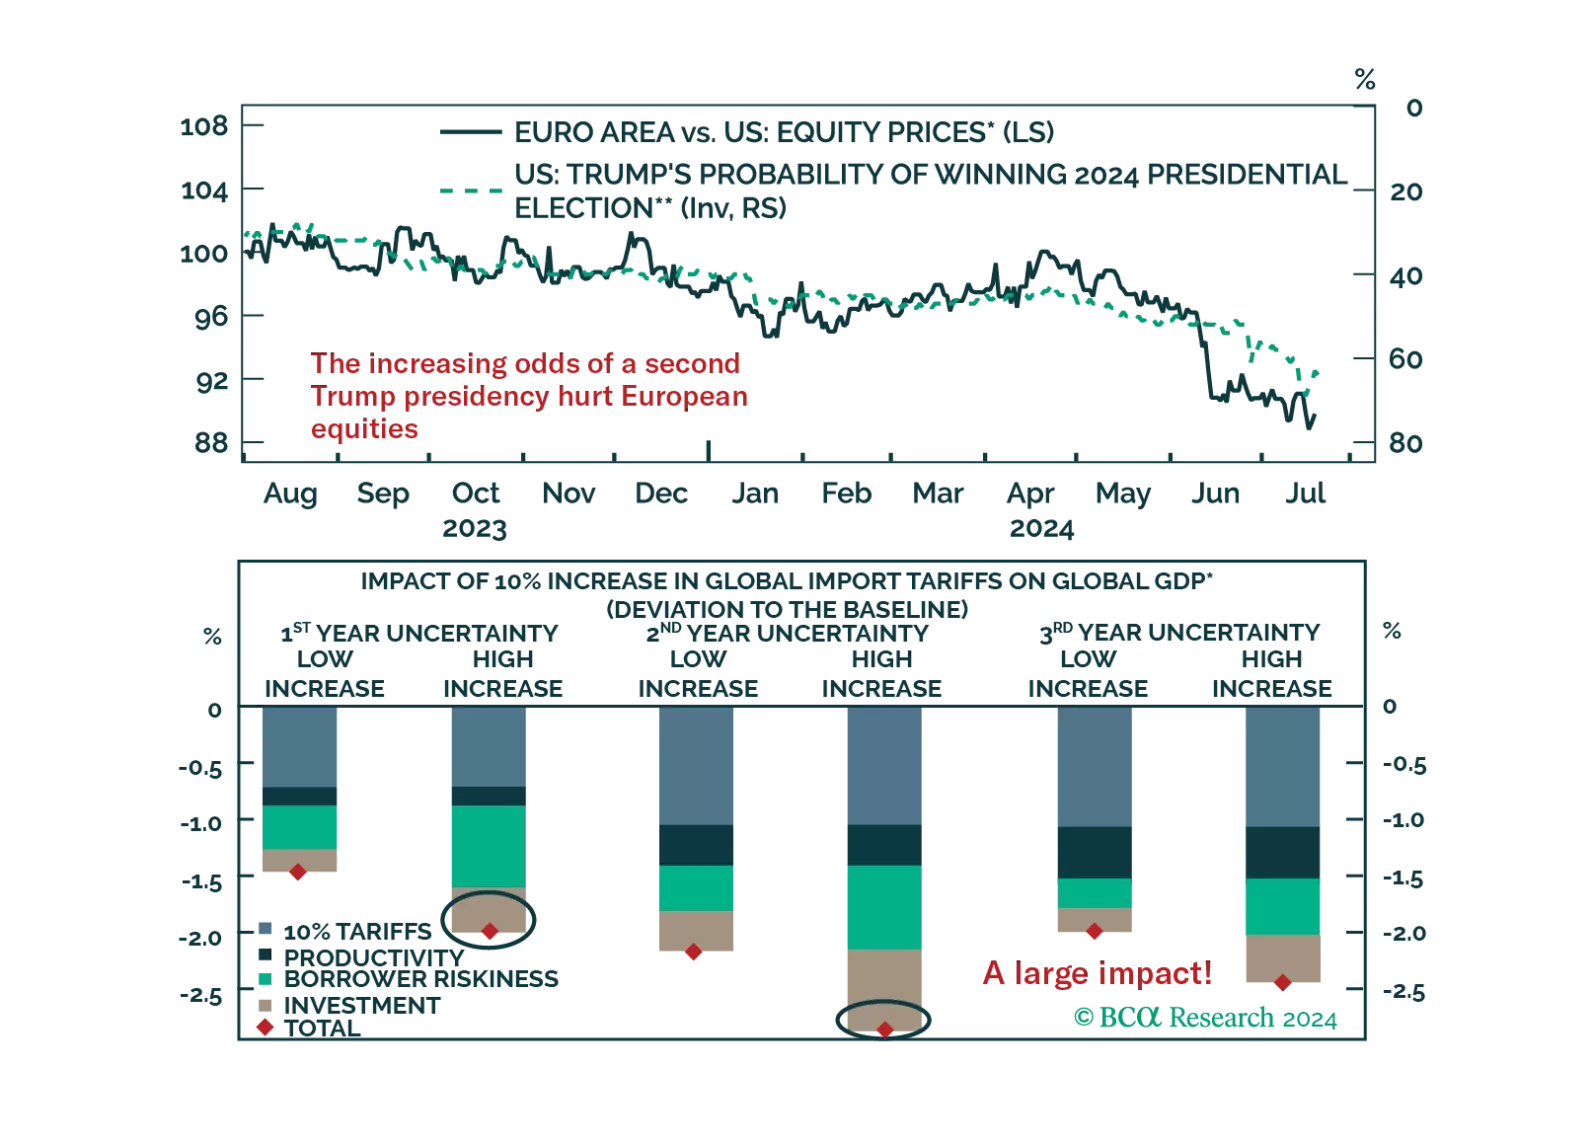
As Trump’s victory odds rise, the underperformance of European equities deepens. How negative would a global trade war be for European assets?

Over the past few months a schism has emerged in the industrial metals complex. On the one hand, the Bloomberg Industrial Metals Index – which is composed of futures contracts on copper, aluminum, zinc, nickel, and lead – has been gyrating in a trading range…

Highlights Over the short term – 1-2 years – the pick-up in re-infection rates in Asia and LatAm states with large-scale deployments of Sinopharm and Sinovac COVID-19 vaccines will re-focus attention on demand-side risks to the global recovery (Chart of the Week). The UAE-Saudi impasse re extending the return of additional volumes of OPEC 2.0 spare capacity to the oil market over 2H21 will be short-lived. The UAE's official baseline production will be increased to 3.8mm b/d from 3.2mm b/d presently, and its output in 2H21 will be adjusted accordingly. Over the medium term – 3-5 years out – the risk to the expansion of metal supplies needed for renewables and electric vehicles (EVs) will rise, as left-of-center governments increase taxes and royalties, and carbon prices move higher. Rising metals costs will redound to the benefit of oil and gas producers, and accelerate R+D in carbon- and GHG-reduction technologies. Longer-term – 5-10 years out – the active discouragement of investment in hydrocarbons will contribute to energy shortages. In anticipation of continued upside volatility in commodity prices and share values of oil, gas and metals producers, we remain long the S&P GSCI and COMT ETF, and long equities of producers and traders via the PICK ETF. Feature Our conversations with clients almost invariably leads us to considering the risks to our long-standing bullish views for energy and metals. This week, we reprise some of the highlights of these conversations. In the short term, our bullish call on oil is underpinned by the assumption of continued expansion in vaccinations, which we believe will lead to global economic re-opening and increased mobility, as the world emerges from the devastation of COVID-19. This expectation is once again under scrutiny. On the supply side, the very public negotiations undertaken by the UAE and the leaders of OPEC 2.0 – the Kingdom of Saudi Arabia (KSA) and Russia – over re-basing the UAE's production reminds investors there is substantial spare capacity from the coalition available for the market over the short term. The slow news cycle going into the US Independence Day holiday certainly was a fortuitous time to make such a point. Chart of the WeekWorrisome Uptick Of COVID-19 Cases KSA-UAE Supply-Side Worries The abrupt end to this week's OPEC 2.0 meeting was unsettling to markets. Shortly after the meeting ended – without being concluded – officials from the Biden administration in the US spoke with officials from KSA and the UAE, presumably to encourage resolution of outstanding issues and to get more oil into the market to keep crude oil prices below $80/bbl (Chart 2). We're confident the KSA-UAE impasse re extending the return of additional volumes of spare capacity to the oil market over 2H21 will be short-lived. The UAE's official baseline production number (i.e., its October 2018 output level) will be increased to 3.8mm b/d from 3.2mm b/d presently, and its output in 2H21 will be adjusted accordingly. Coupled with a likely return of Iranian export volumes in 4Q21, this will bring prices down into the mid- to high-$60/bbl range we are forecasting. Chart 2US Pushing For Resolution of KSA-UAE Spat Longer term, markets are worried this incident is a harbinger of a breakdown in OPEC 2.0's so-far-successful production-management strategy, which has lifted oil prices 200% since their March 2020 nadir. At present, the producer coalition has ~ 6-7mm b/d of spare capacity, which resulted from its strategy to keep the level of supply below demand. A breakdown in this discipline – in extremis, another price war of the sort seen in March 2020 or from 2014-2016 – could plunge oil markets into a price collapse that re-visits sub-$40/bbl levels. In our view, economics – specifically the cold economic reality of the price elasticity of supply – continues to work for the OPEC 2.0 coalition: Higher revenues are realized by members of the group as long as relatively small production cuts produce larger revenue gains – e.g., a 5% (or less) cut in production that produces a 20% (or more) increase in price trumps a 20% increase in production that reduces prices by 50%. Besides, none of the members of the coalition possess the wherewithal to endure another shock-and-awe display from KSA similar to the one following the breakdown of the March 2020 OPEC 2.0 meeting. We also continue to expect US shale-oil producers to be disciplined by capital markets, and to retain a focus on providing competitive returns to their shareholders, which will limit supply growth to that which maintains profitability. Until we see actual evidence of a breakdown in the coalition's willingness to maintain its production-management strategy, we will continue to assume it remains operative. Worrisome COVID-19 Re-Infection Trends Reports of increased re-infection rates in Latin American and Asia-Pacific states providing Chinese Sinopharm and Sinovac COVID-19 vaccines will re-focus attention on demand-side risks to the global recovery. Conclusive data on the efficacy of these vaccines is not available at present, based on reporting from Health Policy Watch (HPW).1 The vast majority of these vaccines were purchased in Latin America and the Asia-Pacific region, where ~ 80% of the 759mm doses of the two Chinese vaccines were sold, according to HPW's reporting. This will draw the attention of markets to this risk (Chart 3). Of particular concern are the increases in re-infection rates in the Seychelles and Chile, where the majority of populations in both countries were inoculated with one of the Chinese vaccines. Re-infections in Indonesia also are drawing attention, where more than 350 healthcare workers were re-infected after receiving the Sinovac vaccination.2 The risk of renewed global lockdowns remains small, but if these experiences are repeated globally with adverse health consequences, this assessment could be challenged. Chart 3COVID-19 Returning In High-Vaccination States Transition Risks To A Low-Carbon Economy Over the medium- to long-terms, our metals views are premised on the expectation the build-out of the global EV fleet and renewable electricity generation – including its supporting grids – will require massive increases in the supply of copper, aluminum, nickel, and tin, not to mention iron ore and steel. This surge in demand will be occurring as governments rush headlong into unplanned and unsynchronized wind-downs of investment in the hydrocarbon fuels that power modern economies.3 The big risk here is new metal supplies will not be delivered fast enough to build all of the renewable generation, EVs and their supporting grids and infrastructures to cover the loss of hydrocarbons phased out by policy, legal and boardroom challenges. Such a turn of events would re-invigorate oil and gas production. Renewable energy and electric vehicles are the sine qua non of the drive to achieve net-zero carbon emissions by 2050. However, the rising price of base metals will add to already high costs of rebuilding power grids to make them suitable for green energy. Given miners’ reluctance to invest in new mines, we do not expect metals prices to drop anytime soon. According to Wood Mackenzie, in 2019 the cost of shifting just the US power grid to renewable energy over the next 10 years will amount to $4.5 trillion.4 Given these cost and supply barriers, fossil fuels will need to be used for longer than the IEA outlined in its recent and controversial report on transitioning to a net-zero economy.5 To ensure that fossil fuels can be used while countries work to achieve their net zero goals, carbon capture utilization and storage (CCUS) technology will need to be developed and made cheaper. The main barrier to entry for CCUS technology is its high cost (Chart 4). However, like renewable energy, the more it is deployed and invested in, the cheaper it will become, following the trend seen in the development of renewable energy and EVs, which were aided by large-scale subsidies from governments to encourage the development of the technology. These cost reductions are already visible: In its 2019 report, the Global CCS Institute noted the cost of implementing CCS technology initially used in 2014 had fallen by 35% three years later. Chart 4CCUS Can Be Expensive Metals Mines' Long Lead Times In 2020 the total amount of discovered copper reserves in the world stood at ~ 870mm MT (Chart 5), according to the US Geological Service (USGS). As of 2017, the total identified and undiscovered amount of reserves was ~ 5.6 billion MT.6 The World Bank recently estimated additional demand for copper would amount to ~ 20mm MT p.a. by 2050 (Chart 6).7 Glencore’s recently retired CEO Ivan Glasenberg last month said that by 2050, miners will need to produce around 60mm MT p.a. of copper to keep up with demand for countries’ net zero initiatives.8 Even with this higher estimate, if miners focus on exploration and can tap into undiscovered reserves, supply will cover demand for the renewable energy buildout. Chart 5Copper Reserves Are Abundant Chart 6Call On Base Metals Supply Will Be Massive Out To 2050 While recent legislative developments in Chile and Peru, which together constitute ~ 34% of total discovered copper reserves, could lead to significantly higher costs as left-of-center governments re-write these states' constitutions, geological factors would not be the main constraint to copper supply for the renewables energy buildout: Even if copper mining companies were to move out of these two countries, there still is about 570 million MT in discovered copper reserves, and nearly ten times that amount in undiscovered reserves. As we have written in the past, capital expenditure restraint is the principal reason the supply side of copper markets – and base metals generally – is challenged (Chart 7). Unlike in the previous commodity boom, this time mining companies are focusing on providing returns to shareholders, instead of funding the development of new mines (Chart 8). Chart 7Copper Prices Remains Parsimonious Chart 8Shareholder Interests Predominate Metals Agendas Of course, it is likely metals miners, like oil producers, are waiting to see actual demand for copper and other base metals pick up before ramping capex. Sharp increases in forecasted demand is not compelling for miners, at this point. This means metals prices could stay elevated for an extended period, given the 10-15-year lead times for copper mines (Chart 9). For example, the Kamoa-Kakula mine in the Democratic Republic of Congo (DRC) now being brought on line took roughly 24 years of exploration and development work, before it started producing copper. Technological breakthroughs that increase brownfield projects’ productivity, or significant increases in the amount of recycled copper as a percent of total copper supply would address some of the price pressures arising from the long lead times associated with the development of new copper supply. Another scenario with a non-trivial probability that threatens the viability of metals investing is a breakthrough – or breakthroughs – in CCUS technology, which allows oil and gas producers to remove enough carbon from their fuels to allow firms using these fuels to achieve their net-zero carbon goals. Chart 9Long Lead Times For Mine Development Investment Implications Short-term supply-demand issues affecting the oil market at present are transitory, and do not signal a shift in the fundamentals supporting our bullish call on oil. Our thesis based on continued production discipline remains intact. That said, we will continue to subject it to rigorous scrutiny on a continual basis. Our average Brent forecast for 2021 remains $66.50/bbl, with 2H21 prices averaging $70/bbl. For 2022 and 2023 we continue to expect prices to average $74 and $81/bbl, respectively (Chart 10). WTI will trade $2-$3/bbl lower. Our metals view has become slightly more nuanced, thanks to our client conversations. One of the unintended consequences of the unplanned and uncoordinated rush to a net-zero carbon future will be an improvement in the competitive position of oil and gas as transportation fuels and electric-generation fuels going forward. This will be driven by rising costs of developing and delivering the metals supplies needed to effect the net-zero transition. We expect markets will provide incentives to CCUS technologies and efforts to decarbonize oil and gas fuels, which will contribute to the global effort to arrest rising temperatures. This suggests the rush to sell these assets – which is underway at present – could be premature.9 In the extreme, this could be a true counterbalance to the metals story, if it plays out. Chart 10Our Oil Price View Remains Intact Robert P. Ryan Chief Commodity & Energy Strategist rryan@bcaresearch.com Ashwin Shyam Research Associate Commodity & Energy Strategy ashwin.shyam@bcaresearch.com Commodities Round-Up Energy: Bullish The monthly OPEC 2.0 meeting ended without any action to increase monthly supplies, following the UAE's bid to increase its baseline reference production – determined based on October 2018 production levels – to 3.8mm b/d, up from 3.2mm b/d. S&P Global Platts reported the UAE's Energy Minister, Suhail al-Mazrouei, advanced a proposal to raise its monthly production level under the coalition's overall output deal, while KSA's energy minister, Prince Abdulaziz bin Salman, insisted the UAE follow OPEC 2.0 procedures in seeking an output increase. We do not expect this issue to become a protracted standoff between these states. The disagreement between the ministers is procedural to substantive. Remarks by bin Salman last month – to wit, KSA has a role in containing inflation globally – and his earlier assertions that production policy of OPEC 2.0 would be driven by actual oil demand, as opposed to forecasted oil demand, suggest the Kingdom is not aiming for higher oil prices per se. Base Metals: Bullish Spot benchmark iron ore (62 Fe) prices traded above $222/MT this week in China on the back of stronger steel demand, according to mining.com (Chart 11). Market participants are anticipating further steel-production restrictions and appear to be trying to get out in front of them. Precious Metals: Bullish The USD rally eased this week, allowing gold prices to stabilize following the June Federal Open Market Committee (FOMC) meeting. In the two weeks since the FOMC, our gold composite indicator shows that gold started entering oversold territory (Chart 12). We believe gold prices will start correcting upwards, expecting investor bargain-hunting to pick up after the price drop. The mixed US jobs report, which showed the unemployment rate ticked up more than expected, implies that interest rates are not going to be raised soon. Our colleagues at BCA Research's US Bond Strategy (USBS) expect rates to increase only by end-2022.10 This, along with slightly higher odds of a potential COVID-19 resurgence, will support gold prices in the near-term. Ags/Softs: Neutral The USDA's Crop Progress report for the week ended 4 July 2021 showed 64% of the US corn crop was in good to excellent condition, down from the 71% reported for the comparable 2020 date. The Department reported 59% of the bean crop was in good to excellent shape vs 71% the year earlier. Chart 11 Chart 12 Footnotes 1 Please see Are Chinese COVID Vaccines Underperforming? A Dearth of Real-Life Studies Leaves Unanswered Questions, published by Health Policy Watch, June 18, 2021. 2 According to HPW, the World Health Organization's Emergency Use Listing for these two vaccines "were unique in that unlike the Pfizer, AstraZeneca, Moderna, and Jonhson & Johonson vaccines that it had also approved, neither had undergone review and approval by a strict national or regional regulatory authority such as the US Food and Drug Administration or the European Medicines Agency. Nor have Phase 3 results of the Sinopharm and Sinovac trials been published in a peer-reviewed medical journal. More to the point, post-approval, any large-scale tracking of the efficacy of the Sinovac and Sinopharm vaccine rollouts by WHO or national authorities seems to be missing." 3 Please see A Perfect Energy Storm On The Way, which we published on June 3, 2021 for additional discussion. It is available at ces.bcaresearch.com. 4 Please refer to The Price of a Fully Renewable US Grid: $4.5 Trillion, published by greentechmedia 28 June 2019. 5 Please refer to the IEA's Net Zero By 2050, published in May 2021. 6 Please refer to USGS Mineral Commodity Summaries, 2021. 7 Please refer to Minerals for Climate Action: The Mineral Intensity of the Clean Energy Transition, published by the World Bank. 8 Please refer to Copper supply needs to double by 2050, Glencore CEO says, published by reuters.com on June 22, 2021. 9 Please see the FT's excellent coverage of this trend in A $140bn asset sale: the investors cashing in on Big Oil’s push to net zero published on July 6, 2021. 10 Please refer to Watch Employment, Not Inflation, published by the USBS on June 15, 2021. Investment Views and Themes Strategic Recommendations Tactical Trades Commodity Prices and Plays Reference Table Trades Closed in 2021 Summary of Closed Trades
Highlights US labor-market disappointments notwithstanding, the global recovery being propelled by real GDP growth in the world's major economies is on track to be the strongest in 80 years. This growth will fuel commodity demand, which increasingly confronts tighter supply. Higher commodity prices will ensue, and feed through to realized and expected inflation. Manufacturers will continue to see higher input and output prices. Our modeling suggests the USD will weaken to end-2023; however, most of the move already has occurred. Real US rates will remain subdued, as the Fed looks through PCE inflation rates above its 2% target and continues to focus on its full-employment mandate (Chart of the Week). Given these supportive inflation fundamentals, we remain long gold with a price target of $2,000/oz for this year. We are upgrading silver to a strategic position, expecting a $30/oz price by year-end. We remain long the S&P GSCI Dynamic Roll Index ETF (COMT) and the S&P GSCI, expecting tight supply-demand balances to steepen backwardations in forward curves, and long the Global Metals & Mining Producers ETF (PICK). Global economic policy uncertainty will remain elevated until broader vaccine distributions reduce lockdown risks. Feature The recovery of the global economy catalyzed by massive monetary accommodation and fiscal stimulus is on track to be the strongest in the past 80 years, according to the World Bank.1 The Bank revised its growth expectation for real GDP this year sharply higher – to 5.6% from its January estimate of 4.1%. For 2022, the rate of global real GDP growth is expected to slow to 4.3%, which is still significantly higher than the average 3% growth of 2018-19. DM economies are expected to grow at a 4% rate this year – double the average 2018-19 rate – while EM growth is expected to come in at 6% this year vs a 4.2% average for 2018-19. The big drivers of growth this year will be China, where the Bank expects an unleashing of pent-up demand to push real GDP up by 8.5%, and the US, where massive fiscal and monetary support will lift real GDP 6.8%. The Bank expects other DM economies will contribute to this growth, as well. Growth in EM economies will be supported by stronger demand and higher commodity prices, in the Bank's forecast. Commodity demand is recovering faster than commodity supply in the wake of this big-economy GDP recovery. As a result, manufacturers globally are seeing significant increases in input and output prices (Chart 2). Chart of the WeekUS Real Rates Continue To Languish Chart 2Global Manufacturers' Prices Moving Higher These price increases at the manufacturing level reflect the higher-price environment in global commodity markets, particularly in industrial commodities – i.e., bulks like iron ore and steel; base metals like copper and aluminum; and oil prices, which touch most processes involved in getting materials out of the ground and into factories before they make their way to consumers, who then drive to stores to pick up goods or have them delivered. Chart 3Commodity Price Increases Reflected in CPI Inflation Expectations These price pressures are being picked up in 5y5y CPI swaps markets, which are cointegrated with commodity prices (Chart 3). This also is showing up in shorter-tenor inflation gauges – monthly CPI and 2y CPI swaps. Oil prices, in particular, will be critical to the evolution of 5-year/5-year (5y5y) CPI swap rates, which are closely followed by fixed-income markets (Chart 4). Chart 4Oil Prices Are Key To 5Y5Y CPI Swap Rates Higher Gold Prices Expected CPI inflation expectations drive 5-year and 10-year real rates, which are important explanatory variables for gold prices (Chart 5).2 In addition, the massive monetary and fiscal policy out of the US also is driving expectations for a lower USD: Currency debasement fears are higher than they otherwise would be, given all the liquidity and stimulus sloshing around global markets, which also is bullish for gold (Chart 6). Chart 5Weaker Real Rates Bullish For Gold Chart 6Weaker USD Supports Gold All of these effects, particularly the inflationary impacts, are summarized in our fair-value gold model (Chart 7). At the beginning of 2021, our fair-value gold model indicated price would be closer to $2,005/oz, which was well above the actual gold price in January. Gold prices have remained below the fair value model since the beginning of 2021. The model explains gold prices using real rates, TWIB, US CPI and global economic policy uncertainty. Based on our modeling, we expect these variables to continue to be supportive of gold, bolstering our view the yellow metal will reach $2000/ oz this year. Unlike industrial commodities, gold prices are sensitive to speculative positioning and technical indicators. Our gold composite indicator shows that gold prices may be reflecting bullish sentiment. This sentiment likely reflects increasing inflation expectations, which we use as an explanatory variable for gold prices. The fact that gold is moving higher on sentiment is corroborated by the latest data point from Marketvane’s gold bullish consensus, which reported 72% of the traders expect prices to rise further (Chart 8). Chart 7BCAs Gold Fair-Value Model Supports 00/oz View Chart 8Sentiment Supports Oil Prices Investment Implications The massive monetary and fiscal stimulus that saw the global economy through the worst of the economic devastation of the COVID-19 pandemic is now bubbling through the real economy, and will, if the World Bank's assessment proves out, result in the strongest real GDP growth in 80 years. Liquidity remains abundant and interest rates – real and nominal – remain low. In its latest Global Economic Prospects, the Bank notes, " The literature generally suggests that monetary easing, both conventional and unconventional, typically boosts aggregate demand and inflation with a lag of 1-3 years …" The evidence for this is stronger for DM economies than EM; however, as the experience in China shows, scale matters. If the Bank's assessment is correct, the inflationary impulse from this stimulus should be apparent now – and it is – and will endure for another year or two. This stimulus has catalyzed organic growth and will continue to do so for years, particularly in economies pouring massive resources into renewable-energy generation and the infrastructure required to support it, a topic we have been writing about for some time.3 We remain long gold with a price target of $2,000/oz for this year. We are long silver on a tactical basis, but given our growth expectations, are upgrading this to a strategic position, expecting a $30/oz price by year-end. As we have noted in the past, silver is sensitive to all of the financial factors we consider when assessing gold markets, and it has a strong industrial component that accounts for more than half of its demand.4 Supportive fundamentals remain in place, with total supply (mine output and recycling) falling, demand rising and balances tightening (Chart 9). Worth noting is silver's supply is constrained because of underinvestment in copper production at the mine level, where silver is a by-product. On the demand side, continued recovery of industrial and consumer demand will keep silver prices well supported. In terms of broad commodity exposure, we remain long the S&P GSCI Dynamic Roll Index ETF (COMT) and the S&P GSCI, expecting tight supply-demand balances to continue to draw down inventories – particularly in energy and metals markets – which will lead to steeper backwardations in forward curves. Backwardation is the source of roll-yields for long commodity index investments. Investors initially have a long exposure in deferred commodity futures contracts, which are then liquidated and re-established when these contracts become more prompt (i.e., closer to delivery). If the futures' forward curves are backwardated, investors essentially are buying the deferred contracts at a lower price than the price at which the position likely is liquidated. We also remain long the Global Metals & Mining Producers ETF (PICK), an equity vehicle that spans miners and traders; the longer discounting horizon of equity markets suits our view on metals. Chart 9Upgrading Silver To Strategic Position Chart 10Wider Vaccine Distribution Will Support Gold Demand Global economic policy uncertainty will remain elevated until broader vaccine distributions reduce lockdown risks. We expect the wider distribution of vaccines will become increasingly apparent during 2H21 and in 2022. This will be bullish for physical gold demand – particularly in China and India – which will add support for our gold position (Chart 10). Robert P. Ryan Chief Commodity & Energy Strategist rryan@bcaresearch.com Ashwin Shyam Research Associate Commodity & Energy Strategy ashwin.shyam@bcaresearch.com Commodities Round-Up Energy: Bullish The US EIA expects Brent crude oil prices to fall to $60/bbl next year, given its call higher production from OPEC 2.0 and the US shales will outpace demand growth. The EIA expects global oil demand will average just under 98mm this year, or 5.4mm b/d above 2020 levels. For next year, the EIA is forecasting demand will grow 3.6mm b/d, averaging 101.3mm b/d. This is slightly less than the demand growth we expect next year – 101.65mm b/d. We are expecting 2022 Brent prices to average $73/bbl, and $78/bbl in 2023. We will be updating our oil balances and price forecasts in next week's publication. Base Metals: Bullish Pedro Castillo, the socialist candidate in Peru's presidential election, held on to a razor-thin lead in balloting as we went to press. Markets have been focused on the outcome of this election, as Castillo has campaigned on increasing taxes and royalties for mining companies operating in Peru, which accounts for ~10% of global copper production. The election results are likely to be contested by opposition candidate rival Keiko Fujimori, who has made unsubstantiated claims of fraud, according to reuters.com. Copper prices traded on either side of $4.50/lb on the CME/COMEX market as the election drama was unfolding (Chart 11). Precious Metals: Bullish As economies around the world reopen and growth rebounds, car manufacturing will revive. Stricter emissions regulations mean the demand for autocatalysts – hence platinum and palladium – will rise with the recovery in automobile production. Platinum is also used in the production of green hydrogen, making it an important metal for the shift to renewable energy. On the supply side, most platinum shafts in South Africa are back to pre-COVID-19 levels, according to Johnson Matthey, the metals refiner. As a result, supply from the world’s largest platinum producer will rebound by 40%, resulting in a surplus. South Africa accounts for ~ 70% of global platinum supply. The fact that an overwhelming majority of platinum comes from a nation which has had periodic electricity outages – the most recent one occurring a little more than a week ago – could pose a supply-side risk to this metal. This could introduce upside volatility to prices (Chart 12). Ags/Softs: Neutral As of 6 June, 90% of the US corn crop had emerged vs a five-year average of 82%; 72% of the crop was reported to be in good to excellent condition vs 75% at this time last year. Chart 11 Chart 12 Footnotes 1 Please see World Bank's Global Economic Prospects update, published June 8, 2021. 2 In fact, US Treasury Inflation-Indexed securities include the CPI-U as a factor in yield determination. 3 For our latest installment of this epic evolution, please see A Perfect Energy Storm On The Way, which we published last week. It is available at ces.bcareserch.com. 4 Please see Higher Inflation Expectations Battle Lower Risk Premia In Gold Markets, which we published February 4, 2021. It is available at ces.bcareserch.com. Investment Views and Themes Strategic Recommendations Tactical Trades Commodity Prices and Plays Reference Table Trades Closed in 2021 Summary of Closed Trades
Highlights Political and corporate climate activism will increase the cost of developing the resources required to produce and deliver energy going forward – e.g., oil and gas wells; pipelines; copper mines, and refineries. Over the short run, the fastest way for investor-owned companies (IOCs) to address accelerated reductions in CO2 emissions imposed by courts and boards is to walk away from the assets producing them, which could be disruptive over the medium term. Longer term, state-owned companies (SOCs) not facing the constraints of IOCs likely will be required to provide an increasing share of the resources needed to produce and distribute energy. The real difficulty will come in the medium term. Capex for critical metals like copper languishes, just as the call on these metals steadily increases over the next 30 years (Chart of the Week). The evolution to a low-carbon future has not been thought through at the global policy level. A real strategy must address underinvestment in base metals and incentivize the development of technology via a carbon tax – not emissions trading schemes – so firms can innovate to avoid it. We remain long energy and metals exposures.1 Feature And you may ask yourself, "Well … how did I get here?" David Byrne, Once In A Lifetime Energy markets – broadly defined – are radically transforming from week to week. The latest iteration of these markets' evolution is catalyzed by climate activists, who are finding increasing success in court and on corporate boards – sometimes backed by major institutional investors – and forcing oil and gas producers to accelerate CO2 emission-reduction programs.2 Climate activists' arguments are finding increasing purchase because they have merit: Years of stiff-arming investors seeking clarity on the oil and gas producers' decarbonization agendas, coupled with a pronounced failure to provide returns in excess of their cost of capital, have given activists all of the ammo needed to argue their points. Chart of the WeekCall On Metals For Energy Will Increase This activism is not limited to the courts or boardrooms. Voters in democratic societies with contested elections also are seeking redress for failures of their governments to effectively channel mineral wealth back into society on an equitable basis, and to protect their environments and the habitats of indigenous populations. This voter activism is especially apparent in Chile and Peru, where elections and constitutional conventions likely will result in higher taxes and royalties on metals IOCs operating in these states, which will increase production costs and ultimately be passed on to consumers.3 These states account for ~ 40% of world copper output. IOCs Walk Away Earlier this week, Exxon walked away from an early-stage offshore oil development project in Ghana.4 This followed the unfavorable court rulings and boardroom setbacks experienced by Royal Dutch Shell, Chevron and Exxon recently (referenced in fn. 2). While the company had no comment on its abrupt departure, its action shows how IOCs can exercise their option to put a project back to its host government, thus illustrating one of the most readily available alternatives for energy IOCs to meet court- or board-mandated CO2 emissions targets. If these investments qualify as write-offs, the burden will be borne by taxpayers. As climate activism increases, state-owned companies (SOCs) not facing the constraints of IOCs likely will be required to provide an increasing share of the resources – particularly oil and gas – needed to produce and distribute energy going forward. This is not an unalloyed benefit, as the SOCs still face stranded-asset risks, if they invest in longer-lived assets that are obviated by a successful renewables + grid buildout globally. That is a cost that will have to be compensated, when the SOCs work up their capex allocations. Still, if legal and investor activism significantly accelerates IOCs' capex reductions in oil and gas projects, the SOCs – particularly those in OPEC 2.0 – will be able to expand their position as the dominant supplier in the global oil market, and could perhaps increase their influence on price levels and forward-curve dynamics (Chart 2).5 Chart 2OPEC 2.0s Could Expand If Investor Activism Increases Higher Call On Metals At present, there is a lot of talk about the need to invest in renewable electricity generation and the grid structure supporting it, but very little in the way of planning for this transition. Other than repeated assertions of its necessity, little is being said regarding how exactly this strategy will be executed given the magnitude of the supply increase in metals required. Nowhere is this more apparent than in the refined copper market, which has been in a physical deficit – i.e., production minus consumption is negative – for the last 6 years (Chart 3). Physical copper markets in China, which consumes more than 50% of refined output, remain extremely tight, as can be seen in the ongoing weakness of treating charges and refining charges (TC/RC) for the past year (Chart 4). These charges are inversely correlated to prices – when TC/RCs are low, it means there is surplus refining capacity for copper – unrefined metal is scarce, which drives down demand for these services. Chart 3Coppers Physical Deficit Likely Persist Chart 4Chinas Refined Copper Supply Remains TightTheoretically, high prices will incentivize higher levels of production. However, after the last decade’s ill-timed investment in new mine discoveries and expansions, mining companies have become more wary with their investments, and are using earnings to pay dividends and reduce debt. This leads us to believe that mining companies will not invest in new mine discoveries but will use capital expenditure to expand brownfield projects to meet rising demand. In the last decade, as copper demand rose, capex for copper rose from 2010-2012, and fell from 2013-2016 (Chart 5). During this time, the copper ore grade was on a declining trend. This implies that the new copper brought online was being mined from lower-grade ore, due to the expansion of existing projects(Chart 6). Chart 5Copper Capex Growth Remains Weak Chart 6Copper Ore-Quality Declines Persist Through Capex Cycle Capex directed at keeping ore production above consumption will not be sufficient to avoid major depletions of ore supplies beginning in 2024, according to Wood Mackenzie. The consultancy foresees a cumulative deficit of ~ 16mm MT by 2040. Plugging this gap will require $325-$500 billion of investment in the copper mining sector.6 The Case For A Carbon Tax The low-carbon future remains something of a will-o'-the-wisp – seen off in the future but not really developed in the present. Most striking in discussions of the low-carbon transition is the assumption of resource availability – particularly bases metals –in, e.g., the IEA's Net Zero by 2050, A Roadmap for the Global Energy Sector, published last month. In the IEA's document, further investment in hydrocarbons is not required beyond 2025. The copper, aluminum, steel, etc., required to build the generation and supporting grid infrastructure will be available and callable as needed to build all the renewable generation the world requires. The document is agnostic between carbon trading and carbon taxes as a way to price carbon and incentivize the technology that would allow firms and households to avoid a direct cost on carbon. A real strategy must address the fact that most of the world will continue to rely on fossil fuels for decades, as development goals are pursued. Underinvestment in base metals and its implications for the buildout of generation and grids has to be a priority if these assets are to be built. Given the 5-10-year lead times base metals mines require to come online, it is obvious that beyond the middle of this decade, the physical reality of demand exceeding supply will assert itself. A good start would be a global effort to impose and collect carbon taxes uniformly across states.7 This would need to be augmented with a carbon club, which restricts admission and trading privileges to those states adopting such a scheme. Harmonizing the multiple emissions trading schemes worldwide will be a decades-long effort that is unlikely to succeed. Such schemes also can be gamed by larger players, producing pricing distortions. A hard and fast tax that is enforced in all of the members of such a carbon club would immediately focus attention on the technology required to avoid paying it – mobilizing capital, innovation and entrepreneurial drive to make it a reality. This would support carbon-capture, use and storage technologies as well, thus extending the life of existing energy resources as the next generation of metals-based resources is built out. In addition, a carbon tax raises revenue for governments, which can be used for a variety of public policies, including reducing other taxes to reduce the overall burden of taxation. Lastly, a tax eliminates the potential for short-term price volatility in the pricing of carbon – as long as households and firms know what confronts them they can plan around it. Tax revenues also can be used to reduce the regressive nature of such levies. Investment Implications The lack of a coherent policy framework that addresses the very real constraints on the transition to a low-carbon economy makes the likelihood of a volatile, years-long evolution foreordained. We believe this will create numerous investment opportunities as underinvestment in hydrocarbons and base metals production predisposes oil, natural gas and base metals prices to move higher in the face of strong and rising demand. We remain long commodity index exposure – the S&P GSCI and GSCI Commodity Dynamic Roll Strategy ETF (COMT), which is optimized to take advantage of the most backwardated commodity forward curves in the index. These positions were up 5.3% and 7.2% since inception on December 7, 2017 and March 12, 2021, respectively, at Tuesday's close. We also remain long the MSCI Global Metals & Mining Producers ETF (PICK), which is up 33.9% since it was put on December 10, 2020. Expecting continued volatility in metals – copper in particular – we will look for opportunities to re-establish positions in COMEX/CME Copper after being stopped out with gains. A trailing stop was elected on our long Dec21 copper position established September 10, 2020, which was closed out with a 48.2% gain on May 21, 2021. Our long calendar 2022 vs short calendar 2023 COMEX copper backwardation trade established April 22, 2021, was closed out on May 20, 2021, leaving us with a return of 305%. Robert P. Ryan Chief Commodity & Energy Strategist rryan@bcaresearch.com Ashwin Shyam Research Associate Commodity & Energy Strategy ashwin.shyam@bcaresearch.com Commodities Round-Up Energy: Bullish OPEC 2.0 offered no surprises to markets this week, as it remained committed to returning just over 2mm b/d of production to the market over the May-July period, 70% of which comes from the Kingdom of Saudi Arabia (KSA), according to Platts. While Iran's return to the market is not a given in OPEC 2.0's geometry, we have given better than even odds it will return to the market beginning in 3Q21 and restore most of the 1.4mm b/d not being produced at present to the market over the course of the following year. OPEC itself expects demand to increase 6mm b/d this year, somewhat above our expectation of 5.3mm b/d. Stronger demand could raise Brent prices above our average $63/bbl forecast for this year (Chart 7). Brent was trading above $71/bbl as we went to press. Base Metals: Bullish BHP declared operations at its Escondida and Spence mines were running at normal rates despite a strike by some 200 operations specialists. BHP is employing so-called substitute workers to conduct operation, according to reuters.com, which also reported separate unions at both mines are considering strike actions in the near future. Precious Metals: Bullish The Fed’s reluctance to increase nominal interest rates despite indications of higher inflation will reduce real rates, which will support higher gold prices (Chart 8). We agree with our colleagues at BCA Research's US Bond Strategy that the Fed is waiting for the US labor market to reach levels consistent with its assessment of maximum employment before it makes its initial rate hike in this interest-rate cycle. Subsequent rate changes, however, will be based on realized inflation and inflation expectations. In our opinion, the Fed is following this ultra-accommodative monetary policy approach to break the US liquidity trap, brought about by a rise in precautionary savings due to the pandemic. In addition, we continue to expect USD weakness, which also will support gold and precious metals prices. We remain long gold, expecting prices to clear $2,000/oz this year. Ags/Softs: Neutral Corn prices fell more than 2% Wednesday, following the release of USDA estimates showing 95% of the corn crop was planted by 31 May 2021, well over the 87% five-year average. This was in line with expectations. However, the Department's assessment that 76% of the crop was in good-to-excellent condition exceeded market expectations. Chart 7 Chart 8 Footnotes 1 Please see Trade Tables below. 2 Please see OPEC, Russia seen gaining more power with Shell Dutch ruling and EXCLUSIVE BlackRock backs 3 dissidents to shake up Exxon board -sources published by reuters.com June 1, 2021 and May 25, 2021. 3 Please see Chile's govt in shock loss as voters pick independents to draft constitution published by reuters.com May 17, 2021, and Peru’s elite in panic at prospect of hard-left victory in presidential election published by ft.com June 1, 2021. Peru has seen significant capital flight on the back of these fears. See also Results from Chile’s May 2021 elections published by IHS Markit May 21, 2021 re a higher likelihood of tax increases for the mining sector. The risk of nationalization is de minimis, according to IHS. 4 Please see Exxon walks away from stake in deepwater Ghana block published by worldoil.com June 1, 2021. 5 Please see OPEC 2.0's Production Strategy In Focus, which we published on May 20, 2021, for a recap our how we model OPEC 2.0's strategy. It is available at ces.bcaresearch.com. 6 Please see Will a lack of supply growth come back to bite the copper industry?, published by Wood Mackenzie on March 23, 2021. 7 Please see The Challenges and Prospects for Carbon Pricing in Europe published by the Oxford Institute for Energy Studies last month for a discussion of carbon taxes vs. emissions trading schemes. Investment Views and Themes Strategic Recommendations Tactical Trades Commodity Prices and Plays Reference Table Trades Closed in 2021 Summary of Closed Trades
Highlights China's high-profile jawboning draws attention to tightness in metals markets, and raises the odds the State Reserve Board (SRB) will release some of its massive copper and aluminum stockpiles in the near future. Over the medium- to long-term, the lack of major new greenfield capex raises red flags for the IEA's ambitious low-carbon pathway released last week, which foresees the need for a dramatic increase in renewable energy output and a halt in future oil and gas investment to achieve net-zero emissions by 2050. Copper demand is expected to exceed mined supply by 2028, according to an analysis by S&P, which, in line with our view, also sees refined-copper consumption exceeding production this year (Chart of the Week). A constitution re-write in Chile and elections in Peru threaten to usher in higher taxes and royalties on mining in these metals producers, placing future capex at risk. Chile's state-owned Codelco, the largest copper producer in the world, fears a bill to limit mining near glaciers could put as much as 40% of its copper production at risk. We remain bullish copper and look to get long on politically induced sell-offs as the USD weakens. Feature Politicians are inserting themselves in the metals markets' supply-demand evolutions to a greater degree than in the past, which is complicating the short- and medium-term analysis of prices. This adds to an already-difficult process of assessing markets, given the opacity of metals fundamentals – particularly inventories, which are notoriously difficult to assess. Chinese Communist Party (CCP) jawboning of market participants in iron ore, steel, copper and aluminum markets over the past two weeks has weakened prices, but, with the exception of steel rebar futures in Shanghai – down ~ 17% from recent highs, and now trading at ~ 4911 RMB/MT – the other markets remain close to records. Benchmark 62% Fe iron ore at the port of Tianjin was trading ~ 4% lower at $211/MT, while copper and aluminum were trading ~ 5.5% and 6.5% off their recent records at $4.535/lb and $2,350/MT, respectively. In addition to copper, aluminum markets are particularly tight (Chart 2). Jawboning aside, if fundamentals continue to keep prices elevated – or if we see a new leg up – China's high-profile jawboning could presage a release by the State Reserve Board (SRB) of some of its massive copper and aluminum stockpiles in the near term. In the case of copper, market guesses on the size of this stockpile are ~ 2mm to 2.7mm MT. On the aluminum side, Bloomberg reported CCP officials were considering the release of 500k MT to quell the market's demand for the metal. Chart of the WeekContinue Tightening In Copper Expected Chart 2Aluminum Remains Tight Brownfield Development Not Sufficient Our balances assessments continue to indicate key base metals markets are tight and will remain so over the short term (2-3 years). Economies ex-China are entering their post-COVID-19 recovery phase. This will be followed by higher demand from renewable generation and grid build-outs that will put them in direct competition with China for scarce metals supplies for decades to come. Markets will continue to tighten. In the bellwether copper market, we expect this tightness to remain a persistent feature of the market over the medium term – 3 to 5 years out – given the dearth of new supply coming to market. Copper prices are highly correlated with the other base metals (Chart 3) – the coefficient of correlation with the other base metals making up the LME's metals index is ~ 0.86 post-GFC – and provide a useful indicator of systematic trends in these markets. Chart 3Copper Correlation With LME Index Ex-Copper Copper ore quality has been falling for years, as miners focused on brownfield development to extend the life of mines (Chart 4). In Chart 5, we show the ratio of capex (in billion USD) to ore quality increases when capex growth is expanding faster than ore quality, and decreases when capex weakens and/or ore quality degradation is increasing. Chart 4Copper Capex, Ore Quality Declines Chart 5Capex-to-Ore-Quality Decline Set Market Up For Higher Prices Falling prices over the 2012-19 interval coincide with copper ore quality remaining on a downward trend, likely the result of previous higher prices that set off the capex boom pre-GFC. The lower prices favored brownfield over greenfield development. Goehring and Rozencwajg found in their analysis of 24 mines, about 80% of gross new reserves booked between 2001-2014 were due not to new mine discoveries but to companies reclassifying what was once considered to be waste-rock into minable reserves, lowering the cut-off grade for development.1 This is consistent with the most recent datapoints in Chart 5, due to falling ore grade values, as companies inject less capex into their operations and use it to expand on brownfield projects. Higher prices will be needed to incentivize more greenfield projects. A new report from S&P Global Market Intelligence shows copper reserves in the ground are falling along with new discoveries.2 According to the S&P analysts, copper demand is expected to exceed mined supply by 2028, which, in line with our view, sees refined-copper consumption exceeding production this year. Renewables Push At Risk Just last week, the IEA produced an ambitious and narrow path for governments to collectively reach a net-zero emissions (NZE) goal by 2050.3 Among its many recommendations, the IEA singled out the overhaul of the global electric grid, which will be required to accommodate the massive renewable-generation buildout the agency forecasts will be needed to achieve its NZE goals. The IEA forecasts annual investment in transmission and distribution grids will need to increase from $260 billion to $820 billion p.a. by 2030. This is easier said than done. Consider the build-out of China's grid, which is the largest grid in the world. To become carbon neutral by 2060, per its stated goals, investment in China’s grid and associated infrastructure is expected to approach ~ $900 billion, maybe more, over the next 5 years.4 The world’s largest fossil-fuel importer is looking to pivot away from coal and plans to more than double solar and wind power capacity to 1200 GW by 2030. Weening China off coal and rebuilding its grid to achieve these goals will be a herculean lift. It comes as no surprise that IEA member states have pushed back on the agency's NZE-by-2050 plan. This primarily is because of its requirement to completely halt fossil-fuel exploration and spending on new projects. Japan and Australia have pushed back against this plan, citing energy security concerns. Officials from both countries have stated that they will continue developing fossil fuel projects, as a back-up to renewables. Japan has been falling behind on renewable electricity generation (Chart 6). Expensive renewables and the unpopularity of nuclear fuel could make it harder for the world’s fifth largest fossil fuels consumer to move away from fossil fuels. Around the same time the IEA released its report, Australia committed $464 million to build a new gas-fired power station as a backup to renewables. Chart 6Japan Will Continue Building Fossil-Fuel Back-Up Generation Just days after the IEA report was published, the G7 nations agreed to stop overseas coal financing. This could have devastating effects for emerging and developing nations‘ electricity grids which are highly dependent on coal. In 2020 70% and 60% of India and China’s electricity respectively were produced by coal (Chart 7).5 Chart 7EM Economies Remain Reliant On Coal-Fired Generation Near-Term Copper Supply Risks Rise Even though inventories appear to be rebuilding, mounting political risks keep us bullish copper (Chart 8). Lawmakers in Chile and Peru are in the process of re-writing their constitutions to, among other things, raise royalties and taxes on mining activities in their respective countries. This could usher in higher taxes and royalties on mining for these metals producers, placing future capex at risk. In addition, Chile's state-owned Codelco, the largest copper producer in the world, fears a bill to limit mining near glaciers could put as much as 40% of its copper production at risk.6 None of these events is certain to occur. Peruvian elections, for one thing, are too close to call at this point, and Chile has a history of pro-business government. However, these are non-trivial odds – i.e., greater than Russian roulette odds of 1:6 – and if any or all of these outcomes are realized, higher costs in copper and lithium prices would result, and miners would have to pass those costs on to buyers. Bottom Line: We remain bullish base metals, especially copper. Another leg up in copper would pull base metals higher with it. We would look to get long on politically induced sell-offs, particularly with the USD weakening, as expected Chart 8Global Copper Inventories Rebuilding But Still Down Y/Y Robert P. Ryan Chief Commodity & Energy Strategist rryan@bcaresearch.com Ashwin Shyam Research Associate Commodity & Energy Strategy ashwin.shyam@bcaresearch.com Commodities Round-Up Energy: Bullish Next Tuesday's OPEC 2.0 meeting appears to be a fairly staid affair, with little of the drama attending previous gatherings. Russian minister Novak observed the coalition would be jointly "calculating the balances" when it meets, taking into account the likely official return of Iran as an exporter, according to reuters.com. We expect a mid-year deal on allowing Iran to return to resume exports under the nuclear deal abrogated by the Trump administration in 2019, and reckon Iran has ~ 1.5mm b/d of production it can bring back on line, which likely would return its crude oil production to something above 3.8mm b/d by year-end. We are maintaining our forecast for Brent to average $64.45/bbl in 2H21; $75 and $78/bbl, in 2022 and 2023, respectively. By end 2023, prices trade to $80/bbl. Our forecast is premised on a wider global recovery going into 2H21, and continued production discipline from OPEC 2.0 (Chart 9). Base Metals: Bullish Our stop-losses was elected on our long Dec21 copper position on May 21, which means we closed the position with 48.2% return. The stop loss on our long 2022 vs short 2023 COMEX copper futures backwardation recommendation also was elected on May 20, leaving us with a return of 305%. We will be looking for an opportunity to re-establish these positions. Precious Metals: Bullish We expect the collapse in bitcoin prices, the US Fed’s decision to not raise interest rates, and a weakening US dollar to keep gold prices well bid (Chart 10). China’s ban on cryptocurrency services and Musk’s acknowledgment of the energy intensity of Bitcoin mining sent Bitcoin prices crashing. The Fed’s decision to keep interest rates constant, despite rising inflation and inflation expectations will reduce the opportunity cost of holding gold. According to our colleagues at USBS, the Fed will make its first interest rate hike only after the US economy has reached "maximum employment". The Job Openings and Labor Turnover Survey reported that job openings rose nearly 8% in March to 8.1 million jobs, however, overall hiring was little changed, rising by less than 4% to 6 million. As prices in the US rise and the dollar depreciates, gold will be favored as a store of value. On the back of these factors, we expect gold to hit $2,000/oz. Ags/Softs: Neutral Corn futures were trading close to 20% below recent highs earlier in the week at ~ $6.27/bu, on the back of much faster-than-expected plantings. Chart 9 Chart 10 Footnotes 1 Please refer to Goehring & Rozencwajg’s Q1 2021 market commentary. 2 Please see Copper cupboard remains bare as discoveries dwindle — S&P study published by mining.com 20 May 2021. 3 Please see Net Zero by 2050 – A Roadmap for the Global Energy Sector, published by the IEA. 4 Please see China’s climate goal: Overhauling its electricity grid, published by Aljazeera. 5 We discuss this in detail in Surging Metals Prices And The Case For Carbon-Capture published 13 May 2021, and Renewables ESG Risks Grow With Demand, which was published 29 April 2021. Both are available at ces.bcaresearch.com. 6 Please see A game of chicken is clouding tax debate in top copper nation, Fujimori looks to speed up projects to tap copper riches in Peru and Codelco says 40% of its copper output at risk if glacier bill passes published by mining.com 24, 23 and 20 May 2021, respectively. Investment Views and Themes Strategic Recommendations Tactical Trades Commodity Prices and Plays Reference Table Trades Closed in 2021 Summary of Closed Trades
Highlights The Biden Administration's $2.25 trillion infrastructure plan rolled out yesterday will, at the margin, boost global demand for energy and base metals more than expected later this year and next. Global GDP growth estimates – and the boost supplied by US stimulus – once again will have to be adjusted higher (Chart of the Week). Energy and metals fundamentals continue to tighten. OPEC 2.0's so-far-successful production management strategy will keep the level of supply just below demand, which will keep Brent crude oil on either side of $60/bbl. Base-metals output will struggle to meet higher demand from the ongoing buildout of renewables infrastructure and growing electric-vehicle sales. Of late, concerns that speculative positioning suggests prices will head lower – or, at other times, higher – are entirely misplaced: Spec positioning conveys no information on price levels or direction. Energy and metals prices, on the other hand, do convey useful information on spec positioning, demonstrating specs do not lead the news or prices, they follow them. Short-term headwinds caused by halting recoveries and renewed lockdowns – particularly in the EU – will fade in 2H21 as vaccines roll out, if the experience of the UK and US are any guide. Continued USD strength, however, would remain a headwind. Feature If the Biden administration is successful in getting its $2.25 trillion infrastructure-spending bill through Congress, the US will join the rest of the world in the race to re-build – in some cases, build anew – its long-neglected bridges, roads, schools, communications and high-speed transportation networks, and, critically, its electric-power grid. There's a lot of game left to play on this, but our Geopolitical Strategy group is giving this bill an 80% of passage later this year, after all the wrangling and log-rolling in Congress is done. In and of itself, the infrastructure-directed spending coming out of Biden's plan will be a catalyst for higher US industrial commodity demand – energy, metals and bulks. In addition, it will support the lift in the demand boost coming out of higher GDP growth globally, which will be pushed higher by US fiscal spending, as the Chart of the Week shows. Of note is the extremely robust growth expected in India, China and the US, which are among the largest consumers of industrial commodities globally. Overall growth in the G20 and globally will be expansive in 2022 as well. Chart of the WeekBiden's $2.25 Trillion Infrastructure Bill Will Boost Global Commodity Demand Higher GDP growth translates directly into higher demand for commodities, all else equal, as can be seen in the relationship between EM and DM GDP, supply and inventories and Brent crude oil prices in Chart 2. While we have reduced our Brent forecast for this year to $60/bbl on the back of renewed demand-side weakness in the EU due to problems in acquiring and distributing COVID-19 vaccines, we expect this to be reversed next year and into 2025, with prices trading between $60-$80/bbl (Chart 3). OPEC 2.0, the oil-producer coalition led by the Kingdom of Saudi Arabia (KSA) and Russia, has done an excellent job of keeping the level of oil supply below demand over the course of the pandemic, which we expect to continue to the end of 2025.1 Chart 2Higher GDP Growth Presages Higher Commodity Demand Chart 3Brent Crude Oil Prices Will Average - / bbl to 2025 As the Biden plan makes its way through Congress, markets will get a better idea of how much diesel fuel, copper, steel, iron ore, etc., will be required in the US alone. What is important to note here that the US is just moving to the starting line, whereas other economies like China and the EU already have begun their investment cycles in renewables and EVs. At present, key markets already are tight, particularly copper (Chart 4) and aluminum (Chart 5). In both markets, we expect physical deficits this year and next, which inclines us to believe the metals leg of this renewables buildout is just beginning – higher prices will be required to incentivize the development of new supply.2 Chart 4Copper Will Post Physical Deficit... Chart 5...As Will Aluminum This is particularly important in copper, where growth in mining output of ore has been flat for the past two years. Copper is the one metal that spans all renewables technologies, and is a bellwether commodity for global growth. We expect copper to trade to $4.50/lb (up ~ $0.50/lb vs spot) on the COMEX in 4Q21 on the back of increasing demand and tight supplies – i.e., falling mining supply and refined copper output growth (Chart 6). Worth noting also is steel rebar and hot-rolled coil prices traded at record highs this week on Chinese futures markets. Stronger steel markets continue to support iron ore prices, although the latter is trading off its recent highs and likely will move lower toward the end of the year as Brazilian supply returns to the market.3 We use steel prices as a leading indicator for copper prices – steel leads copper prices by ~ 9 months. This makes sense when one considers steel is consumed early in infrastructure and construction projects, while copper consumption occurs later as airports and houses are fitted with copper for electric, plumbing and communications applications. Chart 6Copper Ore Output Flat Does Speculative Positioning Matter? Of late, media pundits and analysts have cited an unwinding of speculative positions in oil and metals markets following sharp run-ups in net long positions as a harbinger of weaker prices in the near future (Chart 7).4 At other times, speculation has been invoked as a reason for price surges – e.g., when oil rocketed toward $150/bbl in mid-2008, which was followed by a price collapse at the start of the Global Financial Crisis (GFC).5 Brunetti et al note, "The role of speculators in financial markets has been the source of considerable interest and controversy in recent years. Concern about speculative trading also finds support in theory where noise traders, speculative bubbles, and herding can drive prices away from fundamental values and destabilize markets." (p. 1545) Chart 7Speculative Positioning Lower In Brent Than WTI We recently re-tested earlier findings in our research, which found that knowledge of how specs are positioned – either on the long or the short side of the market – conveys no information on the level of prices or the change that should be expected given that knowledge. However, knowledge of the price level does convey useful information on how speculators are positioned in futures markets.6 In cointegrating regressions of speculative positions in crude oil, natural gas and copper futures on price levels for these commodities, we find the level of prices to be a statistically significant determinant of spec positions. We find no such relationship using spec positions as an explanatory variable for prices.7 On the other hand, Chart 2 above is an example of statistically significant relationships for Brent and WTI price as a function of supply-demand fundamentals displaying coefficients of determination (r-squares) of close to 90% in the post-GFC period (2010 to now). This supports our earlier findings regarding spec behavior: They follow prices, they don't lead them.8 We are not dismissive of speculation. It plays a critical role in markets, by providing the liquidity that enables commodity producers and consumers to hedge their price exposures, and to investors seeking to diversify their portfolios with commodity exposures that are uncorrelated to their equity and bond holdings. Short-Term Headwinds Likely Dissipate COVID-19 remains the largest risk to markets generally, commodities in particular. The mishandling of vaccine rollouts in the EU has pushed back our assumption for demand recovery deeper into 2H21, but it has not derailed it. We expect COVID-related deaths and hospitalizations to fall in the EU as they have in the UK and the US following the widespread distribution of vaccines, which should occur in the near future as Brussels organizes its pandemic response (Chart 8). Making vaccines available for other states in dire straits will follow, which will allow the global re-opening to progress as lockdowns are lifted (Chart 9). Chart 8EU Vaccination Rollouts Will Boost Global Economic Recovery Chart 9Global Re-Opening Has Slowed, But Will Resume In 2H21 The other big risk we see to commodities is persistent USD strength (Chart 10). The dollar has rallied for the better part of 2021, largely on the back of improving US economic prospects relative to other states, and success in its vaccination efforts. The resumption of the USD's bear market may have to wait until the rest of the world catches up with America's public-health response to the pandemic, and the global economy ex-US and -China enters a stronger expansionary mode. Bottom Line: We remain bullish industrial commodities expecting demand to improve as the EU rolls out vaccines and begins to make progress in arresting the pandemic and removing lockdowns. Global fiscal and monetary policy, which likely will be bolstered by a massive round of US infrastructure spending beginning in 4Q21 will catalyze demand growth for oil and base metals. This will prompt another round of GDP revisions to the upside. The dollar remains a headwind for now, but we expect it to return to a bear market in 2H21. Chart 10The USD's Evolution Remains Important Robert P. Ryan Chief Commodity & Energy Strategist rryan@bcaresearch.com Ashwin Shyam Research Associate Commodity & Energy Strategy ashwin.shyam@bcaresearch.com Commodities Round-Up Energy: Bullish Going into the April 1 meeting of OPEC 2.0 today, we are not expecting any increase in production. OPEC earlier this week noted demand had softened, mostly due to the slow recovery from the COVID-19 pandemic in the EU, which, based on their previous policy decisions, suggests the producer coalition will not be increasing production. The coalition led by KSA and Russia will have to address Iran's return as a major exporter to China this year, which appears to have been importing ~ 1mm b/d of Iranian crude this month (Chart 11). This puts Iran in direct competition with KSA as a major exporter to China, in defiance of the US re-imposition of sanctions against Iranian exports. China and Iran over the weekend signed a 25-year trade pact that also could include military provisions, which could, over time, alter the balance of power in the Persian Gulf if Chinese military assets – naval and land warfare – deploy to Iran under their agreement. Details of the deal are sparse, as The Guardian noted in its recent coverage. Among other things, government officials in Tehran have come under withering criticism for entering the deal, which they contend was signed with a "politically bankrupt regime." The Guardian also noted US President Joe Biden " is prepared to make a new offer to Iran this week whereby he will lift some sanctions in return for Iran taking specific limited steps to come back into compliance with the nuclear agreement, including reducing the level to which it enriches uranium," in the wake of the signing of this deal. Base Metals: Bullish Copper fell this week, initially on an inventory build, and has now settled right under the $4/lb mark, as investors await details on the US infrastructure bill unveiled in Pittsburgh, PA, on Wednesday. According to mining.com, a major chunk of the proposed bill will be devoted to investments in infrastructure, which will be metals-intensive. Precious Metals: Bullish Gold fell further this week, as US treasury yields rose, buoyed by the increased US vaccine efforts and President Biden’s proposed spending plans (Chart 12). USD strength also worked against the yellow metal, which has been steadily declining since the beginning of this year. COMEX gold fell below the $1,700/oz mark for the third time this month and settled at $1,683.90/oz on Tuesday. Chart 11 Chart 12 Footnotes 1 Please see Five-Year Brent Forecast Update: Expect Price Range of $60 - $80/bbl, which we published 25 March 2021. It is available at ces.bcaresearch.com. 2 Please see Industrial Commodities Super-Cycle Or Bull Market?, which we published 4 March 2021 for additional discussion, particularly regarding the need for additional capex in energy and metals markets. 3 Please see UPDATE 1-Strong industrial activity, profit lift China steel futures, published by reuters.com 29 March 2021. 4 See, e.g., Column: Frothy oil market deflates as virus fears return published 23 March 2021. 5 Brunetti, Celso, Bahattin Büyüksahin, and Jeffrey H. Harris (2016), " Speculators, Prices, and Market Volatility," Journal of Financial and Quantitative Analysis, 51:5, pp. 1545-74, for further discussion. 6 Please see Specs Back Up The Truck For Oil, which we published 26 April 2018, and Feedback Loop: Spec Positioning & Oil Price Volatility published 10 May 2018. Both are available at ces.bcaresearch.com. 7 We group money managers (registered commodity trading advisors, commodity pool operators and unregistered funds) and swap dealers (banks and trading companies providing liquidity to hedgers and speculators) together to test these relationships. 8 In our earlier research, we also noted our results generally were supported in the academic literature. See, e.g., Fattouh, Bassam, Lutz Kilian and Lavan Mahadeva (2012), "The Role of Speculation in Oil Markets: What Have We Learned So Far?" published by The Oxford Institute For Energy Studies. Investment Views and Themes Strategic Recommendations Commodity Prices and Plays Reference Table Summary of Closed Trades
Highlights Yesterday we published a Special Report titled EM: Foreign Currency Debt Strains. We are upgrading our stance on EM local currency bonds from negative to neutral. Before upgrading to a bullish stance, we would first need to upgrade our stance on EM currencies. We recommend receiving long-term swap rates in Russia, Mexico, Colombia, China and India. EM central banks’ swap lines with the Fed could be used to fend off short-term speculative attacks on EM currencies. Nevertheless, they cannot prevent EM exchange rates from depreciation when fundamental pressures warrant weaker EM currencies. For the rampant expansion of US money supply to produce a lasting greenback depreciation, US dollars should be recycled abroad. This is not yet occurring. Domestic Bonds: A New Normal Chart I-1Performance Of EM Domestic Bonds In The Last Decade In recent years, our strategy has favored the US dollar and, by extension, US Treasurys over EM domestic bonds. Chart I-1 demonstrates that the EM GBI local currency bond total return index in US dollar terms is at the same level as it was in 2011, and has massively underperformed 5-year US Treasurys. We are now upgrading our stance on EM local currency bonds from negative to neutral. Consistently, we recommend investors seek longer duration in EM domestic bonds while remaining cautious on the majority of EM currencies. Before upgrading to a bullish stance on EM local bonds, we would first need to upgrade our stance on EM currencies. Still, long-term investors who can tolerate volatility should begin accumulating EM local bonds on any further currency weakness. Our upgrade is based on the following reasons: First, there has been a fundamental shift in EM central banks’ policies. In past global downturns, many EM central banks hiked interest rates to defend their currencies. Presently, they are cutting rates aggressively despite large currency depreciation. This is the right policy action to fight the epic deflationary shock that EM economies are presently facing. There has been a fundamental shift in EM central banks’ policies. They are cutting rates aggressively despite large currency depreciation. Historically, EM local bond yields were often negatively correlated with exchange rates (Chart I-2, top panel). Similarly, when EM currencies began plunging two months ago, EM local bond yields initially spiked. However, following the brief spike, bond yields have begun dropping, even though EM currencies have not rallied (Chart I-2, bottom panel). This represents a new normal, which we discussed in detail in our October 24 report. Overall, even if EM currencies continue to depreciate, EM domestic bond yields will drop as they price in lower EM policy rates. Second, the monetary policy transmission mechanism in many EMs was broken before the COVID-19 outbreak. Even though central banks in many developing countries were reducing their policy rates before the pandemic, commercial banks’ corresponding lending rates were not dropping much (Chart I-3, top panel). Chart II-2EM Local Bond Yields And EM Currencies Chart I-3EM ex-China: Monetary Transmission Has Been Impaired Further, core inflation rates were at all time lows and prime lending rates in real terms were extremely high (Chart I-3, middle panels). Consequently, bank loan growth was slowing preceding the pandemic (Chart I-3, bottom panel). The reason was banks’ poor financial health. Saddled with a lot of NPLs, banks had been seeking wide interest rate margins to generate profit and recapitalize themselves. With the outburst of the pandemic and the sudden stop in domestic and global economic activity, EM banks’ willingness to lend has all but evaporated. Chart I-4 reveals EM ex-China bank stocks have plunged, despite considerable monetary policy easing in EM, which historically was bullish for bank share prices. This upholds the fact that the monetary policy transmission mechanism in EM is broken. Mounting bad loans due to the pandemic will only reinforce these dynamics. Swap lines with the Fed cannot prevent EM exchange rates from depreciation when fundamental pressures – global and domestic recessions – warrant weaker EM currencies. In brief, EM lower policy rates will not be transmitted to lower borrowing costs for companies and households anytime soon. Loan growth and domestic demand will remain in an air pocket for some time. Consequently, EM policy rates will have to drop much lower to have a meaningful impact on growth. Third, there is value in EM local yields. The yield differential between EM GBI local currency bonds and 5-year US Treasurys shot up back to 500 basis points, the upper end of its historical range (Chart I-5). Chart I-4EM ex-China: Bank Stocks Plunged Despite Rate Cuts Chart I-5The EM Vs. US Yield Differential Is Attractive Bottom Line: Odds favor further declines in EM local currency bond yields. Fixed-income investors should augment their duration exposure. We express this view by recommending receiving swap rates in the following markets: Russia, Mexico, Colombia, India and China. This is in addition to our existing receiver positions in Korean and Malaysian swap rates. For more detail, please refer to the Investment Recommendations section on page 8. Nevertheless, absolute-return investors should be cognizant of further EM currency depreciation. EM Currencies: At Mercy Of Global Growth Chart I-6EM Currencies Correlate With Commodities Prices The key driver of EM currencies has been and remains global growth. The latter will remain very depressed for some time, warranting patience before turning bullish on EM exchange rates. We have long argued that EM exchange rates are driven not by US interest rates but by global growth. Industrial metals prices offer a reasonable pulse on global growth. Chart I-6 illustrates their tight correlation with EM currencies. Even though the S&P 500 has rebounded sharply in recent weeks, there are no signs of a meaningful improvement in industrial metals prices. Various raw materials prices in China are also sliding (Chart I-7). In a separate section below we lay out the case as to why there is more downside in iron ore and steel as well as coal prices in China. Finally, the ADXY – the emerging Asia currency index against the US dollar – has broken down below its 2008, 2016 and 2018-19 lows (Chart I-8). This is a very bearish technical profile, suggesting more downside ahead. This fits with our fundamental assessment that a recovery in global economic activity is not yet imminent. Chart I-7China: Commodities Prices Are Sliding Chart I-8A Breakdown In Emerging Asian Currencies What About The Fed’s Swap Lines? A pertinent question is whether EM central banks’ foreign currency reserves and the Federal Reserve’s swap lines with several of its EM counterparts are sufficient to prop up EM currencies prior to a pickup in global growth. The short answer is as follows: These swap lines will likely limit the downside but cannot preclude further depreciation. With the exception of Turkey and South Africa, virtually all mainstream EM banks have large foreign currency reserves. On top of this, several of them – Brazil, Mexico, South Korea and Singapore– have recently obtained access to Fed swap lines. Their own foreign exchange reserves and the swap lines with the Fed give them an option to defend their currencies from depreciation if they choose to do so. However, selling US dollars by EM central banks is not without cost. When central banks sell their FX reserves or dollars obtained from the Fed via swap lines, they withdraw local currency liquidity from the system. As a result, banking system liquidity shrinks, pushing up interbank rates. This is equivalent to hiking interest rates. The Fed’s outright money printing is the sole reason to buy EM risk assets and currencies at the moment. Yet, EM fundamentals – namely, its growth outlook – remain downbeat. Hence, the cost of defending the exchange rate by using FX reserves is both liquidity and credit tightening. In such a case, the currency could stabilize but the economy will take a beating. Since the currency depreciation was itself due to economic weakness, such a policy will in and of itself be self-defeating. The basis is that escalating domestic economic weakness will re-assert its dampening effect on the currency. Of course, EM central banks can offset such tightening by injecting new liquidity. However, this could also backfire and lead to renewed currency depreciation. Bottom Line: EM central banks’ swap lines with the Fed are primarily intended to instill confidence among investors in financial markets. They could be used to fend off short-term speculative attacks on EM currencies. Nevertheless, they cannot prevent EM exchange rates from depreciation when fundamental pressures – global and domestic recessions – warrant weaker EM currencies. What About The Fed’s Money Printing? Chart I-9The Fed Is Aggressively Printing Money The Fed is printing money and monetising not only public debt but also substantial amounts of private debt. This will ultimately be very bearish for the US dollar. Chart I-9 illustrates that the Fed is printing money much more aggressively than during its quantitative easing (QE) policies post 2008. The key difference between the Fed’s liquidity provisions now and during its previous QEs is as follows: When the Fed purchases securities from or lends to commercial banks, it creates new reserves (banking system liquidity) but it does not create money supply. Banks’ reserves at the Fed are not a part of broad money supply. This was generally the case during previous QEs when the Fed was buying bonds mostly – but not exclusively – from banks, therefore increasing reserves without raising money supply by much. When the Fed lends to or purchases securities from non-banks, it creates both excess reserves for the banking system and money supply (deposits at banks) out of thin air. The fact that US money supply (M2) growth is now much stronger than during the 2010s QEs suggests the recent surge in US money supply is due to the Fed’s asset purchases from and lending to non-banks, which creates money/deposits outright. The rampant expansion of US money supply will eventually lead to the greenback’s depreciation. However, for the US dollar to depreciate against EM currencies, the following two conditions should be satisfied: 1. US imports should expand, reviving global growth, i.e., the US should send dollars to the rest of the world by buying goods and services. This is not yet happening as domestic demand in America has plunged and any demand recovery in the next three to six months will be tame and muted. 2. US investors should channel US dollars to EM to purchase EM financial assets. In recent weeks, foreign flows have been returning to EM due to the considerable improvement in EM asset valuations. However, the sustainability of these capital flows into EM remains questionable. The main reasons are two-fold: (A) there is huge uncertainty on how efficiently EM countries will be able handle the economic and health repercussions of the pandemic; and (B) global growth remains weak and, as we discussed above, it has historically been the main driver of EM risk assets and currencies. Bottom Line: The Fed’s outright money printing is the sole reason to buy EM risk assets and currencies at the moment. Yet, EM fundamentals – namely, its growth outlook – remain downbeat. Overall, we recommend investors to stay put on EM risk assets and currencies in the near-term. Investment Recommendations Chart I-10China: Bet On Lower Long-Term Yields We have been recommending receiving rates in a few markets such as Korea and Malaysia. Now, we are widening this universe to include Russia, Mexico, Colombia, China, and India. In China, the long end of the yield curve offers value (Chart I-10, top panel). The People’s Bank of China has brought down short rates dramatically but the long end has so far lagged (Chart I-10, bottom panel). We recommend investors receive 10-year swap rates. Fixed-income investors could also bet on yield curve flattening. The recovery in China will be tame and the PBoC will keep interest rates lower for longer. Consequently, long-dated swap rates will gravitate toward short rates. We are closing three fixed-income trades: In Mexico, we are booking profits on our trade of receiving 2-year / paying 10-year swap rates – a bet on a steeper yield curve. This position has generated a 152 basis-point gain since its initiation on April 12, 2018. In Colombia, our bet on yield curve flattening has produced a loss of 28 basis points since January 17, 2019. We are closing it. In Chile, we are closing our long 3-year bonds / short 3-year inflation-linked bonds position. This trade has returned 2.0% since we recommended it on October 3, 2019. For dedicated EM domestic bond portfolios, our overweights are Russia, Mexico, Peru, Colombia, Korea, Malaysia, Thailand, India, China, Pakistan and Ukraine. Our underweights are South Africa, Turkey, Brazil, Indonesia and the Philippines. The remaining markets warrant a neutral allocation. Regarding EM currencies, we continue to recommend shorting a basket of the following currencies versus the US dollar: BRL, CLP, ZAR, IDR, PHP and KRW. Arthur Budaghyan Chief Emerging Markets Strategist arthurb@bcaresearch.com Chinese Steel, Iron Ore And Coal Markets: Heading South Chart II-1Steel, Iron Ore And Coal Prices: More Downside Ahead? Odds are that iron ore, steel and coal prices will all continue heading south (Chart II-1). Lower prices will harm both Chinese and global producers of these commodities. Steel And Iron Ore The oversupplied conditions in the Chinese steel market will become even more aggravated over the next three to six months. First, Chinese output of steel products has not contracted even though demand plunged in the first three months of the year, creating oversupply. Despite falling steel prices and the demand breakdown resulting from the COVID-19 outbreak, Chinese crude steel output still grew at 1.5% and its steel products output only declined 0.6% between January and March from a year ago (Chart II-2). Chart II-2Steel Products Output In China: Still No Contraction The profit margin of Chinese steel producers has compressed but not enough to herald a sizable cut in mainland steel production. Despite oversupply, Chinese steel producers are reluctant to curtail output to prevent layoffs. This year, there will be 62 million tons of new steel production capacity while 82 million tons of obsolete capacity will be shut down. As the capacity-utilization rate (CUR) of the new advanced production capacity will be much higher than the CUR on those soon-to-be-removed capacities in previous years, this will help lift steel output. Second, Chinese steel demand has plummeted, and any revival will be mild and gradual over the next three to six months. Construction accounts for about 55% of Chinese steel demand, with about 35% coming from the property market and 20% from infrastructure. Additionally, the automobile industry contributes about 10% of demand. All three sectors are currently in deep contraction (Chart II-3). Looking ahead, we expect that the demand for steel from property construction and automobile production will revive only gradually. Overall, it will continue contracting on a year-on-year basis, albeit at a diminishing rate than now. While we projected a 6-8% rise in Chinese infrastructure investment for this year, most of that will be back-loaded to the second half of the year. In addition, modest and gradual steel demand increases from this source will not be able to offset the loss of demand from the property and automobile sectors. The oversupplied conditions in the Chinese steel market will become even more aggravated over the next three to six months. Reflecting the disparity between weak demand and resilient supply, steel inventories in the hands of producers and traders are surging, which also warrants much lower prices (Chart II-4). Chart II-3Deep Contraction In Steel Demand From Major Users Chart II-4Significant Build-Up In Steel Inventories Chart II-5Chinese Iron Ore Imports Will Likely Decline In 2020 Regarding iron ore, mushrooming steel inventories in China and lower steel prices will eventually lead to steel output cutbacks in the country. This will be compounded by shrinking steel production outside of China, dampening global demand for iron ore. Besides, in China, scrap steel prices have fallen more sharply than iron ore prices have. This makes the use of scrap steel more appealing than iron ore in steel production. Chinese iron ore imports will likely drop this year (Chart II-5). Finally, the global output of iron ore is likely to increase in 2020. The top three producers (Vale, Rio Tinto and BHP) have all set their 2020 guidelines above their 2019 production levels. This will further weigh on iron ore prices. Coal Although Chinese coal prices will also face downward pressure, we believe that the downside will be much less than that for steel and iron ore prices. Coal prices have already declined nearly 27% from their 2019 peak. They recently declined below 500 RMB per ton – the lower end of a range that the government generally tries to maintain. Prices had not dropped below this level since September 2016. In the near term, prices could go down by another 5-10%, given that record-high domestic coal production and imports have overwhelmed the market (Chart II-6). Coal prices have already declined nearly 27% from their 2019 peak. They recently declined below 500 RMB per ton – the lower end of a range that the government generally tries to maintain. However, there are emerging supportive forces. China Coal Transport & Distribution Association (CCTD), the nation’s leading industry group, on April 18, called on the industry to slash production (of both thermal and coking coal) in May by 10%. It also proposed that the government should restrict imports. The CCTD stated that about 42% of the producers are losing money at current coal prices. The government had demanded producers make similar cuts for a much longer time duration in 2016, which pushed coal to sky-high prices. The outlook for a revival in the consumption of electricity and, thereby, in the demand for coal is more certain than it is for steel and iron ore. About 60% of Chinese coal is used to generate thermal power. Finally, odds are rising that the government will temporarily impose restrictions on coal imports as it did last December – when coal imports to China fell by 70% as a result. Investment Implications Companies and countries producing these commodities will be hurt by the reduction of Chinese purchases. These include, but are not limited to, producers in Indonesia, Australia, Brazil and South Africa. Iron ore and coal make up 10% of total exports in Brazil, 6% in South Africa, 18% in Indonesia and 32% in Australia. Investors should avoid global steel and mining stocks (Chart II-7). Chart II-6Chinese Coal Output And Imports Are At Record Highs Chart II-7Avoid Global Steel And Mining Stocks For Now We continue to recommend shorting BRL, ZAR and IDR versus the US dollar. Ellen JingYuan He Associate Vice President ellenj@bcaresearch.com Footnotes Equities Recommendations Currencies, Credit And Fixed-Income Recommendations
Highlights Bulk commodity markets – chiefly iron ore and steel – could see sharp rallies once Chinese authorities give the all-clear on COVID-19 (the WHO’s official name for the coronavirus). These markets rallied sharply Tuesday, as President Xi vowed China would achieve its growth targets this year, which, all else equal, likely will require additional monetary and fiscal stimulus. China accounts for ~ 70% of the global trade in iron ore, and ~ 50% of global steel supply and demand. COVID-19-induced losses have hit Chinese demand for steel hard, forcing blast furnaces to sharply reduce output. However, this partly is being countered by transitory weather- and COVID-19-related disruptions that are reducing iron ore exports from Brazil and delaying Australian shipments. Iron ore inventories could be drawn hard in 2Q and 2H20 to meet demand as steelmakers rebuild stocks and construction and infrastructure projects restart (Chart of the Week). The Chinese Communist Party celebrates its 100th anniversary next year. To offset the COVID-19-induced drag on domestic growth this year, which could take GDP growth below 5%, and a weak GDP performance next year additional stimulus is an all-but-foregone conclusion. Feature When policymakers really want to jumpstart GDP growth, their playbook typically turns to the real economy via policies that encourage construction, infrastructure development and manufacturing. There is a compelling case a strong rally in iron ore and steel will accompany the containment of COVID-19, reversing the 14% and 4% declines in both since the start of the year (Chart 2). Chief among the drivers of the rally will be the increase in fiscal and monetary stimulus required to restore Chinese GDP growth disrupted by the COVID-19 outbreak, which could reduce annual growth closer to 5% than the ~ 6% rate policymakers were targeting. Chart of the WeekLow Iron Ore Stocks Setting Up A Rally Chart 2Policy Stimulus Will Reverse Declines In Iron Ore And Steel Prices There are a number of reasons for expecting this. 2020 marks the terminus of the decade-long policy evolution that was supposed to end with the realization of the “Chinese Dream.” Chief among the goals that were to be realized by the end of this year – which will usher in the 100th anniversary of the founding of the Chinese Communist Party in 2021 – are a doubling of per capita income and of GDP.1 The Communist Party in China has numerous policy levers it can pull to respond to worse-than-expected growth and economic shocks. These policies consume a lot of bulk commodities and base metals. When policymakers really want to jump-start GDP growth, their playbook typically turns to the real economy via policies that encourage construction, infrastructure development and manufacturing. This was clearly seen following the Global Financial Crisis (GFC) in 2008-09 (Chart 3). Even before the COVID-19 outbreak, policymakers made it clear they wanted to stabilize growth following the Sino-US trade war at the conclusion of the Central Economic Work Conference (CEWC) in December. Nominal wages and per capita income growth had been falling since 3Q18, imperilling one of the principal goals of the “Chinese Dream.” Chart 3Policy Stimulus Will Lift GDP And Iron Ore And Steel Prices Policymakers will aim for annualized quarterly growth of ~ 6.5% in 2Q- 4Q20 if their goal is simply to achieve 6% p.a. growth this year. Following that CEWC meeting, our colleagues at BCA’s China Investment Strategy (CIS) anticipated policymakers would announce growth targets at the National People’s Congress (NPC) meeting next month in the range of 5.8 and 6.2% p.a. growth, noting, “the Chinese economy needs to increase by 6% in 2020 to double its size from the 2010 level in real terms.”2 The growth rate required to put the economy on track to deliver on the “Chinese Dream” is now much higher following the COVID-19 outbreak, which could shave ~1% or more off China’s growth this year alone. This suggests policymakers will aim for annualized quarterly growth of ~ 6.5% in 2Q-4Q20 if their goal is simply to achieve 6% p.a. growth this year. This predisposes us to expect significant monetary and fiscal stimulus this year after the all-clear is sounded and the economy can return to its day-to-day activities. In addition – and by no means least of the concerns driving policymakers’ decisions – the 100th anniversary of the founding of the CCP will be celebrated next year, something policymakers at all levels have been looking forward to showcase the success of their revolution. A Boon For Bulks As monetary policy eases, the construction growth trajectory should pick up smartly. China accounts for ~ 70% of the global trade in iron ore. It is expected to import ~ 1.1 billion MT this year and next, based on estimates published by the Australian government’s Department of Industry, Innovation and Science in its December 2019 quarterly assessment (Chart 4). China will account for ~ 50% of global steel supply and demand, or roughly 900mm MT/yr in 2020 and 2021. The COVID-19 outbreak reduced utilization rates at the close to 250 steel mills monitored by Mysteel Global in China to 78%, a drop of 2.3pp.3 Platts estimates refined steel production could fall by 43mm MT by the end of February.4 Most of China’s steel output goes into commercial and residential construction (~ 35%), infrastructure (~20%), machinery (~ 20%), and automobile production (~ 7%), based on S&P Global Platts estimates.5 Residential construction began to recover last year, and residential housing inventories were declining relative to sales (Chart 5). In our view, once the COVID-19 infection rate falls outside Hubei Province – the epicenter of the outbreak – markets will begin pricing in a revival of commercial and residential construction in China. As monetary policy eases, the construction growth trajectory should pick up smartly (Chart 6). Chart 4China Dominates Iron Ore, Steel Markets Chart 5Resumption Of Construction Will Lift Demand For Bulks Chart 6Easier Money And Credit Policy Will Revive Construction Infrastructure spending already was on track to increase prior to the COVID-19 outbreak, based on our CIS colleagues’ reading of the CEWC statement issued in December, which “suggests fiscal support to the economy will mainly focus on infrastructure, and listed transportation, urban and rural development, and the 5G networks to be the government’s main investment projects next year.”6 This fiscal push will be supported by additional spending at the local government level, and by the issuance of special-purpose bonds by these governments with proceeds earmarked for infrastructure development (Chart 7). “A bigger fiscal push by the central government, coupled with a frontloading of 2020 local government special-purpose bond issuance, will likely boost infrastructure spending to around 10% in the first two quarters, doubling the growth in the first eleven months of 2019,” according to our CIS colleagues. Chart 7Pump Priming Will Boost Infrastructure Spending Bottom Line: Infrastructure fixed asset investment will be supported by easier credit and fiscal policy in China. Whether it rises at double-digit growth rates remains to be seen, however. Expect Chinese Consumers To Come Out Spending Infrastructure fixed asset investment will be supported by easier credit and fiscal policy in China. Prior to the outbreak of COVID-19, consumer confidence was running high (Chart 8), and employment prospects have bottomed and turned higher, although they still indicate contraction. (Chart 9). This boded well for consumer-spending expectations, particularly for autos (Chart 10). Chart 8Consumer Confidence Was High Prior to COVID-19 Outbreak ... Chart 9... And Job Prospects Were Improving ... At ~ 7%, China’s automobile production remains a marginal contributor to overall steel consumption. Nonetheless, a meaningful pickup in automobile production following the depressed growth rate of the past 15 months would move steel demand upward. China’s share of world auto sales is ~30% (Chart 11). Chart 10... Thus Lifting Prospects For Chinese Auto Sales Chart 11Policy Stimulus Will Revive Chinese Auto Sector Accommodative monetary and fiscal policies in China point toward higher growth for the auto sector. However, it is important to note the revival in auto production needs to be driven by consumer demand – if it is led simply by restocking, the rebound will not be sustainable. The recovery we are expecting will support steel and metal consumption at the margin, but the outlook for infrastructure and construction remains key due to their higher weight in total steel consumption. Bottom Line: Auto consumption and production were recovering in late 2019; however, the strength of the recovery did not match previous stimulus programs (2009 and 2016). The recovery we are expecting this year will support steel and metal consumption at the margin, but the outlook for infrastructure and construction remains key due to their higher weight in total steel consumption. If these other sectors remain constructive for metal demand (or at least are not contracting or slowing drastically), the boost from the auto sector will meaningfully contribute to higher iron ore and steel prices. Robert P. Ryan Chief Commodity & Energy Strategist rryan@bcaresearch.com Hugo Bélanger Associate Editor Commodity & Energy Strategy HugoB@bcaresearch.com Commodities Round-Up Energy: Overweight Oil prices halted their decline and rose 1% on Tuesday as the number of daily confirmed cases of the Wuhan coronavirus decelerated in China. As of Tuesday, the daily growth in cases dropped to 5%, down from 6% the previous day. Investors will closely monitor this number for any sign of a durable slowdown in daily confirmed cases. Separately, the US Energy Information Administration revised down its global demand growth estimates for 2020 to 1.0mm b/d from 1.3mm b/d last month, reflecting the effects of the coronavirus and warmer-than-expected January temperatures in the northern hemisphere. We will be updating our global oil balances next week. Base Metals: Neutral Iron ore prices fell 14% since the COVID-2019 outbreak in January. Investors are assessing how the iron ore market will balance weaker demand expectations in China amid lower supply – largely a result of falling Brazilian ore exports. Brazil’s total iron ore exports fell ~19% y/y in January due to heavy rainfall and lower production at Brazilian miner Vale. The company’s output never fully recovered from the 2019 dam incident and remains a risk to iron ore supply in 1Q20. Vale lowered its March sales guidance by 2mm MT. Low Chinese port inventories raise prices’ vulnerability to supply disruptions (Chart 12). Precious Metals: Neutral Gold remains well bid despite a strong US dollar, fueled by safe-haven demand. The yellow metal’s price fell slightly on Tuesday as investors’ concerns over the coronavirus eased. Based on our fair-value model, prices averaged $55/oz above our estimate in January. Investors – i.e. global ETF holders and net speculative positions reported by the US CFTC – have been important contributors to the latest gold rally. Investors’ total holding of gold reached a record high 113mm oz last week. Nonetheless, we believe there is still opportunity for this group to further support prices: the share of gold allocation vs. world equity-market capitalization is still low at 0.24%, vs. its peak of 0.42% in 2012 (Chart 13). Ags/Softs: Underweight March wheat futures were down 1.8% at Tuesday’s close, settling at the lowest level of the year after the USDA called for ‘stable supplies’ of the grain for the 2019/2020 U.S. marketing year. For corn, ending stocks were unchanged relative to the January projection, while world production was revised slightly upwards. March corn futures finished 2¢ lower at $3.7975/bu. The USDA also estimated higher soybean exports on the back of increased sales to China. However, soybean price gains were limited by higher production and ending stocks abroad. Chart 12Low Iron Ore Inventory Raises Exposure To Supply Disruptions Chart 13A Higher Share Of Gold Holdings Could Support Prices Further Footnotes 1 The “Chinese Dream” is a phrase coined by President Xi Jinping, following the 18th Party Congress of the Chinese Communist Party in 2012, when the overarching goal of transforming China into a “moderately well-off society” was memorialized in writing. These goals were crystalized in terms of progress expected in per capita income and GDP, both of which were to be doubled in the decade ending this year. Please see Why 2020 Is a Make-or-Break Year for China published by thediplomat.com February 13, 2015. 2 Please see A Year-End Tactical Upgrade, published by BCA Research’s China Investment Strategy December 18, 2019, for an in-depth analysis of policy guidance coming out of the Economic Work Conference last December. It is available at cis.bcaresearch.com. 3 Please see WEEKLY: China’s blast furnace capacity use drops to 78% published by Mysteel Global February 10, 2020. 4 Please see China steel consumption to plunge by up to 43 mil mt in February due to coronavirus published February 6, 2020, by S&P Global Platts. 5 Please see China Macro & Metals: Steel output falls, but property creates bright spots published by S&P Global Platts December 6, 2019. 6 Please see footnote 2 above. Investment Views and Themes Recommendations Strategic Recommendations Tactical Trades TRADE RECOMMENDATION PERFORMANCE IN 2019 Q4 Commodity Prices and Plays Reference Table Trades Closed in 2020 Summary of Closed Trades