Technology
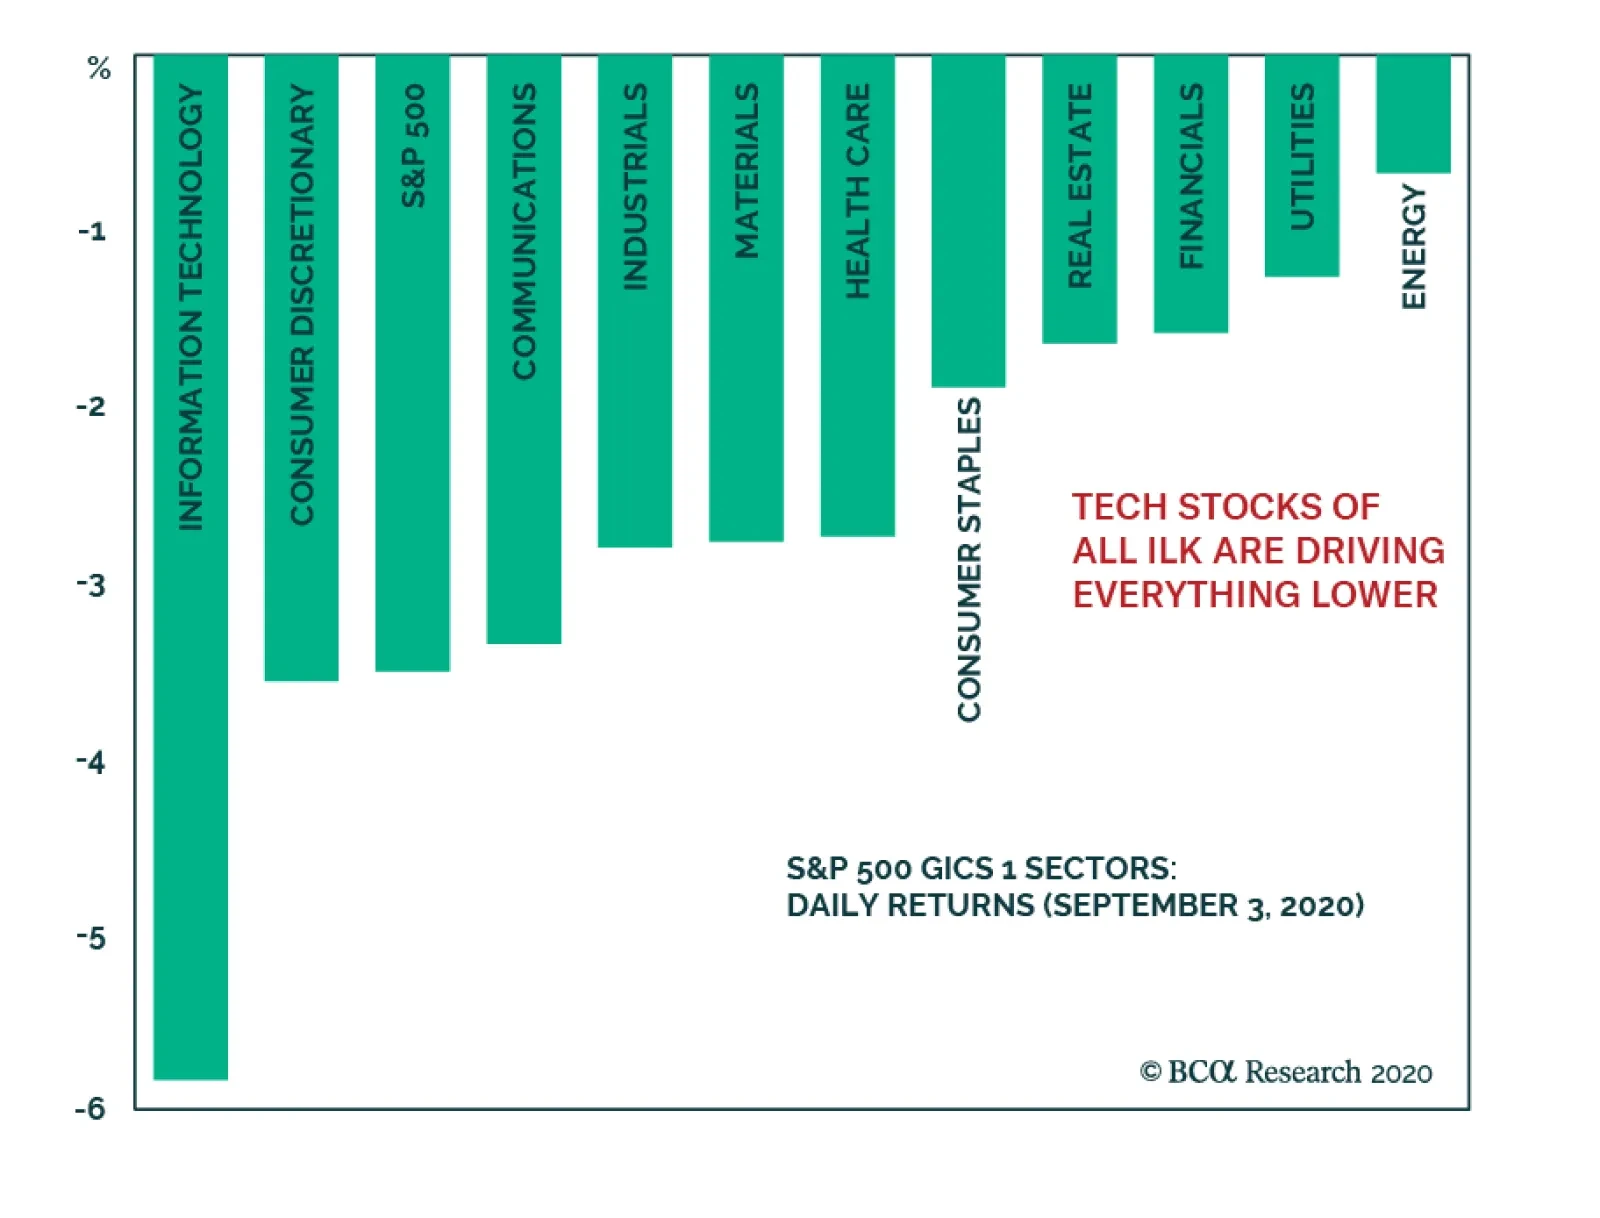
The overstretched tech stocks finally buckled after an exceptional run. The correction taking shape in those widely held stocks that have driven the entire S&P 500 higher has caused the whole market to fall as well. However, value stocks are…

Chart 1
Chart 1
Chart 1
Today, we continue cautioning investors about how overstretched the equity market is and highlight a few key reasons not to chase it higher; especially technology stocks. The top five stocks in the SPX (AAPL, MSFT, AMZN, GOOGL & FB) have added $5.8tn to the S&P 500 market cap since 2015, whereas the bottom 495 stocks have added $5.1tn. Crudely put, as a contribution the SPX’s return the former account for 53%, whereas the bottom 495 stocks account for the remaining 47% of the advance over the same time frame. In percent return terms, these five tech titans’ market capitalization has more than quadrupled or risen by 350% over the past 5 ½ years from $1.67tn to $7.5tn. In marked contrast, the S&P 495 market cap has gone nowhere rising a mere 31% (increasing from 16.57tn to $21.7tn) during the same time frame (Chart 1, top panel). If investors have not been in these tech titans, then they have not really participated in the SPX’s run up. The measly return since 2015 in the Value Arithmetic index and negative return in the Value Line Geometric index gauging the mean and median US stock, respectively, corroborate our analysis (not shown). Chart 2
Chart 2
Chart 2
Drilling deeper, the over concentration risks become even more apparent, even within the tech universe itself. Chart 2 shows that the S&P tech sector excluding AAPL & MSFT is just above the February highs, and nearly all the tech related return sits with the top five titans that are up almost 60% year-to-date (ytd). Worrisomely, the remaining S&P 426 stocks (which exclude all the tech names) are down 6% ytd. Once again, Chart 2 further reiterates the message that even the tech sector is a bifurcated market where only a handful of stocks have been generating all the alpha. Such extreme concentration, while not unprecedented, is a sign of an unhealthy overall market backdrop which makes it vulnerable to a significant shock. Chart 3
Chart 3
Chart 3
Naturally, the overconcentration in the SPX is even more acute in the NASDAQ. While the top five SPX stocks comprise over a quarter of the index, the same five tech titans carry a 50% weight in the NASDAQ 100. True, the collapse in interest rates has boosted the NASDAQ forward P/E to the stratosphere, but the longer these high-flying stocks defy gravity the more painful the eventual snap will be (Chart 3, bottom panel). Already there are signs of trouble brewing beneath the surface. NASDAQ breadth is sinking, and this has proven a reliable leading indicator in the recent past, warning that a pullback is looming (Chart 3, top panel). The hypersensitive chip stocks are also suffering from exhaustion, unable to outperform the tech titan led NASDAQ (Chart 3, middle panel). Any hiccups in the tech space will negatively reverberate in the SPX: currently the S&P tech sector plus the FANG (FB, AMZN, NFLX & GOOGL) comprise 41% of the S&P 500. Chart 4
Chart 4
Chart 4
Switching gears and drilling deeper into an S&P tech sub-group doesn’t brighten the short-term picture. The S&P technology hardware storage & peripherals (HS&P) index is in unchartered territory. The second panel of Chart 4 shows that the relative share price ratio is at the highest level as a percentage of its 200-day moving average since the late-1990s. Shown as a z-score, this technical indicator is stretched to the tune of almost four standard deviations above the historical mean (Chart 4, third panel). The last two times technical conditions were so overbought, it marked a multi-year peak in relative performance (Chart 4, top panel). Given that this sub-sector is home to AAPL, such extreme readings even on the index level confirm that the market is vulnerable to a snapback. Chart 5
Chart 5
Chart 5
Finally, going down to a stock level a couple of historical parallels are also in order. Specifically, Chart 5 compares the titans of the late 20th century with the current market leaders. The second and bottom panels of Chart 5 reveal that the market capitalization concentration of the top five stocks in the S&P 500 surpassed the late-1990s. However, there is an offsetting factor. In terms of valuation overshoot, the current 12-month forward P/E of these top five stocks near 45x is 3/4 that of late-1990s parabolic episode (Chart 5, top & third panels). Bottom Line: While we maintain a cyclical and structural (please see upcoming Weekly Report after Labor Day) bullish stance in the broad equity market, the shorter-term risk/reward trade-off is tilted to the downside, especially in the technology universe.
Highlights EM domestic fundamentals, global trade and commodities prices, as well as global financial market themes are the main drivers of EM financial assets and currencies. The positive effect of improving global growth and rising commodity prices on EM currencies (ex-China, Korea and Taiwan) has been offset by these countries’ inferior domestic fundamentals. The odds of a near-term US dollar rebound are rising. This will likely produce a setback in EM currencies, fixed-income markets and equities. However, such a setback will likely prove to be a buying opportunity. Increased central bank intervention in asset markets may diminish the importance of fundamentals in determining the asset prices. Feature Chart I-1Unusual Divergences
Unusual Divergences
Unusual Divergences
EM risk assets have done well in absolute terms but have underperformed their DM counterparts. This is unusual given the substantial weakness in the US dollar and the rally in commodities prices since April (Chart I-1). Until early this year, many commentators had argued that monetary policies of DM central banks were the principal drivers of EM financial markets. Given the zero interest rates and money printing that is prevalent in DM, the underperformance of EM equities and currencies is especially intriguing. Is this underperformance an aberration or is it fundamentally justified? What really drives EM performance? Back To Basics As we have argued over the years, EM risk assets and currencies are primarily driven by their domestic fundamentals, rather than by the actions and policies of the US Federal Reserve or the ECB. The critical determinant of EM stocks’ absolute as well as relative performance versus DM equities has been corporate profits. Chart I-2 illustrates that relative equity performance and relative EPS between EM and the US move in tandem, both in common and, critically, local currency terms. Similarly, the main reason why EM share prices in absolute terms have failed to deliver positive returns over the past 10 years is that their profits have been stagnant over the same period, even prior to the pandemic (Chart I-3). Interestingly, fluctuations in EM EPS resemble those of Korea’s exports. This reflects the importance of global growth in shaping EM profit trends. Chart I-2Corporate Profits Drive EM Absolute And Relative Performance
Corporate Profits Drive EM Absolute And Relative Performance
Corporate Profits Drive EM Absolute And Relative Performance
Chart I-3EM EPS Has Been Flat For 10 Years
EM EPS Has Been Flat For 10 Years
EM EPS Has Been Flat For 10 Years
The key drivers of EM risk assets and currencies have been and remain: 1. EM domestic fundamentals that can be encapsulated by a potential risk-adjusted return on capital. The latter is impacted by both cyclical and structural growth trajectories, as well as by the quality and composition of growth. Risks to growth can be gauged based on factors such as (but not limited to): productivity, wages, inflation, fiscal and balance of payment positions, the global economic and financial environment, and the health of the banking system. In EM (ex-China, Korea and Taiwan), the fundamentals remain challenging: The business cycle recovery is slower in these economies than it is in China and advanced economies. Fiscal stimulus has not been as large as in many advanced countries, while the pandemic situation has been worse. Their banking systems were already fragile before the pandemic, and have lately been hit by defaults stemming from the unprecedented recession. These governments have less room than in DM and China, to stimulate fiscally and bail out debtors and banks. Banks in EM (ex-China, Korea and Taiwan) will continue struggling for some time, and their ability to finance a new expansion cycle will, for now, remain constrained (Chart I-4). A restructuring of non-performing loans and a recapitalization of banks will be required to kick-start a new credit cycle in many of these economies. 2. Global growth, especially relating to China’s business cycle and commodities. The recovery in China since April, along with rising commodities prices have been positive for EM (ex-China, Korea and Taiwan). Given the substantial stimulus injected into the Chinese economy, its recovery will continue well into next year (Chart I-5). As a result, higher commodities prices will benefit resource producing economies by supporting their balance of payments and enhancing income growth. Chart I-4EM ex-China: Limited Bank Support For Growth
EM ex-China: Limited Bank Support For Growth
EM ex-China: Limited Bank Support For Growth
Chart I-5China's Stimulus Entails More Upside In Commodity Prices
China's Stimulus Entails More Upside In Commodity Prices
China's Stimulus Entails More Upside In Commodity Prices
3. Global financial market themes: a search for yield and leadership of new economy stocks. Global investment themes have an important bearing on EM financial markets. For example, in recent years, the increased market cap of new economy and semiconductor stocks – due to an exponential rise in their share prices – has amplified their importance for the aggregate EM equity index. The largest six mega cap stocks in the EM benchmark are new economy and semiconductor companies, and make up about 25% of the EM MSCI market cap. The six FAANGM stocks presently account for about 25% of the S&P 500. Hence, the concentration risk in EM is as high as it is in the US. Consequently, the trajectory of new economy and semiconductor stocks globally will be essential to the performance of the EM equity index. On August 20, we published an in-depth Special Report assessing near-term and structural outlooks for global semiconductor stocks. With new economy and semiconductor share prices going parabolic worldwide, we are witnessing a full-fledged mania, as we discussed in our July 16 report. The equal-weighted US FAANGM stock index has risen by 24-fold in nominal and 20-fold in real (inflation-adjusted) terms, since January 1, 2010 (Chart I-6). Chart I-6History Of Manias Of Past Decades
History Of Manias Of Past Decades
History Of Manias Of Past Decades
In brief, with respect to magnitude and duration, the bull market in FAANGM is on par with the bubbles of previous decades (Chart I-6). Those bubbles culminated in bear markets, where prices fell by at least 50% after topping out. Chart I-7EM ex-TMT Stocks: Absolute And Relative Performance
EM ex-TMT Stocks: Absolute And Relative Performance
EM ex-TMT Stocks: Absolute And Relative Performance
We do not know when the FAANGM rally will end. Timing a reversal in a powerful bull market is impossible. Also, we are not certain about the magnitude of such a potential drawdown. Nevertheless, our message is that the risk-reward tradeoff of chasing FAANGM at this stage is very unattractive. Excluding technology, media and telecommunication (TMT) – as most growth stocks are a part of TMT– EM equities remain in a bear market (Chart I-7, top panel). In relative terms, EM ex-TMT stocks have massively underperformed their global peers (Chart I-7, bottom panel). Even with a larger weighting of mega-cap growth TMT stocks than the overall DM equity index, the aggregate EM equity index has underperformed the overall DM index. Bottom Line: EM domestic fundamentals, global trade and commodities prices, and global financial market themes are the main drivers of EM financial assets and currencies. What About The Dollar? The high correlation of the trade-weighted US dollar and EM equities is due to the following: (1) the greenback has been a countercyclical currency; and (2) the US dollar’s exchange rate against EM currencies reflects relative fundamentals in the US versus EM economies. When a global business cycle accelerates, the broad trade-weighted US dollar weakens. If this growth acceleration is led by China and other emerging economies, the greenback depreciates considerably versus EM currencies. The opposite is also true. In other words, the US dollar exchange rate’s strong negative correlation to EM equities is primarily due to the fact that the greenback’s exchange rates against EM currencies reflect both the global business cycle as well as EM growth and fundamentals. Chart I-8Divergence Between DM And EM Currencies
Divergence Between DM And EM Currencies
Divergence Between DM And EM Currencies
In recent months, the greenback has: (1) depreciated due to the global economic recovery; (2) tumbled versus DM currencies due to the still raging pandemic and the socio-political instability in the US as well as the Fed’s commitment to staying behind the inflation curve in the years to come; and (3) not fallen much against EM (ex-China, Korea and Taiwan) currencies because their fundamentals have been poor, as discussed above. Bottom Line: Exchange rates in EM (ex-China, Korea and Taiwan) have failed to appreciate versus the dollar despite the latter’s plunge versus other DM currencies (Chart I-8). The positive effect of improving global growth and rising commodities prices on EM currencies (ex-China, Korea and Taiwan) has been offset by these countries’ inferior domestic fundamentals. Flows And Cash On The Sidelines Chart I-9Cash On The Sidelines Has Been Produced By The Fed's Debt Monetization
Cash On The Sidelines Has Been Produced By The Fed's Debt Monetization
Cash On The Sidelines Has Been Produced By The Fed's Debt Monetization
What about capital flows? Aren’t they essential in driving EM financial markets? Of course, they are important. However, we view flows as resulting from and determined by fundamentals. Over the medium and long term, we assume that capital flows to regions where the return on capital is high or rising. Thus, we see ourselves as responsible for directing investors to those areas that we have identified as providing a high or rising return on capital (and cautioning investors when the opposite is true). The presumption is that beyond short-term volatility, investment flows will gravitate to countries/sectors/asset classes with high or rising returns on capital, just as they will abandon areas of low or falling returns on capital. In brief, fundamentals drive flows and flows determine asset price performance. Isn’t sizable cash on the sidelines a reason to be bullish? Yes, there is substantial cash on the sidelines. Along with zero short-term rates, this has been the potent force leading investors to purchase equities, credit and other risk assets since late March. Below we examine the case of the US, but this has also been true in many markets around the world. The top panel of Chart I-9 demonstrates that US institutional and retail money market funds – a measure of cash on the sidelines - presently stand at $4.2 trillion, having increased by $900 billion since March. Yet, the Fed and US commercial banks have increased their debt securities holdings by $2.9 trillion since March. Furthermore, the Fed and US commercial banks hold $10.6 trillion of debt securities (Chart I-9, middle panel) – amounting to 18% of the aggregate equity and US dollar fixed-income market value (Chart I-9, bottom panel). These securities, held by the Fed and US commercial banks, are not available to non-bank investors. Chart I-10Investors' Cash Holdings Ratio Is Still Elevated
Investors' Cash Holdings Ratio Is Still Elevated
Investors' Cash Holdings Ratio Is Still Elevated
Excluding debt securities owned by the Fed and commercial banks, we reckon that cash on the sidelines is equal to 8.4% of the value of equities and US dollar debt securities available to non-bank investors (Chart I-10). This is a relatively high cash ratio. Unprecedented purchases by the Fed and US commercial banks have not only removed a considerable chuck of debt securities from the market; they have also created money “out of thin air”. When central or commercial banks acquire a security from, or lend to, a non-bank entity, they are creating new money “out of thin air”. No one needs to save for the central bank and commercial banks to lend to or purchase a security from a non-bank. In short, savings versus spending decisions by economic agents (non-banks) do not affect the stock of money supply. We have deliberated on these topics at length in past reports. In sum, the Fed’s large purchases of debt securities amount to a de facto monetization of public and private debt. These operations have both reduced the amount of securities available to investors and boosted the latter’s cash balances. Hence, the Fed has boosted asset prices not only indirectly, by lowering short-term interest rates, but also directly, by printing new money and shrinking the amount of securities available to investors. We have in recent months argued that global risk assets are overpriced relative to fundamentals. However, investors have continued to deploy cash in asset markets, pushing prices higher. Given the zero money market interest rates and the still elevated cash balances, one can envision a scenario in which cash continues to be deployed in asset markets, pushing valuations to bubble levels across all risk assets. Pressure on investors to deploy their cash amid rising asset prices implies that only a major negative shock might be able to reverse this rally. There have been plenty of reasons to be cautious, including escalating US-China geopolitical tensions, the increasing odds of a contested US presidential election and, hence, elevated political uncertainty, the possibility of a US fiscal cliff, and a potential second wave of the pandemic. However, investors have so far shrugged off all of these and continue to allocate capital to risk assets. Bottom Line: Increased central bank intervention in asset markets may diminish the importance of fundamentals in determining the price of risk assets. This would also mean that the role of momentum investing and psychology may increase. Investment Strategy Currencies: The US dollar has become oversold and could stage a rebound in the near term. The euro has risen to its technical resistance (Chart I-11). The EM currency index (ex-China, Korea and Taiwan) has failed to break above its 200-day moving average (Chart I-12, top panel). The emerging Asian trade-weighted currency index (ADXY) has rebounded to the upper boundary of its falling channel (Chart I-12, bottom panel). Chart I-11A Short-Term Resistance For Euro/USD
A Short-Term Resistance For Euro/USD
A Short-Term Resistance For Euro/USD
Chart I-12EM Currencies Have Not Entered A Bull Market
EM Currencies Have Not Entered A Bull Market
EM Currencies Have Not Entered A Bull Market
Such technical profiles suggest that EM currencies have not yet entered a bull market despite the greenback’s considerable depreciation against DM currencies. This is a reflection of the poor fundamentals of EM (ex-China, Korea and Taiwan). In short, the odds of a US dollar rebound are rising. This could dent commodities prices and weigh on EM currencies. We continue recommending shorting a basket of EM currencies versus the euro, CHF and JPY. The downside in these DM currencies versus the greenback is limited. The euro could drop to 1.15, but not much below that level. Our basket of EM currencies to short includes: BRL, CLP, ZAR, TRY, PHP, KRW and IDR. Chart I-13EM Local Currency Bonds: Looking For A Better Entry Point
EM Local Currency Bonds: Looking For A Better Entry Point
EM Local Currency Bonds: Looking For A Better Entry Point
Fixed-Income Markets: We have been neutral on EM local currency bonds and EM credit markets (USD bonds) since April 23 and June 4, respectively. The strategy is to wait for a correction in these markets before going long. The rebound in the US dollar and correction in commodities will provide a better entry point for these fixed-income markets (Chart I-13). Equities: On July 30, we recommended shifting the EM equity allocation within a global equity portfolio from underweight to neutral. In the near term, EM share prices will likely continue underperforming their DM counterparts. A bounce in the US dollar, rising geopolitical tensions between the US and China, as well as the continuation of a FAANGM-driven mania in US equities will result in EM equity underperformance versus DM. However, in the medium- to long-term, the balance of risks no longer justifies an underweight allocation. Arthur Budaghyan Chief Emerging Markets Strategist arthurb@bcaresearch.com Equities Recommendations Currencies, Credit And Fixed-Income Recommendations
Highlights President Trump is making a comeback in our quantitative election model. An upgrade from our 35% odds of a Trump win is on the horizon, pending a fiscal relief bill. The Fed’s pursuit of “maximum employment,” the necessities of the pandemic response, fiscal largesse, a US shift toward protectionism, and the strategic need to counter China will pervade either candidate’s presidency. A Democratic “clean sweep” would add insult to injury for value stocks, but these stocks don’t have much more downside relative to growth stocks. Trump’s tariffs, or Biden’s taxes, will hit the outperformance of Big Tech, as will the recovery of inflation expectations. Feature More than at any time in recent US history, voters believe that the 2020 election is definitive in charting two distinct courses for the country (Chart 1). No doubt 2020 is an epic election with far-reaching implications. However, from an investment point of view, a Trump and a Biden administration have more in common than consensus holds. Chart 1An Epic Choice About The US’s Future
Trump Versus Biden: Tariffs Versus Taxes
Trump Versus Biden: Tariffs Versus Taxes
The US political parties have finalized their policy platforms, giving investors greater clarity about what policies the parties will try to implement over the next four years.1 While the presidential pick is critical for American foreign and trade policy, the Senate is just as important as the president for US equity sectors. The only dramatic changes would come if the Democrats achieved a clean sweep of government – yet this result is likely as things stand today (Chart 2). Investors should prepare. It would prolong the suffering of value stocks relative to growth stocks by hitting the US health care and energy sectors hard. Chart 2“Blue Wave” Still The Likeliest Scenario
Trump Versus Biden: Tariffs Versus Taxes
Trump Versus Biden: Tariffs Versus Taxes
The State Of Play A “Blue Wave” is still the likeliest outcome – and that’s where the stark policy differences emerge. The race is tightening. Our quantitative election model looks at state leading indicators, margins of victory in 2016, the range of the president’s approval rating, and a “time for change” variable that gives the incumbent party an advantage if it has not been in the White House for eight years. The model now shows Florida as a toss-up state with a 50% chance of flipping back into the Republican fold (Chart 3). Chart 3Florida Now 50/50 In Our Election Quant Model – 45% Chance Of Trump Win
Trump Versus Biden: Tariffs Versus Taxes
Trump Versus Biden: Tariffs Versus Taxes
As long as the economy continues recovering between now and November 3, Florida should flip and Trump should go from 230 Electoral College votes to 259. One other state – plus one of the stray electoral votes from either Nebraska or Maine, which Trump is like to get – would deliver him the Oval Office again. The model says that Trump has a 45% chance of victory, up from 42% last month. Subjectively, we are more pessimistic than the model. Pandemic, recession, and social unrest have taken a toll on voters and unemployment is nearly three times as high as when Trump’s approval rating peaked in March. Consumer confidence is weak, albeit making an effort to trough. Voters take their cue from the jobs market more than the stock market, although the stock rally is certainly helpful for the incumbent. We await the completion of a new fiscal relief bill in Congress before upgrading Trump to closer to our model’s odds and the market consensus of 45%. Another Social Lockdown? COVID-19 subsiding in the US a boon for Trump in final two months of campaign. The first concern for the next president is COVID-19. On the surface Trump and Biden are diametrically opposed. President Trump is obviously disinclined to impose a new round of lockdowns and the Republican platform calls for normalizing the economy in 2021. By contrast, the Democrats claim they will contain the virus even at a high economic cost. Biden says he will be willing to shut down the entire US economy again if scientists deem it necessary.2 There is apparently political will for new draconian lockdowns – but it is not likely to be sustained after the election unless the next wave of the virus is overwhelming (Chart 4). Biden will need to be cognizant of the economy if he is to succeed. Chart 4Biden Has Some Support For Another Lockdown
Trump Versus Biden: Tariffs Versus Taxes
Trump Versus Biden: Tariffs Versus Taxes
However, it is doubtful that Trump would refuse to lock down the economy in his second term if his advisers told him it was necessary. After all, it is Trump, not Biden, who implemented the lockdowns this year. Arguably he reopened the economy too soon with the election in mind. But if that is true, then it isn’t an issue for his second term, since he can’t run for president a third time. This is a theme we often come back to: reelection removes a critical impediment to Trump’s policies in a second term as opposed to his first. Bottom Line: The coronavirus outbreak and the country’s top experts will decide if new lockdowns are warranted, regardless of president, but the bar for a complete shutdown is high. COVID-19 is subsiding in both the US and in countries like Sweden that never imposed draconian lockdowns (Chart 5). Still, given that the equity market has recovered to pre-COVID highs, investors would be wise to hedge against a bad outcome this winter. Chart 5Pandemic Subsiding In US And ‘Laissez-Faire’ Sweden
Trump Versus Biden: Tariffs Versus Taxes
Trump Versus Biden: Tariffs Versus Taxes
Maximum Employment The monetary policy backdrop will be ultra-dovish regardless of the presidency. The Fed is now pursuing average inflation targeting and “maximum employment,” according to Fed Chairman Jay Powell, speaking virtually on August 27 at the Kansas City Fed’s annual Jackson Hole summit. This means that if Trump wins, he will not have to fight running battles with Powell over rate hikes. The monetary backdrop for either president will be more reminiscent of that faced by President Obama from 2009-12 – extremely accommodative. It is possible that Trump’s “growth at all costs” attitude could lead to speculative bubbles that the Fed would need to prick. Already the NASDAQ 100 is off the charts. Elements of froth reminiscent of the dotcom bubble era are mushrooming (Chart 6). Nobody has any idea yet how the Fed will square its maximum employment mission with the need to prevent financial instability, but it will err on the side of low rates. Chart 6Frothy NDX
Frothy NDX
Frothy NDX
Chart 7The Mother Of All V-Shapes
The Mother Of All V-Shapes
The Mother Of All V-Shapes
Biden will be more likely to tamp down financial excesses through executive orders – or to deter excesses through taxes if he controls the Senate. But there is no reason the executive branch would be more vigilant than the Fed itself. Higher inflation will push real rates down and weaken the dollar almost regardless of who wins the presidency. Trump’s trade wars – and any major conflict with China – would tend to prop up the greenback relative to Biden’s less hawkish, more multilateral, approach. But either way the combination of debt monetization, twin deficits, and global economic recovery spells downside for the dollar. This in turn spells upside for the S&P500 and inflation-friendly (or deflation-unfriendly) equity sectors in the longer run (Chart 7). Fiscal Largesse The next president will struggle with a massive fiscal hangover resembling late 1940s. The Fed’s new strategy ensures that fiscal policy will prove the driving factor in the US macro outlook. Regardless of who wins the election, the budget deficit will fall from its extreme heights amid the COVID-19 crisis over the next four years (Chart 8). If government spending falls faster than private activity recovers, overall demand will shrink and the economy will be foisted back into recession. Chart 8Budget Deficit Will Decrease As Economy Normalizes
Budget Deficit Will Decrease As Economy Normalizes
Budget Deficit Will Decrease As Economy Normalizes
The deep 1948-49 recession occurred because of the government’s climbing down from wartime levels of spending (Chart 9). Premature fiscal tightening would jeopardize the 2021 recovery. Yet neither candidate is a fiscal hawk. Trump is a big spender; Biden is a Democrat. The House Democrats will control the purse strings. Republican senators, the only hawkish actors left, are not all that hawkish in practice. They agreed with Trump and the Democrats in passing bipartisan spending blowouts from 2017-20. They will likely conclude another such deal just before the election. Chart 9Sharp Deficit Correction Would Jeopardize Recovery
Sharp Deficit Correction Would Jeopardize Recovery
Sharp Deficit Correction Would Jeopardize Recovery
So Trump would maintain high levels of spending without raising taxes; Biden would spend even more, albeit with higher taxes. Table 1Biden Would Raise $4 Trillion In Revenue Over Ten Years
Trump Versus Biden: Tariffs Versus Taxes
Trump Versus Biden: Tariffs Versus Taxes
On paper, Biden would add a net ~$2 trillion to the US budget deficit over ten years, as shown in Tables 1 and 2. But these are loose costings. Nobody knows anything until actual legislation is produced. The risk to spending levels lies to the upside until the employment-to-population ratio improves (Chart 10). Trump’s net effect on the deficit is even harder to estimate because the Republican Party platform is so vague. What we know is that Trump couldn’t care less about deficits. Back of the envelope, if Congress permanently cut the employee side of the payroll tax for workers who earn less than $8,000 per month, as Trump has suggested, the deficit would increase by roughly $4.8 trillion over ten years.3 Table 2Biden Would Spend $6 Trillion In Programs Over Ten Years
Trump Versus Biden: Tariffs Versus Taxes
Trump Versus Biden: Tariffs Versus Taxes
Chart 10Massive Labor Slack Will Encourage Government Spending
Massive Labor Slack Will Encourage Government Spending
Massive Labor Slack Will Encourage Government Spending
House Democrats will hardly agree to any major new tax cuts – and certainly not gigantic ones that would “raid Social Security.” This accusation will be popular and Trump will want to avoid it during the campaign as well – his 2020 platform does not explicitly mention the payroll tax. Many of Trump’s other proposals would focus on extending the Tax Cut and Jobs Act. For example, it is possible that Trump could extend the full expensing of companies’ depreciation costs for capital purchases, set to expire in 2022 and 2026, to the tune of $419 billion over ten years.4 Thus the overall contribution of government spending to GDP growth will be higher than in the recent past. This trend was established prior to COVID (Chart 11). The rise of populism supports this prediction, as Trump has always insisted he will never cut mandatory (entitlement) spending – a major change to Republican orthodoxy now enshrined in its policy platform. Chart 11Government Role To Increase In America
Government Role To Increase In America
Government Role To Increase In America
Chart 12No Cuts To Defense Likely Either
No Cuts To Defense Likely Either
No Cuts To Defense Likely Either
Meanwhile Biden is not only rejecting spending cuts but also coopting the profligate spending agenda of the left wing of his party. Practically speaking, social spending cannot be cut by Trump – and yet Biden cannot cut defense spending much either, since competition with Russia and China is growing (Chart 12). The common thread in both party platforms is fiscal largesse at a time of monetary dovishness, i.e. reflation. Other Common Denominators Market is overrating Biden’s China friendliness. Both Trump and Biden promise to build infrastructure, energize domestic manufacturing, and lower pharmaceutical prices. The two candidates are competing vociferously over who will bring more American manufacturing jobs home. President Trump won the Republican nomination in 2016 partly because he stole the Democrats’ thunder on “fair trade” over “free trade.” Biden’s agenda is effusive on these Trump (and Bernie Sanders) themes – his party sees an existential risk in the Rust Belt if it cannot steal that thunder back. The manufacturing agenda centers on China-bashing. China runs the largest trade surplus with the US, it has a negative image in the public eye, and it has alarmed the military-industrial complex by rising to the status of a peer strategic competitor over the technologies of tomorrow. Where Trump once spoke of a “border adjustment tax,” or a Reciprocal Trade Act, Biden speaks openly of a carbon border tax: “the Biden Administration will impose carbon adjustment fees or quotas on carbon-intensive goods from countries that are failing to meet their climate and environmental obligations.”5 China’s coal-guzzling economy would obviously be the prime target. It is true that Biden will seek to engage China and reset the relationship. He will probably maintain Trump’s tariff levels or even slap a token new tariff, but he will then settle down for a two-track policy of dialogue with China and coalition-building with the democracies. The result may be a reprieve from strategic tensions for a year or so. Investors are exaggerating Biden’s positive impact on China relations, judging by the correlation of China-exposed US equities with the Democrats’ odds of winning. The truth is that Biden will maintain the Obama administration’s “Pivot to Asia,” which was about countering China. The secular power struggle will persist and China-exposed stocks, especially tech, will be the victims (Chart 13). Chart 13Market Over-Optimistic About Biden Vis-à-Vis China
Market Over-Optimistic About Biden Vis-à-Vis China
Market Over-Optimistic About Biden Vis-à-Vis China
Senate election will likely tip with White House – but checks and balances are best for equities. Control of the Senate will determine whether the big differences between the two candidates materialize. Biden can’t raise taxes without the Senate; Trump can’t wage trade wars of choice as Congress is supreme over commerce and could take his magic tariff wand away from him. Trump can use executive orders to pare back immigration, but he cannot force the House Democrats to approve a southern border wall. In fact, he dropped “the Wall” from his agenda this time around. (It didn’t help that former Trump adviser Steve Bannon has been arrested for allegedly scamming people out of their money to pay for a wall.) Biden will be far looser on immigration than Trump and the reviving economy will attract foreign workers. But the Obama administration showed that during times of high unemployment, even Democrats have a limit to the influx they will allow (Chart 14). Meanwhile Biden can use executive orders to impose aspects of his version of the Green New Deal, but he cannot pass carbon pricing laws or other sweeping climate policy if Republican Senators are there to stop him. For this reason, a divided government is likely to produce three cheers from the markets. The single most market-positive scenario is Biden plus a Republican Senate, which suggests a moderation of the trade war and yet no new taxes. Second best would be Trump with a Democratic Congress that would clip his wings on tariffs, but enable him to veto any anti-market laws. The stock market’s performance to date is more reminiscent of a “gridlock” election outcome, in which the two parties split the executive and legislative branches of government in some way, as opposed to a unified single-party government (Chart 15). Chart 14Immigration Faces Limits Even Under Democrats
Trump Versus Biden: Tariffs Versus Taxes
Trump Versus Biden: Tariffs Versus Taxes
Chart 15Stock Market Expects Gridlock?
Stock Market Expects Gridlock?
Stock Market Expects Gridlock?
Investors should not be complacent, however, because the political polling so far suggests that the Senate race is on a knife’s edge. The balance of power will tilt whichever way the heavily nationalized, heavily polarized White House race tilts (Chart 16). A “blue sweep” is still a fairly high probability. Indeed a Biden win will most likely produce a Democratic sweep while a Trump win will produce the status quo. Chart 16Tight Senate Races Will Turn On White House Race
Trump Versus Biden: Tariffs Versus Taxes
Trump Versus Biden: Tariffs Versus Taxes
Biden’s Agenda After A Blue Sweep Democrats would remove the filibuster – another big difference in outcomes. Biden is more likely to benefit from Democratic control of Congress if he wins. He is also more likely to rely on his top advisers and the party apparatus. Hence the Democratic platform matters more than the Republican platform in this cycle. Investors should set as their base case that a new president will largely succeed in passing his top one or two priorities. Less conviction is warranted after the initial rush of policymaking, as political capital will fall and the economic context will change. But in the honeymoon period, a president can get a lot done, especially if his party controls Congress. Investors would have been wrong to bet against George W. Bush’s Economic Growth and Tax Relief Act (2001), Barack Obama’s Affordable Care Act (2009), or Trump’s Tax Cut and Jobs Act (2017). Yet they could never have known that COVID-19 would strike in Trump’s fourth year and overturn the very best macroeconomic forecasts. Critically, if Democrats take the Senate, our base case is that they will remove the filibuster, i.e. the use of debate to block legislation. Biden has suggested that he would look at doing so. President Obama recently linked it to racist Jim Crow laws of the late nineteenth and early twentieth centuries, making it hard for party members to defend keeping the filibuster. Senate minority leader Charles Schumer (D, NY) has signaled a willingness to change the Senate rules if he becomes majority leader. Removing the filibuster would change the game of US lawmaking, enabling the Senate to pass laws with a simple majority of 51 votes – i.e. 50 plus a Democratic vice president. This is entirely within reach. While a handful of moderate Democratic senators may oppose such a dramatic move at first, the Democratic Party leadership will corral its members once it faces the reality of the 60-vote requirement blocking its agenda. The party will remember the last time it took power after a national crisis, in 2009, and the frustrations that the filibuster caused despite having at that time a much stronger Senate majority than it can possibly have in 2021. Populism is rife in the US and it is all about shattering norms. Moreover, the filibuster has already been eroding over the past two administrations (vide judicial appointments). Revoking it would enable Democrats to pass a lot more ambitious legislation, and many more laws, than in previous administrations. This is important because Biden’s agenda is more left-wing than some investors realize given his history as a traditional Democrat. In order to solidify the increasingly powerful progressive faction of his party, symbolized by Vermont Senator Bernie Sanders, Biden created task forces to merge his agenda with that of Sanders. Sanders and his fellow progressive Senator Elizabeth Warren of Massachusetts have much more influence in the party than their 35% share of the Democratic primary vote implies. The youth wing of the party shares their enthusiasm for Big Government. Here are the key structural changes that matter to investors: Offering public health insurance – A public health option will benefit from government subsidies and thus outcompete private options, reducing their pricing power. The lowest income earners will be enrolled in the program automatically, rapidly boosting its size (Chart 17). Enabling Medicare to negotiate drug prices – Medicare’s drug spending is equivalent to almost 45% of Big Pharma’s total sales. Enabling this government program to bargain with companies over prices will push down prices substantially. However, the sector’s performance is not really tied to election dynamics because President Trump is also pledging to cap drug prices – it is an effect of populism (Chart 18). Doubling the federal minimum wage – The wage will rise from $7.25 to $15 per hour, hitting low margin franchises and small businesses alike. Chart 17Health Care Gives Back Gains After Biden Nomination
Health Care Gives Back Gains After Biden Nomination
Health Care Gives Back Gains After Biden Nomination
Chart 18Big Pharma Faces Onslaught From Both Parties
Big Pharma Faces Onslaught From Both Parties
Big Pharma Faces Onslaught From Both Parties
Eliminating carbon emissions from power generation by 2035 – Countries are already rapidly shifting from coal to natural gas, but the Biden agenda would attempt to move rapidly away from fossil fuels completely (Chart 19). If legislation passes it will revolutionize the energy sector. Prohibiting “right to work” laws – This is only one example of a sweeping pro-labor agenda that would involve an extensive regulatory push and possibly new laws. New laws would prevent states from passing “right to work” laws that give workers more freedoms to eschew labor unions. The removal of the filibuster makes this possible. Moreover Biden will be aggressive in using executive orders to implement a pro-labor agenda, going further than Bill Clinton or Barack Obama attempted to do in recognition of the party’s shift to the left of the political spectrum. Chart 19Blue Sweep Would Bring Climate Policy Onslaught
Trump Versus Biden: Tariffs Versus Taxes
Trump Versus Biden: Tariffs Versus Taxes
Subsidizing college tuition and low-income housing. US housing subsidies currently make up 25% of domestic private investment in housing and Biden’s government would roll out a significant expansion of these programs. Granting Washington, DC statehood – This is unlikely to happen as two-thirds of Americans are against it. But without the filibuster, Democrats could conceivably railroad it through. Trump’s Agenda Trump’s signature is tariffs – and globally exposed stocks know it. If Trump wins, his domestic legislative agenda will be stymied, other than laws directly aimed at fighting the pandemic and reviving the economy. As mentioned, Trump is unlikely to pass a law building a wall on the southern border. It is conceivable that Trump could pass a comprehensive immigration reform bill with House Democrats, but that is not a priority on the platform and Trump would have to pivot toward compromise. That would depend on Democrats winning the Senate or forcing him to negotiate with the House. Hence a Trump second term will mostly focus on foreign and trade policy. The Republican platform is aggressive on economic decoupling from China, which is ranked third behind tax cuts and pandemic stockpiles.6 Trump, vindicated on protectionism, would likely go after other trade surplus nations. The Chinese could offer some concessions, producing a Phase Two deal early in his second term to avoid sweeping tariffs and encourage him to wage trade war against Europe (Chart 20). Chart 20Trump = Global Trade War
Trump = Global Trade War
Trump = Global Trade War
Trump’s foreign policy would consist of reducing US commitments abroad. Withdrawing from Afghanistan and other scattered conflicts is hardly a game changer. Shifting some forces back from Germany and especially South Korea is far more consequential. It will create power vacuums. But the US is not likely to abandon the allies wholesale. Chart 21Defense Stocks Will Get Wind In Sails
Defense Stocks Will Get Wind In Sails
Defense Stocks Will Get Wind In Sails
Trump has moderated his positions on NATO and other defense priorities over his first term. It is possible he could revert back to his original preferences in a second term, however, so global power vacuums and geopolitical multipolarity will remain a major source of risk for global investors. He will probably also succeed in maintaining large defense spending, despite a Democratic House, given the reality of great power struggle with China and Russia. Geopolitical multipolarity means that defense stocks will continue to enjoy a tailwind from demand both at home and abroad (Chart 21). Investment Takeaways Energy sector struggles most under Democrats. Biden and Trump are both offering reflationary agendas. Where the two agendas diverge most notably, the impacts are largely market-negative – Trump via tariffs, Biden via taxes. The current signals from the market suggest that growth stocks benefit more from a Democratic clean sweep than value stocks (bottom panel, Chart 22). However, the general collapse in value stocks versus growth suggests that there is not much more downside even if the Democrats win (top panel, Chart 22), especially if the 10-year yield rises, as we have been writing in recent research: a selloff in the bond market is the last QE5 puzzle-piece to fall into place. Fed policy, fiscal largess, and the dollar’s decline will support a global cyclical recovery and downtrodden value stocks regardless of the president. The difference is that Biden would slow their relative recovery by piling regulatory burdens on energy as well as health care, which in the US context are a value play. As a reminder, and contrary to popular belief, health care stocks are the largest constituent of the S&P value index with a market cap weight of 21%.7 Trump’s populist “growth at any cost” and deregulatory agenda would persist in a second term and clearly favor value. Yet, if his trade wars get out of hand, they would also weigh on the recovery of these stocks. The difference is that tech stocks are not priced for a Phase Two trade war. If Trump wins it will be a rude awakening. Not to mention that Trump and populist Republicans will seek to target the tech sector for what is increasingly flagrant favoritism in political and cultural debates. Democrats are much more clearly aligned with tech. While they have ambitions of reining in the tech giants as part of the progressive drive against corporate power writ large, Joe Biden will struggle to take on Big O&G, Big Pharma, Big Insurance, and Big Tech at the same time in a single four-year term. The logical conclusion is that he will spare Silicon Valley, which maintained a powerful alliance with the Obama administration. He cannot afford to betray his progressive base when it comes to climate policy, so the Obama alliance with domestic O&G producers will suffer. Tech will face regulatory risks but they will not be existential. Chart 22Not Much Downside Left For Value Stocks
Not Much Downside Left For Value Stocks
Not Much Downside Left For Value Stocks
The fact that the final version of the Democratic Party platform did not contain a section on removing federal subsidies for fossil fuels is merely rhetorical.8 The one clear market reaction from this election cycle is the energy sector’s abhorrence of Democratic policies (Chart 23). The difference is that energy is priced for it whereas tech is priced for perfection. Chart 23Energy Sector Loses From Blue Sweep
Energy Sector Loses From Blue Sweep
Energy Sector Loses From Blue Sweep
Matt Gertken Geopolitical Strategist mattg@bcaresearch.com Anastasios Avgeriou US Equity Strategist anastasios@bcaresearch.com Footnotes 1 In this report we work from the latest policy platforms available. See “Trump Campaign Announces President Trump’s 2nd Term Agenda: Fighting For You!” Trump Campaign, donaldjtrump.com ; and the draft “2020 Democratic Party Platform” Democratic National Committee, demconvention.com. 2 Bill Barrow, “Biden Says he’d shut down economy if scientists recommended,” Associated Press, August 23, 2020, abcnews.go.com. 3 See Seth Hanlon and Christian E. Weller, “Trump’s Plan To Defund Social Security,” Center for American Progress, August 12, 2020, americanprogress.org; “The 2020 Annual Report Of The Board Of Trustrees Of The Federal Old-Age And Survivors Insurance And Federal Disability Insurance Trust Funds,” Social Security Administration, April 22, 2020, ssa.gov. 4 Erica York, “Details And Analysis Of The CREATE JOBS Act,” Tax Foundation, July 30, 2020, taxfoundation.org. 5 See “The Biden Plan For A Clean Energy Revolution And Environmental Justice,” Biden Campaign, joebiden.com. 6 A Democratic Congress could take back the constitutional power over commerce that it delegated to the president back in the 1960s-70s, limiting Trump’s ability to wage trade war. If Republicans hold the Senate, they still might restrain Trump’s protectionism, as they did with his threatened Mexico tariffs in early 2019, but they would not do so until he has already taken a major disruptive action. 7 See “S&P 500 Value,” S&P Dow Jones Indices, spglobal.com. 8 Andrew Prokop, “The Democratic Platform, Explained,” Vox, August 18, 2020, vox.com.
Stick With This Juggernaut
Stick With This Juggernaut
Software stocks have been on a tear. This defensive-tech index has bested the SPX by 34% year-to-date, and in absolute terms is up a whopping 45%. While such a breakneck pace is clearly unsustainable, and a short-term breather is in order, software stocks have been high-flying as they are trying to satisfy investors’ insatiable appetite for cloud exposure. True, some recent IPO activity is reminiscent of the dotcom bubble excesses (re:BIGC doubled in a mere 5 trading days) as investors are scrambling to gain any cloud exposure at any price. Circling back to the S&P software index, encouragingly this has been a capex-led advance, as software outlays now capture a larger slice of corporate budgets (top panel). As a result, software stocks have rallied along side swelling profits (second panel). Granted, valuations are trading at a large premium versus the broad market, however, the 12-month forward P/E is hovering near the historical average and way below the 1990s peak (middle panel). When corrected for the long-term growth rate, the relative P/E/G ratio is near parity and below the historical mean (bottom & fourth panels). Bottom Line: While software stocks have run too far too fast, appear expensive to the naked eye and a near-term breather is needed, the earnings-led advance keeps us on the cyclically bullish side. The ticker symbols for the stocks in the S&P software index are: BLBG: S5SOFT – MSFT, ADBE, CRM, ORCL, INTU, NOW, ADSK, ANSS, SNPS, CDNS, FTNT, PAYC, CTXS, NLOK, TYL.
Highlights The strength in global semiconductor sales in recent months has been due to one-off factors stemming from pandemic-related lockdowns. As the one-off demand surge subsides, global semiconductor sales will decline modestly toward the end of this year. In the near term, global semiconductor stock prices are vulnerable due to overbought conditions, excessive valuations and demand disappointment. The global semiconductor industry is at the epicenter of the US-China confrontation, and more US restrictions on chips sales to China are probable. This is another risk for this sector's share prices. Nevertheless, the structural outlook for global semiconductor demand is constructive. Its CAGR may rise from 3% during 2014-2019 to 5% during 2020-2024. Feature Investor euphoria has taken hold of semiconductor stocks. Global semiconductor stock prices have skyrocketed by 68% from March lows and 96% from December 2018 lows. Meanwhile, global semiconductor sales during March-June rose only by 5% from a year ago. As a result, the ratio of market cap for global semiconductor stocks relative to global semiconductor sales has reached its highest level since at least the inception of data in 2003 (Chart II-1). Chart II-1Global Semi Sector: Market Cap-To-Sales Ratio Has Surged
Global Semi Sector: Market Cap-To-Sales Ratio Has Surged
Global Semi Sector: Market Cap-To-Sales Ratio Has Surged
With semi equity multiples very elevated, their share prices have become even more sensitive to global semiconductor demand growth. Hence, the focus of this report is to try to gauge the strength of global semiconductor demand, both in the near term and structurally. The strength in global semiconductor sales in recent months has been due to one-off factors stemming from the lockdowns. Near-term semiconductor stock prices could disappoint due to weak chip demand from the smartphone sector and diminishing purchases of personal computers (PCs) and servers. However, structurally, we are positive on global semiconductor demand, which is underpinned by the continuing rollout of 5G networks and phones, a wider adoption of data centers, and further technological advancements in artificial intelligence (AI), cloud computing, edge computing and smaller nodes for chip manufacturing (Box II-1). Box II-1 Key Technologies Underpinning Potential Global Semiconductor Demand AI refers to the simulation of human intelligence in machines, for example, computers that play chess and self-driving cars. The goals of AI include learning, reasoning and perception. Cloud computing is the delivery of computing services – including servers, storage, databases, networking, software, analytics and intelligence – over the Internet (“the cloud”) to offer faster innovation, flexible resources and economies of scale. Edge computing is a form of distributed computing, which brings computation and data storage closer to where it is needed, to improve response times and save bandwidth. Technology node refers to the width of line that can be processed with a minimum width in the semiconductor manufacturing industry, such as technology nodes of 10 nanometers (nm), 7nm, 5nm and 3nm. The smaller the nodes are, the more advanced they are. Near-Term Headwinds Semiconductor demand worldwide grew by 6% year-on-year in the first half of this year. There has been a remarkable divergence between world semiconductor sales and the global business cycle (Chart II-2). The divergence between semiconductor sales and economic activity was most striking in the US and China. Semiconductor sales in China rose by 5% year-on-year in Q12020, and in the US they grew by 29% year-on-year in Q22020, despite a contraction in their aggregate demand during the same period. By contrast, Q2 annual growth of semiconductors sales was -2.2% for Japan, -17% for Europe and 1.8% for Asia ex. China and Japan (Chart II-3). Chart II-2World Semi Sales Diverged From The Global Business Cycle
World Semi Sales Diverged From The Global Business Cycle
World Semi Sales Diverged From The Global Business Cycle
Chart II-3Strong Semi Sales In The US And China, But Not Elsewhere
Strong Semi Sales In The US And China, But Not Elsewhere
Strong Semi Sales In The US And China, But Not Elsewhere
The reasons why the US and China posted a surge in semiconductor demand while Europe and Japan experienced a contraction in domestic semiconductor sales are as follows: Most data center investment is occurring in the US and China. Chart II-4 shows that 40% of global hyperscale data centers are operating in the US, much larger than any other countries/regions. China, in turn, ranked second, with a global share of 8%. Chart II-4The US Has The Most Global Hyperscale Data Centers
September 2020
September 2020
Demand contraction in Europe and Japan is due to semiconductor demand in these regions mainly originating from the automobile sector, where production was severely hit by the global pandemic. About 37% of European semiconductor sales were from last year’s automotive market. We believe the divergence between global economic activity and semiconductor sales, as demonstrated by Chart II-2 on page 3, has been due to one-off factors, as the global pandemic lockdowns have spurred semiconductor demand. Such a one-off demand boost will likely dissipate in the coming months. Traditional PCs and tablets: There has been a surge in demand for traditional PCs1 and tablets in the past six months. This was due to the significant increase in online activities, such as working from home, education, e-commerce, gaming and entertainment. Data from the International Data Corporation (IDC) has revealed that shipments of traditional PCs and tablets in volume terms had a strong year-on-year growth of 11.2% and 18.6%, respectively, in the period of April-June (Chart II-5). Looking forward, even renewed lockdowns will not lead to a similar rush to buy these products. Many households are already equipped to work from home and for other online activities. With many countries gradually opening their economies, such demand will diminish. The traditional PC and tablet sectors together account for about 13% of global chip demand (Chart II-6). Chart II-5Personal Computers Sales Have Surged Amid Lockdowns
Personal Computers Sales Have Surged Amid Lockdowns
Personal Computers Sales Have Surged Amid Lockdowns
Server demand: Another major semiconductor demand contribution in Q2020 was from the server sector, which spiked by 21% year-on-year (Chart II-7). The surge in online activities triggered a strong demand for cloud services and remote work applications, both of which require computer servers to run on. Chart II-6The Breakdown Of Global Semiconductor Sales By Type Of Usage
September 2020
September 2020
However, demand from the server sector is also set to diminish in 2H2020 and Q1 2021. Provided the inventories at major data center operators, including Microsoft, Google and Amazon, remain at high levels,2 global cloud service providers will likely reduce their orders of servers next quarter.3 Enterprises will also likely cut their investment in computer servers in 2H2020, as many of them had already increased their purchases of servers to prepare employees and business processes for remote working. We expect global server demand growth to soften in 2H2020. The Digitimes Research forecasted a 5.6% quarter-on-quarter contraction in 3Q2020 and a further cut in global sever shipment in the 4Q2020.2 The global server sector accounts for about 10% of global chip demand and, together with PCs and tablets, they make for 23% (please refer to Chart II-6 on page 5). Further, the smartphone sector – accounting for 27% of global semiconductor demand – will continue struggling in H2 this year. Chart II-7Server Sales Have Surged Amid Lockdowns
Server Sales Have Surged Amid Lockdowns
Server Sales Have Surged Amid Lockdowns
Chart II-8Global Smartphone Shipments Will Likely Remain Weak In 2020H2
Global Smartphone Shipments Will Likely Remain Weak In 2020H2
Global Smartphone Shipments Will Likely Remain Weak In 2020H2
The global total smartphone demand has been hit severely, as households delayed their new smartphone purchases. According to Canalys’ data, global smartphone shipments dropped by 13% and 14% year-on-year in Q1 and Q2, respectively. We expect smartphone shipments to continue contracting over the next three-to-six months (Chart II-8). We believe global consumers will remain cautious in their spending on discretionary goods, such as smartphones, due to lowered incomes and increased job uncertainty. The IDC also forecasted that global smartphone shipments would not grow until 1Q2021.4 The Chinese smartphone sales showed a considerable weakness in July, with a 35% year-on-year contraction, which is much deeper than the 20% decline in H1 this year. 5G smartphone shipments also slowed last month, with a 21% drop from the previous month. The global semiconductor industry is at the epicenter of the US-China confrontation. Bottom Line: The strength in global semiconductor sales in recent months has been due to one-off factors stemming from the lockdowns. As this one-off demand subsides, global semiconductor sales will decline modestly toward the end of this year. Given the overbought conditions and the elevated equity valuations, global semiconductor stocks are currently vulnerable to near-term disappointments in semiconductor demand. At The Epicenter Of The US-China Rivalry Semiconductors are at the epicenter of the US-China confrontation. Ultimately, the US-China contention is about future technological dominance. That is access to technology and the capability to develop new technologies. China currently accounts for about 35% of the global semiconductor demand. US restrictions on semi producers worldwide to supply semiconductors to Chinese buyers constitute a major risk to semiconductor stock prices. On August 17, the US announced fresh sanctions that restrict all US and foreign semiconductor companies from selling chips developed or produced using US software or technology to Huawei, without first obtaining a license. In May, the US had already limited companies, such as the Taiwan Semiconductor Manufacturing Company (TSMC), from making and supplying Huawei with its self-designed chips. In addition, the US recently threatened bans on Chinese-owned apps TikTok and WeChat, and signaled that it could soon restrict Alibaba’s operations in the US. Chart II-9Global Semi Companies' Sales To China Are Substantial
September 2020
September 2020
The global semiconductor sector is highly vulnerable to further escalation in the tension between these two superpowers. Major global semiconductor companies’ sales are heavily exposed to China, and their revenue from China ranges from 16% to 50% of total (Chart II-9). We have been puzzled why global semi share prices have been rallying in spite of US limitations on semiconductor shipments to Huawei and its affiliated entities. One explanation could be that the Chinese companies that are not affiliated with Huawei are able to import semiconductors and then supply them to Huawei. If this is true, the US will have no other choice but to limit all semiconductor sales to China. This will be devastating for global semi producers given their large exposure to China. In anticipation of US punitive policies limiting its access to semiconductors, China had boosted its semiconductor imports over the past 12 months (Chart II-10, top panel). Chinese imports of integrated circuits rose by 12% year-on-year in 1H2020, which is much higher than the 5% year-on-year increase in Chinese semiconductor demand during the same period (Chart II-10, bottom panel). This gap suggests the country had restocked its semiconductor inventories. China has particularly restocked its imports of non-memory chips with imports of processor & controller and other non-memory chips in H1, surging by 30% and 20%, respectively, in US dollar terms (Chart II-11). For memory chips, the contraction in Chinese imports was mainly due to a decline in global memory chip prices. Chart II-10China Had Likely Restocked Its Semi Inventories
China Had Likely Restocked Its Semi Inventories
China Had Likely Restocked Its Semi Inventories
Chart II-11Strong Chinese Imports In Non-Memory Chips
Strong Chinese Imports In Non-Memory Chips
Strong Chinese Imports In Non-Memory Chips
Bottom Line: The global semiconductor industry is at the epicenter of the US-China confrontation, and more restrictions on sales to China are probable. In turn, the restocked semiconductor inventory in China raises the odds of weakening mainland semiconductor import demand in H2 of this year. Structural Tailwinds Table II-1Global Semiconductor Demand CAGR Forecast Over 2020-2024 By Device
September 2020
September 2020
We are optimistic on structural global semiconductor demand. Its nominal CAGR may rise from 3% during 2014-2019 to 5% during 2020-2024 in US dollar terms. Table II-1 shows our demand growth forecasts for global chips in the main consuming sectors over the next five years. The major contributing sectors during 2020-2024 will be 5G smartphones, servers, industrials, electronics and automotive manufacturing. The underlying driving forces are the continuing rollout of 5G networks and phones, the development of data centers, and further technological advancements in AI, cloud computing and edge computing. Currently, the world is still in the early stages of 5G network development. AI, cloud computing and edge computing are constantly evolving. With increasing adoption of 5G smartphones, computer servers and IoT devices, global semiconductor demand is in a structural uptrend (Box II-2). Box II-2 Key Components For The Virtual World In Development Data centers and cloud computing allow data to be stored and applications to be running off-premises and to be accessed remotely through the internet. Edge computing allows data from Internet of things (IoT) devices to be analyzed at the edge of the network before being sent to a data center or cloud. IoT devices contain sensors and mini-computer processors that act on the data collected by the sensors via machine learning. The IoT is a growing system of billions of devices — or things — worldwide that connect to the internet and to each other through wireless networks. AI technology empowers cloud computing, edge computing and IoT devices. 5G is at the heart of the IoT industry transformation, making a world of everything connected possible. Chart II-125G Phone Shipments In China Will Continue To Rise
5G Phone Shipments In China Will Continue To Rise
5G Phone Shipments In China Will Continue To Rise
5G Smartphone Currently, China is the world’s largest 5G-smartphone consumer and the leading 5G-adopter in the world. According to Digitimes Research, global 5G smartphone shipments will reach over 250 million units in 2020, with 170 million (68%) in China and only 80 million units in the world ex. China. Looking forward, 5G smartphone shipments are set to accelerate worldwide over the coming years. The 5G phone shipments in China will continue to rise. The 5G phone sales penetration rate in China is likely to rise from 60% in July to 95% by the end of 2022. In such a case, we estimate that the monthly Chinese 5G phone shipments will increase from the current 16 million units to about 25-30 million units in 2022 (Chart II-12). In the rest of the world, the 5G smartphone adoption pace will also likely speed up over the next five years. The 5G phone selling prices in the world outside China will drop, as more models are introduced and become more affordable. 5G smartphone prices have already fallen in China and will inevitably fall elsewhere. Chinese 5G smartphone producers will ship their low-priced 5G phones overseas, putting pressure on other producers to lower their prices. The 5G infrastructure development is accelerating in China and will accelerate in the rest of the world. Both China and South Korea have been very aggressive in their respective 5G network development. As of the end of June, China's top three carriers: China Mobile, China Unicom, and China Telecom – which together serve more than 1.6 billion mobile users in the country – had installed 400,000 5G base stations against an annual target of 500,000. In comparison, as of April 2020, American carriers had only put up about 10,000 5G base stations.5 As the US is competing with China on the 5G front, the country will likely boost its investment in 5G network development aggressively over the next five years in order to catch up to, or even exceed, China. Importantly, the 5G smartphone has more silicon content than 4G smartphones. More silicon content means higher semiconductor value. Rising 5G smartphone sales and higher silicon content together will more than offset the loss in semiconductor sales due to falling global 4G smartphone shipments. Overall, global semiconductor stock prices have diverged from their sales and profits. Based on our analysis, we expect a CAGR growth of 4% in semiconductor demand from the global smartphone sector over the next five years, slightly lower than the 5% in previous five years (Table II-1 on page 10). This also takes into consideration that the 5G network will be more difficult and more expensive to develop than the 4G network. Servers Global server shipment growth will be highly dependent on both the pace and the scale of data center development (Box II-3). Data centers account for over 60% of global server demand. Box II-3 Data Centers There are four main types of data centers – enterprise data centers, managed services data centers, colocation data centers, and cloud data centers. Data centers can have a wide range of number of servers. Corporate data centers tend to have either 200 (small companies), or 1000 servers (large companies). In comparison, a hyperscale data center usually has a minimum of 5,000 servers linked with an ultra-high speed, high fiber count network. Outsourcing and a move towards the cloud are driving the growth of the hyperscale data center. Instead of companies investing in physical hardware, they can rent server space from a cloud provider to both save their data and reduce costs. Amazon, Microsoft, Google, Apple and Alibaba are all top global cloud service providers. The more hyperscales to be built up, the higher the demand for servers. In 2019, about 13% of the total number of data centers in China were of the hyperscale and large-scale varieties. The plan of new infrastructure development announced earlier this year by Beijing was aiming to increase the number of hyperscale and large-scale data centers in China. Among current data centers either under construction or to be developed in the near future, 36% of them are hyperscale and large-scale data centers. The future growth of data centers is promising. The global trend of data localization6 due to the concerns of data privacy and national security will also bolster a boom of data centers over the next five years. A growing number of countries are adopting data localization requirements, such as China, Russia, Indonesia, Nigeria, Vietnam and some EU countries. While the Chinese data center market is expected to expand by a CAGR of about 28% over 2020-2022,7 a report recently released by Technavio forecasted the global data center industry’s CAGR at over 17% during 2019-2023. We forecast that the global semiconductor demand from servers will grow at a CAGR of 12% over 2020-2024. IoTs Technological advancements in AI, cloud computing and edge computing, in combination with 5G network development, will facilitate the IoTs adoption. According to the GSMA,8 46 operators in 24 markets had launched commercially available 5G networks by 30 January 2020. It forecasted that global IoT connections will be increased from 12 billion mobile devices in 2019 to 25 billion in 2025 with a CAGR at 13%.9 IoTs chips include the Artificial Intelligence of Things (AIoT) – a powerful convergence of AI and the IoT. IoTs is an interconnected network of physical devices. Every device in the IoT is capable of collecting and transferring data through the network. Looking forward, global demand of AI chips and IoT chips will have significant potential to grow with creation of “smarter manufacturing”, “smarter buildings”, “smarter cities”, etc. AI applications can be used in manufacturing processes to render them smarter and more automated. Productivity will be enhanced as machines achieve significantly improved uptime while also reducing labor costs. There are plenty of upsides in industrial semiconductor demand (Chart II-13). We expect the CAGR of industrial electronics to increase from 3.4% during 2014-2019 to 8% during 2020-2024. AI applications can create smart buildings by increasing connectivity across enterprise assets, enabling home network infrastructure (e.g., routers and extenders) and employing home-security devices (e.g., cameras, alarms and locks). AI applications can be used to create smart cities. A smart city is an urban area that uses different types of IoT electronic sensors to collect data. Insights gained from that data are used to manage assets, resources and services efficiently; in return, that data is used improve operations across the city. China has already developed about 750 trial sites of smart cities with different degrees of smartness in the past decade. As AI and 5G technology advances, the existing smart cities’ “smartness” will be upgraded and new trial smart cities will be implemented. Based on IDC data, China’s investment in smart cities will rise at a CAGR of 13.5% over 2020-2023 (Chart II-14). Globally, the U.S., Japan, European countries and other nations are also actively developing smart cities. According to a new study conducted by Grand View Research, the global smart cities market size is expected to grow at a CAGR of 24.7% from 2020 to 2027.10 Chart II-13Plenty Of Upside In Industrial Semi Demand
Plenty Of Upside In Industrial Semi Demand
Plenty Of Upside In Industrial Semi Demand
Chart II-14China’s Investment In Smart Cities Will Continue To Grow
September 2020
September 2020
Automotive We expect the global automotive chip market to grow at a CAGR of 9% during 2020-2024, as in 2014-2019. The increase in consumption of semiconductors by the auto industry will continue to be driven by the market evolution toward autonomous, connected, electric and shared mobility. Most new vehicles now include some level of advanced driver assist systems (ADAS), such as adaptive cruise control, automatic brakes, blind spot monitoring, and parallel parking. The whole industry is progressing toward fully autonomous vehicles in the coming years. Increasing adoption of automotive chips and recovering car sales will revive automotive chip sales. In addition, rising penetration of new energy vehicles (NEVs) is beneficial to semiconductor sales, as NEVs contain higher semiconductor content than conventional vehicles. Conventional vehicles contain an average of a $330 value of semiconductor content while hybrid electric vehicles can contain up to $1,000 and $3,500 worth of semiconductors.11 Regarding other sectors, we are also positive on structural demand of storage and consumer electronics. AI applications generate vast volumes of data — about 80 exabytes per year, which is expected to increase by about tenfold to 845 exabytes by 2025.12 In addition, developers are now using more data in AI and deep learning (DL) training, which also increases storage requirements. With massive potential demand for storage, we estimate a CAGR of 7% over 2020-2024 (Table II-1 on page 10). A recent report from ABI Research predicts that the COVID-19 pandemic will increase global sales of wearables (such as a Fitbit or Apple Watch) by 29% to 30 million shipments of the devices this year. With contribution from wearables, we expect global semiconductor demand from the consumer sector to grow at a CAGR of 3% over 2020-2024, the same rate as in the previous five years. Bottom Line: Continuing rollout of 5G networks and phones, development of data centers, and further technological advancements in AI and cloud computing will provide tailwinds to structural global semiconductor demand, accelerating its CAGR growth from 3% during 2014-2019 to 5% during 2020-2024. Valuations And Investment Conclusions Most global semiconductor stocks are currently over-hyped. Critically, both DRAM and NAND prices have been deflating since January, reflecting weak demand for memory chips. Yet, share prices of memory producers have rallied (Chart II-15). Overall, global semiconductor stock prices have diverged from their sales and profits (Chart II-16). Chart II-15Falling Memory Prices Pose Risk To Memory Stocks
Falling Memory Prices Pose Risk To Memory Stocks
Falling Memory Prices Pose Risk To Memory Stocks
Chart II-16Global Semiconductor Stocks Have Deviated From Profits
Global Semiconductor Stocks Have Deviated From Profits
Global Semiconductor Stocks Have Deviated From Profits
Consequently, the multiples of semiconductor stocks have spiked to multi-year highs (Chart II-17). Even after adjusting for negative US real bond yields, valuations of semiconductor stocks are not cheap. Chart II-18 illustrates the equity risk premium for global semiconductor stocks is at the lower end of its range of the past 10 years. The ERP is calculated as forward earnings yield minus 10-year US TIPS yields. Chart II-17Global Semi Stocks: Elevated Valuations
Global Semi Stocks: Elevated Valuations
Global Semi Stocks: Elevated Valuations
Chart II-18Equity Risk Premium For Global Semi Stocks Is Historically Low
Equity Risk Premium For Global Semi Stocks Is Historically Low
Equity Risk Premium For Global Semi Stocks Is Historically Low
It is impossible to time a correction or know what the trigger would be (US-China tensions have been our best guess). Nevertheless, we do not recommend chasing semiconductor stocks higher due to their overstretched technicals and valuations on the one hand and potential weakening demand in H2 on the other. In addition, the ratio of global semi equipment stock prices relative to the semi equity index correlates with absolute share prices of global semi companies. This is because equipment producers are higher-beta as they outperform during growth accelerations and underperform during growth slumps. The basis is that semi manufacturers have to purchase equipment if there is actual strong demand coming up and vice versa. The recent underperformance by global semi equipment stocks relative to the semi equity index might be an early sign of a potential reversal in semi share prices in absolute terms (Chart II-19). Chart II-19A Signal Of A Potential Reversal In Semi Share Prices
A Signal Of A Potential Reversal In Semi Share Prices
A Signal Of A Potential Reversal In Semi Share Prices
Meanwhile, we believe the subsector- memory chip stocks - will outperform the overall semiconductor index amidst the potential correction, because they have lagged and are less over-extended. Finally, we remain neutral on Taiwanese and Korean bourses within the EM equity space for now. Escalation in US-China confrontation, as well as their exposure to semiconductors, put these bourses at near-term risk. That said, we are reluctant to underweight these markets because fundamentals in EM outside North Asia remain challenging. Ellen JingYuan He Associate Vice President Emerging Markets Strategy Footnotes 1 Traditional PCs are comprised of desktops, notebooks, and workstations. 2 Global server shipments to contract 5.6% sequentially in 3Q2020, says Digitimes Research 3 Global server shipments forecast to increase by 5% this year: TrendForce 4 IDC Expects Worldwide Smartphone Shipments to Plummet 11.9% in 2020 Fueled by Ongoing COVID-19 Challenges 5 America does not want China to dominate 5G mobile networks 6 “Data localization” can be defined as the act of storing data on a device that is physically located within the country where the data was created. Data localization requirements are governmental obligations that explicitly mandate local storage of personal information or strongly encourage local storage through data protection laws that erect stringent legal compliance obligations on cross-border data transfers. 7 The big data center industry ushered in another outbreak 8 The GSMA represents the interests of mobile operators worldwide, uniting more than 750 operators with almost 400 companies in the broader mobile ecosystem, including handset and device makers, software companies, equipment providers and internet companies, as well as organizations in adjacent industry sectors. 9 GSMA: 5G Moves from Hype to Reality – but 4G Still King 10 Smart Cities Market Size Worth $463.9 billion By 2027 11 The Automotive Semiconductor Market – Key Determinants of U.S. Firm Competitiveness 12 AI is data Pac-Man. Winning requires a flashy new storage strategy.
Highlights A weak dollar and low bond yields have pushed up the S&P 500 more than anticipated. Cyclical forces favor loftier stock prices in 12 months. Froth creates short-term vulnerabilities that higher yields could catalyze. The lack of yield curve control along with an improving economic outlook and a decline in deflationary risks indicate that Treasury yields will move toward 1% in the coming months. Long-term investors should begin to add small-cap stocks to their core US holdings. Feature The S&P 500 recent all-time high flies in the face of a long list of tactical indicators that flag an elevated risk of correction. The strength of the US equity market is a testament to the power of policy stimulus, the perceived invincibility of tech titans and the hopes that the powerful economic recovery will continue. Although equities will climb in the coming year, a move up in yields should transfer the leadership from tech and growth stocks to value and traditional cyclicals. While these shifts usually do not spell the end of bull runs, often they generate periods of elevated volatility, especially when the displaced leaders account for 40% of market capitalization. Small-cap stocks look increasingly attractive. A Post Mortem We have been cyclically bullish since late March,1 but on June 25th we warned that the S&P 500 would churn between 2800 and 3200 for the rest of the summer.2 This view did not materialize for several reasons. We underestimated the impact of a weak dollar, which has given a second life to the equity bull market. When expressed in euros, the S&P 500 has been flat since June 5 (Chart I-1). Relative to gold, the S&P 500 is down by 9% since June 8, which further highlights how equities have been supported by a weak US currency and a plentiful money supply. Meanwhile, the S&P 500 has outperformed the EURO STOXX 50 by 7.8% since June 5; however, when we factor in the effect of the strong euro, US equities have steadily underperformed the Eurozone benchmark since early May (Chart I-1, bottom panel). Low bond yields have also buttressed US equities. Near-zero interest rates have allowed the valuation of growth stocks to hit extraordinary levels. The NASDAQ trades at 32-times 2020 earnings and 27-times 2021 EPS. The S&P tech is valued at 29-times 2020 EPS and 25-times next year’s profits. In the most extreme cases, the five tech stocks that have accounted for 31.7% of market gains since March 23 (Apple, Amazon, Microsoft, Alphabet and Facebook) trade on average at 40-times 2020 EPS and 32-times 2021 earnings. Low bond yields have also buttressed US equities. Importantly, COVID-19 has had a positive influence on these same tech stocks. According to our European Investment Strategy colleagues, while spending on restaurant, entertainment and retail collapsed during the pandemic, outlays surged on Amazon, Apple products, Netflix subscriptions, etc.3 At the apex of the crisis, online retail sales expanded by 26.3% annually in the US, while bricks-and-mortar sales contracted by an unprecedented -17.7%. Meanwhile, global shipments of personal computers and servers are expanding by 11.2% and 21.5% annually, respectively (Chart I-2, top panel). Therefore, the largest sector of the S&P 500 is outperforming relative to the rest of the market (Chat I-2, bottom panel). As long as investors continue to expect COVID-19 to affect consumer behavior, they will pay a premium for tech stocks that benefit from the pandemic. Chart I-1The Weak Dollar Is Fueling The Recent Rally
The Weak Dollar Is Fueling The Recent Rally
The Weak Dollar Is Fueling The Recent Rally
Chart I-2Earnings Have Supported Tech Stocks
Earnings Have Supported Tech Stocks
Earnings Have Supported Tech Stocks
Can Stocks Remain Unscathed? The outlook for stocks is positive, but near-term risks have not dissipated because short-term market conditions remain frothy. Watch for higher bond yields as the force to concretize the tactical risks. The following cyclical forces continue to act as crucial tailwinds for equities: The equity risk premium (ERP) remains low. Computations of ERP must factor in the expected expansion of earnings. To incorporate this alteration, we assume that long-term cash flows will grow in line with potential nominal GDP growth. However, we must also consider the absence of stability of the ERP’s mean. After this adjustment, the ERP is still consistent with significant additional gains for the S&P 500 (Chart I-3). Monetary policy is extraordinarily accommodative. Even when we account for the S&P 500’s elevated multiples, the exceptional jump in the BCA Monetary Indicator is large enough to push up equity prices (Chart I-4). Moreover, the strength of US housing activity indicators confirms that the Federal Reserve has pulled the right levers to boost domestic economic activity. For example, the NAHB Housing Market Index has reached a 22-year record, building permits in July grew at their fastest monthly rate in 30 years, and the Mortgage Applications Index for purchases rocketed to a 11-year high in August. Chart I-3A Low ERP Underpins Equities...
A Low ERP Underpins Equities...
A Low ERP Underpins Equities...
Chart I-4...So Does Monetary Policy
...So Does Monetary Policy
...So Does Monetary Policy
The US economy continues to heal. For stocks to climb further on a cyclical basis, the market will need more than five tech giants leading the charge. Hence, earnings expectations for the rest of the market must also mount. Practically, the economy must recover its output loss and the pandemic must ebb. For now, the four-week moving average of initial unemployment claims is drifting lower, and the ISM New Orders-to-Inventories spread is consistent with a faster and more solid business cycle upswing. The ERP is still consistent with significant additional gains for the S&P 500. The global industrial sector outlook is brightening. Manufacturing and trade disproportionately contribute to fluctuations in global economic activity, therefore, they exert an outsized influence on the earnings of non-tech multinationals. The strength in Singapore’s electronics shipments indicates that our Global Industrial Activity Nowcast will accelerate (Chart I-5, top panel). Moreover, the rapid expansion in China’s credit flows points to a marked increase in Chinese imports, which will help industrial and commodity exporters around the world (Chart I-5, bottom panel). Core producer prices have bottomed. Core producer prices are a direct input in the corporate sector’s pricing power. A trough in this inflation gauge leads to stronger EPS and widening profit margins for the S&P 500 (Chart I-6). Chart I-5The Global Industrial Cycle Is Turning The Corner
The Global Industrial Cycle Is Turning The Corner
The Global Industrial Cycle Is Turning The Corner
Chart I-6Easing Deflationary Pressures Will Help Profits
Easing Deflationary Pressures Will Help Profits
Easing Deflationary Pressures Will Help Profits
Investors should still wait to allocate new funds to the stock market. The stock market’s near-term outlook remains marked by short-term froth that dampens our cyclical optimism, especially because the market advance has been concentrated in a small group of equities. Chart I-7Tactical Froth
Tactical Froth
Tactical Froth
The Exposure Index of the National Association of Active Investment Managers has hit 100.1 (Chart I-7). Such a lofty reading indicates that the price of stocks already incorporates optimistic expectations. From a contrarian perspective, this development boosts the probability that swing traders will face disappointments in the near future and will sell their equity holdings. Similarly, the put/call ratio is near a 10-year low, which confirms that traders have bought a lot of upside exposure to stocks without much protection against a pullback. This level of confidence is often a precursor to a significant correction. Finally, our Tactical Strength Indicator is 1.7-sigma above its mean. Historically, when this risk gauge has hit a reading above 1.3, there is a good probability that the S&P 500 will correct or move sideways (Chart I-8). A catalyst must emerge for those aforementioned vulnerabilities to morph into a correction. If Treasury yields move closer to 1%, then stocks will experience a significant pullback of 10% or more as the market rotates away from the leadership of growth stocks. This risk would be especially salient if real yields move up. As Chart I-9 illustrates, falling TIPS yields have been a pillar of the powerful rally of growth stocks. Moreover, low real yields are arithmetically necessary to justify the current level of market multiples exhibited by the S&P 500 (Chart I-9, bottom panel). Chart I-8The S&P 500 Is Vulnerable To A Correction
The S&P 500 Is Vulnerable To A Correction
The S&P 500 Is Vulnerable To A Correction
Chart I-9Falling Real Yields Have Helped Growth Stocks
Falling Real Yields Have Helped Growth Stocks
Falling Real Yields Have Helped Growth Stocks
Growth and high-P/E ratio stocks are heavily represented in the tech and healthcare sectors, which together account for 42% of the S&P 500. This means that higher yields will likely temporarily drag down the entire market. Ultimately, leadership changes are painful events, but they rarely mark the end of bull markets. Can Yields Move Up? Chart I-10Positive Signs For Inflation
Positive Signs For Inflation
Positive Signs For Inflation
It is time to tweak our bond market view because yields should soon move higher. For the past five months, we have written that yields offer minimal downside and that their asymmetric risk profile made government bonds an unappealing investment. We underweighted this asset class relative to stocks and recommended investors bet on higher inflation breakeven rates. However, forces are aligning to expect real rates to rise and thus, nominal yields should move up. The sequencing of the market’s response to QE increasingly favors lower bond prices. Our US Equity Strategy team recently highlighted that in 2009 stocks were the first asset to reflect the implementation of QE1 by the Fed.4 A weaker dollar followed. Bond yields started to perk up only after the USD deteriorated by enough, after stock prices had climbed by enough and after corporate spreads had narrowed by enough to ease financial conditions to stimulate the economy. So far, 2020 echoes the 2009 pattern and our Financial Conditions Index is more stimulatory than it was prior to the COVID-19 outbreak (see Chart III-36 in Section III). Chart I-11Commodities Point To Higher Yields...
Commodities Point To Higher Yields...
Commodities Point To Higher Yields...
Inflation momentum confirms the risks to bonds. The apex of the deflationary shock has already passed. In July, core CPI excluding shelter rose by 0.84% month-on-month, which was the highest reading since 1981 when the Fed was combating the most violent inflation outbreak in generations. The upturn in core producer prices also warns that the annual inflation rate of core CPI should accelerate meaningfully by early 2021 (Chart I-10). The dollar’s weakness is another inflationary force. Import prices from China have already bottomed, which points to an escalation in goods inflation in the coming months. Firming commodity prices constitute another risk for yields. Our Commodities Advance/Decline line has recently broken out. This technical development is consistent with higher commodity prices and higher bond yields (Chart I-11). Rallying natural resources are inflationary, but they also indicate that the global economy is strengthening, which should put upward pressure on real interest rates. Strength in the housing sector also confirms that government bond yields have upside. As we highlighted above, a robust housing market is an important validation that monetary policy is very accommodative. By definition, the objective of loose policy is to boost future economic activity and eradicate deflationary pressures. The surge in lumber indicates bond prices are showing downside risk (Chart I-12). Additionally, the upswing in mortgage issuance is occurring as the Treasury and corporations boost their borrowings, which will generate more demand to use savings generated in the economy. The price of those savings will be higher real interest rates. Chart I-12...Especially Lumber
...Especially Lumber
...Especially Lumber
The ebbing of COVID-19 also suggests that economic activity has scope to accelerate. Moreover, the House of Representatives reconvened to address the problems plaguing the US Postal Service ahead of the November elections. This early return to work gives Washington another opportunity to negotiate the stimulus bill that it failed to pass earlier this month. We still expect such a bill to ultimately become law because both Democrats and Republicans have too much to lose in November if the economy relapses in response of political paralysis. Declining infections and increased government support will bolster aggregate demand and put upward pressure on rates. The stock market’s near-term outlook remains marked by short-term froth that dampens our cyclical optimism. Market dynamics are also very negative for bonds. Our Valuation Index highlights that Treasurys are incredibly expensive (Chart I-13, top panel). Moreover, our Composite Technical Indicator remains overbought, though it has lost momentum. In this context, the lack of appetite for yield curve control or more QE demonstrated by the Federal Open Market Committee creates a genuine danger for bonds. Without these policies, bond yields will have trouble resisting the upward push created by our rising US Pipeline Inflation Pressures Index, our rebounding Nominal Cyclical Spending proxy (which is an average of the ISM Manufacturing headline index and Prices Paid component), and the uptick in the amount of liquidity sitting on commercial banks’ balance sheets (Chart I-14). Chart I-13Treasurys Are Expensive And Losing Momentum
Treasurys Are Expensive And Losing Momentum
Treasurys Are Expensive And Losing Momentum
Chart I-14Building Cyclical Risks For Bonds
Building Cyclical Risks For Bonds
Building Cyclical Risks For Bonds
Thus, equities are at risk on a tactical basis because we anticipate that 10-year Treasury yields may climb towards 1%, including a rise in TIPS yields. The US election creates an additional near-term hurdle for stocks. As we wrote last month, President Trump will likely become more belligerent toward the US’s trading partners in the coming months. Moreover, Vice-President Joe Biden, who has a comfortable lead in the polls including in key swing states such as Florida, Michigan, Pennsylvania, and Wisconsin wants to cancel half of the 2017 tax cuts.5 Small Over Big Long-term investors should expect stocks to beat bonds on a 5- to 10-year horizon, but equities will generate paltry real returns compared with the past 40 years. Elevated valuations for US equities are consistent with long-term annualized real rates of return of only 0.5% (Chart I-15). Moreover, the long-term outlook for profit margins is poor. As we wrote three months ago, mounting populism will result in redistributive policies that will lift the share of wages relative to GDP.6 Moreover, the shift of the US population to the left on economic matters will push up corporate tax rates. Increased labor costs and corporate taxes are negative for profit margins. If profit margins normalize, then equities will probably underperform the uninspiring expected returns implied by current market multiples. The surge in lumber indicates bond prices are showing downside risk. Investors can still generate generous returns through geographical and sectoral selection. We have highlighted how value stocks, industrials and materials, and EM and European equities will likely beat US equities.7 This month we will explore how US small-cap equities are also well placed to best the dismal projected real returns offered by their large-cap counterparts. Our BCA Relative Technical Indicator shows that small-cap stocks are 1.8-sigma oversold when compared with the S&P 500, which indicates a capitulation among investors toward these equities. The bifurcation is even greater if we compare small-cap equities with the S&P 100’s mega-caps that have driven up the US market in recent years. Incorporating these influences, our Cyclical Capitalization Indicator has moved in favor of small-cap stocks, which suggests that small-cap stocks will be rerated if the yield curve can steepen further (Chart I-16). Equities are at risk on a tactical basis because we anticipate that 10-year Treasury yields may climb towards 1%. Chart I-15Valuations And Profit Margins Threaten Long-Term Stock Returns
Valuations And Profit Margins Threaten Long-Term Stock Returns
Valuations And Profit Margins Threaten Long-Term Stock Returns
Chart I-16Indicators Favor Small Cap Stocks
Indicators Favor Small Cap Stocks
Indicators Favor Small Cap Stocks
Chart I-17A Debt Turnaround Would Help Small Cap Stocks
A Debt Turnaround Would Help Small Cap Stocks
A Debt Turnaround Would Help Small Cap Stocks
Debt dynamics could also increasingly beneficial to small-cap equities. In the past few years, the heavy debt-to-EBITDA of smaller firms created a major headwind for small-cap investors. The indebtedness of small-cap stocks often decreases relative to large-caps when an economic recovery begins. This shift in leverage portends an increase in small-caps’ relative future returns (Chart I-17). Our negative bias toward the dollar and our positive view on commodities also benefit small-cap stocks. Since the early 1990s, increasing real commodity prices and a falling Dollar Index have coexisted with a robust performance of small-cap firms (Chart I-18). The negative US balance-of-payment dynamics, coupled with escalating inflation risks, will continue to weigh on the dollar, especially as various large EM nations try to diversify their reserves and payment systems away from the dollar.8 Meanwhile, a declining dollar, expanding global growth, monetary debasement, populism, inflation and a lack of investment in supply, all will accentuate the appeal of natural resources. The sectoral bias of small-cap indices will capitalize on these trends. Chart I-18Small Is Beautiful
Small Is Beautiful
Small Is Beautiful
Chart I-19Small Cap Stocks Like Higher Yields
Small Cap Stocks Like Higher Yields
Small Cap Stocks Like Higher Yields
Finally, cyclical timing is also moving in favor of small-cap firms. Since 2014, the Russell 2000 has outperformed the S&P 500 when real yields moved higher (Chart I-19). Small-cap firms display a more marked pro-cyclicality than large firms. Additionally, the S&P 500 growth bias implies that the US large-cap benchmark underperforms the small cap indices when real yields increase. Mathieu Savary Vice President The Bank Credit Analyst August 27, 2020 Next Report: September 24, 2020 II. Global Semiconductor Stocks: A Hiatus Is Overdue In A Structural Bull Market The strength in global semiconductor sales in recent months has been due to one-off factors stemming from pandemic-related lockdowns. As the one-off demand surge subsides, global semiconductor sales will decline modestly toward the end of this year. In the near term, global semiconductor stock prices are vulnerable due to overbought conditions, excessive valuations and demand disappointment. The global semiconductor industry is at the epicenter of the US-China confrontation, and more US restrictions on chips sales to China are probable. This is another risk for this sector's share prices. Nevertheless, the structural outlook for global semiconductor demand is constructive. Its CAGR may rise from 3% during 2014-2019 to 5% during 2020-2024. Investor euphoria has taken hold of semiconductor stocks. Global semiconductor stock prices have skyrocketed by 68% from March lows and 96% from December 2018 lows. Meanwhile, global semiconductor sales during March-June rose only by 5% from a year ago. As a result, the ratio of market cap for global semiconductor stocks relative to global semiconductor sales has reached its highest level since at least the inception of data in 2003 (Chart II-1). Chart II-1Global Semi Sector: Market Cap-To-Sales Ratio Has Surged
Global Semi Sector: Market Cap-To-Sales Ratio Has Surged
Global Semi Sector: Market Cap-To-Sales Ratio Has Surged
With semi equity multiples very elevated, their share prices have become even more sensitive to global semiconductor demand growth. Hence, the focus of this report is to try to gauge the strength of global semiconductor demand, both in the near term and structurally. The strength in global semiconductor sales in recent months has been due to one-off factors stemming from the lockdowns. Near-term semiconductor stock prices could disappoint due to weak chip demand from the smartphone sector and diminishing purchases of personal computers (PCs) and servers. However, structurally, we are positive on global semiconductor demand, which is underpinned by the continuing rollout of 5G networks and phones, a wider adoption of data centers, and further technological advancements in artificial intelligence (AI), cloud computing, edge computing and smaller nodes for chip manufacturing (Box II-1). Box II-1 Key Technologies Underpinning Potential Global Semiconductor Demand AI refers to the simulation of human intelligence in machines, for example, computers that play chess and self-driving cars. The goals of AI include learning, reasoning and perception. Cloud computing is the delivery of computing services – including servers, storage, databases, networking, software, analytics and intelligence – over the Internet (“the cloud”) to offer faster innovation, flexible resources and economies of scale. Edge computing is a form of distributed computing, which brings computation and data storage closer to where it is needed, to improve response times and save bandwidth. Technology node refers to the width of line that can be processed with a minimum width in the semiconductor manufacturing industry, such as technology nodes of 10 nanometers (nm), 7nm, 5nm and 3nm. The smaller the nodes are, the more advanced they are. Near-Term Headwinds Semiconductor demand worldwide grew by 6% year-on-year in the first half of this year. There has been a remarkable divergence between world semiconductor sales and the global business cycle (Chart II-2). The divergence between semiconductor sales and economic activity was most striking in the US and China. Semiconductor sales in China rose by 5% year-on-year in Q12020, and in the US they grew by 29% year-on-year in Q22020, despite a contraction in their aggregate demand during the same period. By contrast, Q2 annual growth of semiconductors sales was -2.2% for Japan, -17% for Europe and 1.8% for Asia ex. China and Japan (Chart II-3). Chart II-2World Semi Sales Diverged From The Global Business Cycle
World Semi Sales Diverged From The Global Business Cycle
World Semi Sales Diverged From The Global Business Cycle
Chart II-3Strong Semi Sales In The US And China, But Not Elsewhere
Strong Semi Sales In The US And China, But Not Elsewhere
Strong Semi Sales In The US And China, But Not Elsewhere
The reasons why the US and China posted a surge in semiconductor demand while Europe and Japan experienced a contraction in domestic semiconductor sales are as follows: Most data center investment is occurring in the US and China. Chart II-4 shows that 40% of global hyperscale data centers are operating in the US, much larger than any other countries/regions. China, in turn, ranked second, with a global share of 8%. Chart II-4The US Has The Most Global Hyperscale Data Centers
September 2020
September 2020
Demand contraction in Europe and Japan is due to semiconductor demand in these regions mainly originating from the automobile sector, where production was severely hit by the global pandemic. About 37% of European semiconductor sales were from last year’s automotive market. We believe the divergence between global economic activity and semiconductor sales, as demonstrated by Chart II-2 on page 3, has been due to one-off factors, as the global pandemic lockdowns have spurred semiconductor demand. Such a one-off demand boost will likely dissipate in the coming months. Traditional PCs and tablets: There has been a surge in demand for traditional PCs9 and tablets in the past six months. This was due to the significant increase in online activities, such as working from home, education, e-commerce, gaming and entertainment. Data from the International Data Corporation (IDC) has revealed that shipments of traditional PCs and tablets in volume terms had a strong year-on-year growth of 11.2% and 18.6%, respectively, in the period of April-June (Chart II-5). Looking forward, even renewed lockdowns will not lead to a similar rush to buy these products. Many households are already equipped to work from home and for other online activities. With many countries gradually opening their economies, such demand will diminish. The traditional PC and tablet sectors together account for about 13% of global chip demand (Chart II-6). Chart II-5Personal Computers Sales Have Surged Amid Lockdowns
Personal Computers Sales Have Surged Amid Lockdowns
Personal Computers Sales Have Surged Amid Lockdowns
Server demand: Another major semiconductor demand contribution in Q2020 was from the server sector, which spiked by 21% year-on-year (Chart II-7). The surge in online activities triggered a strong demand for cloud services and remote work applications, both of which require computer servers to run on. Chart II-6The Breakdown Of Global Semiconductor Sales By Type Of Usage
September 2020
September 2020
However, demand from the server sector is also set to diminish in 2H2020 and Q1 2021. Provided the inventories at major data center operators, including Microsoft, Google and Amazon, remain at high levels,10 global cloud service providers will likely reduce their orders of servers next quarter.11 Enterprises will also likely cut their investment in computer servers in 2H2020, as many of them had already increased their purchases of servers to prepare employees and business processes for remote working. We expect global server demand growth to soften in 2H2020. The Digitimes Research forecasted a 5.6% quarter-on-quarter contraction in 3Q2020 and a further cut in global sever shipment in the 4Q2020.10 The global server sector accounts for about 10% of global chip demand and, together with PCs and tablets, they make for 23% (please refer to Chart II-6 on page 5). Further, the smartphone sector – accounting for 27% of global semiconductor demand – will continue struggling in H2 this year. Chart II-7Server Sales Have Surged Amid Lockdowns
Server Sales Have Surged Amid Lockdowns
Server Sales Have Surged Amid Lockdowns
Chart II-8Global Smartphone Shipments Will Likely Remain Weak In 2020H2
Global Smartphone Shipments Will Likely Remain Weak In 2020H2
Global Smartphone Shipments Will Likely Remain Weak In 2020H2
The global total smartphone demand has been hit severely, as households delayed their new smartphone purchases. According to Canalys’ data, global smartphone shipments dropped by 13% and 14% year-on-year in Q1 and Q2, respectively. We expect smartphone shipments to continue contracting over the next three-to-six months (Chart II-8). We believe global consumers will remain cautious in their spending on discretionary goods, such as smartphones, due to lowered incomes and increased job uncertainty. The IDC also forecasted that global smartphone shipments would not grow until 1Q2021.12 The Chinese smartphone sales showed a considerable weakness in July, with a 35% year-on-year contraction, which is much deeper than the 20% decline in H1 this year. 5G smartphone shipments also slowed last month, with a 21% drop from the previous month. The global semiconductor industry is at the epicenter of the US-China confrontation. Bottom Line: The strength in global semiconductor sales in recent months has been due to one-off factors stemming from the lockdowns. As this one-off demand subsides, global semiconductor sales will decline modestly toward the end of this year. Given the overbought conditions and the elevated equity valuations, global semiconductor stocks are currently vulnerable to near-term disappointments in semiconductor demand. At The Epicenter Of The US-China Rivalry Semiconductors are at the epicenter of the US-China confrontation. Ultimately, the US-China contention is about future technological dominance. That is access to technology and the capability to develop new technologies. China currently accounts for about 35% of the global semiconductor demand. US restrictions on semi producers worldwide to supply semiconductors to Chinese buyers constitute a major risk to semiconductor stock prices. On August 17, the US announced fresh sanctions that restrict all US and foreign semiconductor companies from selling chips developed or produced using US software or technology to Huawei, without first obtaining a license. In May, the US had already limited companies, such as the Taiwan Semiconductor Manufacturing Company (TSMC), from making and supplying Huawei with its self-designed chips. In addition, the US recently threatened bans on Chinese-owned apps TikTok and WeChat, and signaled that it could soon restrict Alibaba’s operations in the US. Chart II-9Global Semi Companies' Sales To China Are Substantial
September 2020
September 2020
The global semiconductor sector is highly vulnerable to further escalation in the tension between these two superpowers. Major global semiconductor companies’ sales are heavily exposed to China, and their revenue from China ranges from 16% to 50% of total (Chart II-9). We have been puzzled why global semi share prices have been rallying in spite of US limitations on semiconductor shipments to Huawei and its affiliated entities. One explanation could be that the Chinese companies that are not affiliated with Huawei are able to import semiconductors and then supply them to Huawei. If this is true, the US will have no other choice but to limit all semiconductor sales to China. This will be devastating for global semi producers given their large exposure to China. In anticipation of US punitive policies limiting its access to semiconductors, China had boosted its semiconductor imports over the past 12 months (Chart II-10, top panel). Chinese imports of integrated circuits rose by 12% year-on-year in 1H2020, which is much higher than the 5% year-on-year increase in Chinese semiconductor demand during the same period (Chart II-10, bottom panel). This gap suggests the country had restocked its semiconductor inventories. China has particularly restocked its imports of non-memory chips with imports of processor & controller and other non-memory chips in H1, surging by 30% and 20%, respectively, in US dollar terms (Chart II-11). For memory chips, the contraction in Chinese imports was mainly due to a decline in global memory chip prices. Chart II-10China Had Likely Restocked Its Semi Inventories
China Had Likely Restocked Its Semi Inventories
China Had Likely Restocked Its Semi Inventories
Chart II-11Strong Chinese Imports In Non-Memory Chips
Strong Chinese Imports In Non-Memory Chips
Strong Chinese Imports In Non-Memory Chips
Bottom Line: The global semiconductor industry is at the epicenter of the US-China confrontation, and more restrictions on sales to China are probable. In turn, the restocked semiconductor inventory in China raises the odds of weakening mainland semiconductor import demand in H2 of this year. Structural Tailwinds Table II-1Global Semiconductor Demand CAGR Forecast Over 2020-2024 By Device
September 2020
September 2020
We are optimistic on structural global semiconductor demand. Its nominal CAGR may rise from 3% during 2014-2019 to 5% during 2020-2024 in US dollar terms. Table II-1 shows our demand growth forecasts for global chips in the main consuming sectors over the next five years. The major contributing sectors during 2020-2024 will be 5G smartphones, servers, industrials, electronics and automotive manufacturing. The underlying driving forces are the continuing rollout of 5G networks and phones, the development of data centers, and further technological advancements in AI, cloud computing and edge computing. Currently, the world is still in the early stages of 5G network development. AI, cloud computing and edge computing are constantly evolving. With increasing adoption of 5G smartphones, computer servers and IoT devices, global semiconductor demand is in a structural uptrend (Box II-2). Box II-2 Key Components For The Virtual World In Development Data centers and cloud computing allow data to be stored and applications to be running off-premises and to be accessed remotely through the internet. Edge computing allows data from Internet of things (IoT) devices to be analyzed at the edge of the network before being sent to a data center or cloud. IoT devices contain sensors and mini-computer processors that act on the data collected by the sensors via machine learning. The IoT is a growing system of billions of devices — or things — worldwide that connect to the internet and to each other through wireless networks. AI technology empowers cloud computing, edge computing and IoT devices. 5G is at the heart of the IoT industry transformation, making a world of everything connected possible. Chart II-125G Phone Shipments In China Will Continue To Rise
5G Phone Shipments In China Will Continue To Rise
5G Phone Shipments In China Will Continue To Rise
5G Smartphone Currently, China is the world’s largest 5G-smartphone consumer and the leading 5G-adopter in the world. According to Digitimes Research, global 5G smartphone shipments will reach over 250 million units in 2020, with 170 million (68%) in China and only 80 million units in the world ex. China. Looking forward, 5G smartphone shipments are set to accelerate worldwide over the coming years. The 5G phone shipments in China will continue to rise. The 5G phone sales penetration rate in China is likely to rise from 60% in July to 95% by the end of 2022. In such a case, we estimate that the monthly Chinese 5G phone shipments will increase from the current 16 million units to about 25-30 million units in 2022 (Chart II-12). In the rest of the world, the 5G smartphone adoption pace will also likely speed up over the next five years. The 5G phone selling prices in the world outside China will drop, as more models are introduced and become more affordable. 5G smartphone prices have already fallen in China and will inevitably fall elsewhere. Chinese 5G smartphone producers will ship their low-priced 5G phones overseas, putting pressure on other producers to lower their prices. The 5G infrastructure development is accelerating in China and will accelerate in the rest of the world. Both China and South Korea have been very aggressive in their respective 5G network development. As of the end of June, China's top three carriers: China Mobile, China Unicom, and China Telecom – which together serve more than 1.6 billion mobile users in the country – had installed 400,000 5G base stations against an annual target of 500,000. In comparison, as of April 2020, American carriers had only put up about 10,000 5G base stations.13 As the US is competing with China on the 5G front, the country will likely boost its investment in 5G network development aggressively over the next five years in order to catch up to, or even exceed, China. Importantly, the 5G smartphone has more silicon content than 4G smartphones. More silicon content means higher semiconductor value. Rising 5G smartphone sales and higher silicon content together will more than offset the loss in semiconductor sales due to falling global 4G smartphone shipments. Overall, global semiconductor stock prices have diverged from their sales and profits. Based on our analysis, we expect a CAGR growth of 4% in semiconductor demand from the global smartphone sector over the next five years, slightly lower than the 5% in previous five years (Table II-1 on page 10). This also takes into consideration that the 5G network will be more difficult and more expensive to develop than the 4G network. Servers Global server shipment growth will be highly dependent on both the pace and the scale of data center development (Box II-3). Data centers account for over 60% of global server demand. Box II-3 Data Centers There are four main types of data centers – enterprise data centers, managed services data centers, colocation data centers, and cloud data centers. Data centers can have a wide range of number of servers. Corporate data centers tend to have either 200 (small companies), or 1000 servers (large companies). In comparison, a hyperscale data center usually has a minimum of 5,000 servers linked with an ultra-high speed, high fiber count network. Outsourcing and a move towards the cloud are driving the growth of the hyperscale data center. Instead of companies investing in physical hardware, they can rent server space from a cloud provider to both save their data and reduce costs. Amazon, Microsoft, Google, Apple and Alibaba are all top global cloud service providers. The more hyperscales to be built up, the higher the demand for servers. In 2019, about 13% of the total number of data centers in China were of the hyperscale and large-scale varieties. The plan of new infrastructure development announced earlier this year by Beijing was aiming to increase the number of hyperscale and large-scale data centers in China. Among current data centers either under construction or to be developed in the near future, 36% of them are hyperscale and large-scale data centers. The future growth of data centers is promising. The global trend of data localization14 due to the concerns of data privacy and national security will also bolster a boom of data centers over the next five years. A growing number of countries are adopting data localization requirements, such as China, Russia, Indonesia, Nigeria, Vietnam and some EU countries. While the Chinese data center market is expected to expand by a CAGR of about 28% over 2020-2022,15 a report recently released by Technavio forecasted the global data center industry’s CAGR at over 17% during 2019-2023. We forecast that the global semiconductor demand from servers will grow at a CAGR of 12% over 2020-2024. IoTs Technological advancements in AI, cloud computing and edge computing, in combination with 5G network development, will facilitate the IoTs adoption. According to the GSMA,16 46 operators in 24 markets had launched commercially available 5G networks by 30 January 2020. It forecasted that global IoT connections will be increased from 12 billion mobile devices in 2019 to 25 billion in 2025 with a CAGR at 13%.17 IoTs chips include the Artificial Intelligence of Things (AIoT) – a powerful convergence of AI and the IoT. IoTs is an interconnected network of physical devices. Every device in the IoT is capable of collecting and transferring data through the network. Looking forward, global demand of AI chips and IoT chips will have significant potential to grow with creation of “smarter manufacturing”, “smarter buildings”, “smarter cities”, etc. AI applications can be used in manufacturing processes to render them smarter and more automated. Productivity will be enhanced as machines achieve significantly improved uptime while also reducing labor costs. There are plenty of upsides in industrial semiconductor demand (Chart II-13). We expect the CAGR of industrial electronics to increase from 3.4% during 2014-2019 to 8% during 2020-2024. AI applications can create smart buildings by increasing connectivity across enterprise assets, enabling home network infrastructure (e.g., routers and extenders) and employing home-security devices (e.g., cameras, alarms and locks). AI applications can be used to create smart cities. A smart city is an urban area that uses different types of IoT electronic sensors to collect data. Insights gained from that data are used to manage assets, resources and services efficiently; in return, that data is used improve operations across the city. China has already developed about 750 trial sites of smart cities with different degrees of smartness in the past decade. As AI and 5G technology advances, the existing smart cities’ “smartness” will be upgraded and new trial smart cities will be implemented. Based on IDC data, China’s investment in smart cities will rise at a CAGR of 13.5% over 2020-2023 (Chart II-14). Globally, the U.S., Japan, European countries and other nations are also actively developing smart cities. According to a new study conducted by Grand View Research, the global smart cities market size is expected to grow at a CAGR of 24.7% from 2020 to 2027.18 Chart II-13Plenty Of Upside In Industrial Semi Demand
Plenty Of Upside In Industrial Semi Demand
Plenty Of Upside In Industrial Semi Demand
Chart II-14China’s Investment In Smart Cities Will Continue To Grow
September 2020
September 2020
Automotive We expect the global automotive chip market to grow at a CAGR of 9% during 2020-2024, as in 2014-2019. The increase in consumption of semiconductors by the auto industry will continue to be driven by the market evolution toward autonomous, connected, electric and shared mobility. Most new vehicles now include some level of advanced driver assist systems (ADAS), such as adaptive cruise control, automatic brakes, blind spot monitoring, and parallel parking. The whole industry is progressing toward fully autonomous vehicles in the coming years. Increasing adoption of automotive chips and recovering car sales will revive automotive chip sales. In addition, rising penetration of new energy vehicles (NEVs) is beneficial to semiconductor sales, as NEVs contain higher semiconductor content than conventional vehicles. Conventional vehicles contain an average of a $330 value of semiconductor content while hybrid electric vehicles can contain up to $1,000 and $3,500 worth of semiconductors.19 Regarding other sectors, we are also positive on structural demand of storage and consumer electronics. AI applications generate vast volumes of data — about 80 exabytes per year, which is expected to increase by about tenfold to 845 exabytes by 2025.20 In addition, developers are now using more data in AI and deep learning (DL) training, which also increases storage requirements. With massive potential demand for storage, we estimate a CAGR of 7% over 2020-2024 (Table II-1 on page 10). A recent report from ABI Research predicts that the COVID-19 pandemic will increase global sales of wearables (such as a Fitbit or Apple Watch) by 29% to 30 million shipments of the devices this year. With contribution from wearables, we expect global semiconductor demand from the consumer sector to grow at a CAGR of 3% over 2020-2024, the same rate as in the previous five years. Bottom Line: Continuing rollout of 5G networks and phones, development of data centers, and further technological advancements in AI and cloud computing will provide tailwinds to structural global semiconductor demand, accelerating its CAGR growth from 3% during 2014-2019 to 5% during 2020-2024. Valuations And Investment Conclusions Most global semiconductor stocks are currently over-hyped. Critically, both DRAM and NAND prices have been deflating since January, reflecting weak demand for memory chips. Yet, share prices of memory producers have rallied (Chart II-15). Overall, global semiconductor stock prices have diverged from their sales and profits (Chart II-16). Chart II-15Falling Memory Prices Pose Risk To Memory Stocks
Falling Memory Prices Pose Risk To Memory Stocks
Falling Memory Prices Pose Risk To Memory Stocks
Chart II-16Global Semiconductor Stocks Have Deviated From Profits
Global Semiconductor Stocks Have Deviated From Profits
Global Semiconductor Stocks Have Deviated From Profits
Consequently, the multiples of semiconductor stocks have spiked to multi-year highs (Chart II-17). Even after adjusting for negative US real bond yields, valuations of semiconductor stocks are not cheap. Chart II-18 illustrates the equity risk premium for global semiconductor stocks is at the lower end of its range of the past 10 years. The ERP is calculated as forward earnings yield minus 10-year US TIPS yields. Chart II-17Global Semi Stocks: Elevated Valuations
Global Semi Stocks: Elevated Valuations
Global Semi Stocks: Elevated Valuations
Chart II-18Equity Risk Premium For Global Semi Stocks Is Historically Low
Equity Risk Premium For Global Semi Stocks Is Historically Low
Equity Risk Premium For Global Semi Stocks Is Historically Low
It is impossible to time a correction or know what the trigger would be (US-China tensions have been our best guess). Nevertheless, we do not recommend chasing semiconductor stocks higher due to their overstretched technicals and valuations on the one hand and potential weakening demand in H2 on the other. In addition, the ratio of global semi equipment stock prices relative to the semi equity index correlates with absolute share prices of global semi companies. This is because equipment producers are higher-beta as they outperform during growth accelerations and underperform during growth slumps. The basis is that semi manufacturers have to purchase equipment if there is actual strong demand coming up and vice versa. The recent underperformance by global semi equipment stocks relative to the semi equity index might be an early sign of a potential reversal in semi share prices in absolute terms (Chart II-19). Chart II-19A Signal Of A Potential Reversal In Semi Share Prices
A Signal Of A Potential Reversal In Semi Share Prices
A Signal Of A Potential Reversal In Semi Share Prices
Meanwhile, we believe the subsector- memory chip stocks - will outperform the overall semiconductor index amidst the potential correction, because they have lagged and are less over-extended. Finally, we remain neutral on Taiwanese and Korean bourses within the EM equity space for now. Escalation in US-China confrontation, as well as their exposure to semiconductors, put these bourses at near-term risk. That said, we are reluctant to underweight these markets because fundamentals in EM outside North Asia remain challenging. Ellen JingYuan He Associate Vice President Emerging Markets Strategy III. Indicators And Reference Charts We continue to favor stocks at the expense of bonds, but equities are increasingly vulnerable because short-term sentiment and positioning measures are growing increasingly stretched. Three forces can prompt a correction. First, a rebound in yields toward 1% would cause turbulence for the S&P 500, because the index is dominated by growth stocks that are highly sensitive to fluctuations in the risk-free rate. Second, a dollar bounce would hurt the S&P 500 because a depreciating USD has fueled the US stock market rally since June. Finally, the US presidential election is drawing nearer; hence, the risk of potentially damaging political headlines is growing. Despite these short-term risks, the main pillar supporting the rally remains intact: global monetary conditions are highly accommodative and the chance of inflation moving high enough to spook central bankers is minimal in the near future. Additionally, the fiscal spigots are open and governments around the world will ultimately continue to support their economies. Hence, any correction in the S&P 500 is unlikely to move beyond 15% or a level of 2900. Our cyclical indicators confirm the positive backdrop for stocks. While our Valuation Indicator has reached overvalued territory, our Monetary Indicator remains extremely accommodative. Moreover, our Technical Indicator is now flashing a clear buy signal. Putting all those forces together, our Intermediate-Term Indicator continues to support equities. Finally, our Revealed Preference Indicator strongly argues in favor of staying invested in equities. That being said, our Speculation Indicator has surged back up, thus the volatility of the rally should increase. Bonds remain extremely unappealing. Our Bond Valuation Index shows Treasurys as prohibitively expensive and our Composite Technical Indicator continues to lose momentum. So far, government bond yields have managed to remain stable at very low levels even if they have not declined further. Nonetheless, bonds have underperformed equities, which is a trend that will remain in place for many more quarters. Moreover, the pick-up in commodity prices and in various gauges of the business cycle suggests that bond yields should soon move higher, especially because the Fed is far from enthused at the concept of yield curve control. Our Cyclical Bond Indicator has turned higher and will soon flash an outright sell signal. The dollar continues to weaken after its recent breakdown. For now, the USD’s weakness has been concentrated among DM currencies. For the dollar to weaken further, EM currencies must begin to rally more markedly than they have until now, especially in Latin America. The firmness of the CNY is a good sign for the EM complex, but another clear up-leg in global growth must emerge before EM currencies can fully blossom. As a result, we are likely to have entered a temporary period of consolidation for the US dollar. The extremely oversold nature of our Dollar Composite Technical Indicator supports the idea that the dollar needs to digest its recent losses before its poor fundamentals force it lower once again. Finally, commodities have been a prime beneficiary of the weakness in the dollar and the combination of stable yields and improving economic activity. Our Composite Technical Indicator is now well into overbought territory which makes natural resource prices vulnerable to a pullback. A move up in yields as well as a short-term rebound in the dollar will likely catalyze any underlying technical risks to commodities. Gold will be particularly vulnerable to any such pullback, especially if higher real yields are the cause of the correction in natural resource prices. Despite these short-term worries, the outlook for commodities remains bright. As a result, we would use any correction to add exposure to the commodity complex. EQUITIES: Chart III-1US Equity Indicators
US Equity Indicators
US Equity Indicators
Chart III-2Willingness To Pay For Risk
Willingness To Pay For Risk
Willingness To Pay For Risk
Chart III-3US Equity Sentiment Indicators
US Equity Sentiment Indicators
US Equity Sentiment Indicators
Chart III-4Revealed Preference Indicator
Revealed Preference Indicator
Revealed Preference Indicator
Chart III-5US Stock Market Valuation
US Stock Market Valuation
US Stock Market Valuation
Chart III-6US Earnings
US Earnings
US Earnings
Chart III-7Global Stock Market And Earnings: Relative Performance
Global Stock Market And Earnings: Relative Performance
Global Stock Market And Earnings: Relative Performance
Chart III-8Global Stock Market And Earnings: Relative Performance
Global Stock Market And Earnings: Relative Performance
Global Stock Market And Earnings: Relative Performance
FIXED INCOME: Chart III-9US Treasurys And Valuations
US Treasurys And Valuations
US Treasurys And Valuations
Chart III-10Yield Curve Slopes
Yield Curve Slopes
Yield Curve Slopes
Chart III-11Selected US Bond Yields
Selected US Bond Yields
Selected US Bond Yields
Chart III-1210-Year Treasury Yield Components
10-Year Treasury Yield Components
10-Year Treasury Yield Components
Chart III-13US Corporate Bonds And Health Monitor
US Corporate Bonds And Health Monitor
US Corporate Bonds And Health Monitor
Chart III-14Global Bonds: Developed Markets
Global Bonds: Developed Markets
Global Bonds: Developed Markets
Chart III-15Global Bonds: Emerging Markets
Global Bonds: Emerging Markets
Global Bonds: Emerging Markets
CURRENCIES: Chart III-16US Dollar And PPP
US Dollar And PPP
US Dollar And PPP
Chart III-17US Dollar And Indicator
US Dollar And Indicator
US Dollar And Indicator
Chart III-18US Dollar Fundamentals
US Dollar Fundamentals
US Dollar Fundamentals
Chart III-19Japanese Yen Technicals
Japanese Yen Technicals
Japanese Yen Technicals
Chart III-20Euro Technicals
Euro Technicals
Euro Technicals
Chart III-21Euro/Yen Technicals
Euro/Yen Technicals
Euro/Yen Technicals
Chart III-22Euro/Pound Technicals
Euro/Pound Technicals
Euro/Pound Technicals
COMMODITIES: Chart III-23Broad Commodity Indicators
Broad Commodity Indicators
Broad Commodity Indicators
Chart III-24Commodity Prices
Commodity Prices
Commodity Prices
Chart III-25Commodity Prices
Commodity Prices
Commodity Prices
Chart III-26Commodity Sentiment
Commodity Sentiment
Commodity Sentiment
Chart III-27Speculative Positioning
Speculative Positioning
Speculative Positioning
ECONOMY: Chart III-28US And Global Macro Backdrop
US And Global Macro Backdrop
US And Global Macro Backdrop
Chart III-29US Macro Snapshot
US Macro Snapshot
US Macro Snapshot
Chart III-30US Growth Outlook
US Growth Outlook
US Growth Outlook
Chart III-31US Cyclical Spending
US Cyclical Spending
US Cyclical Spending
Chart III-32US Labor Market
US Labor Market
US Labor Market
Chart III-33US Consumption
US Consumption
US Consumption
Chart III-34US Housing
US Housing
US Housing
Chart III-35US Debt And Deleveraging
US Debt And Deleveraging
US Debt And Deleveraging
Chart III-36US Financial Conditions
US Financial Conditions
US Financial Conditions
Chart III-37Global Economic Snapshot: Europe
Global Economic Snapshot: Europe
Global Economic Snapshot: Europe
Chart III-38Global Economic Snapshot: China
Global Economic Snapshot: China
Global Economic Snapshot: China
Mathieu Savary Vice President The Bank Credit Analyst Footnotes 1 Please see The Bank Credit Analyst "April 2020," dated March 26, 2020, available at bca.bcaresearch.com 2 Please see The Bank Credit Analyst "July 2020," dated June 25, 2020, available at bca.bcaresearch.com 3 Please see European Investment Strategy "An Economy Without Mouths Or Noses Will Lose 10 Percent Of Jobs," dated July 30, 2020, available at eis.bcaresearch.com 4 Please see US Equity Strategy "Inversely Correlated," dated August 25, 2020, available at uses.bcaresearch.com 5 Please see The Bank Credit Analyst "August 2020," dated July 30, 2020, available at bca.bcaresearch.com 6 Please see The Bank Credit Analyst "June 2020," dated May 28, 2020, available at bca.bcaresearch.com 7 Please see The Bank Credit Analyst "August 2020," dated July 30, 2020, available at bca.bcaresearch.com 8 Diversifying away from the dollar does not mean that the USD will lose its reserve status. However, a return to the share of FX reserves that prevailed in the first half of the 1990s will hurt the dollar, especially because the US net international investment position has fallen from -4.6% of GDP in 1992 to -57% today. 9 Traditional PCs are comprised of desktops, notebooks, and workstations. 10 Global server shipments to contract 5.6% sequentially in 3Q2020, says Digitimes Research 11 Global server shipments forecast to increase by 5% this year: TrendForce 12 IDC Expects Worldwide Smartphone Shipments to Plummet 11.9% in 2020 Fueled by Ongoing COVID-19 Challenges 13 America does not want China to dominate 5G mobile networks 14 “Data localization” can be defined as the act of storing data on a device that is physically located within the country where the data was created. Data localization requirements are governmental obligations that explicitly mandate local storage of personal information or strongly encourage local storage through data protection laws that erect stringent legal compliance obligations on cross-border data transfers. 15 The big data center industry ushered in another outbreak 16 The GSMA represents the interests of mobile operators worldwide, uniting more than 750 operators with almost 400 companies in the broader mobile ecosystem, including handset and device makers, software companies, equipment providers and internet companies, as well as organizations in adjacent industry sectors. 17 GSMA: 5G Moves from Hype to Reality – but 4G Still King 18 Smart Cities Market Size Worth $463.9 billion By 2027 19 The Automotive Semiconductor Market – Key Determinants of U.S. Firm Competitiveness 20 AI is data Pac-Man. Winning requires a flashy new storage strategy.
Highlights ‘Value’ sector profits are in terminal decline. Bank profits are in terminal decline, because private sector credit is now ‘maxed out’, and the intermediation between borrowers and savers can be done more cost-effectively by the blockchain. Oil and gas profits are in terminal decline, because we now rely less on the energy stored in ‘chemical bonds’ of portable fossil fuels, and rely more on the energy of ‘moving electrons’ generated from unportable alternative energy sources. Basic resources profits are in terminal decline, because we now rely less on the ‘physical stuff’ that requires basic resources. As such, structurally overweighting the value-heavy European market versus the growth-heavy US market is a ‘widow maker’ trade. The caveat is that a vicious snapback out of growth into value is possible when a universally accepted treatment for Covid-19 is found. Or if bond yields spike. This would create a burst of outperformance from Europe, but any such snapback would be a brief interruption to the mega downtrend. Fractal trade: Long RUB/CZK. Feature Chart of the WeekValue' Has Underperformed For 12 Years... But The Mega Downtrend Isn't Over
Value' Has Underperformed For 12 Years... But The Mega Downtrend Isn't Over
Value' Has Underperformed For 12 Years... But The Mega Downtrend Isn't Over
I have just returned from a summer holiday, on which I took a clean break from the financial markets. A clean break that is highly recommended for anybody who looks at the markets day in, day out. Nevertheless, I made two market-relevant observations. First, that having to wear a face mask on an aeroplane was an unpleasant experience. Tolerable for a short-haul flight lasting a couple of hours, but something that would be unbearable for the duration of a long-haul flight. Second, that even the most popular bars and restaurants in the most popular places were operating at half capacity. They were fully booked, yet the requirements of physical distancing at the bar, and between tables, meant that their operating capacity and revenues had collapsed. Worse, the owners feared a further hit in the winter when eating and drinking in their outdoors spaces became impossible. The use of face masks and physical distancing cripples any economic activity that requires you to have your (uncovered) mouth and nose in proximity to others. These first-hand experiences simply confirm the message in An Economy Without Mouths Or Noses Will Lose 10 Percent Of Jobs.1 The use of face masks and physical distancing cripples any economic activity that requires you to have your (uncovered) mouth and nose in proximity to others – like flying, or drinking and eating out. Hence, if governments remove the financial incentives for employers to retain workers while the pandemic is still rampant, expect structural unemployment to rise sharply. In which case, expect bond yields to remain ultra-low, and where possible, go even lower. And expect ‘growth’ sectors to continue outperforming ‘value’ sectors. Explaining Recent Market Action Returning to the financial markets after a break, several things stood out. Apple has become America’s first $2 trillion company, while HSBC’s share price is within a whisker of its 2008 crisis low. This vignette encapsulates that growth sectors – broadly defined as tech and healthcare – have been roaring ahead, while value sectors – broadly defined as banks, oil and gas, and basic resources – have been struggling. Hence, the growth-heavy S&P500 has reached a new all-time high, while the value-heavy FTSE100 and other European indexes are still deeply in the red for 2020 and have recently drifted lower (Chart I-2). The combined effect is that the strong recovery in global stocks has taken a breather. Chart I-2US Market At All-Time High, But European Markets Still Deeply In The Red
US Market At All-Time High, But European Markets Still Deeply In The Red
US Market At All-Time High, But European Markets Still Deeply In The Red
In turn, the breather in the stock market explains the recent support to the dollar. Significantly, the 2020 evolution of the dollar is a perfect mirror-image of the stock market. Nothing more, nothing less. If the stock market gives back some of its gains, expect the countertrend strengthening in the dollar to continue (Chart I-3). Chart I-3The Dollar Is A Mirror-Image Of The Stock Market
The Dollar Is A Mirror-Image Of The Stock Market
The Dollar Is A Mirror-Image Of The Stock Market
Yet the best performing major asset-class in 2020 is not growth equities, nor is it gold. Instead, it is the US 30-year T-bond, which has returned a spectacular 32 percent (Chart I-4). Chart I-4The Best Performing Major Asset-Class Is The 30-Year T-Bond
The Best Performing Major Asset-Class Is The 30-Year T-Bond
The Best Performing Major Asset-Class Is The 30-Year T-Bond
Suddenly, everything becomes crystal clear. If the ultra-long bond has surged, then other ultra-long duration investments must also surge. Within equities, this means that growth sectors, whose profits are skewed to the very distant future, must receive a huge boost to their valuations. Whereas value sectors whose profits are not growing will receive a smaller (or no) valuation boost. In fact, the value sectors have a much bigger structural problem. Not only are their profits not growing. Their profits are in terminal decline. Since 2008, Overweighting Value Has Been A ‘Widow Maker’ In the 34 years through 1975-2008, value trebled relative to growth.2 Albeit, with the occasional vicious countertrend move, such as the dot com bubble. But through 2009-2020, the tables turned. For the past 12 years, value has structurally underperformed growth and given back around half of its 1975-2008 outperformance (Chart of the Week). This means that for the past 12 years ‘proxy’ value versus growth positions have also structurally underperformed. The best example of such a proxy position is overweighting the value-heavy European market or Emerging Markets versus the growth-heavy US market. Since 2008, underweighting the US market has been a ‘widow maker’ trade. A widow maker trade is when you are on the wrong side of a megatrend. A widow maker trade is when you are on the wrong side of a megatrend. It is a widow maker because it can kill your career, or your finances, or both. The big danger is that a widow maker trade can last for decades. As the uptrend in value versus growth lasted more than three decades, there is no reason to suppose that the downtrend cannot also last a very long time. What drove value’s outperformance for 34 years, and what is driving its underperformance for the past 12 years? The simple answer is the structural trend in profits. Until 2008, the profits of banks, oil and gas, and basic resources kept up with, or even beat, the profits of technology and healthcare. This, combined with the higher yield on these value sectors, resulted in the multi-decade 200 percent outperformance of value versus growth. But since 2008, while the profits of technology and healthcare have continued their strong uptrends, the profits of banks, oil and gas, and basic resources have entered major structural downtrends. It is our high conviction view that these declines are terminal, and the reasons are nothing to do with the pandemic (Chart I-5). Chart I-5Value Sector Profits Are In A Major Structural Downtrend
Value Sector Profits Are In A Major Structural Downtrend
Value Sector Profits Are In A Major Structural Downtrend
Sector Profit Outlooks In One Sentence Each When a sector’s profits flip from a multi-decade uptrend to a multi-decade downtrend, it is almost unheard of for them to reflip into a new uptrend. Essentially, the sector has entered a terminal decline. As strong believers in brevity, we can summarise the reason for the terminal declines in one sentence per sector, as follows: When a sector’s profits flip from a multi-decade uptrend to a multi-decade downtrend, it is almost unheard of for them to reflip into a new uptrend. Bank profits are in terminal decline, because private sector credit is now ‘maxed out’, and the intermediation between borrowers and savers can be done more cost-effectively by the blockchain (Chart I-6). Chart I-6Bank Profits In Terminal Decline
Bank Profits In Terminal Decline
Bank Profits In Terminal Decline
Oil and gas profits are in terminal decline, because we now rely less on the energy stored in ‘chemical bonds’ of portable fossil fuels, and rely more on the energy of ‘moving electrons’ generated from unportable alternative energy sources (Chart I-7). Chart I-7Oil And Gas Profits In Terminal Decline
Oil And Gas Profits In Terminal Decline
Oil And Gas Profits In Terminal Decline
Basic resources profits are in terminal decline, because we now rely less on the ‘physical stuff’ that requires basic resources (Chart I-8). Chart I-8Basic Resources Profits In Terminal Decline
Basic Resources Profits In Terminal Decline
Basic Resources Profits In Terminal Decline
Conversely: Technology profits can grow, because we now rely more on information, ideas, and advice, and over half of the world’s population is still not connected to the internet (Chart I-9). Chart I-9Technology Profits Continue To Grow
Technology Profits Continue To Grow
Technology Profits Continue To Grow
Healthcare profits can grow, because as economies (and people) mature, they spend a much greater proportion of their income on healthcare to improve the quality and quantity of life (Chart I-10). Chart I-10Healthcare Profits Continue To Grow
Healthcare Profits Continue To Grow
Healthcare Profits Continue To Grow
Nevertheless, a vicious snapback out of growth into value is possible. Indeed, it is to be expected when a universally accepted treatment for Covid-19 is found. Or if bond yields spike. But any such snapback, even if vicious, will be a brief countertrend rally in a terminal decline. This is because the megatrends driving down value sector profits were already in place long before the pandemic hit. The pandemic just gave the megatrends an extra nudge. This is our high conviction view. Fractal Trading System* This week’s recommended trade is long RUB/CZK, with the profit target and symmetrical stop-loss set at 5 percent. In other trades, the explosive rallies in precious metals reached exhaustion as anticipated by their fragile fractal structures. This has taken our short gold versus lead position into profit. However, short silver was stopped out before its rally eventually ended. The rolling 1 year win ratio now stands at 60 percent. Chart I-11RUB/CZK
RUB/CZK
RUB/CZK
When the fractal dimension approaches the lower limit after an investment has been in an established trend it is a potential trigger for a liquidity-triggered trend reversal. Therefore, open a countertrend position. The profit target is a one-third reversal of the preceding 13-week move. Apply a symmetrical stop-loss. Close the position at the profit target or stop-loss. Otherwise close the position after 13 weeks. * For more details please see the European Investment Strategy Special Report “Fractals, Liquidity & A Trading Model,” dated December 11, 2014, available at eis.bcaresearch.com. Dhaval Joshi Chief European Investment Strategist dhaval@bcaresearch.com Footnotes 1 Please see the European Investment Strategy Weekly Report "An Economy Without Mouths Or Noses Will Lose 10 Percent Of Jobs", dated July 30, 2020 available at eis.bcaresearch.com. 2 In total return terms. Fractal Trading System Cyclical Recommendations Structural Recommendations Closed Fractal Trades Trades Closed Trades Asset Performance Currency & Bond Equity Sector Country Equity Indicators Bond Yields Chart II-1Indicators To Watch - Bond Yields
Indicators To Watch - Bond Yields
Indicators To Watch - Bond Yields
Chart II-2Indicators To Watch - Bond Yields
Indicators To Watch - Bond Yields
Indicators To Watch - Bond Yields
Chart II-3Indicators To Watch - Bond Yields
Indicators To Watch - Bond Yields
Indicators To Watch - Bond Yields
Chart II-4Indicators To Watch - Bond Yields
Indicators To Watch - Bond Yields
Indicators To Watch - Bond Yields
Interest Rate Chart II-5Indicators To Watch - Interest Rate Expectations
Indicators To Watch - Interest Rate Expectations
Indicators To Watch - Interest Rate Expectations
Chart II-6Indicators To Watch - Interest Rate Expectations
Indicators To Watch - Interest Rate Expectations
Indicators To Watch - Interest Rate Expectations
Chart II-7Indicators To Watch - Interest Rate Expectations
Indicators To Watch - Interest Rate Expectations
Indicators To Watch - Interest Rate Expectations
Chart II-8Indicators To Watch - Interest Rate Expectations
Indicators To Watch - Interest Rate Expectations
Indicators To Watch - Interest Rate Expectations
Dear Client, I will be on vacation next week. Instead of our regular report, we will be sending you a Special Report from my colleague Jonathan LaBerge. Jonathan will explore the risks posed to commercial real estate and the banking system from work-from-home policies and the potential for urban flight towards less populated and more affordable areas. I hope you find his report insightful. Best regards, Peter Berezin, Chief Global Strategist Highlights The Nasdaq 100 index is up 31% since the start of the year. The “Awesome 8” stocks (Amazon, Apple, Facebook, Google, Microsoft, Netflix, Nvidia, and Tesla) have gained a staggering 59%. Will tech outperformance continue? There are five reasons to think it will not: 1) The dismantling of pandemic lockdown measures, hopefully facilitated by a vaccine later this year, could shift some spending from the online realm back to brick-and-mortar stores; 2) Interest rates are unlikely to fall much further, which will remove one of the tailwinds propelling tech outperformance; 3) Tech valuations are now quite stretched; 4) Many marquee tech companies have become so big that further gains in market share may be difficult to achieve; 5) Regulatory and tax policy changes could negatively impact a number of prominent tech names. A pivot in market leadership from tech to non-tech is likely to foster the outperformance of value over growth and non-US over US stocks. Are The Awesome 8 At Risk Of Becoming The Awful 8? After plunging alongside the rest of the stock market in March, tech stocks have roared back. The tech-heavy Nasdaq 100 is up 31% since the start of the year. The “Awesome 8” stocks (Amazon, Apple, Facebook, Google, Microsoft, Netflix, Nvidia, and Tesla) have gained a staggering 59% on a market cap-weighted basis. Meanwhile, the median US stock has lost 14% this year (Chart 1). Will tech outperformance continue? There are five reasons to think it will not: Reason #1: The dismantling of pandemic lockdown measures could shift some spending from the online realm back to brick-and-mortar stores The pandemic has led to a major reallocation of spending from brick-and-mortar stores to online retailers. Sales at US online stores increased by 25% year-over-year in July versus -1% at physical stores (Chart 2). According to Bank of America, after rising steadily from about 5% in 2009 to 16% in 2019, the US e-commerce penetration rate has jumped to 33%, representing more than ten years of growth in only a few months. Chart 1Awesome 8 Propelling Tech Stocks To New Highs
Awesome 8 Propelling Tech Stocks To New Highs
Awesome 8 Propelling Tech Stocks To New Highs
Chart 2Will The Dismantling Of Lockdown Measures Bring Brick-And-Mortar Retailers Back To Life?
Will The Dismantling Of Lockdown Measures Bring Brick-And-Mortar Retailers Back To Life?
Will The Dismantling Of Lockdown Measures Bring Brick-And-Mortar Retailers Back To Life?
There is little doubt that we are still in the midst of a secular transition towards e-commerce. However, it is likely that the dismantling of lockdown measures – hopefully facilitated by the release of a vaccine later this year – will bring back some spending to brick-and-mortar stores. This could produce a temporary air pocket in sales for online sellers, a risk that does not seem to be fully discounted (Chart 3). Chart 3Online Retail Spending Could Slow, At Least Temporarily, As Shopping Malls Reopen
The Return Of Nasdog
The Return Of Nasdog
Chart 4The Pandemic Has Caused Global Server And PC Shipments To Surge
The Pandemic Has Caused Global Server And PC Shipments To Surge
The Pandemic Has Caused Global Server And PC Shipments To Surge
Meanwhile, other tech companies that have benefited from the pandemic could face headwinds. Netflix saw its global subscriber count jump 27% in the second quarter relative to a year earlier. If someone did not bother to purchase a Netflix subscription in March or April, how likely is it that they will subscribe for the first time in September? Along the same lines, global PC and server shipments surged to multi-year highs earlier this year as millions of people were forced to work from home (Chart 4). This likely brought demand for computers and peripheral equipment forward, which could produce a spending vacuum over the next few quarters. Reason #2: Interest rates are unlikely to fall much further, which will remove one of the tailwinds propelling tech outperformance Technology companies are used to cutting prices on older models as newer, more innovative versions come to market. In this sense, deflation is built into their business models. Many tech companies also trade on long-term growth prospects, which means that changes in discount rates have a disproportionately greater impact on the present value of their cash flows than for slower growing companies. All this means that tech stocks tend to outperform in environments where inflation and interest rates are falling. Chart 5Higher Bond Yields Will Benefit Financials
Higher Bond Yields Will Benefit Financials
Higher Bond Yields Will Benefit Financials
We do not expect inflation to surge over the next two years. Nevertheless, the deflationary impulse from the pandemic is likely to abate as spare capacity is absorbed and overall demand recovers. Likewise, bond yields are likely to rise modestly over the next 12 months. Higher bond yields will benefit bank shares (Chart 5). Reason #3: Tech valuations have gotten increasingly stretched Based on full-year estimates, the Nasdaq 100 trades at 32-times 2020 earnings and 27-times 2021 earnings. The Awesome 8 stocks are even more pricey, trading at 43-time and 34-times this year’s and next year’s earnings, respectively (Table 1). Table 1Equity Valuations: Tech Versus Non-Tech
The Return Of Nasdog
The Return Of Nasdog
Outside the IT sector, the S&P 500 trades at 26-times 2020 earnings and 20-times 2021 earnings. It should be noted that these numbers overstate how expensive the non-tech part of the S&P 500 index really is because Amazon resides in the consumer discretionary sector while Facebook, Google, and Netflix sit in the communication sector. In fact, only three of the Awesome 8 are in the S&P 500 IT sector (Tesla has yet to be admitted into the S&P 500, despite having a market cap that would now make it the 10th most valuable company in the index, right ahead of P&G). While the PE ratio on tech stocks is still well below the nosebleed levels reached during the dot-com bubble, other valuation measures are approaching their prior peaks. The S&P 500 IT sector now trades at 6.2-times sales, not far below the peak price-to-sales of 7.8 reached in 2000. Tech stocks trade at 9.6-times book value, the highest level since early 2001, and more than double their peak valuation level in 2007 (Chart 6). Reason #4: Many marquee tech companies have become so big that further gains in market share may be difficult to achieve The Nasdaq’s lofty valuation presumes that earnings will continue to rise at a rapid pace for many years to come. That has certainly been true for the past decade. The Nasdaq 100 enjoyed annualized earnings per share growth of 16% since 2010, 2.5-times the pace of the S&P 500 index and 3.2-times faster than the non-IT constituents of the S&P 500. Indeed, most of the outperformance of tech stocks can be chalked up to their faster earnings growth (Chart 7). Chart 6Tech Stocks: Some Valuation Measures Are Quite Stretched
Tech Stocks: Some Valuation Measures Are Quite Stretched
Tech Stocks: Some Valuation Measures Are Quite Stretched
Chart 7Most Of The Outperformance Of Tech Stocks Can Be Attributed To Faster Earnings Growth
Most Of The Outperformance Of Tech Stocks Can Be Attributed To Faster Earnings Growth
Most Of The Outperformance Of Tech Stocks Can Be Attributed To Faster Earnings Growth
But will such earnings growth continue? That is far from certain. Bottom-up estimates foresee earnings per share among Nasdaq 100 members rising by 20% in 2021. This is actually below the projected earnings growth of 27% for the S&P 500. One sees a similar pattern within S&P 500 sectors: The IT sector is expected to see earnings growth of 15% in 2021 compared with 31% for non-IT sectors (Table 2). Table 2Earnings Growth Projections
The Return Of Nasdog
The Return Of Nasdog
Admittedly, the faster projected earnings growth of non-tech companies in 2021 will constitute a reversal of this year’s pandemic-induced earnings collapse, from which tech was largely insulated. Thus, there is a base effect at work. Nevertheless, if most investors focus mainly on annual growth rates, they could become enamoured with non-tech stocks, at least temporarily. Looking further out, the rapid growth in tech earnings could decelerate as many of today’s marquee tech companies struggle to expand market share. Close to three-quarters of US households already have an Amazon Prime account. Slightly over half have a Netflix account. Nearly 70% have a Facebook account. Google commands 92% of the internet search market. Together, sites owned by Google and Facebook generate about 60% of all online advertising revenue. New opportunities for growth will undoubtedly arise, but there is no guarantee that today’s leaders will be able to take advantage of them. History is littered with tech companies that failed to keep up with a changing world: RCA, Kodak, Polaroid, Atari, Commodore, Novell, Digital, Sinclair, Wang, Iomega, Corel, Netscape, Altavista, AOL, Compaq, Sun, Lucent, 3Com, Nokia, and RIM were all major players in their respective industries, only to fade into oblivion. Stock market investors were very lucky that companies such as Microsoft, Cisco, Nvidia, Qualcomm, Oracle, Amazon, and Netflix issued shares to the public at an early stage in their development (Table 3). All seven had market caps below $1 billion when they went public. Such hidden gems are becoming less common: The number of publicly listed companies in the US is still well below what it was two decades ago (Chart 8). The median age of tech companies at the time of their IPO has risen from around 7 years in the 1990s to 11 years in 2019 (Chart 9). Table 3Big Gains From Once Small Companies
The Return Of Nasdog
The Return Of Nasdog
Chart 8The Number Of US Publicly Listed Companies Is Not What It Once Was
The Number Of US Publicly Listed Companies Is Not What It Once Was
The Number Of US Publicly Listed Companies Is Not What It Once Was
Chart 9Tech Companies Entering The Public Arena Are Now More Mature
The Return Of Nasdog
The Return Of Nasdog
Reason #5: Regulatory and tax policies could negatively impact a number of prominent tech names Historically, the US government has taken a laissez-faire approach towards the tech sector. As an avowedly pro-business party, the Republicans were happy to espouse deregulation and low corporate taxes, while lauding Silicon Valley’s dynamism and global dominance. The Democrats also had a cozy relationship with the tech sector. As Chart 10 shows, political donations from tech company employees are heavily skewed towards Democratic candidates. Chart 10Tech Company Employees Donate Heavily Towards Democrats
The Return Of Nasdog
The Return Of Nasdog
Things may not be as easy for the tech sector going forward, however. Conservatives have accused social media companies of stifling their voices. According to a recent Pew Research study, 53% of conservative Republicans favor increasing government regulation of big tech companies, up from 42% in 2018 (Chart 11). For their part, Democrats have expressed concerns about the growing monopoly power of tech companies and their perceived insouciant attitude towards consumer privacy. Chart 11Conservatives Favor Increased Government Regulation Of Big Tech Companies
The Return Of Nasdog
The Return Of Nasdog
A Biden administration would not be as tough on tech companies as say, an Elizabeth Warren administration. Nevertheless, Biden has said that breaking up big tech companies is "something we should take a really hard look at."1 He has also argued that online platforms should not be granted legal immunity for user-generated content. On the tax side, Biden has vowed to reverse half of Trump’s corporate tax cuts, while introducing a minimum 15% corporate tax. The latter could disproportionately affect a number of prominent tech companies that have taken full advantage of the current tax code to minimize their tax liabilities. Meanwhile, tech companies are increasingly finding themselves in the crossfire between China and the US. While Joe Biden would not be as quick to impose unilateral tariffs on China as Donald Trump, BCA Research’s geopolitical strategists warn that the rivalry between the two nations will intensify over the coming decade as they reduce their economic interdependency and vie for military advantage in Asia.2 This could have adverse implications for tech firms’ ability to maximize global market share, never mind optimizing global supply chains. Pivot Towards Value And International Stocks Tech stocks are overrepresented in growth indices, while financials dominate value indices (Table 4). Thus, it is not surprising that the relative performance of tech versus financial stocks has closely mirrored the relative performance of growth versus value stocks (Chart 12). If tech stocks shift from being leaders to laggards, value stocks will shift from being laggards to leaders. Table 4Breaking Down Growth And Value By Sector
The Return Of Nasdog
The Return Of Nasdog
Chart 12The Relative Performance Of Tech Stocks Has Closely Mirrored The Relative Performance Of Growth Versus Value
The Relative Performance Of Tech Stocks Has Closely Mirrored The Relative Performance Of Growth Versus Value
The Relative Performance Of Tech Stocks Has Closely Mirrored The Relative Performance Of Growth Versus Value
Chart 13The Valuation Gap Between Value And Growth Is Larger Today Than At The Height Of The Dot-Com Bubble
The Valuation Gap Between Value And Growth Is Larger Today Than At The Height Of The Dot-Com Bubble
The Valuation Gap Between Value And Growth Is Larger Today Than At The Height Of The Dot-Com Bubble
Value stocks usually appear “cheap” in relation to growth stocks, but the valuation gap is much larger today than in the past – larger, in fact, than at the height of the dot-com bubble (Chart 13). Despite their name, growth stocks usually underperform value stocks when global growth is on the upswing (Chart 14). Provided that progress is made towards developing a vaccine, global growth should remain above trend over the next 12 months, giving value stocks a lift. Chart 14Growth Stocks Usually Underperform Value Stocks When Global Growth Is On The Upswing
Growth Stocks Usually Underperform Value Stocks When Global Growth Is On The Upswing
Growth Stocks Usually Underperform Value Stocks When Global Growth Is On The Upswing
Value stocks also generally do better when the US dollar is weakening. Recall that tech stocks did phenomenally well in the late 1990s when the dollar was rising, but faltered during the period of dollar weakness from 2001 to 2008 (Chart 15). As we discussed last week, the dollar is likely to depreciate further in the months ahead. Chart 15Value Stocks Generally Do Better When The US Dollar Is Weakening
Value Stocks Generally Do Better When The US Dollar Is Weakening
Value Stocks Generally Do Better When The US Dollar Is Weakening
Chart 16Stronger Global Growth And A Weaker US Dollar Tend To Be Good News For Non-US Stocks
Stronger Global Growth And A Weaker US Dollar Tend To Be Good News For Non-US Stocks
Stronger Global Growth And A Weaker US Dollar Tend To Be Good News For Non-US Stocks
Stronger global growth and a weaker US dollar tend be good news for non-US stocks (Chart 16). As US tech stocks enter a holding pattern, stock markets outside the US will assume the upper hand. Investors should reallocate equity capital towards value stocks and overseas stock markets. Peter Berezin Chief Global Strategist peterb@bcaresearch.com Footnotes 1 Hunter Woodall, “2020 hopeful Biden says he’s open to breaking up Facebook,” The Associated Press, May 13, 2019. 2 Please see Geopolitical Strategy Weekly Report, “A Tech Bubble Amid A Tech War,” dated July 31, 2020. Global Investment Strategy View Matrix
The Return Of Nasdog
The Return Of Nasdog
Current MacroQuant Model Scores
The Return Of Nasdog
The Return Of Nasdog
Highlights The strength in global semiconductor sales in recent months has been due to one-off factors stemming from pandemic-related lockdowns. As the one-off demand surge subsides, global semiconductor sales will decline modestly toward the end of this year. In the near term, global semiconductor stock prices are vulnerable due to overbought conditions, excessive valuations and demand disappointment. The global semiconductor industry is at the epicenter of the US-China confrontation, and more US restrictions on chips sales to China are probable. This is another risk for this sector's share prices. Nevertheless, the structural outlook for global semiconductor demand is constructive. Its CAGR may rise from 3% during 2014-2019 to 5% during 2020-2024. Feature Investor euphoria has taken hold of semiconductor stocks. Global semiconductor stock prices have skyrocketed by 68% from March lows and 96% from December 2018 lows. Meanwhile, global semiconductor sales during March-June rose only by 5% from a year ago. As a result, the ratio of market cap for global semiconductor stocks relative to global semiconductor sales has reached its highest level since at least the inception of data in 2003 (Chart 1). Chart 1Global Semiconductor Sector: Market Cap-To-Sales Ratio Has Surged
Global Semiconductor Sector: Market Cap-To-Sales Ratio Has Surged
Global Semiconductor Sector: Market Cap-To-Sales Ratio Has Surged
With semi equity multiples very elevated, their share prices have become even more sensitive to global semiconductor demand growth. Hence, the focus of this report is to try to gauge the strength of global semiconductor demand, both in the near term and structurally. Near-term semiconductor stock prices could disappoint due to weak chip demand from the smartphone sector and diminishing purchases of personal computers (PCs) and servers. However, structurally, we are positive on global semiconductor demand, which is underpinned by the continuing rollout of 5G networks and phones, a wider adoption of data centers, and further technological advancements in artificial intelligence (AI), cloud computing, edge computing and smaller nodes for chip manufacturing (Box 1). Box 1 Key Technologies Underpinning Potential Global Semiconductor Demand AI refers to the simulation of human intelligence in machines, for example, computers that play chess and self-driving cars. The goals of AI include learning, reasoning and perception. Cloud computing is the delivery of computing services – including servers, storage, databases, networking, software, analytics and intelligence – over the Internet (“the cloud”) to offer faster innovation, flexible resources and economies of scale. Edge computing is a form of distributed computing, which brings computation and data storage closer to where it is needed, to improve response times and save bandwidth. Technology node refers to the width of line that can be processed with a minimum width in the semiconductor manufacturing industry, such as technology nodes of 10 nanometers (nm), 7nm, 5nm and 3nm. The smaller the nodes are, the more advanced they are. Near-Term Headwinds Chart 2World Semiconductor Sales Diverged From The Global Business Cycle
World Semiconductor Sales Diverged From The Global Business Cycle
World Semiconductor Sales Diverged From The Global Business Cycle
Semiconductor demand worldwide grew by 6% year-on-year in the first half of this year. There has been a remarkable divergence between world semiconductor sales and the global business cycle (Chart 2). The divergence between semiconductor sales and economic activity was most striking in the US and China. Semiconductor sales in China rose by 5% year-on-year in Q12020, and in the US they grew by 29% year-on-year in Q22020, despite a contraction in their aggregate demand during the same period. By contrast, Q2 annual growth of semiconductors sales was -2.2% for Japan, -17% for Europe and 1.8% for Asia ex. China and Japan (Chart 3). The reasons why the US and China posted a surge in semiconductor demand while Europe and Japan experienced a contraction in domestic semiconductor sales are as follows: Most data center investment is occurring in the US and China. Chart 4 shows that 40% of global hyperscale data centers are operating in the US, much larger than any other countries/regions. China, in turn, ranked second, with a global share of 8%. Chart 3Strong Semiconductor Sales In The US And China, But Not Elsewhere
Strong Semiconductor Sales In The US And China, But Not Elsewhere
Strong Semiconductor Sales In The US And China, But Not Elsewhere
Chart 4The US Has The Most Global Hyperscale Data Centers
Global Semiconductor Stocks: A Hiatus Is Overdue In A Structural Bull Market
Global Semiconductor Stocks: A Hiatus Is Overdue In A Structural Bull Market
Demand contraction in Europe and Japan is due to semiconductor demand in these regions mainly originating from the automobile sector, where production was severely hit by the global pandemic. About 37% of European semiconductor sales were from last year’s automotive market. We believe the divergence between global economic activity and semiconductor sales, as demonstrated by Chart 2 on page 3, has been due to one-off factors, as the global pandemic lockdowns have spurred semiconductor demand. Such a one-off demand boost will likely dissipate in the coming months. Traditional PCs and tablets: There has been a surge in demand for traditional PCs1 and tablets in the past six months. This was due to the significant increase in online activities, such as working from home, education, e-commerce, gaming and entertainment. Data from the International Data Corporation (IDC) has revealed that shipments of traditional PCs and tablets in volume terms had a strong year-on-year growth of 11.2% and 18.6%, respectively, in the period of April-June (Chart 5). Looking forward, even renewed lockdowns will not lead to a similar rush to buy these products. Many households are already equipped to work from home and for other online activities. With many countries gradually opening their economies, such demand will diminish. The traditional PC and tablet sectors together account for about 13% of global chip demand (Chart 6). Chart 5Personal Computers Sales Have Surged Amid Lockdowns
Personal Computers Sales Have Surged Amid Lockdowns
Personal Computers Sales Have Surged Amid Lockdowns
Chart 6The Breakdown Of Global Semiconductor Sales By Type Of Usage
Global Semiconductor Stocks: A Hiatus Is Overdue In A Structural Bull Market
Global Semiconductor Stocks: A Hiatus Is Overdue In A Structural Bull Market
Chart 7Server Sales Have Surged Amid Lockdowns
Server Sales Have Surged Amid Lockdowns
Server Sales Have Surged Amid Lockdowns
Server demand: Another major semiconductor demand contribution in Q2020 was from the server sector, which spiked by 21% year-on-year (Chart 7). The surge in online activities triggered a strong demand for cloud services and remote work applications, both of which require computer servers to run on. However, demand from the server sector is also set to diminish in 2H2020 and Q1 2021. Provided the inventories at major data center operators, including Microsoft, Google and Amazon, remain at high levels,2 global cloud service providers will likely reduce their orders of servers next quarter.3 Enterprises will also likely cut their investment in computer servers in 2H2020, as many of them had already increased their purchases of servers to prepare employees and business processes for remote working. We expect global server demand growth to soften in 2H2020. The Digitimes Research forecasted a 5.6% quarter-on-quarter contraction in 3Q2020 and a further cut in global sever shipment in the 4Q2020.2 The global server sector accounts for about 10% of global chip demand and, together with PCs and tablets, they make for 23% (please refer to Chart 6 on page 5). Further, the smartphone sector – accounting for 27% of global semiconductor demand – will continue struggling in H2 this year. The global total smartphone demand has been hit severely, as households delayed their new smartphone purchases. According to Canalys’ data, global smartphone shipments dropped by 13% and 14% year-on-year in Q1 and Q2, respectively. The strength in global semiconductor sales in recent months has been due to one-off factors stemming from the lockdowns. Chart 8Global Smartphone Shipments Will Likely Remain Weak In 2020H2
Global Smartphone Shipments Will Likely Remain Weak In 2020H2
Global Smartphone Shipments Will Likely Remain Weak In 2020H2
We expect smartphone shipments to continue contracting over the next three-to-six months (Chart 8). We believe global consumers will remain cautious in their spending on discretionary goods, such as smartphones, due to lowered incomes and increased job uncertainty. The IDC also forecasted that global smartphone shipments would not grow until 1Q2021.4 The Chinese smartphone sales showed a considerable weakness in July, with a 35% year-on-year contraction, which is much deeper than the 20% decline in H1 this year. 5G smartphone shipments also slowed last month, with a 21% drop from the previous month. Bottom Line: The strength in global semiconductor sales in recent months has been due to one-off factors stemming from the lockdowns. As this one-off demand subsides, global semiconductor sales will decline modestly toward the end of this year. Given the overbought conditions and the elevated equity valuations, global semiconductor stocks are currently vulnerable to near-term disappointments in semiconductor demand. At The Epicenter Of The US-China Rivalry Semiconductors are at the epicenter of the US-China confrontation. Ultimately, the US-China contention is about future technological dominance. That is access to technology and the capability to develop new technologies. The global semiconductor industry is at the epicenter of the US-China confrontation. China currently accounts for about 35% of the global semiconductor demand. US restrictions on semi producers worldwide to supply semiconductors to Chinese buyers constitute a major risk to semiconductor stock prices. On August 17, the US announced fresh sanctions that restrict all US and foreign semiconductor companies from selling chips developed or produced using US software or technology to Huawei, without first obtaining a license. In May, the US had already limited companies, such as the Taiwan Semiconductor Manufacturing Company (TSMC), from making and supplying Huawei with its self-designed chips. In addition, the US recently threatened bans on Chinese-owned apps TikTok and WeChat, and signaled that it could soon restrict Alibaba’s operations in the US. Chart 9Global Semi Companies' Sales To China Are Substantial
Global Semiconductor Stocks: A Hiatus Is Overdue In A Structural Bull Market
Global Semiconductor Stocks: A Hiatus Is Overdue In A Structural Bull Market
The global semiconductor sector is highly vulnerable to further escalation in the tension between these two superpowers. Major global semiconductor companies’ sales are heavily exposed to China, and their revenue from China ranges from 16% to 50% of total (Chart 9). We have been puzzled why global semi share prices have been rallying in spite of US limitations on semiconductor shipments to Huawei and its affiliated entities. One explanation could be that the Chinese companies that are not affiliated with Huawei are able to import semiconductors and then supply them to Huawei. If this is true, the US will have no other choice but to limit all semiconductor sales to China. This will be devastating for global semi producers given their large exposure to China. In anticipation of US punitive policies limiting its access to semiconductors, China had boosted its semiconductor imports over the past 12 months (Chart 10, top panel). Chinese imports of integrated circuits rose by 12% year-on-year in 1H2020, which is much higher than the 5% year-on-year increase in Chinese semiconductor demand during the same period (Chart 10, bottom panel). This gap suggests the country had restocked its semiconductor inventories. China has particularly restocked its imports of non-memory chips with imports of processor & controller and other non-memory chips in H1, surging by 30% and 20%, respectively, in US dollar terms (Chart 11). For memory chips, the contraction in Chinese imports was mainly due to a decline in global memory chip prices. Chart 10China Had Likely Restocked Its Semi Inventories
China Had Likely Restocked Its Semi Inventories
China Had Likely Restocked Its Semi Inventories
Chart 11Strong Chinese Imports In Non-Memory Chips
Strong Chinese Imports In Non-Memory Chips
Strong Chinese Imports In Non-Memory Chips
Bottom Line: The global semiconductor industry is at the epicenter of the US-China confrontation, and more restrictions on sales to China are probable. In turn, the restocked semiconductor inventory in China raises the odds of weakening mainland semiconductor import demand in H2 of this year. Structural Tailwinds Table 1Global Semiconductor Demand CAGR Forecast Over 2020-2024 By Device
Global Semiconductor Stocks: A Hiatus Is Overdue In A Structural Bull Market
Global Semiconductor Stocks: A Hiatus Is Overdue In A Structural Bull Market
We are optimistic on structural global semiconductor demand. Its nominal CAGR may rise from 3% during 2014-2019 to 5% during 2020-2024 in US dollar terms. Table 1 shows our demand growth forecasts for global chips in the main consuming sectors over the next five years. The major contributing sectors during 2020-2024 will be 5G smartphones, servers, industrials, electronics and automotive manufacturing. The underlying driving forces are the continuing rollout of 5G networks and phones, the development of data centers, and further technological advancements in AI, cloud computing and edge computing. Currently, the world is still in the early stages of 5G network development. AI, cloud computing and edge computing are constantly evolving. With increasing adoption of 5G smartphones, computer servers and IoT devices, global semiconductor demand is in a structural uptrend (Box 2). Box 2 Key Components For The Virtual World In Development Data centers and cloud computing allow data to be stored and applications to be running off-premises and to be accessed remotely through the internet. Edge computing allows data from Internet of things (IoT) devices to be analyzed at the edge of the network before being sent to a data center or cloud. IoT devices contain sensors and mini-computer processors that act on the data collected by the sensors via machine learning. The IoT is a growing system of billions of devices — or things — worldwide that connect to the internet and to each other through wireless networks. AI technology empowers cloud computing, edge computing and IoT devices. 5G is at the heart of the IoT industry transformation, making a world of everything connected possible. 5G Smartphone Currently, China is the world’s largest 5G-smartphone consumer and the leading 5G-adopter in the world. According to Digitimes Research, global 5G smartphone shipments will reach over 250 million units in 2020, with 170 million (68%) in China and only 80 million units in the world ex. China. Looking forward, 5G smartphone shipments are set to accelerate worldwide over the coming years. Chart 125G Phone Shipments In China Will Continue To Rise
5G Phone Shipments In China Will Continue To Rise
5G Phone Shipments In China Will Continue To Rise
The 5G phone shipments in China will continue to rise. The 5G phone sales penetration rate in China is likely to rise from 60% in July to 95% by the end of 2022. In such a case, we estimate that the monthly Chinese 5G phone shipments will increase from the current 16 million units to about 25-30 million units in 2022 (Chart 12). In the rest of the world, the 5G smartphone adoption pace will also likely speed up over the next five years. The 5G phone selling prices in the world outside China will drop, as more models are introduced and become more affordable. 5G smartphone prices have already fallen in China and will inevitably fall elsewhere. Chinese 5G smartphone producers will ship their low-priced 5G phones overseas, putting pressure on other producers to lower their prices. The 5G infrastructure development is accelerating in China and will accelerate in the rest of the world. Both China and South Korea have been very aggressive in their respective 5G network development. As of the end of June, China's top three carriers: China Mobile, China Unicom, and China Telecom – which together serve more than 1.6 billion mobile users in the country – had installed 400,000 5G base stations against an annual target of 500,000. In comparison, as of April 2020, American carriers had only put up about 10,000 5G base stations.5 As the US is competing with China on the 5G front, the country will likely boost its investment in 5G network development aggressively over the next five years in order to catch up to, or even exceed, China. Importantly, the 5G smartphone has more silicon content than 4G smartphones. More silicon content means higher semiconductor value. Rising 5G smartphone sales and higher silicon content together will more than offset the loss in semiconductor sales due to falling global 4G smartphone shipments. Based on our analysis, we expect a CAGR growth of 4% in semiconductor demand from the global smartphone sector over the next five years, slightly lower than the 5% in previous five years (Table 1 on page 10). This also takes into consideration that the 5G network will be more difficult and more expensive to develop than the 4G network. Servers Global server shipment growth will be highly dependent on both the pace and the scale of data center development (Box 3). Data centers account for over 60% of global server demand. The future growth of data centers is promising. The global trend of data localization6 due to the concerns of data privacy and national security will also bolster a boom of data centers over the next five years. A growing number of countries are adopting data localization requirements, such as China, Russia, Indonesia, Nigeria, Vietnam and some EU countries. While the Chinese data center market is expected to expand by a CAGR of about 28% over 2020-2022,7 a report recently released by Technavio forecasted the global data center industry’s CAGR at over 17% during 2019-2023. We forecast that the global semiconductor demand from servers will grow at a CAGR of 12% over 2020-2024. Box 3 Data Centers There are four main types of data centers – enterprise data centers, managed services data centers, colocation data centers, and cloud data centers. Data centers can have a wide range of number of servers. Corporate data centers tend to have either 200 (small companies), or 1000 servers (large companies). In comparison, a hyperscale data center usually has a minimum of 5,000 servers linked with an ultra-high speed, high fiber count network. Outsourcing and a move towards the cloud are driving the growth of the hyperscale data center. Instead of companies investing in physical hardware, they can rent server space from a cloud provider to both save their data and reduce costs. Amazon, Microsoft, Google, Apple and Alibaba are all top global cloud service providers. The more hyperscales to be built up, the higher the demand for servers. In 2019, about 13% of the total number of data centers in China were of the hyperscale and large-scale varieties. The plan of new infrastructure development announced earlier this year by Beijing was aiming to increase the number of hyperscale and large-scale data centers in China. Among current data centers either under construction or to be developed in the near future, 36% of them are hyperscale and large-scale data centers. IoTs Technological advancements in AI, cloud computing and edge computing, in combination with 5G network development, will facilitate the IoTs adoption. According to the GSMA,8 46 operators in 24 markets had launched commercially available 5G networks by 30 January 2020. It forecasted that global IoT connections will be increased from 12 billion mobile devices in 2019 to 25 billion in 2025 with a CAGR at 13%.9 IoTs chips include the Artificial Intelligence of Things (AIoT) – a powerful convergence of AI and the IoT. IoTs is an interconnected network of physical devices. Every device in the IoT is capable of collecting and transferring data through the network. Looking forward, global demand of AI chips and IoT chips will have significant potential to grow with creation of “smarter manufacturing”, “smarter buildings”, “smarter cities”, etc. AI applications can be used in manufacturing processes to render them smarter and more automated. Productivity will be enhanced as machines achieve significantly improved uptime while also reducing labor costs. There are plenty of upsides in industrial semiconductor demand (Chart 13). We expect the CAGR of industrial electronics to increase from 3.4% during 2014-2019 to 8% during 2020-2024. AI applications can create smart buildings by increasing connectivity across enterprise assets, enabling home network infrastructure (e.g., routers and extenders) and employing home-security devices (e.g., cameras, alarms and locks). AI applications can be used to create smart cities. A smart city is an urban area that uses different types of IoT electronic sensors to collect data. Insights gained from that data are used to manage assets, resources and services efficiently; in return, that data is used improve operations across the city. China has already developed about 750 trial sites of smart cities with different degrees of smartness in the past decade. As AI and 5G technology advances, the existing smart cities’ “smartness” will be upgraded and new trial smart cities will be implemented. Based on IDC data, China’s investment in smart cities will rise at a CAGR of 13.5% over 2020-2023 (Chart 14). Globally, the U.S., Japan, European countries and other nations are also actively developing smart cities. According to a new study conducted by Grand View Research, the global smart cities market size is expected to grow at a CAGR of 24.7% from 2020 to 2027.10 Chart 13Plenty Of Upside In Industrial Semiconductor Demand
Plenty Of Upside In Industrial Semiconductor Demand
Plenty Of Upside In Industrial Semiconductor Demand
Chart 14China’s Investment In Smart Cities Will Continue To Grow
Global Semiconductor Stocks: A Hiatus Is Overdue In A Structural Bull Market
Global Semiconductor Stocks: A Hiatus Is Overdue In A Structural Bull Market
Automotive We expect the global automotive chip market to grow at a CAGR of 9% during 2020-2024, as in 2014-2019. The increase in consumption of semiconductors by the auto industry will continue to be driven by the market evolution toward autonomous, connected, electric and shared mobility. Most new vehicles now include some level of advanced driver assist systems (ADAS), such as adaptive cruise control, automatic brakes, blind spot monitoring, and parallel parking. The whole industry is progressing toward fully autonomous vehicles in the coming years. Increasing adoption of automotive chips and recovering car sales will revive automotive chip sales. In addition, rising penetration of new energy vehicles (NEVs) is beneficial to semiconductor sales, as NEVs contain higher semiconductor content than conventional vehicles. Conventional vehicles contain an average of a $330 value of semiconductor content while hybrid electric vehicles can contain up to $1,000 and $3,500 worth of semiconductors.11 Regarding other sectors, we are also positive on structural demand of storage and consumer electronics. AI applications generate vast volumes of data—about 80 exabytes per year, which is expected to increase by about tenfold to 845 exabytes by 2025.12 In addition, developers are now using more data in AI and deep learning (DL) training, which also increases storage requirements. With massive potential demand for storage, we estimate a CAGR of 7% over 2020-2024 (Table 1 on page 10). A recent report from ABI Research predicts that the COVID-19 pandemic will increase global sales of wearables (such as a Fitbit or Apple Watch) by 29% to 30 million shipments of the devices this year. With contribution from wearables, we expect global semiconductor demand from the consumer sector to grow at a CAGR of 3% over 2020-2024, the same rate as in the previous five years. Bottom Line: Continuing rollout of 5G networks and phones, development of data centers, and further technological advancements in AI and cloud computing will provide tailwinds to structural global semiconductor demand, accelerating its CAGR growth from 3% during 2014-2019 to 5% during 2020-2024. Valuations And Investment Conclusions Most global semiconductor stocks are currently over-hyped. Critically, both DRAM and NAND prices have been deflating since January, reflecting weak demand for memory chips. Yet, share prices of memory producers have rallied (Chart 15). Overall, global semiconductor stock prices have diverged from their sales and profits. Overall, global semiconductor stock prices have diverged from their sales and profits (Chart 16). Chart 15Falling Memory Prices Pose Risk To Memory Stocks
Falling Memory Prices Pose Risk To Memory Stocks
Falling Memory Prices Pose Risk To Memory Stocks
Chart 16Global Semiconductor Stocks Have Deviated From Profits
Global Semiconductor Stocks Have Deviated From Its Profits
Global Semiconductor Stocks Have Deviated From Its Profits
Consequently, the multiples of semiconductor stocks have spiked to multi-year highs (Chart 17). Even after adjusting for negative US real bond yields, valuations of semiconductor stocks are not cheap. Chart 18 illustrates the equity risk premium for global semiconductor stocks is at the lower end of its range of the past 10 years. The ERP is calculated as forward earnings yield minus 10-year US TIPS yields. It is impossible to time a correction or know what the trigger would be (US-China tensions have been our best guess). Nevertheless, we do not recommend chasing semiconductor stocks higher due to their overstretched technicals and valuations on the one hand and potential weakening demand in H2 on the other. Chart 17Global Semiconductor Stocks: Elevated Valuations
Global Semiconductor Stocks: Elevated Valuations
Global Semiconductor Stocks: Elevated Valuations
Chart 18Equity Risk Premium For Global Semi Stocks Is Historically Low
Equity Risk Premium For Global Semi Stocks Is Historically Low
Equity Risk Premium For Global Semi Stocks Is Historically Low
In addition, the ratio of global semi equipment stock prices relative to the semi equity index correlates with absolute share prices of global semi companies. This is because equipment producers are higher-beta as they outperform during growth accelerations and underperform during growth slumps. The basis is that semi manufacturers have to purchase equipment if there is actual strong demand coming up and vice versa. The recent underperformance by global semi equipment stocks relative to the semi equity index might be an early sign of a potential reversal in semi share prices in absolute terms (Chart 19). Chart 19A Signal Of A Potential Reversal In Semi Share Prices
A Signal Of A Potential Reversal In Semi Share Prices
A Signal Of A Potential Reversal In Semi Share Prices
Meanwhile, we believe the subsector- memory chip stocks - will outperform the overall semiconductor index amidst the potential correction, because they have lagged and are less over-extended. Finally, we remain neutral on Taiwanese and Korean bourses within the EM equity space for now. Escalation in US-China confrontation, as well as their exposure to semiconductors, put these bourses at near-term risk. That said, we are reluctant to underweight these markets because fundamentals in EM outside North Asia remain challenging. Ellen JingYuan He Associate Vice President ellenj@bcaresearch.com Footnotes 1Traditional PCs are comprised of desktops, notebooks, and workstations. 2Global server shipments to contract 5.6% sequentially in 3Q2020, says Digitimes Research 3Global server shipments forecast to increase by 5% this year: TrendForce 4IDC Expects Worldwide Smartphone Shipments to Plummet 11.9% in 2020 Fueled by Ongoing COVID-19 Challenges 5America does not want China to dominate 5G mobile networks 6“Data localization” can be defined as the act of storing data on a device that is physically located within the country where the data was created. Data localization requirements are governmental obligations that explicitly mandate local storage of personal information or strongly encourage local storage through data protection laws that erect stringent legal compliance obligations on cross-border data transfers. 7The big data center industry ushered in another outbreak 8The GSMA represents the interests of mobile operators worldwide, uniting more than 750 operators with almost 400 companies in the broader mobile ecosystem, including handset and device makers, software companies, equipment providers and internet companies, as well as organizations in adjacent industry sectors. 9GSMA: 5G Moves from Hype to Reality – but 4G Still King 10Smart Cities Market Size Worth $463.9 billion By 2027 11The Automotive Semiconductor Market – Key Determinants of U.S. Firm Competitiveness 12AI is data Pac-Man. Winning requires a flashy new storage strategy.