Technology
BCA Research's US Equity Strategy service remains underweight the S&P communications equipment index Our S&P communications equipment index underweight stance is paying dividends, and ongoing capex-related woes signal that a breakdown is looming.…

Avoid The Value Trap
Avoid The Value Trap
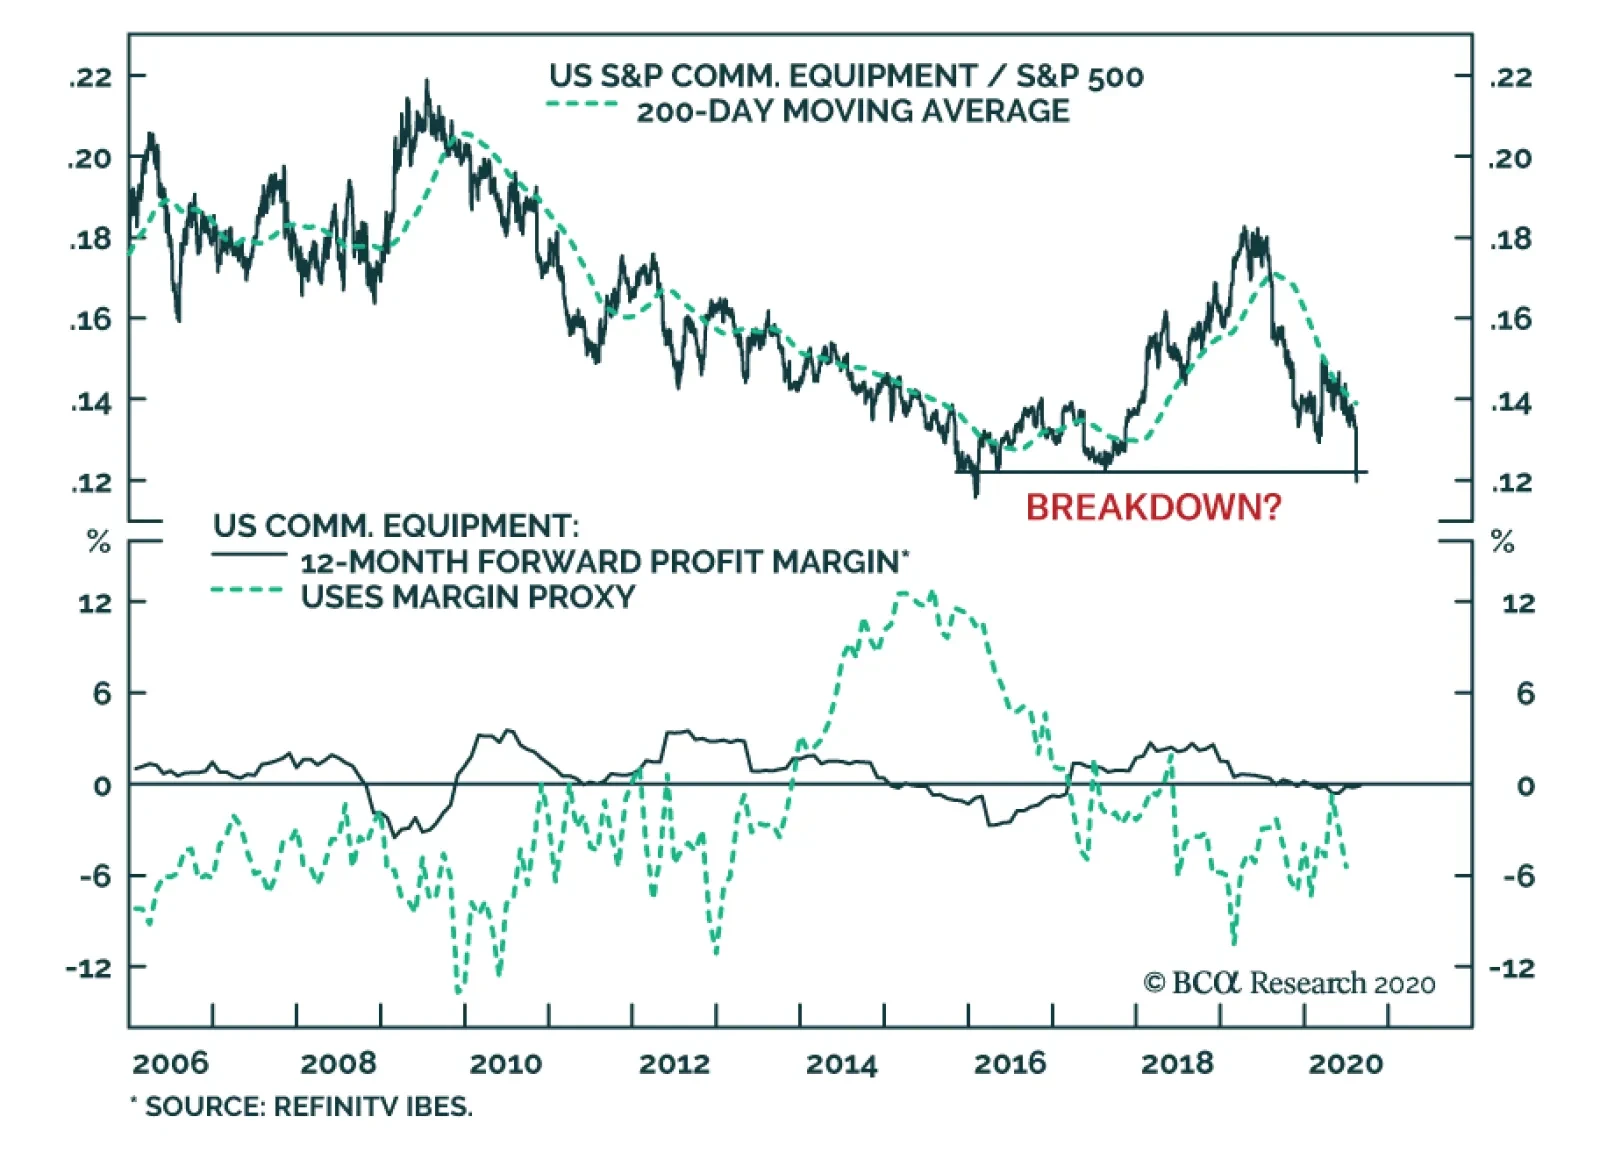
Underweight Our S&P communications equipment index underweight stance is paying dividends, and ongoing capex-related woes signal that a breakdown is looming (top panel). US CEOs are still reluctant to spend on big ticket items, as highlighted by the most recent CEO Confidence Survey (bottom panel). Lackluster capex spending will remain a headwind for CSCO, which commands a 77% market cap weight in the index. True, the recent drubbing in the greenback should aid telecom equipment exports (second panel). However, the industry’s 40% foreign sales exposure is on par with the SPX, underscoring that a weaker dollar will fail to provide relative profit relief. In fact, our margin proxy has rolled over recently signaling that the sell side’s profit margin optimism is unwarranted (middle panel). All of this suggests that the industry’s 30% forward P/E discount to the broad market represents a value trap rather than an opportunity (fourth panel). As a reminder, our technology sector (currently neutral) strategy is to prefer “defensive” software and services stocks at the expense of hardware and equipment manufacturers. Bottom Line: We remain underweight the S&P communications equipment index. The ticker symbols for the stocks in this index are: BLBG – S5COMM – CSCO, JNPR, MSI, ANET, FFIV.
Dear Client, In lieu of our regular report next week, we are sending you a Special Report from my colleague Chester Ntonifor, Foreign Exchange Strategist. Chester will share his outlook on the Hong Kong Dollar. I hope you will find his report insightful. Please note that next week’s report will be published on Friday, August 21. Best regards, Jing Sima, China Strategist Highlights President Trump's ban of China-based apps marks a new front in the Sino-US tech war. There is no change in our strategic views. The impact on both China’s aggregate economic growth outlook and the financial markets should be limited on a cyclical basis. Consider overweight Chinese offshore ex-TMT stocks and onshore semiconductor stocks within a global equity portfolio, against a backdrop of escalating hostilities in the tech sphere. Feature Chart 1Five Chinese Companies Are Mentioned In The New "Clean Network" Initiative
Five Chinese Companies Are Mentioned In The New "Clean Network" Initiative
Five Chinese Companies Are Mentioned In The New "Clean Network" Initiative
Geopolitical risks again stirred up volatility last week in China’s equity markets. President Trump issued two executive orders to take effect in 45 days, banning US transactions with the Chinese-owned social media apps TikTok and WeChat. Shares in Tencent, the China-based Internet giant that owns WeChat, have plummeted by 11% in China’s offshore market following the ban announcement (Chart 1). The event underscores that technology is at the root of a power struggle between the US and China. The struggle will likely be exploited by Trump as the US presidential election nears and Trump’s polling numbers lag. However, we remain constructive on Chinese stocks over the next 6 to 12 months. Although the latest development remains highly fluid, the tensions should not have a material impact on the cyclical outlook for China’s aggregate economy or financial markets. This will be the case as long as the situation does not degenerate into an outright tariff increase on Chinese export goods or other strategic actions with the potential to cause major economic damage. Given rising downside risks to Chinese tech company stocks in the near term, we recommend investors hold a neutral position on Chinese tech giant company equities versus their global peers. Instead, investors should overweight Chinese “old economy” stocks as well as sectors that are greatly benefited from policy support. We initiate two trades today: long MSCI China ex-TMT versus MSCI Global ex-TMT;1 and long domestic semiconductor stocks versus global semiconductor benchmark. A New Front In Tech War It is likely that the US will implement the ordered bans in some way. Banning TikTok wasn’t a surprise because the US had amply signaled its displeasure with the app in preceding months. The social media company has rapidly gained US market share and hence access to American users’ data. Its parent company ByteDance is based in Beijing and therefore subject to China’s cybersecurity laws, a major source of bilateral tensions. The company originated in a Chinese acquisition of an American company, another irritant for the Trump administration. The US is now pressuring TikTok’s US operations to sell the app to an American-based company such as Microsoft. Regarding Trump’s executive order on WeChat and Tencent, it is not clear what “transactions” with Tencent will be disallowed from the US market.2 Additionally, US officials later appeared to backpedal and limit the scope of the executive order on Tencent to only the WeChat app. We have a few preliminary observations on the evolving situation: It is unknown how far the executive action will go regarding Tencent. The Internet titan gets less than 5% of its revenues from outside China, according to its 2019 financial statement. However, Tencent has many prominent investments in the US gaming and music industries. The US Commerce Department has 45 days to interpret and enforce the directive. The vague language in the executive order provides the US with enough legal space to deprive Tencent of US technologies in those sectors, and would severely curtail Tencent’s online gaming business, which is its main engine of growth. The bans underscore the US administration’s intention to extend tech hostilities with China by denying Chinese tech companies the access to compete and expand globally. Last week, Secretary of State Mike Pompeo announced a five-pronged “Clean Network” initiative that would scrub Chinese companies from US telecommunications networks entirely.3 China, for its part, has been progressively banning US social media giants since 2009. China has not announced any retaliatory actions since the executive orders were issued. Top Chinese policymakers seem to have shifted gears from a tit-for-tat retaliation to a carefully calibrated diplomatic reaction that does not ramp up tensions further. Moreover, there is a sizeable contingent of top Chinese policymakers pushing for reconciliation with the US. We think that China’s senior leaders prefer to dial down the current conflict and take a wait-and-see approach until after the US presidential election in November. Nevertheless, the next two to three months will be unpredictable as the election nears and Trump’s polling numbers lag behind his rival Joe Biden. Bottom Line: China’s leading Internet and tech companies are embroiled in a US-China feud. Pressures will likely intensify with other tech companies potentially also targeted. For now, stay neutral on leading Chinese tech company stocks within a global equity portfolio. Stick With The Knowns Chinese tech company stock prices will likely be extremely volatile in the short run. Nevertheless, we are staying the course with our constructive cyclical view on overall Chinese stocks and we do not recommend any one-way bets on the market during the next two to three months. China’s financial markets have been shaken by negative surprises relating to frictions with the US. However, investors cheer on even the slightest easing of tensions between the two countries. Last Friday’s volatile trading was a good example: initial confusion over the ban’s scope in Trump’s order led to a more than 10% plunge in Tencent stock during morning trading in the Hong Kong market, but the losses were cut in half after the US indicated the ban only affected the WeChat app. Chart 2Chinese Tech Company Stocks Rallied Through Most Of The Trade War
Chinese Tech Company Stocks Rallied Through Most Of The Trade War
Chinese Tech Company Stocks Rallied Through Most Of The Trade War
Economic policy support from the Chinese government and “national team” can also distort the short-term price trend in tech equities. These stocks have risen by more than 20% in both the onshore and offshore markets since the beginning of 2018, despite the deteriorating US-China relationship (Chart 2). While we are neutral on tech company stocks, we recommend overweight Chinese “old economy” stocks and remain constructive on domestic sectors that are beneficiaries of government policy support. We are initiating two trades: long MSCI China ex-TMT versus MSCI Global ex-TMT; and long domestic semiconductor stocks versus global semiconductor benchmark. The reflationary efforts since early this year facilitated a strong rebound in China’s industrial sector activities and profits (Chart 3). In turn, China’s ex-tech "old economy" stocks have outperformed relative to their global peers. Even though the handful of tech titans account for roughly 35% of the investable market capitalizations, MSCI China stock prices excluding tech titans have decisively broken out of their 200-day moving average, which suggests there is still sufficient support to our constructive view on the overall investable index (Chart 4). Chart 3Investors Have Been Focusing On China's Stimulus And Economic Recovery
Investors Have Been Focusing On China's Stimulus And Economic Recovery
Investors Have Been Focusing On China's Stimulus And Economic Recovery
Chart 4Chinese "Old Economy" Stocks Have Prevailed Of Late
Chinese "Old Economy" Stocks Have Prevailed Of Late
Chinese "Old Economy" Stocks Have Prevailed Of Late
Our cyclical overweight view on China’s domestic stocks also remains unchanged. The domestic market is much more sensitive to the trend in monetary conditions, credit growth and economic cycles than the investable market. As we pointed out in last week’s report,4 monetary conditions are accommodative and credit and economic growth remain in an uptrend. This underscores that China’s domestic stocks have more upside potential than investable stocks, even in an escalating geopolitical risk environment. Chart 5Chinese Semis Are On Fire
Chinese Semis Are On Fire
Chinese Semis Are On Fire
Lastly, more pressure from the US and the West to curb the advancement of Chinese technology will only encourage the leadership to double down on supporting state-led technology programs. This argues for a more bullish view on Chinese tech companies that focus on the domestic market, at least on a cyclical basis (Chart 5). Last week the State Council updated its policy, supporting two strategically important sectors: integrated circuits and software. The central government has had policies in place to support these two sectors since 2000 and updates its support policies every decade or so. Last week's updated version will allow chip companies to enjoy even more tax exemptions and favorable financing than the first set of support policies. China has clearly stepped up its promotion of self-sufficiency and redoubled its efforts to thwart any pressures meant to restrain its technological progress. As pointed out by our Geopolitical Strategy team,5 the U.S. and its allies control 95% of the global semiconductor market (Chart 6). Nonetheless, China is the world’s largest importer, accounting for about one-third of global semiconductor sales, making it the largest consumer of semiconductors (Chart 7). Chart 6China’s Chip Makers Are Still Small Fry
Sticking With Chinese “Old Economy” Stocks In A Widening Tech War
Sticking With Chinese “Old Economy” Stocks In A Widening Tech War
Chart 7China Accounts For 60% Of Global Semiconductor Demand
Sticking With Chinese “Old Economy” Stocks In A Widening Tech War
Sticking With Chinese “Old Economy” Stocks In A Widening Tech War
Chart 8Made In China 2025 Targets
Sticking With Chinese “Old Economy” Stocks In A Widening Tech War
Sticking With Chinese “Old Economy” Stocks In A Widening Tech War
In brief, China relies a lot on imported semiconductors and is working to mitigate this dangerous vulnerability. The Made in China 2025 program estimates that China will produce 70% of its demand for integrated circuits by 2030 (Chart 8). Bottom Line: China’s domestic industrial sector will continue to recover in the next 6 to 12 months. The nation’s semiconductor industry will get a boost from recently shored-up government policy supports. Overweight these sectors in the face of expanding tensions from the US tech war against China. Jing Sima China Strategist jings@bcaresearch.com Footnotes 1TMT stocks include information technology prior to December 2018, and include media & entertainment and internet & direct marketing retail sectors after December 2018. 2Please see the orders: https://www.whitehouse.gov/presidential-actions/executive-order-addressing-threat-posed-tiktok/ and https://www.whitehouse.gov/presidential-actions/executive-order-addressing-threat-posed-wechat/ 3https://www.state.gov/announcing-the-expansion-of-the-clean-network-to-safeguard-americas-assets/ 4Please see China Investment Strategy Weekly Report "China Macro And Market Review," dated August 5, 2020, available at cis.bcaresearch.com 5Please see China Investment Strategy Special Report "U.S.-China: The Tech War And Reform Agenda," dated December 12, 2018, available at cis.bcaresearch.com Cyclical Investment Stance Equity Sector Recommendations
Highlights Even after the COVID-19 pandemic is over, likely within 18 months, many behavioral changes that were forced on society by social distancing will remain. Individuals who have gotten used to working from home, shopping online, and using the internet for socializing and entertainment will continue to do so. Amid any large structural shift, it is easier to spot losers than winners. The biggest losers are likely to be: (1) Parts of the real estate industry, as companies shed expensive city-center office space and office workers move away from big cities; and (2) the travel industry, since business travel will decline. The winners will include: Health care (as governments spend to strengthen medical services); capital-goods producers (with US manufacturers increasingly reshoring production but automating more); and the broadly-defined IT sector which, while expensively valued, is nowhere near its 2000 level and has several years of strong growth ahead. “We always overestimate the change that will occur in the next two years and underestimate the change that will occur in the next ten.” – Bill Gates “There are decades where nothing happens, and there are weeks where decades happen.” – Lenin Introduction The world has been turned upside down since February by the coronavirus pandemic. Households all around the globe have been forced to stay indoors; companies have been forced to drastically change working practices; some industries, such as online shopping or videoconferencing software, have seen a surge in demand. But once the pandemic is over, how many of these changes will stick? What will be the long-term impact on society, the workplace, consumer attitudes, and companies’ strategic planning? How should investors position themselves to take advantage of secular changes in the sectors that will be most affected, ranging from health care and technology, to real estate, retailing, and travel? In this Special Report (which should be read in conjunction with two other recent BCA Research Special Reports on the macro-economic and geopolitical consequences, respectively, of COVID-191), we look at the social and industry implications of the coronavirus pandemic. We assume that, within the next 12-to-18 months, the pandemic will be a thing of the past, either because a vaccine has been developed, or because enough people have caught it for herd immunity to develop. This does not mean that people will be unconcerned about a reoccurrence, or about a new virus triggering another epidemic. Pandemics are not rare, even in modern history (Table 1). And COVID-19 may return as an annual mild seasonal flu (as the 1968 Asian flu did), but which is not serious enough to alter behavior. But the assumption in this report is that, within a couple of years, people will feel comfortable again about being in crowded spaces and traveling, without a need for social distancing or periodic lockdowns. Table 1Estimated Mortality And Infection Rates Of Pandemics During The Past Century
The World After COVID-19: What Will Change, What Will Not?
The World After COVID-19: What Will Change, What Will Not?
But that doesn’t mean that everything will return to the status quo ante. At least some individuals who have gotten used to working from home, video conferencing, and shopping online will continue these practices. Companies will, therefore, need to rethink their employment policies, as well as how they manage their office space, global supply chains, and just-in-time inventories. Government policies towards health care and education will need to be rethought. None of these changes are new. Indeed, the result of an exogenous shock is often simply to accelerate trends that were already in place. E-commerce, telecommuting, and “reshoring” have already been growing steadily for years. COVID-19 is, however, likely to accelerate these shifts. Not every individual or company will change their behavior, but even small changes at the margin can have a significant impact. Ultimately, what these changes amount to is a liberalization of space and time. Employees do not need to be in the same physical space to work together. Students can choose when to listen to a lecture. Music lovers based in a small city can have the same access to a live (streamed) concert as those in London or New York. This Special Report is divided into two sections. In the first section, we examine the meta-changes in consumer and corporate behavior that could result from the pandemic. How widely will the shift from office-based work to “working from home” stick? How much will shopping, entertainment, and education stay online? Will companies really bring back a large chunk of manufacturing from overseas? In the second section, we analyze the impact on specific industries, such as real estate, health care, technology, and retailing, and make some suggestions as to how investors should tilt their portfolios over the longer term to take advantage of these trends. In summary, we identify the winners as health care, technology, and capital-goods producers. The clear losers are in real estate and travel. Retailing and consumer goods will see a significant shakeout, with both winners and losers, but the overall impact on these industries will be neutral. Social Impacts Working From Home Teleworking, or working from home, is hardly new. Craftsmen before the industrial revolution did so as a matter of course. But the development of computers and telecommunications in the 1980s made it feasible for white-collar workers to work from home too. As Peter Drucker wrote as long ago as 1993: "...commuting to office work is obsolete. It is now infinitely easier, cheaper and faster to do what the nineteenth century could not do: move information, and with it office work, to where the people are."2 Until now, however, teleworking has been rare. But the requirements imposed by the pandemic could cause that to change. Technically, it is possible for workers in many job categories to telework effectively. A recent study by Jonathan Dingel and Brent Neiman3 estimated, based on job characteristics, that it is feasible for 37% of all jobs in the US to be done entirely from home (46% if weighted by wages). The vast majority of jobs in sectors such as education, professional services, and company management could be done from home (Table 2). Extending the analysis to other countries, they find that more than 35% of jobs in most developing countries can be done from home, but less than 25% in manufacturing-heavy emerging economies such as Turkey and Mexico (Chart 1). Table 2Share Of Jobs That Can Be Done At Home, By Industry
The World After COVID-19: What Will Change, What Will Not?
The World After COVID-19: What Will Change, What Will Not?
Chart 1Share Of Jobs That Can Be Done At Home, By Country
The World After COVID-19: What Will Change, What Will Not?
The World After COVID-19: What Will Change, What Will Not?
But, in practice, before the coronavirus pandemic, many fewer people than this worked from home. Partly this was simply because many companies did not allow it. A survey by OWL Labs in 2018 found that 44% of companies around the world required employees to work from an office, with no option to work remotely.4 The percentage was even higher, 53%, in both Asia and Latin America. By contrast, OWL did find that 52% of employees globally worked from home at least occasionally, and that as many as 18% of respondents reported working from home always. The pandemic forced many white-collar workers to telework for the first time. The Pew Research Center found that 40% of US adults – and as many as 62% of those with at least a bachelor’s degree – worked from home during the crisis.5 How white-collar workers found the experience, and whether they plan to continue to work from home some of the time even if not required to do so, vary widely. Employers are generally positive about the idea. A survey of hiring managers by Upwork found that 56% believed that remote working functioned better than expected during the crisis (Chart 2). They cited reduced meetings, fewer distractions, increased productivity, and greater autonomy as reasons for this. The major drawbacks were technological issues, reduced team cohesion, and communication difficulties. Another survey, by realtor Redfin, found that 76% of US office workers had worked from home during the crisis (compared to only 36% who worked from home at least some of the time beforehand) and that 33% of respondents who had not worked remotely pre-shutdown expect to work remotely after shutdowns end (with another 39% unsure) (Chart 3). Chart 2Employers Found That Teleworking Worked Well
The World After COVID-19: What Will Change, What Will Not?
The World After COVID-19: What Will Change, What Will Not?
Chart 3Many Employees Expect To Continue Working Remotely After The Pandemic Ends
The World After COVID-19: What Will Change, What Will Not?
The World After COVID-19: What Will Change, What Will Not?
But there are problems too. Research published in the Journal of Applied Psychology found that, while teleworking has some clear advantages, such as improved work-family interface, greater job satisfaction, and enhanced autonomy, it also has drawbacks. Most notably, if workers aren’t in the office at least half the week, relationships with fellow workers suffer, as does collaboration.6 There are also developed countries where backward technology has made the experience of working from home difficult. This is particularly the case in Japan. A survey by the Japan Productivity Center found that 66% of office workers said their productivity fell when working from home; 43% were dissatisfied with the experience. The reasons cited for the dissatisfaction were “lack of access to documents when not in the office” (49%), “a poor telecommunications environment” (44%), and a difficult working environment, such as lack of desk space (44%). Japanese companies remain rather paper-based, and household living space tends to be small. Research carried out on employees at Chinese online travel company Ctrip before the pandemic concluded that home working led to a 13% performance increase but, crucially, there were four requirements for working from home to succeed: Children must be in school or daycare; employees must have a home office that is not a bedroom; complete privacy in that room is essential; and employees must have a choice of whether to work from home.7 After the pandemic, a significant shift in the pattern of office work is likely. Many workers will work remotely part or most of the time. But they will also benefit from coming to an office a certain number of days a month to work together, bond with co-workers, exchange ideas, etc. Online Shopping E-commerce has been growing steadily for years. In the US, it increased by 15% year-on-year in 2019, to reach $602 bn, or 16% of total retail sales (Charts 4 and 5). The share is even higher in some other countries: For example, 25% in China and 22% in the UK. The pandemic caused a big acceleration in e-commerce the first few months of this year, as consumers in most countries around the world were either not allowed to go outside, or felt unsafe doing so. Chart 4The Share Of E-commerce Has Been Steadily Expanding For Years…
The World After COVID-19: What Will Change, What Will Not?
The World After COVID-19: What Will Change, What Will Not?
Data from Mastercard show that, in the worst period of lockdowns in April, e-commerce grew by 63% in the US, and 64% in the UK year-on-year, compared to a decline of 15% and 8%, respectively, in overall retail sales (Chart 6). The growth was particularly apparent in products such as home improvement, footwear, and apparel (Chart 7). Chart 5…With Growth Of Around 15% A Year
The World After COVID-19: What Will Change, What Will Not?
The World After COVID-19: What Will Change, What Will Not?
Chart 6In April, Online Sales Soared…
The World After COVID-19: What Will Change, What Will Not?
The World After COVID-19: What Will Change, What Will Not?
Chart 7…Especially In Certain Categories
The World After COVID-19: What Will Change, What Will Not?
The World After COVID-19: What Will Change, What Will Not?
Moreover, many consumers in advanced economies bought goods such as clothing, medicine, and books online for the first time, and used services such as online grocery delivery, and apps to order food from restaurants (Chart 8). Note, however, that few consumers bought financial services, magazines, music, and videos online for the first time. Presumably these are products that the vast majority of households had already been consuming online. Chart 8Consumers Shifted Purchases Of Many Items Online
The World After COVID-19: What Will Change, What Will Not?
The World After COVID-19: What Will Change, What Will Not?
It is hard to know how sticky these trends will be. Once shops permanently reopen without restrictions, will consumers simply return to their old habits of going to supermarkets, restaurants, and clothing stores? Perhaps many enjoy the experience of browsing. It seems likely, however, that the newly acquired habit of shopping online will at least accelerate the trend towards e-commerce. Many of those who ordered, for example, supermarket deliveries online for the first time will continue to do so at least occasionally in the future. Other changes are likely too: Many smaller retailers were forced to close their physical stores during the pandemic and so had no choice but to set up an online delivery service. Some struggled with this, but others were aided by companies such as Shopify, which simplify the process of setting up a website, processing payments, and arranging delivery. Shopify now works with over a million merchants. These smaller retailers are now better able to compete with giants such as Amazon. During the lockdown, US consumers notably diversified their online product searches away from Amazon and Google to smaller retailers (Chart 9). Chart 9Search Diversified Away From Amazon And Google
The World After COVID-19: What Will Change, What Will Not?
The World After COVID-19: What Will Change, What Will Not?
We might see a trend towards smaller-scale, local shops benefiting as consumers stick to shopping in smaller stores closer to their homes. Many stores during the pandemic refused to accept cash; this might accelerate the shift towards contactless payments. Consumers may be less focused in future on conspicuous consumption. The trend towards wellness, home-cooking, gardening, crafts, and self-investment might continue. Other Uses Of Technology It is not only work and shopping habits that changed during lockdowns. Individuals also got used to a range of technologies for socializing, entertainment, education, and medical consultation. Consumer surveys by the Pew Research Center show that a third of American adults have socialized online using services such as Zoom, and a quarter have used online systems for work or conferences (Chart 10). But these percentages are much higher for certain demographics. For example, 48% of 18-to-29 year-olds have socialized online, and 30% of this age group have taken online fitness classes. The percentage using video systems for work is as high as 48% for people with a college degree. And, unsurprisingly, with many university courses moving online since the spring, 38% of 18-to-29 year-olds say they have taken an online class. Chart 10Individuals Have Been Socializing And Communicating More Online
The World After COVID-19: What Will Change, What Will Not?
The World After COVID-19: What Will Change, What Will Not?
How sticky these trends will be once the pandemic is over is not easy to forecast. But further research by Pew showed that 27% of US adults believed that online and telephone contacts are “just as good as in-person contact,” and only 8% thought of them as not much help at all, although a rather larger 64% answered that online socializing is “useful but will not be a replacement for in-person contact.” The responses differed little between gender, race, and political views, although fewer people under the age of 30 thought online contacts were as good as in-person ones (Table 3). Table 3How Do Online Interactions Compare To In-Person Ones?
The World After COVID-19: What Will Change, What Will Not?
The World After COVID-19: What Will Change, What Will Not?
Another survey in Japan by Ipsos suggests that people’s values have changed as a result of the pandemic and quarantines, with a greater focus on wellbeing, home-based activities such as cooking, and self-improvement. When questioned, a large percentage of people believe they will persist with these habits even when lockdowns end. For example, 51% of Japanese respondents believe they will continue to enjoy themselves as much as possible at home in their spare time, compared to only 20% who favored entertainment at home before the pandemic (Chart 11). Chart 11Pandemic Brought A Greater Focus On Wellbeing And Home-Based Activities
The World After COVID-19: What Will Change, What Will Not?
The World After COVID-19: What Will Change, What Will Not?
Other areas that have moved online en masse include education, health care, the judiciary, concerts, and sports (e-sports, and popular sports such as soccer and baseball that are now being played in empty venues). Education at the tertiary level in advanced economies was already partly online before the pandemic. In the US, out of 19.7 million tertiary students in 2017, 2.2 million (13.3%) were enrolled in exclusively online/distance learning courses, and another 3.2 million (19.5%) took at least one course online.8 Of course, everything changed during the pandemic, with 98% of US institutions moving the majority of in-person courses online, and many planning to continue this through the Fall 2020 semester. At the elementary and secondary school level, online education was much more limited pre-pandemic. According to the National Center for Educational Statistics, 21% of US schools offered some courses entirely online in 2016 but, of this 21%, only 6% offered all their courses online and only another 6% the majority of courses. Many of these schools were forced to shift entirely online during lockdowns: According to UNESCO data, at the peak of the pandemic 1.6 billion children (90% of the total in school) in 191 countries attended schools that had closed physically. It seems likely that, while in-person teaching will remain the central method of education, distance and online learning solutions, even at the high school level, will become more prevalent in the future. The health care sector has lagged in technology, in terms of using AI for diagnosis, digitalizing patient records, and offering online doctor-patient consultation. But the use of digital tools had started to increase in recent years, particularly in the number of practices using telemedicine and virtual visits (Chart 12). At the peak of the pandemic in April, the number of telehealth visits in the US rose by 14% year-on-year, compared to a 69% decline in in-person visits to a doctor.9 It seems likely that this trend will continue, as medical practitioners find viritual consultations more efficient and effective for many simple initial diagnoses, and as sick or elderly patients prefer to avoid a physical visit to a surgery.10 Chart 12The Transition To A Digital-Driven Health Care Model
The World After COVID-19: What Will Change, What Will Not?
The World After COVID-19: What Will Change, What Will Not?
Travel Travelers have been very reluctant to get back on airplanes and stay in hotels again, even in countries and regions where the pandemic has eased over the past couple of months (Chart 13). Based on our assumption that the pandemic will be completely over within 18 months, it seems likely that people will eventually resume travelling, at least for leisure and to see family and friends. After previous disruptions to global travel, such as 9/11 and SARS, it took only two-to-three years for air travel to resumed its pre-crisis trend (Chart 14). Chart 13Travelers Remained Reluctant Even When Pandemic Eased
The World After COVID-19: What Will Change, What Will Not?
The World After COVID-19: What Will Change, What Will Not?
Chart 14
Business travel might be very different, however. Salespeople who have become used to making sales calls over Zoom may not feel the need to travel to see clients so much. Conferences, exhibitions, and other events will be increasingly (at least partly) online. Travel budgets are a large expense for many companies. According to estimates by Certify, a travel software provider, spending on business trips in 2019 totalled $1.5 trillion (including $315 billion by US businesses). The availability of a technological alternative to at least some business trips will provide a good excuse for many companies to meaningfully reduce the number of trips and their travel budget. In the future, business travel may become more of a privilege than a necessity. It is easy to imagine a significant decline in overall business travel. Manufacturing Supply Chains Corporate behavior could also change as a result of the disruptions caused by the coronavirus. Companies in the US and Europe realized how vulnerable their complex supply chains are. Popular and political pressure is pushing firms to reshore at least some of their overseas production. Firms will need to build in more “operational resilience,” with higher levels of inventory, less debt, and greater redundancy in their systems. Developed economies such as the US have been deindustrializing for 40 years – since reforms in China in the late 1970s, followed by Mexico and central Europe in the 1990s, made these countries appealing locations for cheap manufacturing. US manufacturing employment has almost halved since 1980, falling to only 27% of the workforce (Chart 15). Manufacturing output, especially outside of the computer sector, has substantially lagged that of the overall private sector (Chart 16). The US has also fallen behind in automation, with a much lower number of robots per manufacturing worker than in countries such as Germany and Japan (Chart 17). Chart 15US Manufacturing Employment Has Halved Since 1980
US Manufacturing Employment Has Halved Since 1980
US Manufacturing Employment Has Halved Since 1980
Chart 16Manufacturing Output Outside The Computer Sector Has Lagged
The World After COVID-19: What Will Change, What Will Not?
The World After COVID-19: What Will Change, What Will Not?
Chart 17The US Has Relatively Few Robots
The World After COVID-19: What Will Change, What Will Not?
The World After COVID-19: What Will Change, What Will Not?
The pandemic highlighted how vulnerable widely distributed supply chains are. This was clearest in the health care sector. The US is far away the biggest spender on health care research and development (Chart 18). And yet it was unable to provide critical medical equipment such as face masks, testing kits, and ventilators to its population at an adequate rate, mainly because almost 70% of the facilities which manufacture essential medicines are based abroad (Chart 19). During the pandemic, countries such as China and India prioritized their own citizens, forcing the US government to strike emergency deals to avoid drug shortages. Chart 18The US Spends A Lot On R&D In Health Care…
The World After COVID-19: What Will Change, What Will Not?
The World After COVID-19: What Will Change, What Will Not?
Chart 19…But Drug Production Is Mostly Done Overseas
The World After COVID-19: What Will Change, What Will Not?
The World After COVID-19: What Will Change, What Will Not?
Once the crisis subsides, CEOs of American companies (as well as the US government) will have to decide if they are comfortable with the fact that, while they possess a vast store of intellectual capital, the manufacturing of their products happens halfway around the world. What happens if there is another pandemic? What about a global disaster caused by climate change? Finally, and perhaps more worryingly, what happens if tensions between the US and China escalate seriously? This shift will not happen overnight: China still has much cheaper labor, an enormous manufacturing base of factories and parts suppliers, and formidable transportation infrastructure. Many aspects of supply chains are too deep-rooted and the economics too compelling for them to be unwound quickly. Some production will shift from China to other emerging economies. A Biden administration might be less confrontational with China, and could lower some of the Trump tariffs. But, at the margin, companies will choose to build new factories in the US (and in western Europe and Japan), with highly automated systems. Government policy (via both subsidies and tariffs) will encourage these trends. Manufacturers which have lived “on the edge” in recent years, with dispersed supply chains, just-in-time processes, minimal inventories, the fewest possible workers, and the maximum amount of debt compatible with their targeted credit rating (often BBB) now understand the need to build redundancy into their systems. Corporate debt levels are high by historical standards in many countries (Chart 20). Companies may want to build up a buffer of net cash in the future, as Japanese companies did for decades after the bubble there burst in 1990. Inventories have risen a little relative to sales since the Global Financial Crisis but will probably rise further (Chart 21). These trends are likely to be negative for profit margins. Chart 20In The Future, Will Companies Be Happy With This Much Debt...
In The Future, Will Companies Be Happy With This Much Debt...
In The Future, Will Companies Be Happy With This Much Debt...
Chart 21...And Such Low Level Of Inventories?
...And Such Low Level Of Inventories?
...And Such Low Level Of Inventories?
Implications For Industries In light of the social changes described above, how will various industries be reshaped over the coming years? Which sectors should investors tilt towards because they are likely to emerge as winners from post-COVID structural shifts? And which are the sectors that investors should avoid since they will suffer from the creative destruction? In the midst of major social and technological change, it is often easier to spot losers than winners. Think of the arrival of the internet in the 1990s. How many investors would have correctly picked Google, Amazon, Apple, and only a handful of others as the winners? It would have been easier to correctly identify industries that were likely to lose out to disruption, such as book retailers, travel agents, newspaper publishers, and TV broadcasters. We start, therefore, with the industries likely to lose out from post-COVID changes. The Losers Real Estate Over the next few years, prime real estate seems the most likely loser. It is not clear how many white-collar workers will choose to work from home in the future, or how many days a month they will want to come into an office to meet with fellow workers. But it seems likely there will be a strong continued trend in the direction of remote working. As a result, demand for prime central-business-district property will fall, given that it is very expensive. In Manhattan, for example, the average workspace for each of the 1.5 million office workers is around 310 square feet. At pre-COVID rental costs, that amounts to an average of $20,000 per employee – and more than $30,000 for A+ grade buildings. And rent is only part of what a company pays: There are also costs for cleaning, utilities, technology, security, coffee machines, and cafeterias on top of that. Employees working at home pay for their own space, utilities, food (and often even computer equipment). The size, location, and layout of offices will need to be rethought. Maybe companies will choose to build a campus in the suburbs, with a range of different working spaces (for meetings, quiet work, or collaboration). They may prefer to rent shared co-working spaces by the day or week. Some real estate developers and builders would be beneficiaries of this. Companies would save money in real estate costs. But they may need to pay a stipend to employees who work at home to cover the extra space they will require, and to upgrade their technology (computer equipment, internet speed, and so on). On the other hand, companies may pay lower salaries for workers who move out of high-cost locations such as Manhattan or London to places where it is cheaper to live. Many office spaces are leased on a long-term basis, so some companies will not be able to move out of big cities immediately. But residential property is more liquid. The trends in work practices might accelerate a shift to the suburbs which has already been emerging over the past few years (Chart 22). Workers will not need to live so close to the company’s office if they will visit it for only a few days a month. Small towns with a lively community and pleasant environment (and decent transportation links to a big city) could grow in popularity. This would be bad news for developers which are specialized in developing residential property in cities such as London, Sydney, Toronto, and Vancouver, and for the owners of those properties. But it might be positive for builders who will develop the new houses and out-of-town office campuses. Chart 22The Shift To The Suburbs Was Already Taking Place
The World After COVID-19: What Will Change, What Will Not?
The World After COVID-19: What Will Change, What Will Not?
This does not mean that cities will wither away. After previous epidemics and crises in history (think the Great Plague of London in the 17th century, or 9/11), they have always bounced back. “Casual collisions” – chance meetings with interesting people which lead to collaborative relationships – are crucial in creative industries, and happen online only with difficulty. Buildings will be repurposed: Retail space will be turned into warehouses or apartments, for example. A fall in rents would allow cities to “degentrify” and attract back young people, making the city more dynamic again. But the period of transition could be painful for some segments of the real estate industry. Travel A permanent decline in business travel would be a significant blow to airlines and hotel chains. Business travelers account for only about 12% of the number of air tickets purchased, but they generate 70%-75% of airlines’ profits. Even discount leisure airlines such as Southwest have in recent years started to target business travelers. And it will not just be airlines that are affected. Data from the US Travel Association show that 26% of the $2.5 trillion in travel-related revenues in the US in 2018 came from business travelers. Of that, 17% goes to air travel, 13% to accommodation, and 5% to car rental. An even larger portion goes to food (21%). Around 40% of hotel rooms are occupied by business travelers. Conference organizers and venues could also suffer: 62% of US business trips are to attend conferences. “Sharing economy” companies would be affected too. In 2018, 700,000 business travelers booked accommodation through AirBnB, and 78% of business travelers use Uber and other ride-sharing services. Furthermore, a slowdown in business travel would have knock-on effects on the leisure travel sector. Surveys suggest that almost 40% of business trips in the US are extended to include leisure activities (“bleisure” in the travel industry parlance). The Winners Health Care A recent report by BCA Research’s Global Asset Allocation service argued in detail that the macro environment for global health care equities will remain very positive in the coming years.11 An aging population in the world, and a growing middle class in emerging countries will steadily raise demand for health care services (Charts 23 and 24). China, in particular, has underinvested in health care: It spends only 5% of GDP, barely higher than it did 20 years ago, and well behind other emerging economies such as Brazil and South Africa (Chart 25). Chart 23Positives For Health Care Include An Aging Population…
Positives For Health Care Include An Ageing Population...
Positives For Health Care Include An Ageing Population...
Chart 24…And A Growing Emerging Market Middle Class
...And A Growing Emerging Market Middle Class
...And A Growing Emerging Market Middle Class
As a result of the COVID-19 pandemic, governments everywhere will need to spend more money on health care (or, in the case of the US, perhaps spend it more effectively). In the US, before the pandemic, intensive-care beds were sufficient to cope only with the peak of a normal seasonal influenza breakout. The World Health Organization warns that, while pandemics are rare, highly disruptive regional and local outbreaks of infectious diseases are becoming more common (Chart 26). More money will need to be spent, in particular, on developing health care technology (online consultations, digitalized patient records, track-and-trace systems), on improving senior care homes (80% of COVID-19 deaths in the Canadian province of Quebec were in such facilities), and on biotech (such as gene-related therapies). Chart 25Expenditures On Health Care Will Have To Grow
Expenditures On Health Care Will Have To Grow
Expenditures On Health Care Will Have To Grow
Chart 26Number Of Countries Experiencing Serious Outbreak Of Infectious Disease
The World After COVID-19: What Will Change, What Will Not?
The World After COVID-19: What Will Change, What Will Not?
The health care equity sector is not expensive, trading in line with its long-run average valuation (Chart 27). Within the sector, biotech and health care technology look more attractive than pharmaceuticals, which are expensive and vulnerable to the price caps proposed by Joe Biden if he is elected US president this November. Chart 27Health Care Stocks Are Not Expensive
Health Care Stocks Are Not Expensive
Health Care Stocks Are Not Expensive
Technology In a plethora of ways, the pandemic has propelled the use of technology: For working at home, communication, online shopping, entertainment, etc. Companies such as Zoom have moved from niche players to mainstream business providers: Zoom’s peak daily users rose from 10 million in December 2019 to 300 million in April. Chart 28Tech Stocks Are Nowhere Close To Previous Peaks
Tech Stocks Are Nowhere Close To Previous Peaks
Tech Stocks Are Nowhere Close To Previous Peaks
Assuming that at least some of these developments remain in place once the pandemic is over, it is easy to see how technology stocks (broadly defined to include any company that uses information technology as a central part of its business) will continue to prosper. These stocks will not be just in the IT sector, but also in communications and consumer discretionary. Picking the individual winners will be hard: Will Microsoft overtake Amazon in cloud computing? Will Zoom’s much-discussed privacy issues undermine it? Will competitors emerge to Shopify in merchant services? Can Spotify compete with Apple in online music streaming? But the broadly-defined sector seems likely to have improving fundamentals for some years to come. The only question is whether the good news is already priced in, after the huge run-up in stock prices over the past few years. We do not believe it is fully. The valuations of these sectors are still nowhere close to the level they reached at the peak of the TMT Bubble in 1999-2000 (Chart 28), they have strong balance-sheets, and considerable earnings power. For their outperformance to end, it will take one of two things. The first trigger could be a significant shift down in growth. Over the past three years, Amazon has grown EPS at a compound rate of 47%, and Netflix at 76% (Chart 29). Over the next three years (2020-2023), analysts forecast compound EPS growth of 32% for Netflix, 30% for Amazon, 15% for Facebook (compared to 24% in 2016-2019), and 12% for Microsoft (compared to 16%). Those are still impressive growth numbers, and should be achievable as long as these companies can continue to grow market share. Chart 29Can The Big Tech Stocks Keep Growing Earnings At This Rate?
The World After COVID-19: What Will Change, What Will Not?
The World After COVID-19: What Will Change, What Will Not?
The second set of risks would be regulatory: A move to break up companies such as Google and Amazon, the US introducing data privacy legislation similar to that in the European Union, or a move to a digital tax or minimum global taxation. None of these seems likely in the immediate future. Automation/Robotics/Capital Goods The return, at the margin, of some manufacturing to the United States (and other developed economies) will bring about economic changes. Unable to tap into the pool of cheap international labor as easily as before, companies will have to invest significantly in this sector. This will result in the following: A resurgence of manufacturing productivity, thanks to increased investment. An intensification of automation. The US will need to boost the number of robots per capita to compete with Korea, Germany, and Japan. This will further improve productivity. The development of a high-tech manufacturing sector. Analogous to the FAANG stocks during the 2010s, a new group of innovative manufacturing companies could emerge. New infrastructure, roads, factories, and machinery will be needed to replace what is now an outdated capital stock in the US (Chart 30). These trends should all be positive for the capital-goods sector. Such a project would also need large amounts of raw materials. This might push up the prices of commodities such as industrial metals, and benefit materials producers. As mentioned above, it could boost the price of real estate outside of the major cities, where the new manufacturers would be likely to set up. Chart 30The US Capital Stock Is Becoming Outdated
The World After COVID-19: What Will Change, What Will Not?
The World After COVID-19: What Will Change, What Will Not?
Mixed Retailing / Consumer Goods Retailing is likely to see a significant shakeout over the next few years. The cracks have been apparent for some years: Decreasing footfall, and empty units on many high streets and shopping malls, amid the shift to online shopping. A shift to the suburbs and further growth in online shopping will change retailing further. Rents in the highest end Manhattan shopping districts have already fallen noticeably since the start of the year, especially Lower Fifth Avenue (between 42nd and 49th Streets) which is dominated by large chain stores (Chart 31). Shopping malls, particularly undistinguished ones in poorer areas, will continue to suffer. Overall, the US in particular has an excess of retailing space, almost five times as much per capita as the major European economies (Chart 32). Chart 31Manhattan Retail Store Rents Already Falling Sharply
The World After COVID-19: What Will Change, What Will Not?
The World After COVID-19: What Will Change, What Will Not?
Chart 32The US Has Far Too Much Retail Space
The World After COVID-19: What Will Change, What Will Not?
The World After COVID-19: What Will Change, What Will Not?
But it is hard to predict the winners from this shake-out. Overall spending by consumers is unlikely to be significantly affected, so it is a matter of forecasting which companies and formats will emerge victorious. Will Walmart and Target and other large retail chains improve their online offering to fight back against Amazon? Facebook, Shopify, and others have set up new services to compete with Amazon on price – will they be successful? Will small stores start to win back market share? Will supermarkets figure out how to make profits from their order-online-and-deliver services (which are now very costly because most often a human has to run around the store picking out the items ordered), or will new, fully automated competitors emerge? Will new technologies materialize to make it easier to buy clothes online (for example, digitized body measuring systems)? These changes will also affect producers of consumer products. They will have to understand the new channels, and adapt their offerings and positioning strategies accordingly. These changes will make the sector a tricky one. A skilled fund manager might be able to predict which companies’ strategies will be successful. But it could be a problematic area for investors owning individual stocks within the sector who do not have detailed expertise. Garry Evans, Senior Vice President Global Asset Allocation garry@bcaresearch.com Footnotes 1 Please see The Bank Credit Analyst, "Beyond The Virus," dated May 22, 2020 and Geopolitical Strategy, "Nationalism And Globalization After COVID-19," dated June 26, 2020. 2 Peter E. Drucker, "The Ecological Vision: Reflections on the American Condition," 1993, p.340. 3 Jonathan I. Dingel and Brent Neiman, "How Many Jobs Can Be Done At Home?" NBER Working Paper No. 26948, April 2020. 4 OWL Labs, “The State of Remote Work Report,” available at www.owllabs.com. 5 Pew Research Center survey conducted March 19-24 2020. Please see https://www.pewsocialtrends.org/2020/03/30/most-americans-say-coronavirus-outbreak-has-impacted-their-lives/psdt_03-30-20_covid-impact-00-4/ 6 Gajendran, R.S., & Harrison, D.A., “The Good, the Bad, and the Unknown about Telecommuting”, Journal of Applied Psychology 92(6), 2007. 7 Nicholas Bloom, James Liang, John Roberts & Zhichun Jenny Ying, “Does Working from Home Work? Evidence From a Chinese Experiment,” The Quarterly Journal of Economics (2015), 165-218. 8 Please see educationdata.org. 9 Ateev Mehrotra, Michael Chernew, David Linetsky, Hilary Hatch, and David Cutler, "The Impact of the COVID-19 Pandemic on Outpatient Visits: A Rebound Emerges," The Commonwealth Fund, dated May 19, 2020. 10For more on the long-term outlook for the health care sector, Global Asset Allocation Special Report, "The Healthcare Revolution: The Case For Staying Overweight," dated July 24, 2020, available at gaa.bcaresearch.com. 11Please see Global Asset Allocation Special Report, "The Healthcare Revolution: The Case For Staying Overweight,"dated July 24, 2020, available at gaa.bcaresearch.com.
Please note that we will be on our summer holidays next week. Our next report will come out on August 20. Highlights The 30-year bond yield is the puppet master pulling the strings of all other investments. Where 30-year bond yields are still far from the lower bound, they will ultimately get a lot closer. Continue to overweight 30-year bonds in the US and periphery Europe versus 30-year bonds in core Europe. Continue to overweight the US stock market versus the European stock market. An expected near-term setback to stocks versus bonds will briefly pause the European currency rally. The gold rally is also due a pause, given that it is overstretched relative to the decline in the real bond yield. Fractal trade: Long USD/PLN. Feature Chart I-1AThe Collapsed 30-Year Bond Yield Explains The Collapse Of Banks...
The Collapsed 30-Year Bond Yield Explains The Collapse Of Banks...
The Collapsed 30-Year Bond Yield Explains The Collapse Of Banks...
Chart I-1B...And The Collapsed Earnings Yield (Surging Valuation) Of Tech And Healthcare
...And The Collapsed Earnings Yield (Surging Valuation) Of Tech And Healthcare
...And The Collapsed Earnings Yield (Surging Valuation) Of Tech And Healthcare
The abiding mantra of this publication is that investment is complex, but it is not complicated. By complex, we mean that the financial markets are not fully predictable or analysable. By not complicated, we mean that the relative prices of everything are inextricably connected, rather like the movements of a puppet. All you need to do is find the puppet master pulling the strings. Right now, the puppet master is the 30-year bond. The Real Action Is In 30-Year Bonds While most people are focussing on the 10-year bond yield, the real action has been at the ultra-long 30-year maturity. In the US and periphery Europe, 30-year yields are within a whisker of all-time lows. Yet these ultra-long bond yields are still well above those in core Europe which are much closer to the lower bound. The upshot is that while all yields have equal scope to rise, yields have more scope to fall further in the US and periphery Europe than in core Europe (Chart I-2 and Chart I-3). Chart I-230-Year Yields In The US And Periphery Europe...
30-Year Yields In The US And Periphery Europe...
30-Year Yields In The US And Periphery Europe...
Chart I-3...Are Still Well Above Those In ##br##Core Europe
...Are Still Well Above Those In Core Europe
...Are Still Well Above Those In Core Europe
This simple asymmetry has created a winning relative value strategy that will keep on winning. Overweight 30-year bonds in the US and periphery Europe versus 30-year bonds in core Europe. Our preferred expression is to overweight 30-year bonds in the US and Spain versus Germany and France. Bond yields have more scope to fall further in the US and periphery Europe than in core Europe. Remarkably, in the US, the 10-year real yield is also tightly tracking the 30-year nominal yield (minus a constant 2.2 percent) (Chart I-4). Using a little algebra, this means that the market’s 10-year inflation expectation is just a steady-state value of 2.2 percent minus a shortfall equalling the shortfall in the 10-year nominal yield versus the 30-year nominal yield (Chart I-5). Chart I-4The 10-Year Real Yield Is Just ##br##Tracking The 30-Year Nominal ##br##Yield
The 10-Year Real Yield Is Just Tracking The 30-Year Nominal Yield
The 10-Year Real Yield Is Just Tracking The 30-Year Nominal Yield
Chart I-5The 10-Year Inflation Expectation Can Be Derived From The 30-Year And 10-Year Nominal Yields
The 10-Year Inflation Expectation Can Be Derived From The 30-Year And 10-Year Nominal Yields
The 10-Year Inflation Expectation Can Be Derived From The 30-Year And 10-Year Nominal Yields
10-year inflation expectation = 2.2 – (30-year nominal yield – 10-year nominal yield) The reason that this is remarkable is we can explain the trend in inflation expectations from just the 30-year and 10-year nominal yields, and nothing more. In turn, gold is tightly tracking the inverted real yield, as it theoretically should. Gold, which generates no yield, becomes relatively more valuable as the real yield on other assets diminishes (Chart I-6). Having said that, the most recent surge in the gold price is stretched relative to its relationship with the real bond yield, suggesting that the strong rally in gold is due a pause (Chart I-7). Chart I-6Gold Is Just Tracking The (Inverted) Real Yield...
Gold Is Just Tracking The (Inverted) Real Yield...
Gold Is Just Tracking The (Inverted) Real Yield...
Chart I-7...But Gold's Most Recent Surge Is ##br##Stretched
...But Gold's Most Recent Surge Is Stretched
...But Gold's Most Recent Surge Is Stretched
The 30-Year Bond Is Driving Stock Markets Moving to the stock market, bank relative performance has closely tracked the collapse in the 30-year yield, because the collapsed bond yield signals both weaker bank credit growth and a likely increase in banks’ non-performing loans (Chart of the Week, left panel). Banks and other ‘value cyclicals’ whose cashflows are in terminal decline are highly sensitive to the prospects for near-term cashflows, which are under severe pressure in the pandemic era. At the same time, as the distant cashflows are small, the banks’ share prices are less sensitive to the uplifted net present values of these distant cashflows that come from lower bond yields. In contrast, technology, healthcare and other ‘growth defensives’ generate a growing stream of cashflows. Making their net present values highly sensitive to a change in the bond yield used to discount those large distant cashflows. The profits of the tech and healthcare sectors are proving to be highly resilient in the pandemic era. Through 2018, the 30-year yield went up by 1 percent, so the forward earnings yield of growth defensives went up by 1 percent (their valuations fell). Subsequently, the 30-year yield has collapsed by 2 percent, so unsurprisingly the forward earnings yield of growth defensives has also collapsed by 2 percent (their valuations have surged). To repeat, financial markets are not complicated (Chart of the Week, right panel). Moreover, the profits of the growth defensives are proving to be highly resilient in the pandemic era, holding up well in the worst shock to demand since the Great Depression. The combination of resilient profits with higher valuations explains why the technology and healthcare sectors are reaching new highs, while the rest of the stock market is going nowhere (Chart I-8). Chart I-8Tech And Healthcare At New Highs While The Rest Of The Market Languishes
Tech And Healthcare At New Highs While The Rest Of The Market Languishes
Tech And Healthcare At New Highs While The Rest Of The Market Languishes
Meanwhile, the relative performance of stock markets is also uncomplicated. It just stems from the relative exposure to the high-flying growth defensive sectors. Compared with Europe, the US has a 20 percent larger exposure to technology and healthcare (Chart I-9). Which is all you need to explain the consistent outperformance of the US versus Europe (Chart I-10). Chart I-9The US Is 20 Percent Over-Exposed To Tech And Healthcare...
The US Is 20 Percent Over-Exposed To Tech And Healthcare...
The US Is 20 Percent Over-Exposed To Tech And Healthcare...
Chart I-10...Which Explains Its Consistent Outperformance Versus Europe
...Which Explains Its Consistent Outperformance Versus Europe
...Which Explains Its Consistent Outperformance Versus Europe
A Quick Comment On European Currencies And The Dollar Turning to the foreign exchange market, the recent rally in European currencies can at least partly be explained as a sell-off in the dollar. Begging the question, what is behind the dollar’s recent weakness? The dollar has moved as a mirror-image of the global stock market. For the broad dollar index, the explanation is quite straightforward. True to its traditional role as a haven currency, the dollar has moved as a mirror-image of the global stock market, measured by the MSCI All Country World Index (in local currencies). Simply put, as the stock market has shaken off its year-to-date losses, the dollar has shaken off its year-to-date gains (Chart I-11). Chart I-11The Dollar Has Just Tracked The (Inverted) Stock Market
The Dollar Has Just Tracked The (Inverted) Stock Market
The Dollar Has Just Tracked The (Inverted) Stock Market
Looking ahead, we can link the prospects of currencies to the outlook for 30-year bond yields. A further compression in yields will weaken the dollar, and help European currencies, in two ways. First, as already mentioned, yields have more scope to decline in the US than in core Europe, and a fading US yield premium will weigh on the dollar. Second, to the extent that the lower yields can prevent a protracted bear market in stocks and other risk-assets, non-haven currencies can perform well versus the haven dollar. Having said that, an expected near-term setback to stocks versus bonds will briefly pause the European currency rally. Concluding Remarks The charts in this report should leave you in no doubt that the 30-year bond yield – particularly in the US – is the puppet master pulling the strings of all investments: bond market relative performance, real bond yields, gold, banks, growth defensives, equity market relative performance, and major currencies. Which raises the crucial question, can the downtrend in 30-year bond yields continue? Yes, absent an imminent vaccine or treatment for Covid-19, the downtrend in yields can continue. As we explained last week in An Economy Without Mouths And Noses Will Lose 10 Percent Of Jobs, the spectre of mass unemployment is looming large. Specifically, the major threat to the jobs market lies in the coming months when government lifelines to employers – such as state-subsidised furlough schemes – are cut or weakened. Where 30-year bond yields are still far from the lower bound, they will ultimately get a lot closer. Hence, it is inevitable that those central banks that can become more dovish will become more dovish. Given the political difficulties of using fiscal policy bullets, the lessons from Japan and Europe are that the monetary policy bullets get fully expended first. In practical terms, this means that where 30-year bond yields are still far from the lower bound, they will ultimately get a lot closer. The upshot is that core European bonds will continue to underperform US bonds, and that the European stock market will continue to underperform the US stock market. European currencies will trend higher versus the dollar, albeit a setback to stocks versus bonds is a near-term risk to the European currency uptrend. Fractal Trading System* This week’s recommended trade is to play a potential countertrend move in the dollar via long USD/PLN. The profit target and symmetrical stop-loss is set at 4 percent. The rolling 1-year win ratio now stands at 57 percent. Chart I-12USD/PLN
USD/PLN
USD/PLN
When the fractal dimension approaches the lower limit after an investment has been in an established trend it is a potential trigger for a liquidity-triggered trend reversal. Therefore, open a countertrend position. The profit target is a one-third reversal of the preceding 13-week move. Apply a symmetrical stop-loss. Close the position at the profit target or stop-loss. Otherwise close the position after 13 weeks. * For more details please see the European Investment Strategy Special Report “Fractals, Liquidity & A Trading Model,” dated December 11, 2014, available at eis.bcaresearch.com. Dhaval Joshi Chief European Investment Strategist dhaval@bcaresearch.com Fractal Trading System Cyclical Recommendations Structural Recommendations Closed Fractal Trades Trades Closed Trades Asset Performance Currency & Bond Equity Sector Country Equity Indicators Bond Yields Chart II-1Indicators To Watch - Bond Yields
Indicators To Watch - Bond Yields
Indicators To Watch - Bond Yields
Chart II-2Indicators To Watch - Bond Yields
Indicators To Watch - Bond Yields
Indicators To Watch - Bond Yields
Chart II-3Indicators To Watch - Bond Yields
Indicators To Watch - Bond Yields
Indicators To Watch - Bond Yields
Chart II-4Indicators To Watch - Bond Yields
Indicators To Watch - Bond Yields
Indicators To Watch - Bond Yields
Interest Rate Chart II-5Indicators To Watch - Interest Rate Expectations
Indicators To Watch - Interest Rate Expectations
Indicators To Watch - Interest Rate Expectations
Chart II-6Indicators To Watch - Interest Rate Expectations
Indicators To Watch - Interest Rate Expectations
Indicators To Watch - Interest Rate Expectations
Chart II-7Indicators To Watch - Interest Rate Expectations
Indicators To Watch - Interest Rate Expectations
Indicators To Watch - Interest Rate Expectations
Chart II-8Indicators To Watch - Interest Rate Expectations
Indicators To Watch - Interest Rate Expectations
Indicators To Watch - Interest Rate Expectations
Bifurcated Tech
Bifurcated Tech
Two weeks ago we highlighted that the S&P5 (AAPL, MSFT, AMZN, GOOGL & FB) are trouncing the S&P495. Upon further analysis, and drilling deeper beneath the tech sector’s surface is revealing. These tech titans explain all of the year-to-date (ytd) tech related returns. The top panel of the chart shows that the S&P tech sector excluding AAPL & MSFT is below the February highs and nearly all the tech related return sits with the top five titans. Worrisomely, the remaining S&P 426 stocks (which exclude all the tech names) are down 10% ytd. In relative terms, the bottom panel of the chart reiterates that even the tech sector itself is in this bifurcated market where only a handful of stocks have been generating all the alpha. Such extreme concentration, while not unprecedented, is a sign of an unhealthy overall market backdrop which makes it vulnerable to a significant shock. Bottom Line: We remain cautious on the near-term prospects of the S&P 500, until the election uncertainty lifts late in the year.
Markets have shrugged off the rise in COVID-19 cases in the US and new clusters in other places such as Spain, Hong Kong, Melbourne, and Tokyo (Chart 1). The MSCI All-Country World Index is now only 4% off its all-time high in February. We don’t see the markets ignoring reality for much longer. Economic activity remains very subdued (Chart 2), which will eventually cause a significant rise in bankruptcies and problems for banks. Nevertheless, the unprecedented monetary and fiscal stimulus will be increased further in coming weeks, which should prevent a big shift towards pessimism for a while. The crunch time will come in the northern-hemisphere winter, when COVID cases in North America and Europe are likely to rise sharply again. Risk assets at their current levels are not pricing in those risks. Recommended Allocation
Monthly Portfolio Update: Winter Is Coming – But Maybe Not Yet
Monthly Portfolio Update: Winter Is Coming – But Maybe Not Yet
Chart 1COVID Cases Are Still On The Rise
COVID Cases Are Still On The Rise
COVID Cases Are Still On The Rise
Chart 2Activity Remains Subdued
Monthly Portfolio Update: Winter Is Coming – But Maybe Not Yet
Monthly Portfolio Update: Winter Is Coming – But Maybe Not Yet
Markets are driven by the second derivative of growth. It is not surprising, then, that equities began to rally in March, exactly when economic data stopped deteriorating, even though it remained atrocious (Chart 3). Real interest rates have also continued to fall, even as risk assets rallied; this further fueled the rally, since the theoretical value of equities rises as the rate at which they are discounted falls (Chart 4). Chart 3Data Stopped Deteriorating In March
Data Stopped Deteriorating In March
Data Stopped Deteriorating In March
Chart 4Real Interest Rates Have Continued To Fall
Real Interest Rates Have Continued To Fall
Real Interest Rates Have Continued To Fall
But the question now is: Can the data continue to improve? PMIs will fall back towards 50, and economic releases are unlikely to surprise so strongly on the upside. In the US, as a result of the rise in COVID-19 cases and renewed (albeit mostly moderate) government restrictions on activity, consumer confidence has started to weaken again and initial unemployment claims to pick up (Charts 5 and 6). Even though the Fed will remain ultra-dovish, real rates will not fall much further from their current level, which is the lowest since TIPS started trading in the late 1990s. Chart 5Consumer Confidence Is Weakening Again
Consumer Confidence Is Weakening Again
Consumer Confidence Is Weakening Again
Chart 6The Jobs Market Has Stopped Improving
The Jobs Market Has Stopped Improving
The Jobs Market Has Stopped Improving
Chart 7Will Money Supply Growth Peak?
Will Money Supply Growth Peak?
Will Money Supply Growth Peak?
Money supply growth has grown rapidly, as a result of the increase in central-bank balance-sheets and the rush of companies to borrow to shore up their cash positions (Chart 7). The increase in excess liquidity has also been a force behind the rise in risk assets. But money supply growth is likely to slow from now. At least partly offsetting these risks will be further fiscal stimulus. BCA Research’s Geopolitical strategists see Congress approving a big new package of around $2.5 trillion, mainly because of widespread popular support for an extension of more generous unemployment benefits (Table 1). Agreement should come before the scheduled recess on August 10 (if it doesn’t, this would trigger a market selloff). The recent agreement between European Union leaders on a EUR750 billion fiscal package was a major breakthrough, since it represented joint borrowing backed by the rich northern European countries to provide transfers to the poorer periphery. Table 1There Is Much Public Support For Fiscal Stimulus
Monthly Portfolio Update: Winter Is Coming – But Maybe Not Yet
Monthly Portfolio Update: Winter Is Coming – But Maybe Not Yet
Further upside may come as the many investors who have missed the rally since March capitulate and buy risk assets. Investor sentiment is currently unusually polarized. Speculative individuals and hedge funds are very bullish (Chart 8). But more conservative pension funds, wealth managers, and individual investors, mostly remain cautious, as evidenced by the AAII weekly survey, in which many more investors say they expect the stock market to fall over the next six months than to rise (Chart 9). Cash levels remain high by historical standards (Chart 10). Although only a minority of investors turned positive in March, a recent academic study demonstrated how hedge funds and small active institutions have a disproportionate influence on price movements (Chart 11). A downside risk, then, would be if these investors decided to take profits or turned more bearish. Chart 8Hedge Funds Are Bullish...
Hedge Funds Are Bullish...
Hedge Funds Are Bullish...
Chart 9...But Retail Investors Very Cautious
...But Retail Investors Very Cautious
...But Retail Investors Very Cautious
Chart 10Cash Holdings Remain Elevated
Cash Holdings Remain Elevated
Cash Holdings Remain Elevated
Chart 11Some Smaller Investors Have A Big Impact
Monthly Portfolio Update: Winter Is Coming – But Maybe Not Yet
Monthly Portfolio Update: Winter Is Coming – But Maybe Not Yet
We have argued, since the pandemic began, that investors should not take high-conviction bets in such an uncertain environment. They should, rather, design portfolios which are robust under various scenarios. After the 43% rise in global equities since March, we cannot recommend an above-benchmark weighting, since downside risks are not priced in. We remain neutral on global equities. However, fixed-income instruments look even more unattractive at the current low level of rates; we remain underweight. We recommend hedging via a large overweight in cash, which leaves dry powder for when a better buying opportunity arises. Currencies: A key (as always) to the macro view is what happens to the US dollar. Many of the drivers of the dollar – interest-rate differentials, valuation, momentum, and relative money-supply growth – point to it weakening further (Chart 12). The trade-weighted dollar is already off 9% from its March peak. We turned bearish on the USD in our Quarterly published at the beginning of July. It is too early, however, to declare that the dollar bull market, which began in 2012, is definitely over. Chart 12Dollar Indicators Are Bearish...
Dollar Indicators Are Bearish...
Dollar Indicators Are Bearish...
Chart 13…But Short USD Is Now A Consensus
Monthly Portfolio Update: Winter Is Coming – But Maybe Not Yet
Monthly Portfolio Update: Winter Is Coming – But Maybe Not Yet
A new downturn in the global economy would push the dollar back up again, since it is a safe-haven currency. Shorting the dollar, especially against the euro, is now a consensus position, and so a near-term reversal is quite likely (Chart 13). But, over the next 12-18 months, a move above 1.22 for the euro and towards 100 for the yen is possible. We will continue to analyze whether the dollar could be entering a bear market, since this would necessarily make us more structurally positive on commodities and emerging markets. Equities: A pickup in global growth and a weakening US dollar might prove positive for cyclicals and value stocks in the long run, which would cause European and EM equities to outperform. Given the current uncertainty, however, we cannot recommend that stance and therefore continue to prefer “growth defensives” such as Health Care and Technology, which implies an overweight on the overall US market. Valuations in the Health Care sector remain attractive (Chart 14). Companies in the (broadly defined) Tech sector are beneficiaries of the pandemic, generally have robust balance-sheets, and should continue to see strong earnings growth for some years. And, while Technology is clearly expensive, valuations are still nowhere as excessive as in 2000 (Chart 15). For Tech to crash would require either that it go ex-growth, or that there is significant regulatory action. Chart 14Health Care Still Attractively Valued
Health Care Still Attractively Valued
Health Care Still Attractively Valued
Chart 15Tech Still Way Below Bubble Levels
Tech Still Way Below Bubble Levels
Tech Still Way Below Bubble Levels
Chart 16Europe No Longer So Dominated By Financials
Europe No Longer So Dominated By Financials
Europe No Longer So Dominated By Financials
Neither of these seems likely for now. Euro zone equities are less dominated than they were by Financials, but remain more cyclical than the US, with very few internet-related names (Chart 16). Fixed Income: Central banks will remain very dovish and, as Fed chair Jerome Powell has emphasized, are not even thinking about thinking about tightening policy. This suggests that nominal rates will rise only moderately, even if growth continues to pick up. The Fed still has plenty of room to ease further if needed, since the programs it rolled out in March have barely been taken up yet (Table 2). We thus recommend a neutral position on duration. We find TIPS attractive as a hedge against an eventual spike in inflation. The 10-year breakeven inflation rate implied in TIPS remains around 100 basis points below being compatible with the Fed achieving its 2% PCE inflation target in the long run (Chart 17). The announcement in September of the results of the Fed’s 18-month review of its policy framework, which is likely to intensify its efforts to achieve the inflation target, could push breakevens up a bit further. In credit, we continue to recommend buying whatever central banks are buying, mostly investment-grade corporate bonds and the top end of the US junk bond market. Though spreads have fallen a long way, they are still well above end-2019 levels, and look attractive in a world of such low government bond yields (Chart 18). Table 2Usage Of The 2020 Federal Reserve Emergency Lending Facilities
Monthly Portfolio Update: Winter Is Coming – But Maybe Not Yet
Monthly Portfolio Update: Winter Is Coming – But Maybe Not Yet
Chart 17TIPS Still Pricing Low Inflation For A Decade
TIPS Still Pricing Low Inflation For A Decade
TIPS Still Pricing Low Inflation For A Decade
Chart 18Credit Spreads Could Fall Further
Credit Spreads Could Fall Further
Credit Spreads Could Fall Further
Commodities: The weakening US dollar and continued expansion of Chinese stimulus (Chart 19) should be positive for industrial metals prices over the next six to nine months. Oil prices also have some further upside, since the OPEC 2.0 agreement to restrict supply is being adhered to, and demand will gradually pick up (although air travel will remain depressed, more commuters are using their cars as they avoid public transport). BCA Research’s Energy Service forecasts Brent crude to average $44 in the second half of this year, and $65 in 2021 (up from the current $43). Gold has already run up a lot and is now close to a record high price in real terms, with sentiment very optimistic (Chart 20). Chart 19China Stimulus Positive For Metals
China Stimulus Positive For Metals
China Stimulus Positive For Metals
Nonetheless, in an environment of very low real rates, it represents a good hedge against extreme tail risks, and therefore we continue to recommend a moderate position as an insurance. Chart 20Gold Looking Rather Toppish
Gold Looking Rather Toppish
Gold Looking Rather Toppish
Garry Evans, Senior Vice President Global Asset Allocation garry@bcaresearch.com Recommended Asset Allocation
Highlights The tech sector faces mounting domestic political and geopolitical risks. We fully expected stimulus hiccups but believe they will give way to large new fiscal support, given that COVID-19 is weighing on consumer confidence. Europe’s relative political stability is a good basis for the euro rally but any comeback in opinion polling by President Trump could give dollar bulls new life. DXY is approaching a critical threshold below which it would break down further. The US could take aggressive actions on Russia and Iran, but China and the Taiwan Strait remain the biggest geopolitical risk. Feature Near-term risks continue to mount against the equity rally, even as governments’ combined monetary and fiscal policies continue to support a cyclical economic rebound. Chart 1Tech Bubble Amid Tech War
Tech Bubble Amid Tech War
Tech Bubble Amid Tech War
Testimony by the chief executives of Facebook, Apple, Amazon, and Alphabet to the US House of Representatives highlighted the major political risks facing the market leaders. There are three reasons not to dismiss these risks despite the theatrical nature of the hearings. First, the tech companies’ concentration of wealth would be conspicuous during any economic bust, but this bust has left pandemic-stricken consumers more reliant on their services. Second, acrimony is bipartisan – conservatives are enraged by the tendency of the tech companies to side with the Democratic Party in policing the range of acceptable political discourse, and they increasingly agree with liberals that the companies have excessive corporate power warranting anti-trust probes. Executive action is the immediate risk, but in the coming one-to-two years congressional majorities will also be mustered to tighten regulation. Third, technology is the root of the great power struggle between the US and China – a struggle that will not go away if Biden wins the election. Indeed Biden was part of the administration that launched the US’s “Pivot to Asia” and will have better success in galvanizing US diplomatic allies behind western alternatives to Chinese state-backed and military-linked tech companies. US tech companies struggle to outperform Chinese tech companies except during episodes of US tariffs, given the latter firms’ state-backed turn toward innovation and privileged capture of the Chinese domestic market (Chart 1). The US government cannot afford to break up these companies without weighing the strategic consequences for America’s international competitiveness. The attempt to coordinate a western pressure campaign against Huawei and other leading Chinese firms will continue over the long run as they are accused of stealing technology, circumventing UN sanctions, violating human rights, and compromising the national security of the democracies. China, for its part, will be forced to take counter-measures. US tech companies will be caught in the middle. Like the threat of executive regulation in the domestic sphere, the threat of state action in the international sphere is difficult to time. It could happen immediately, especially given that the US is having some success in galvanizing an alliance even under President Trump (see the UK decision to bar Huawei) and that President Trump’s falling election prospects remove the chief constraint on tough action against China (the administration will likely revoke Huawei’s general license on August 13 or closer to the election). Massive domestic economic stimulus empowers the US to impose a technological cordon and China to retaliate. Combining this headline risk to the tech sector with other indications that the equity rally is extended – the surge in gold prices, the fall in the 30-year/5-year Treasury slope – tells us that investors should be cautious about deploying fresh capital in the near term. Republicans Will Capitulate To New Stimulus Just as President Trump has ignored bad news on the coronavirus, financial markets have ignored bad news on the economy. Dismal Q2 GDP releases were fully expected – Germany shrank by 10.1% while the US shrank by 9.5% on a quarterly basis, 32.9% annualized. But the resurgence of the virus is threatening new government restrictions on economic activity. US initial unemployment claims have edged up over the past three weeks. US consumer confidence regarding future expectations plummeted from 106.1 in June to 91.5 in July, according to the Conference Board’s index. Chart 2Global Instability Will Follow Recession
A Tech Bubble Amid A Tech War (GeoRisk Update)
A Tech Bubble Amid A Tech War (GeoRisk Update)
Setbacks in combating the virus will hurt consumers even assuming that governments lack the political will to enforce new lockdowns. The share of countries in recession has surged to levels not seen in 60 years (Chart 2). Financial markets can look past recessions, but the pandemic-driven recession will result in negative surprises and second-order effects that are unforeseen. Yes, fresh fiscal stimulus is coming, but this is more positive for the cyclical outlook than the tactical outlook. Stimulus “hiccups” could precipitate a near-term pullback – such a pullback may be necessary to force politicians to resolve disputes over the size and composition of new stimulus. This risk is immediate in the United States, where House Democrats, Senate Republicans, and the White House have hit an all-too-predictable impasse over the fifth round of stimulus. The bill under negotiation is likely to be President Trump’s last chance to score a legislative victory before the election and the last significant legislative economic relief until early 2021. The Senate Republicans have proposed a $1.1 trillion HEALS Act in response to the House Democrats’ $3.4 trillion HEROES Act, passed in mid-May. As we go to press, the federal unemployment insurance top-up of $600 per week is expiring, with a potential cost of 3% of GDP in fiscal tightening, as well as the moratorium on home evictions. Congress will have to rush through a stop-gap measure to extend these benefits if it cannot resolve the debate on the larger stimulus package. If Democrats and Republicans split the difference then we will get $2.5 trillion in stimulus, likely by August 10. Compromise on the larger package is easy in principle, as Table 1 shows. If the two sides split the difference between their proposals in a commonsense way, as shown in the fourth and fifth columns of Table 1, then the result will be a $2.5 trillion stimulus. This estimate fits with what we have published in the past and likely meets market expectations for the time being. Table 1Outline Of Fifth US COVID Stimulus Package (Estimate)
A Tech Bubble Amid A Tech War (GeoRisk Update)
A Tech Bubble Amid A Tech War (GeoRisk Update)
Whether it is enough for the economy depends on how the virus develops and how governments respond once flu season picks up and combines with the coronavirus to pressure the health system this fall. A back-of-the-envelope estimate of the amount of spending necessary to keep the budget deficit from shrinking in the second half of the year comes much closer to the House Democrats’ $3.4 trillion bill (Table 2), which suggests that what appears to be a massive stimulus today could appear insufficient tomorrow. Nevertheless, $2.5 trillion is not exactly small. It would bring the US total to $5 trillion year-to-date, or 24% of GDP! Table 2Reducing The Budget Deficit On A Quarterly Basis Will Slow Economy
A Tech Bubble Amid A Tech War (GeoRisk Update)
A Tech Bubble Amid A Tech War (GeoRisk Update)
While a compromise bill should come quickly, the Republican Party is more divided over this round of stimulus than earlier this year. Chart 3US Personal Income Looks Good Compared To 2008-09
US Personal Income Looks Good Compared To 2008-09
US Personal Income Looks Good Compared To 2008-09
First, there is some complacency due to the fact that the economy is recovering, not collapsing as was the case back in March. Our US bond strategist, Ryan Swift, has shown that US personal income is much better off, thus far, than it was in the months following the 2008 financial crisis, even though the initial pre-transfer hit to incomes is larger (Chart 3). Second, the Republican Party is reacting to growing unease within its ranks over the yawning budget deficit, now the largest since World War II (Chart 4). Chart 4If Republicans React To Deficit Concerns They Cook Their Own Goose
If Republicans React To Deficit Concerns They Cook Their Own Goose
If Republicans React To Deficit Concerns They Cook Their Own Goose
Chart 5Consumer Confidence Sends Warning Signal To Republicans
A Tech Bubble Amid A Tech War (GeoRisk Update)
A Tech Bubble Amid A Tech War (GeoRisk Update)
If Republicans are guided by complacency and fiscal hawks, they will cook their own goose. A failure to provide government support will cause a financial market selloff, will hurt consumer confidence, and will put the final nail in the coffin of their own chance of re-election as well as President Trump’s. Consumer confidence tracks fairly well with presidential approval rating and election outcomes. A further dip could disqualify Trump, whereas a last-minute boost due to stimulus and an economic surge could line him up for a comeback in the last lap (Chart 5). These constraints are obvious so we maintain our high conviction call that a bill will be passed, likely by August 10. But at these levels on the equity market, we simply have no confidence in the market gyrations leading up to or following the passage of the bill. Our conviction level is on the cyclical, 12-month horizon, in which case we expect US and global stimulus to operate and equities to rise. Bottom Line: Political and economic constraints will force Republicans to join Democrats and pass a new stimulus bill of about $2.5 trillion by around August 10. This is cyclically positive, but hiccups in getting it passed, negative surprises, and other risks tied to US politics discourage us from taking an overtly bullish stance over the next three months. Yes, US-China Tensions Are Still Relevant Chart 6Chinese Politburo"s Bark Worse Than Bite On Stimulus
Chinese Politburo"s Bark Worse Than Bite On Stimulus
Chinese Politburo"s Bark Worse Than Bite On Stimulus
Financial markets have shrugged off US-China tensions this year for understandable reasons. The pandemic, recession, and stimulus have overweighed the ongoing US-China conflict. As we have argued, China is undertaking a sweeping fiscal and quasi-fiscal stimulus – despite lingering hawkish rhetoric – and the size is sufficient to assist in global economic recovery as well as domestic Chinese recovery. What the financial market overlooks is that China’s households and firms are still reluctant to spend (Chart 6). China’s Politburo's late July meetings on the economy are frequently important. Initial reports of this year’s meet-up reinforce the stimulus narrative. Hints of hawkishness here and there serve a political purpose in curbing market exuberance, both at home and in the US election context, but China will ultimately remain accommodative because it has already bumped up against its chief constraint of domestic stability. Note that this assessment also leaves space for market jitters in the near-term. The phase one trade deal remains intact as President Trump is counting on it to make the case for re-election while China is looking to avoid antagonizing a loose cannon president who still has a chance of re-election. As long as broad-based tariff rates do not rise, in keeping with Trump’s deal, financial markets can ignore the small fry. We maintain a 40% risk that Trump levels sweeping punitive measures; our base case is that he goes to the election arguing that he gets results through his deal-making while carrying a big stick. At the same time, our view that domestic stimulus removes the economic constraints on conflict, enabling the two countries to escalate tensions, has been vindicated in recent weeks. Chinese political risk continues on a general uptrend, based on market indicators. The market is also starting to price in the immense geopolitical risks embedded in Taiwan’s situation, which we have highlighted consistently since 2016. While North Korea remains on a diplomatic track, refraining from major military provocations, South Korean political risk is still elevated both for domestic and regional reasons (Chart 7). Chart 7China Political Risk Still Trending Upward
China Political Risk Still Trending Upward
China Political Risk Still Trending Upward
The market is gradually pricing in a higher risk premium in the renminbi, Taiwanese dollar, and Korean won, and this pricing accords with our longstanding political assessment. The closure of the US and Chinese consulates in Houston and Chengdu is only the latest example of this escalating dynamic. While the US’s initial sanctions on China over Hong Kong were limited in economic impact, the longer term negative consequences continue to build. Hong Kong was the symbol of the Chinese Communist Party’s compatibility with western liberalism; the removal of Hong Kong’s autonomy strikes a permanent blow against this compatibility. China’s decision to go forward with the imposition of a national security law in Hong Kong – and now to bar pro-democratic candidates from the September 6 Legislative Council elections, which will probably be postponed anyway – has accelerated coalition-building among the western democracies. The UK is now clashing with China more openly, especially after blocking Huawei from its 5G system and welcoming Hong Kong political refugees. Australia and China have fought a miniature trade war of their own over China’s lack of transparency regarding COVID-19, and Canada is implicated in the Huawei affair. Even the EU has taken a more “realist” approach to China. Across the Taiwan Strait, political leaders are assisting fleeing Hong Kongers, crying out against Beijing’s expansion of control in its periphery, rallying support from informal allies in the US and West, and doubling down on their “Silicon Shield” (prowess in semiconductor production) as a source of protection. Intel Corporation’s decision to increase its dependency on TSMC for advanced microchips only heightens the centrality of this island and this company in the power struggle between the US and China. China cannot fulfill its global ambitions if the US succeeds in creating a technological cordon. Taiwan is the key to China’s breaking through that cordon. Therefore Taiwan is at heightened risk of economic or even military conflict. The base case is that Beijing will impose economic sanctions first, to undermine Taiwanese leadership. The uncertainty over the US’s willingness to defend Taiwan is still elevated, even if the US is gradually signaling a higher level of commitment. This uncertainty makes strategic miscalculations more likely than otherwise. But Taiwan’s extreme economic dependence on the mainland gives Beijing a lever to pursue its interests and at present that is the most important factor in keeping war risk contained. By the same token, Taiwanese economic and political diversification increases that risk. A “fourth Taiwan Strait crisis” that involves trade war and sanctions is our base case, but war cannot be ruled out, and any war would be a major war. Thus investors can safely ignore Tik-Tok, Hong Kong LegCo elections, and accusations of human rights violations in Xinjiang. But they cannot ignore concrete deterioration in the Taiwan Strait. Or, for that matter, the South and East China Seas, which are not about fishing and offshore drilling but about China’s strategic depth and positioning around Taiwan. Taiwan is at heightened risk of economic or military conflict. The latest developments have seen the CNY-USD exchange rate roll over after a period of appreciation associated with bilateral deal-keeping (Chart 8). Depreciation makes it more likely that President Trump will take punitive actions, but these will still be consistent with maintaining the phase one deal unless his re-election bid completely collapses, rendering him a lame duck and removing his constraints on more economically significant confrontation. We are perilously close to such an outcome, which is why Trump’s approval rating and head-to-head polling against Joe Biden must be monitored closely. If his budding rebound is dashed, then all bets are off with regard to China and Asian power politics. Chart 8A Warning Of Further US-China Escalation
A Warning Of Further US-China Escalation
A Warning Of Further US-China Escalation
Bottom Line: China’s stimulus, like the US stimulus, is a reason for cyclical optimism regarding risk assets. The phase one trade deal with President Trump is less certain – there is a 40% chance it collapses as stimulus and/or Trump’s political woes remove constraints on conflict. Hong Kong is a red herring except with regard to coalition-building between the US and Europe; the Taiwan Strait is the real geopolitical risk. Maritime conflicts relate to Taiwan and are also market-relevant. Europe, Russia, And Oil Risks Europe has proved a geopolitical opportunity rather than a risk, as we have contended. The passage of joint debt issuance in keeping with the seven-year budget reinforces the point. The Dutch, facing an election early next year, held up the negotiations, but ultimately relented as expected. Emmanuel Macron, who convinced German Chancellor Angela Merkel to embrace this major compromise for European solidarity, is seeing his support bounce in opinion polls at home. He is being rewarded for taking a leadership position in favor of European integration as well as for overseeing a domestic economic rebound. His setback in local elections is overstated as a political risk given that the parties that benefited do not pose a risk to European integration, and will ally with him in 2022 against any populist or anti-establishment challenger. We still refrain from reinitiating our long EUR-USD trade, however, given the immediate risks from the US election cycle (Chart 9). We will reevaluate if Trump’s odds of victory fall further. A Biden victory is very favorable for the euro in our view. Chart 9EUR-USD Gets Boost From EU Solidarity
EUR-USD Gets Boost From EU Solidarity
EUR-USD Gets Boost From EU Solidarity
We are bullish on pound sterling because even a delay or otherwise sub-optimal outcome to trade talks is mostly priced in at current levels (Charts 10A and 10B). Prime Minister Boris Johnson has the raw ability to walk away without a deal, in the context of strong domestic stimulus, but the long-term economic consequences could condemn him to a single term in office. Compromise is better and in both parties’ interests. Chart 10APound Sterling A Buy Over Long Run
Pound Sterling A Buy Over Long Run
Pound Sterling A Buy Over Long Run
Chart 10BPound Sterling A Buy Over Long Run
Pound Sterling A Buy Over Long Run
Pound Sterling A Buy Over Long Run
Two other risks are worth a mention in this month’s GeoRisk Update: Chart 11Russia: GeoRisk Indicator Russian Bonds May Face Sanctions
Russia: GeoRisk Indicator Russian Bonds May Face Sanctions
Russia: GeoRisk Indicator Russian Bonds May Face Sanctions
Russia: In recent reports we have maintained that Russian geopolitical risk is understated by markets. Domestic unrest is rising, the Trump administration could impose penalties over Nordstream 2 or other issues to head off criticism on the campaign trail, and a Biden administration would be outright confrontational toward Putin’s regime. Moscow may intervene in the US elections or conduct larger cyber attacks. US sanctions could ultimately target trading of local currency Russian government bonds, which so far have been spared (Chart 11). Iran: The jury is still out on whether the recent series of mysterious explosions affecting critical infrastructure in Iran are evidence of a clandestine campaign of sabotage (Table 3). The nature of the incidents leaves some room for accident and coincidence.1 But the inclusion of military and nuclear sites in the list leads us to believe that some degree of “wag the dog” is going on. The prime suspect would be Israel and/or the United States during the window of opportunity afforded by the Trump administration, which looks to be closing over the next six months. Trump likely has a high tolerance for conflict with Iran ahead of the election. Even though Americans are war-weary, they will rally to the president’s defense if Iran is seen as the instigator, as opinion polls showed they did in September 2019 and January of this year. Iran is avoiding goading Trump so far but if it suffers too great of damage from sabotage then it may be forced to react. The dynamic is unstable and hence an oil price spike cannot be ruled out. Table 3Wag The Dog Scenario Playing Out In Iran
A Tech Bubble Amid A Tech War (GeoRisk Update)
A Tech Bubble Amid A Tech War (GeoRisk Update)
Chart 12Oil Supply Risks Stem From Iran/Iraq, But COVID Threat To Demand Persists
Oil Supply Risks Stem From Iran/Iraq, But COVID Threat To Demand Persists
Oil Supply Risks Stem From Iran/Iraq, But COVID Threat To Demand Persists
Oil markets have the capacity and the large inventories necessary to absorb supply disruptions caused by a single Iranian incident (Chart 12). Only a chain reaction or major conflict would add to upward pressure. This would also require global demand to stay firm. The threat from COVID-19 suggests that volatility is the only thing one can count on in the near-term. Over the long run we remain bullish crude oil due to the unfettered commitment by world governments to reflation. Bottom Line: The euro rally is fundamentally supported but faces exogenous risks in the short run. We would steer clear of Russian currency and local currency bonds over the US election campaign and aftermath, particularly if Trump’s polling upturn becomes a dead cat bounce. Iran is a “gray swan” geopolitical risk, hiding in plain sight, but its impact on oil markets will be limited unless a major war occurs. Investment Implications The US dollar is at a critical juncture. Our Foreign Exchange Strategist Chester Ntonifor argues that if the DXY index breaks beneath the 93-94 then the greenback has entered a structural bear market. The most recent close was 93.45 and it has hovered below 94 since Monday. Failure to pass US stimulus quickly could result in a dollar bounce along with other safe havens. Over the short run, investors should be prepared for this and other negative surprises relating to the US election and significant geopolitical risks, especially involving China, the tech war, and the Taiwan Strait. Over the long run, investors should position for more fiscal support to combine with ultra-easy monetary policy for as far as the eye can see. The Federal Reserve is not even “thinking about thinking about raising rates.” This combination ultimately entails rising commodity prices, a weakening dollar, and international equity outperformance relative to both US equities and government bonds. Matt Gertken Vice President Geopolitical Strategy mattg@bcaresearch.com Footnotes 1 See Raz Zimmt, "When it comes to Iran, not everything that goes boom in the night is sabotage," Atlantic Council, July 30, 2020. Section II: Appendix : GeoRisk Indicator China
China: GeoRisk Indicator
China: GeoRisk Indicator
Russia
Russia: GeoRisk Indicator
Russia: GeoRisk Indicator
UK
UK: GeoRisk Indicator
UK: GeoRisk Indicator
Germany
Germany: GeoRisk Indicator
Germany: GeoRisk Indicator
France
France: GeoRisk Indicator
France: GeoRisk Indicator
Italy
Italy: GeoRisk Indicator
Italy: GeoRisk Indicator
Canada
Canada: GeoRisk Indicator
Canada: GeoRisk Indicator
Spain
Spain: GeoRisk Indicator
Spain: GeoRisk Indicator
Taiwan
Taiwan: GeoRisk Indicator
Taiwan: GeoRisk Indicator
Korea
Korea: GeoRisk Indicator
Korea: GeoRisk Indicator
Turkey
Turkey: GeoRisk Indicator
Turkey: GeoRisk Indicator
Brazil
Brazil: GeoRisk Indicator
Brazil: GeoRisk Indicator
Section III: Geopolitical Calendar
Highlights The decade-long US equity market outperformance versus the rest of the world could be nearing its end. We are upgrading EM stocks from underweight to neutral within a global equity portfolio. We reiterate the change in our US dollar outlook from bullish to bearish. The concentration risk in EM (specifically in North Asia) mega-cap stocks, poor fundamentals in EM outside North Asia, and a potential flare-up in US-China tensions are the reasons why we are reluctant to be overweight EM stocks. Feature We recommended the short EM equities / long S&P 500 position in late 2010,1 and have reiterated this strategy consistently over the past decade. Since its inception, this trade has produced a 193% gain with extremely low volatility (Chart 1). We recommend taking profits on this position for the reasons elaborated in this report. Chart 1Book Profits On Our Short EM Stocks / Long S&P 500 Strategy
Book Profits On Our Short EM Stocks / Long S&P 500 Strategy
Book Profits On Our Short EM Stocks / Long S&P 500 Strategy
Chart 2Equity Strategy Of the Decade: The Risk-Reward Is No Longer Attractive
Equity Strategy Of the Decade: The Risk-Reward Is No Longer Attractive
Equity Strategy Of the Decade: The Risk-Reward Is No Longer Attractive
Consistently, we are upgrading EM stocks from underweight to neutral within a global equity portfolio. Our decade-long equity sector theme – introduced in our June 8, 2010 report2 – has been to underweight resources and overweight technology and healthcare (Chart 2). This sector strategy has been one of the reasons for underweighting EM and favoring the US market in a global equity portfolio over the past decade. Going forward, the risk-reward of this sector strategy is no longer attractive. Regarding EM absolute performance, we recommend that absolute-return investors remain on standby for a correction before going long the EM equity benchmark. The End Of US Equity Outperformance The decade-long US equity market outperformance versus the rest of the world could be nearing its end.It is widely known that this decade’s US equity outperformance was largely due to FAANGM stocks (Facebook, Amazon, Apple, Netflix, Google and Microsoft). The FAANGM rally meets many of the criteria for a bubble, as we elaborated in our July 16 report. Our FAANGM equity index – an equal-weighted average of the six stocks – has increased almost 20-fold in real (inflation-adjusted) terms since January 2010 (Chart 3). Chart 3Each Decade = One Mania
Take Profits On The Short EM / Long S&P 500 Position
Take Profits On The Short EM / Long S&P 500 Position
Its rise is on par with the magnitude of the bull market in the Nasdaq 100 index through the 1990s, or of Walt Disney. through the 1960s, and it well exceeds other bubbles, as illustrated on Chart 3. All price indexes are shown in real (inflation-adjusted) terms. FAANGM stocks have greatly benefited from the recent “work from home” and other societal shifts and have been outperforming through the March financial carnage. It has made them unassailable in the eyes of investors. Yet, even great companies have a fair price, and considerable price overshoots will not be sustainable in the long term. We sense that a growing number of investors deem the US FAANGM and EM mega-cap stocks to be invincible. When some stocks are regarded as unbeatable, their top is not far. Therefore, it is highly unlikely that the FAANGM will outperform in the next selloff. Rather, the odds are that they will underperform because these stocks are extremely expensive, overbought, over-hyped and over-owned. The decade-long US equity market outperformance versus the rest of the world could be nearing its end. Apart from technology and FAANGM, US equities are facing a mediocre profit outlook. As long as the pandemic is not contained, America’s consumer and business confidence will remain lackluster, and, as a result, a recovery in their spending will be subdued. Chart 4US Stocks Are Not Cheap After Removing Market-Cap Bias
US Stocks Are Not Cheap After Removing Market-Cap Bias
US Stocks Are Not Cheap After Removing Market-Cap Bias
Notably, the broad US equity market is also expensive. The equal-weighted US equity index is trading at a 12-month forward P/E ratio of 21 (Chart 4, top panel). The risks associated with domestic politics are rising in the US. Social, political and economic divisions have been magnified by both the pandemic and the economic downtrend. Social and political tensions will likely flare up around the November elections. Our colleagues from the Geopolitical team argue that a contested election is possible and could lead to a crisis of presidential legitimacy in the US. Finally, the US equity market cap has reached 58% of the global market cap, the highest on record. Gravity forces are likely to kick in sooner than later, capping US equity outperformance. Bottom Line: The tailwinds supporting the US equity outperformance are fading. We are booking gains on the short EM stocks / long S&P 500 strategy. Consistently, we are also closing the short EM banks / long US banks and short Chinese banks / long US banks positions. They have produced a 75% gain and an 11% loss, respectively. Downgrading The US Dollar Outlook = Upgrading The EM View We had been bullish on the US dollar and bearish on EM currencies since early 2011 (Chart 5, top panel), but on July 9 made a major change in our currency strategy: we switched our shorts in EM currencies away from the US dollar to against an equal-weighted basket of the euro, Swiss franc and the yen. Since then, the EM ex-China equal-weighted currency index has rebounded versus the US dollar, but has depreciated against the basket of the euro, CHF and JPY (Chart 5, bottom panel). Chart 5EM Currencies Have Bottomed Versus The US Dollar But Not Against Other Safe-Heavens
EM Currencies Have Bottomed Versus The US Dollar But Not Against Other Safe-Heavens
EM Currencies Have Bottomed Versus The US Dollar But Not Against Other Safe-Heavens
While the US dollar could rebound in the short term, especially versus EM currencies, any rebound will likely prove to be short-lived. From now on, the strategy for the greenback should be selling into strength. Here is why: As US inflation rises in the coming years and the Fed refuses to raise interest rates, US real rates will drop further and, as a result, the US dollar will depreciate. A central bank that is behind the inflation curve is bearish for a nation’s currency. The main reason for turning negative on the US dollar structurally is the rising determination by the Federal Reserve to stay behind the inflation curve in the years to come. This strategy will instigate an inflation outbreak. Falling real interest rates have caused a plunge in the US dollar, as well as a surge in precious metal prices, in recent weeks. In fact, risk-on currencies have lately underperformed safe-haven currencies, such as the CHF and JPY (Chart 6). This market move confirms that the dollar’s recent plunge is due to fears of its debasement, not to robust growth in the world economy and in EM/China. As US inflation rises in the coming years and the Fed refuses to raise interest rates, US real rates will drop further and, as a result, the US dollar will depreciate. Colossal debt monetization. The Fed is undertaking an immense monetization of public and private debt. The current situation, involving the Fed’s purchases of securities, is different from the one following the Lehman crisis. Back in 2008-2014, the Fed’s QE program did not produce an exponential rise in money supply. The US broad money supply (M2) was rising at a single-digit rate between 2009 and 2014 (Chart 7). Presently, US M2 growth has exploded to 24% from a year ago. Chart 6Risk-On Currencies Are Underperforming Safe-Heaven Ones
Risk-On Currencies Are Underperforming Safe-Heaven Ones
Risk-On Currencies Are Underperforming Safe-Heaven Ones
Chart 7Helicopter' Money in the US
Helicopter' Money in the US
Helicopter' Money in the US
The pace of US broad money growth is much higher than that of many advanced and developing economies. Chart 8 shows new money creation as a share of GDP across various economies. It demonstrates that Japan and the US are now experiencing the quickest rate of new money creation in the world. In short, even though debt monetization is occurring in many advanced and EM economies, the US is doing it on an unprecedented scale. Chart 8Money Creation As % Of GDP In 2Q2020
Take Profits On The Short EM / Long S&P 500 Position
Take Profits On The Short EM / Long S&P 500 Position
“Helicopter” money will eventually lift inflation. The latest surge in the US money supply has only partially offset the collapse in its velocity. Consequently, America’s nominal GDP has plunged. This stems from the following identity: Nominal GDP = Price Level x Output Volume = Velocity of Money x Money Supply Solving the above equation for inflation, we get: Price Level = (Velocity of Money x Money Supply) / (Output Volume) Going forward, the velocity of US money will likely recover, for it is closely associated with consumers’ and businesses’ willingness to spend. At that point, rising velocity of money and greater money supply will work together to exert upward pressure on nominal GDP. Meantime, the pandemic will probably reduce potential output. The outcome of higher nominal spending and reduced potential productive capacity will be higher inflation. In sum, US inflation will rise well above 2% in the coming years. Yet, the Fed will stay put amid rising inflation. The upshot will be a structural downtrend in the US dollar. Whilst there are many arguments against rising inflation, we are leaning toward the view that US inflation will begin rising as of next year. We will elaborate on this inflation outlook in our future reports. Rising political and social uncertainty in the US will weigh on the greenback. The failure by the US authorities to contain the spread of the pandemic will continue fueling political and social upheavals. This could culminate in a harshly contested presidential election and a reduction in the US dollar’s allure for foreign investors. Portfolio inflows into the US will turn into outflows. The stellar performance of US equities attracted portfolio inflows into the US over the last 10 years. These capital inflows, in turn, boosted the greenback. But these dynamics are about to be reversed. Chart 9The US's Net International Investment Position Is At A Record Low
The US's Net International Investment Position Is At A Record Low
The US's Net International Investment Position Is At A Record Low
The top panel of Chart 9 shows that the US’s net international investment position in equities is at its lowest point since 1986. This means that foreign ownership of US stocks exceeds US resident ownership of foreign equities by a record amount. This reflects the fact that investors have by a large margin favored the US versus other bourses. As American share prices outperformed their international peers, both domestic and foreign investors have poured more capital into US equities. As the US relative equity performance reverses, equity capital will flow out of the US, thus dragging down the US dollar. Chart 10 shows that the trade-weighted dollar tracks the relative performance of the S&P500 versus the global equity benchmark in local currency terms. Regarding debt securities, the US’s net international investment position has widened to - US$8.5 trillion (Chart 9, bottom panel). Not all fixed-income investors hedge currency risk. As the dollar slides, there will be growing pressure on foreign fixed-income investors to hedge their dollar exposure or sell US and buy non-US debt securities. Chart 10A Top In The US$ = The End Of The US Equity Outperformance?
A Top In The US$ = The End Of The US Equity Outperformance?
A Top In The US$ = The End Of The US Equity Outperformance?
Bottom Line: Immense public debt monetization leading to higher inflation down the road and the Fed falling behind the curve, will produce a lasting and considerable downtrend in the US dollar in the coming years. Why Not Overweight EM Stocks? There are a number of reasons why – for now – we are only upgrading EM equities to neutral, rather than to overweight within a global equity portfolio, and why we are still reluctant to recommend buying EM stocks for absolute-return investors: Concentration risk in EM mega-cap stocks. As US FAANGM share prices come under selling pressure, contagion will spill over to EM mega-cap stocks. The latter have been responsible for a large share of gains in the EM equity index and, conversely, their pullback will considerably impact the EM benchmark’s performance. The top six companies combined account for about 24% of the MSCI EM equity market cap. To compare, US FAANGM (Facebook, Apple, Amazon, Netflix, Google and Microsoft) also account for 24% of the S&P 500 market cap. Hence, the concentration risk in EM equity space is as high as in the US. Geopolitical risk. A potential flare up in in geopolitical tensions will weigh on Chinese, South Korean and Taiwanese stocks. Given that they make up about 65% of the MSCI EM index equity market cap, the EM benchmark will suffer in absolute terms and be unlikely to outperform the global equity index. Faced with decreased approval in regard to his handling of the pandemic, and to a lesser extent, the economy and other social issues, President Trump could well resort to geopolitics to “rally Americans behind the flag.” He may, for example, ramp up tensions with China in an attempt to make geopolitics and China the focal points of the forthcoming presidential election. China will certainly retaliate. The South China Sea, Taiwan, technology transfers, treatment of multinational companies in both China and the US, as well as North Korea, could be focal points of a confrontation. This will weigh on business confidence in Asia and on capital spending. In our opinion, markets are vulnerable to such geopolitical risks. Poor domestic fundamentals in EM outside China, Korea and Taiwan. Fundamental backdrops remain inferior in many EM economies outside the North Asian ones. The number of new infections continues to rise in India, Indonesia, The Philippines, Brazil, Mexico, Colombia and Peru. Many EM economies will only slowly return to normalcy. In certain countries, banking systems were already in poor health, and things have gotten much worse after the crash in economic activity. As to the positives for EM, they are as follows: Rising Chinese demand will boost EM exports to China and help revive their growth. EM equity valuations are very appealing versus the S&P 500 (Chart 11). The bottom panel of Chart 11 shows that EM’s cyclically-adjusted P/E ratio relative to that in the US is over one standard deviation below its mean. Based on the 12-month forward P/E ratio for an equal-weighted index, EM stocks are cheaper than US ones (please refer to Chart 4 on page 4). EM currencies are also cheap (Chart 12). While they might experience a short-term setback, as a global risk-off phase takes place, EM exchange rates have probably seen their lows versus the US dollar. Chart 11EM Stocks Offer Value Versus The S&P 500
EM Stocks Offer Value Versus The S&P 500
EM Stocks Offer Value Versus The S&P 500
Chart 12EM Currencies Are Cheap
EM Currencies Are Cheap
EM Currencies Are Cheap
The US dollar’s weakness will mitigate risks for EM issuers of US dollar bonds and, thereby, induce more flows into EM sovereign and corporate credit markets. In short, EM local currency bonds will assuredly benefit from the US dollar’s slide. We have been neutral on both EM local currency bonds and EM sovereign and corporate credit, and are waiting for a correction before upgrading to overweight. In nutshell, little or no stress in EM fixed-income markets bodes well for EM share prices. Bottom Line: Risks to EM equity relative performance are presently balanced. A neutral allocation is warranted for now. EM relative equity performance versus DM is only slightly above its recent low (Chart 13, top panel). It is, therefore, a good juncture to move the EM equity allocation from underweight to neutral. In addition, both the EM equal-weighted and small-cap equity indexes are not yet signaling a broad-based and sustainable outperformance (Chart 13, middle and bottom panels). Chart 13EM Relative Equity Performance Is In A Bottom-Out Phase
EM Relative Equity Performance Is In A Bottom-Out Phase
EM Relative Equity Performance Is In A Bottom-Out Phase
Some FAQs Question: Wouldn’t the US dollar rally if global stocks sell off? The greenback will likely attempt to rebound from current oversold levels when and as a global risk-off phase sets in. EM high-beta currencies could experience a non-trivial setback but will remain above their March lows. Yet, any rebound in the US dollar versus European currencies and the Japanese yen will be fleeting and moderate. On July 9, in anticipation of US dollar weakness, we booked profits on the short EM currencies/long US dollar strategy and recommended shorting several EM currencies versus an equal-weighted basket of the euro, CHF and JPY. This strategy remains intact for now. Our short list of EM currencies includes: BRL, CLP, ZAR, TRY, IDR, PHP and KRW. Odds are that EM stocks will likely be broadly flattish relative to those in DM amid the next sell off. Chart 14EM Stocks Have Been Low Beta
EM Stocks Have Been Low Beta
EM Stocks Have Been Low Beta
Question: Aren’t EM stocks high-beta and won’t they underperform if, and as, global stocks sell off? The EM equity index has had a beta lower than one since 2013 (Chart 14). Odds are that EM stocks will likely be broadly flattish relative to those in DM amid the next sell off. Within the DM equity space, the US will likely underperform both Europe and Japan in common currency terms. Question: Which equity markets do you favor within the EM space? Our current overweights are China, Thailand, Russia, Peru, Pakistan and Mexico. Our underweights are Indonesia, India, Hong Kong, the Philippines, Turkey, South Africa, Chile and Brazil. Question: Which currencies and local currency bond markets do you recommend overweighting for dedicated EM managers? We recommended going long the Czech koruna versus the US dollar last week. Other currencies that we favor within the EM space are SGD, TWD, THB, MXN and RUB. As for local currency bonds or swap rates, our top picks are Mexico, Russia, Korea, India, China, Malaysia, Thailand, Peru, Ukraine and Pakistan. As always, the list of country recommendations for equities, fixed-income and currencies is available at the end of our reports (please refer to pages 14-15) or on the website. Arthur Budaghyan Chief Emerging Markets Strategist arthurb@bcaresearch.com Footnotes 1Please see Emerging Markets Strategy Weekly Reports "Inflation, Overheating And The Stampede Into Bonds," dated November 30, 2010, and "Emerging Markets In 2011: Not The Best Play In Town," dated December 14, 2010. 2Please see Emerging Markets Strategy Special Report "How To Play Emerging Market Growth In The Coming Decade," dated June 8, 2010 Equities Recommendations Currencies, Credit And Fixed-Income Recommendations
Highlights The tech sector is in a manic phase. This mania has further room to run because inflation will remain low for at least the next two years and global central banks will maintain very easy policy conditions, which will cap the upside in bond yields. Tech will have its day of reckoning when inflation can rise and the sector’s weight will drag down the market. Bubbles are prone to severe corrections; this one is no exception. In the near term, tech earnings will probably miss lofty embedded expectations. The falling dollar is a problem for the sector and the election season introduces great risks. In the near term, inflation breakeven rates, the silver-to-gold ratio and the deep cyclicals-to-defensives ratio will all rise further. Industrials have a window to outperform technology. Feature The S&P 500 continues its ascent, increasingly driven higher by surging tech stocks. The extreme resilience of a few tech titans has resulted in an incredibly concentrated equity market, in which the capitalization of Google, Amazon, Microsoft, Apple and Facebook equals that of 224 deep and early cyclical stocks in the S&P 500. Such a narrow market raises three questions: is the tech sector in a bubble? What will pop this bubble? If the tech bubble bursts, will the S&P 500 shrug it off or decline with giant technology firms? We believe that tech stocks are in a bubble and the mania will expand further as long as inflation remains low and monetary conditions stay accommodative, despite occasional pullbacks. Moreover, the broad market will suffer when the bubble eventually bursts. Each Decade Has Its Bubble BCA Research’s Emerging Market Strategy team recently demonstrated that each decade in the past 60 years has experienced its own financial excess (Chart I-1).1 Three forces fueled each of these manias: an extended phase of easy monetary policy; a narrative that drove funds towards fashionable assets; and an extended period of superior returns that accentuated the inevitability of participating in the bubble. Chart I-1Each Decade Has Its Bubble
August 2020
August 2020
In the 1960s, the mania surrounded the so-called “Nifty 50” stocks, as exemplified by Disney. The Nifty 50 were large-cap companies with solid franchises and a proven track record of dividend growth. Meanwhile, the period of low inflation from 1960 to 1966 allowed the US Federal Reserve to keep the unemployment rate below NAIRU, which indicated that policy was accommodative. When inflation began to rise in 1966, the Fed lifted interest rates to 7.75% in 1973, and the bubble evaporated with the recession started that year. In the 1970s, the mania involved precious metals, such as gold and silver. Precious metals benefited from the 33% fall in the dollar, the surge in inflation from 2.9% in 1970 to 14.7% in 1980, and the Fed’s incapacity to get ahead of the inflation curve through most of the decade. Then-Fed Chair Paul Volcker burst this bubble when he boosted interest rates to 19% in 1981 to kill off inflation, which also started the 93% dollar rally that culminated in 1985. Tech stocks are in a bubble and the mania will expand further as long as inflation remains low and monetary conditions stay accommodative. In the 1980s, the mania centered on Japan. The Japanese economy experienced a miraculous post-war expansion, with real GDP per capita surging by a cumulative average growth rate of 7% between 1945 and 1980. By the mid-1980s, the prevailing belief was that Japanese firms would dominate every industry. Moreover, after the Ministry of Finance allowed the yen to surge following the September 1985 Plaza Accord, the Bank of Japan (BoJ) cut interest rates by 2.5%, creating very easy domestic monetary conditions. This lax policy setting unleashed a surge in credit and asset valuations that pushed up the Nikkei-225 five times by the end of the decade and resulted in an 860% increase in the value of Japanese banks. The BoJ lifted interest rates by 3.5 percentage points between 1987 and 1990. The market peaked in December 1989 and the Nikkei collapsed by 82% during the next 19 years. In the 1990s, tech stocks and the NASDAQ captured investors’ imagination. The internet, computing power and software, all drove an increase in productivity growth to a two-decade high and investors understood that the sector’s earnings prowess was only beginning. Moreover, as inflation fell through the 1990s, then-Fed Chairman Alan Greenspan kept policy rates more or less flat for four years before cutting the fed funds rate by 75 basis points in 1998. Additionally, around the turn of the millennium, the Fed increased the size of its balance sheet by $90 billion as a precautionary measure against Y2K. Consequently, with the ensuing euphoria, investors pushed the NASDAQ’s valuation to a P/E ratio of 72, extrapolating far into the future much-too-strong earnings growth. The bubble imploded when the Fed normalized policy. We are not even thinking about thinking about raising rates. In the 2000s, the dominant story was the unstoppable upswing of the Chinese economy, the nation’s rapid urbanization and insatiable thirst for commodities. The lack of investment in commodity extraction through the 1990s exacerbated the rally in natural resources. The easy Fed policy implemented in the wake of the tech crash of 2000 to 2003, and the dollar’s 40% plunge between 2002 and 2008 added to the bullish mix in favor of resources. Commodity indices surged and iron ore, which derives a particularly large share of demand from construction in China, increased 12-fold between 2000 and 2011. The rise in the broad trade-weighted dollar that began in 2011 along with a slowdown in Chinese growth initiated in 2010 ultimately quashed commodities. Is The Tech Bubble About To End? Chart I-2The Drivers Of The Tech Bubble
The Drivers Of The Tech Bubble
The Drivers Of The Tech Bubble
Historically, bubbles often abort at the end of the decade in which they materialize. Will the ongoing mania suffer the same fate as its predecessors? For now, the pillars of the tech bubble remain intact. The strength of tech stocks reflects both their superior ability to generate cash flow growth and the structural decline in bond yields (Chart I-2). It is easy to understand why superior cash flow growth would result in strong tech performance, but the role of lower yields is not obvious. Tech stocks derive a large proportion of their intrinsic value from long-term deferred earnings and the terminal value of those cash flows. These distant profits are sensitive to fluctuations in the discount rate and, therefore, their present value soars when bond yields fall. The ability of tech to generate expanding earnings remains intact. Companies have curtailed capital expenditures due to the COVID-19 crisis, but they continue to spend on their software and hardware needs (Chart I-3). The growing prevalence of work-from-home arrangements and the proliferation of global cyberattacks (see Section II) will only feed the tech sector’s profit outperformance. Crucially, easy money and low interest rates will endure for an extended period. As Fed Chair Jerome Powell stated, “We are not even thinking about thinking about raising rates.” Our BCA Fed Monitor confirms this message (Chart I-4). Chart I-3Robust Tech Spending
Robust Tech Spending
Robust Tech Spending
Chart I-4Easy Money As Far As The Eye Can See
Easy Money As Far As The Eye Can See
Easy Money As Far As The Eye Can See
Chart I-5Inflation Is The Tech Slayer
Inflation Is The Tech Slayer
Inflation Is The Tech Slayer
Ultimately, much will depend on inflation. As BCA Research’s Equity Sector Strategy service recently demonstrated, the tech sector abhors rising inflation.2 Even during the seemingly unstoppable technology surge in the 1990s, the sector’s outperformance ended following an increase in core CPI (Chart I-5). Tech’s business model is optimized for deflationary conditions, especially when compared with other cyclical industries. Moreover, rising inflation puts upward pressure on interest rates and ultimately requires greater real interest rates to control accelerating CPI increases. Climbing real interest rates disproportionally hurt growth stocks, due to their heightened sensitivity to discount rates. Inflation will stay low as long as the labor market remains far from full employment. The slow progress in employment indicators suggests that the unemployment rate will be above NAIRU for at least two to three years (Chart I-6). Moreover, our Global CPI diffusion Index is also consistent with extended muted inflation (Chart I-7, top panels). The slowdown in money velocity and the weakness in the demand (as approximated by the smoothed growth rate of retail sales relative to average weekly earnings) will only exacerbate low inflation in the coming year or two (Chart I-7, bottom panels). Chart I-6Far From Full Employment
Far From Full Employment
Far From Full Employment
Chart I-7For Now, Disinflation Dominates
For Now, Disinflation Dominates
For Now, Disinflation Dominates
In this context, valuations have room for more expansion. The NASDAQ may be pricey, but it is far from the 1990s’ nosebleed levels when nominal 10-year yields stood at 6.8% compared with today’s 0.55%, and 10-year TIPS yielded 4.3% and not their current -0.9%. In effect, both the equity risk premium and long-term expected growth rates embedded in tech stocks are much more conservative than in the late 1990s. The equity risk premium and long-term expected growth rates embedded in tech stocks are much more conservative than in the late 1990s. Finally, investors have largely missed the rally in stocks, which implies that a large proportion of the gains in tech stocks have not accrued to many investors. Since 2010, companies have been the main buyers of stocks while households and pension plans have constantly sold the asset class (Chart I-8). Additionally, investor sentiment remains firmly bearish and cash holdings of investors and households have surged in the wake of the COVID-19 pandemic (Chart I-9). Thus, there is a lot of pent-up demand for financial assets. TINA (‘there is no alternative’) will invite investors to pour funds into equities with 10-year yields stuck near 0.6% and short rates at zero. Tech stocks will benefit from this trend. Chart I-8Households And Pension Plans Have Divested
Households And Pension Plans Have Divested
Households And Pension Plans Have Divested
Chart I-9Not A Generalized Euphoria...
Not A Generalized Euphoria...
Not A Generalized Euphoria...
Practical Considerations For Investors Bubbles are highly dangerous for investors. A lack of participation in a mania often results in disastrous underperformance for institutional investors, but staying invested in the bubbly asset too long can be even more lethal for a portfolio’s performance. This dichotomy means that as long as there is low inflation and accommodative policy, we cannot underweight or overweight tech stocks. BCA Research’s equity strategists are neutral on tech, but within the sector they overweight the more defensive software and services components relative to the high-beta hardware and equipment industry groups.3 Three potential risks that can crystalize a period of correction in tech stocks over the remainder of 2020. Another risk inherent to bubbles is that they are often volatile; the current tech exuberance will not be different. In the second half of the 1990s, the NASDAQ experienced ten 10% or more corrections and tumbled by more than 20% in 1998 before leaping to new highs. Currently, we monitor three potential risks that can crystalize a period of correction in tech stocks over the remainder of 2020. Risk 1: Tech Earnings Do Not Meet The Hype Chart I-10...But A Localized Euphoria
...But A Localized Euphoria
...But A Localized Euphoria
Today, tech stocks are vulnerable to a sharp pullback because investors are willing to bid up these shares in light of their perceived high growth rate (Chart I-10). This sector-specific euphoria increases the likelihood that if second-quarter tech earnings disappoint, then a significant correction will occur in widely held companies. The stock prices of Microsoft, Netflix and Snapchat have been punished following disappointing Q2 results. Retail investors indirectly amplify the risk created by potential earnings disappointments. Users of free trading apps (e.g.: Robinhood) are the marginal buyers, but more importantly their order flows are sold to large institutional houses who front-run these small players. Large investors with immense buying power can swing the price of the stocks popular with retail investors. Hence, when small investors unload due to bad news, a selling deluge ensues. Risk 2: A Weak Dollar Tech stocks thrive with a strong dollar because it is synonymous with low inflation and low yields. Consequently, a rising USD puts upward pressure on tech multiples. Moreover, a depreciating dollar is linked to robust global growth, which lifts the earnings prospects of other deep cyclical stocks more than tech equities, hurting the latter’s relative performance. The US election also creates a serious risk for tech stocks. The dollar is falling prey to a confluence of factors. The outlook for the US balance-of-payments is deteriorating sharply as the twin deficit explodes higher. Moreover, the national savings rate will remain in a downtrend after 2020 (Chart I-11). The US fiscal deficit will narrow from its current level of at least 18% of GDP, but it will not return for many years to the 4.6% of GDP that prevailed in 2019. The unemployment rate will stay above NAIRU for at least two to three years and the median voter increasingly favors economic populism. These two forces will generate high levels of spending. Meanwhile, a negative nominal output gap will weigh on tax revenues. Concerning private savings, the household savings rate will normalize from its April high of 33% of disposable income because consumer confidence will improve, thanks to strong consumer balance sheets and a limited decline in household net worth (Chart I-12). Chart I-11Vanishing US Savings
Vanishing US Savings
Vanishing US Savings
Chart I-12Household Balance Sheets Are Alright
Household Balance Sheets Are Alright
Household Balance Sheets Are Alright
Chart I-13Forget The Breakup Songs For Now
Forget The Breakup Songs For Now
Forget The Breakup Songs For Now
A poor balance of payments would not be a hurdle for the dollar if US real interest rates were high and foreign investors had confidence in the US economy, but neither of these conditions exists. US real interest rates have fallen relative to the rest of the world and the economic impact of the second wave of COVID-19 infections in the US partly explains the strength in the euro. Moreover, the recently agreed EUR750 billion of common bond issuance by the EU will curtail the probability of a euro breakup, which will compress European risk premia (Chart I-13). This development is highly positive for the euro, which could quickly move toward the 1.20 to 1.25 zone. The global economic recovery amplifies the negative impulse for the dollar. We have often argued that the USD is a countercyclical currency (Chart I-14).4 Hence, the recent uptick in Chinese stimulus and the positive outlook for the global industrial cycle bodes poorly for the US dollar. Moreover, a weak dollar can unleash a feedback loop that supercharges global growth. According to the Bank for International Settlements, foreign issuers have emitted $12-$14 trillion of USD-denominated liabilities. A weak dollar would diminish the cost of servicing this debt and ease global financial conditions, which would boost the world’s economic outlook. The brightening outlook would further feed the dollar’s weakness and underpin its momentum behavior (Chart I-14, bottom panel). Shifting international flows create the last major headwind for the US dollar. Fund repatriation by US economic agents has been a critical driver of the dollar since 2014. The USD rallied in tandem with a surge of repatriation in the wake of the Tax Cuts and Jobs Act of 2017, despite the lack of appetite for US assets by foreigners (Chart I-15). Now that the effect of the tax cuts has passed, repatriations are dwindling from their 2019 peak. Meanwhile, foreign investors’ appetite for dollar assets is not returning, especially as flows into US Treasurys are collapsing (Chart I-15, bottom panel). Chart I-14The Dollar Feedback Loop
The Dollar Feedback Loop
The Dollar Feedback Loop
Chart I-15Flows Are Turning Against The Greenback
Flows Are Turning Against The Greenback
Flows Are Turning Against The Greenback
The dollar’s recent rally runs the risk of a short-term pause. Our USD Capitulation Index is at a level consistent with a short-term rebound (Chart I-16). Nonetheless, the list of dollar-bearish factors noted above suggests that any rebound in the dollar would be temporary. Risk 3: The Election Run-Up The US election also creates a serious risk for tech stocks. President Trump’s approval rating remains in tatters despite the vigorous rebound in equities since March 23 (Chart I-17). His support at this stage of the presidential cycle clearly lags that of previous presidents who were re-elected (Chart I-17, bottom panel). Consequently, our Geopolitical Strategy team assigns a subjective probability of 35% that he will remain in the White House next January.5 This creates two problems for investors. When cornered, President Trump often lashes out at foreign economies, which leads to geopolitical tensions. The heated rhetoric toward China will likely worsen in the coming three months, which raises the prospect of another leg in the US-Sino trade war, with negative effects for tech firms that extract 58% of their revenues from abroad. Furthermore, if former Vice-President Joe Biden clinches the presidency, then the Senate will turn Democrat. The Democrats will likely reverse Trump’s corporate tax cuts, which would hurt all stocks and prompt some liquidation in tech holdings. Chart I-16A Temporary Dollar Bounce Is Likely
A Temporary Dollar Bounce Is Likely
A Temporary Dollar Bounce Is Likely
Chart I-17President Trump"s Disapproval Rating Is A Danger
President Trump"s Disapproval Rating Is A Danger
President Trump"s Disapproval Rating Is A Danger
The tech industry remains an attractive target for populist ire because of its wide profit margins and elevated concentration and market power. During the run-up to November 3rd, investors will be reminded that politicians on both sides of the aisle want to regulate tech. Investors will need to raise the equity risk premium for the sector as these voices get louder. Implications For The Broad Market The strength of the tech sector will be tested in the coming two quarters. Any short-term interruption to the mania prompted by the three aforementioned risks will cause a correction in the S&P 500 because the tech sector (including Google, Amazon, Facebook and Netflix) represents 40% of the index’s market capitalization (Chart I-18). As our equity strategist recently highlighted, without its five largest components (Apple, Microsoft, Amazon, Google and Facebook), the S&P 500 would have increased by only 23% in the past five years instead of its current 54% return. To add color to those numbers, these five tech titans have added $4.8 trillion to the S&P 500 market capitalization versus $3.8 trillion added by the next 495 companies.6 Any short-term interruption to the mania will cause a correction in the S&P 500. Despite this risk, we continue to anticipate that the S&P 500 will find a floor between 2800 and 2900.7 Some crucial factors underpin equities. Global monetary policy remains extraordinarily accommodative, China is stimulating aggressively, Washington will not let a large fiscal cliff destroy the recovery ahead of a presidential election, and the weaker dollar has a reflationary impact on global economic activity. Additionally, we still expect the second wave of COVID-19 to be less deadly than the first and result in much more limited lockdowns compared with March and April. BCA’s neutral stance on tech remains appropriate even after the short-term dynamics discussed above are factored in. The absence of inflationary pressures in the next two years or so and the position of global central banks that they will maintain loose monetary conditions until inflation has overshot a 2% target indicate that conditions persist for an expanding tech mania. Moreover, the dollar’s weakness is unlikely to last more than 12 to 18 months. The US still possesses a higher trend growth rate than the rest of the G-10 and sports a higher neutral rate of interest (Chart I-19). Additionally, China will ultimately rein in its ongoing credit expansion, which will hurt the global industrial cycle. Hence, the deterioration of interest rate differentials between the US and the rest of the world is temporary. Chart I-18The 1% Vs The 99%
The 1% Vs The 99%
The 1% Vs The 99%
Chart I-19The US Still Has Stronger Trend Growth
The US Still Has Stronger Trend Growth
The US Still Has Stronger Trend Growth
The Return Of The Inflation Trade Chart I-20Will Yields Move Up?
Will Yields Move Up?
Will Yields Move Up?
To navigate what will remain a trendless but volatile market until the presidential election, we still favor trades levered to the global economic recovery. Inflation breakeven rates can climb further. The inflation trade is back in fashion, with an increase in gold and commodity prices. The weakness in the dollar and the fall in real interest rates are both reflationary, and they will accelerate the uptick in inflation expectations, especially because global central banks have promised to stay behind the inflation curve as the economy recovers. Mounting inflation expectations will also create some near-term upside risks for nominal bond yields. Since the Global Financial Crisis (GFC), an average of the ISM manufacturing survey and its prices paid component have provided useful early signals for yields. This indicator has turned sharply higher (Chart I-20). Moreover, commercial banks are quickly accumulating securities on their balance sheets, which is creating a lot of liquidity. Banks have been able to increase their book value despite generous loan-loss provisions, therefore, they will be able to transform this liquidity into loans when the economic outlook clears enough to ease credit standards. Bond yields will sniff out this situation ahead of time. Central banks want to maintain loose monetary conditions, but there is a limit to how much additional easing they will tolerate as the economy recovers and fiscal support remains generous. Hence, while inflation breakeven rates can move up, the decline in real yields has reached an advanced stage. In this context, if central banks do not provide further accommodation and inflation expectations go up, then real interest rates will cease to decline and nominal rates will start to drift higher. Silver will continue to outperform gold. While we have been positive on gold and gold stocks since June 2019,8 more recently we have strongly favored silver. Industrial uses constitute a larger share of the demand for silver than that of gold. As a result, the silver-to-gold ratio is highly pro-cyclical. While gold is vulnerable to an increased improvement in economic sentiment (Chart I-21), silver will continue to shine in an environment where inflation expectations increase further and economic activity is recovering. We continue to like global deep cyclical equities relative to defensive ones. We continue to like global deep cyclical equities relative to defensive ones. The pickup in China’s economic activity, as captured by our China Economic Diffusion Index, remains consistent with upside to this trade (Chart I-22). Domestic growth will accelerate further in the second half of 2020 because China’s credit flows continue to increase as a share of GDP, especially when companies have yet to spend the funds borrowed in the second quarter. Additionally, infrastructure spending will continue to expand as local governments have only issued 50% of their annual quota of special bonds (Chart I-22, bottom panel). Chart I-21A Risk For Gold
A Risk For Gold
A Risk For Gold
Chart I-22China Is On The Go
China Is On The Go
China Is On The Go
An outperformance of deep cyclicals relative to defensive equities is also consistent with higher inflation expectations, a rising silver-to-gold ratio and a weaker US dollar (Chart I-23). The near-term outlook also supports buying industrial equities relative to tech stocks. While we have been positive on both materials and industrials, the former has lagged tech. However, our BCA Technical Indicator for US industrial stocks is massively oversold relative to the tech sector (Chart I-24). In light of a declining dollar, rising inflation breakeven rates, strengthening commodity prices and accelerating Chinese credit flows, the probability that industrials outperform tech for three to six months is rapidly escalating. Chart I-23The Inflation Trades
The Inflation Trades
The Inflation Trades
Chart I-24Long Industrials / Short Tech
Long Industrials / Short Tech
Long Industrials / Short Tech
Our relative profits indicator between the industrial and tech sectors is rebounding from depressed readings. The global economic recovery will lift industrials’ revenues more than it will help the tech sector’s income because it will allow weak industrial production levels to improve relative to stable IT spending. Moreover, the industrial wage bill is well contained compared with the tech wage bill. The probability that industrials outperform tech for three to six months is rapidly escalating. Finally, our valuation indicator also favors industrials. Relative to tech stocks, industrial equities are trading at their largest discount since the aftermath of the GFC, suggesting that there is little downside left in this price ratio, at least as long as the dollar is correcting. Mathieu Savary Vice President The Bank Credit Analyst July 30, 2020 Next Report: August 27, 2020 II. Russia And Cyber Security After COVID-19 Dear Clients, This month we offer you a Special Report on Russia and cyber security by our colleague and friend, Elmo Wright. Elmo recently retired from US Army civil service after 43 years working in intelligence, either on active duty, reserves, or as a civilian. From 2018 to 2020, he served as the senior civilian executive at the US Army National Ground Intelligence Center. He has served on five continents and provided analysis of the most pressing global trends in national security and intelligence. In this Special Report with BCA’s Geopolitical Strategy team, Elmo analyzes Russia’s cyber capabilities and argues that structural and cyclical factors, including COVID-19, will ensure the continued salience of Russian and global cyber security challenges in the coming years. His thesis reinforces our recommendation that investors buy cyber security equities. Elmo’s work for this report is in his personal capacity and does not represent any position of the US government. Only publicly available information was used as background research material for Elmo’s contribution to the report. All very best, Matt Gertken Vice President Geopolitical Strategy Mathieu Savary Vice President The Bank Credit Analyst As the US elections come closer, there will be a return to news about Russia and its potential interference via social media. Russia will continue to use cyber, both state sponsored attacks, and in coordination with criminal groups, to advance Russian national security objectives. In contrast to nuclear doctrine, there is no commonly accepted framework for cyber warfare between Russia and other nations that provides understandable signals for escalation, de-escalation, appropriate targets, or goals. US efforts to conduct military operations against Russia or China would likely be countered by Russian or Chinese cyber operations before any physical military operations could be initiated. Cyber security stocks offer a way for investors to capitalize on our long-term themes of nationalism, multipolarity, and de-globalization. The ISE Cyber Security Index offers value relative to the broad NASDAQ and S&P 500 indexes as well as the S&P tech sector. Chart II-1Russian Cyber Interference Resurfaces Around US Elections
Russian Cyber Interference Resurfaces Around US Elections
Russian Cyber Interference Resurfaces Around US Elections
As the national elections in the US come closer, there will be a return to news about Russia and its potential interference via social media. Indeed Russia is making headlines even as we go to press. This report aims to provide context for Russian cyber capabilities in general as a contributor to overall geopolitical instability (Chart II-1). We forecast Russia will continue to use cyber, both state sponsored attacks, and in coordination with criminal groups, to advance Russian national security objectives. As background, the word cyber is commonly accepted to be derived from cybernetics, a phrase attributed to Norbert Wiener, an MIT scientist. The phrase itself is related to the ancient Greek word for steering or helmsman, in other words, control. Chart II-2Russian Excellence In Math Makes It Competitive In Cybernetics
August 2020
August 2020
Russia has a long history of excellence in science, especially theoretical work in mathematics and physics (Chart II-2). Those fields can explain natural phenomena in formulas and mathematical relationships. The Soviets believed that centralized state planning that manipulated data in formulas could lead to better outcomes in all aspects of the society. Although central state economic planning did not work out for the Soviet economy, Soviet military science built on the concept of data relationships in formulas to develop its theory of troop control, a derivative of reflexive control, that is, the presenting of data to the recipient, either friendly or enemy, in order to get that recipient to act in a way favorable to Soviet military plans. One can see the Soviets embraced the idea of cybernetics as very congruent to their desire for top down control. Russia, as the core part of the Soviet Union, retained significant numbers of scientists and mathematicians who were naturally drawn to the ability of computers to take data and manipulate that data according to formulas. Other Russian scientists and mathematicians emigrated to the West where their expertise was rewarded in the rise in the use of computers to manipulate data. Over time, the term cyber has come to be associated with many aspects of computers, especially the intellectual and physical structures hidden behind the direct interface of a person with a keyboard and screen. Russian expertise in the use of computers to do cyber work was not limited to working for the State. As the Soviet Union broke apart and many people lost their jobs working for the State, there were those persons who took their talents to criminal ventures. And in the symbiotic nature of society in Russia, many of those who went into criminal ventures were former intelligence and security personnel who could maintain their connection to the official organizations that were successors to the KGB, the GRU, and others. Russia is the source of the most sophisticated cyber threats to the US. Senior Russian military officials, such as General Valery Gerasimov, Chief of the General Staff of the Russian Federation armed forces, equivalent to the US Chairman of the Joint Chiefs of Staff, have noted the growth of nonmilitary means of achieving strategic goals, and specifically in the information space. Gerasimov, in an article in 2013, has been widely quoted that all elements of national power have to be harnessed, including cyber capabilities. One Soviet and Russian military concept that relates to the information space is maskirovka, the use of camouflage, deception, and disinformation to confuse the enemy. Maskirovka is intimately connected with the Soviet/Russian concept of “active measures”. Active measures include actions taken generally by intelligence services to provide propaganda, false information, and otherwise sow discord and confusion among the enemy ranks at all levels of war as well as in the political, economic, and social spheres. In today’s time period, cyber, especially social media, offers the opportunity for the wide spread of aspects of maskirovka and active measures to all users, as well as targeted groups (Chart II-3). Reporting indicates a continued Russian emphasis on cyber as a means for active measures concealed by maskirovka. Chart II-3Social Media Offers Russia An Opportunity For The Spread Of Maskirovka
August 2020
August 2020
Wikileaks has provided a platform for the dissemination of information normally hidden from the general public. It is noteworthy how much of the information on the Wikileaks platform relates to the US and the West, and relatively little on Russia. Possible factors that explain that characteristic include the disparity in penalties for disclosing information between the US and the West versus Russia; the greater number of journalists and other persons involved in the media, both for profit and personal reasons, in the West; and the language barriers involved in understanding Russian versus English. A final possible factor in Wikileaks greater dissemination of Western information might be an aspect of active measures undertaken by Russia. There are numerous actions attributed to Russian state actors in the cyber field in the recent past (Table II-1). They include a distributed denial of service attack on Estonia (2007); hacking the Ministry of Defense in the country of Georgia during a military conflict (2008); attacks on Ukrainian energy infrastructure (2015); and the hacking of the Democratic National Committee (2016). Chancellor Angela Merkel recently publicly named and shamed Russia for a cyber-attack on Germany circa 2015 (Appendix). Table II-1Russian State Actors Responsible For Many Of This Year’s Cyber Attacks
August 2020
August 2020
Chart II-4Russian Use Of Cyber Is A Top Threat To The US
August 2020
August 2020
Senior US officials have cited Russia as the source of the most sophisticated cyber threats to the US, both for espionage and state sponsored attacks against US national security capabilities such as energy, transportation, and telecommunications infrastructure; as well as for criminal activity such as ransom ware and identity theft. Russian use of cyber, both state sponsored and sponsoring criminal actors, has been the top threat to the US in each of the US intelligence community’s annual threat assessments for 2017, 2018, and 2019 (Chart II-4). Although the 2020 annual threat assessment was not made public in Congressional testimony, there’s little reason to suspect that Russian use of cyber would not continue to be cited as the top threat. Other nation states have state sponsored cyber capabilities which are of national security concern to the US, including China, Iran, and North Korea. These nation states are called out in the US intelligence community Annual Threat Assessments. Each of these nation states has been identified as committing intelligence and economic cyber attacks against the US and other Western nations. The recent speech by the Director of the Federal Bureau of Investigation designates China as the top threat. Given the nature of the internet, the pathway of a cyber attack will likely bounce around multiple countries before reaching its intended target. As the Director notes, forensic identification of the source of a cyber attack takes time and expertise. However, there is a clear record of specifically identifying the state sponsored entity that commits attacks on US or Western government information technology and infrastructure. More likely than confusing one state sponsored cyber actor from one country to another would be the potential blending of criminal elements across national boundaries. In this case, cyber criminal elements with Russian backgrounds or connections are clearly the most capable. Cyber-crime is rising despite deterrence. The stages of cyber conflict include reconnaissance, penetration, mapping, exfiltration, and operations. The US National Security Agency has an extensive technical cyber threat framework which goes into much detail. Cyber security professionals note the ongoing actions in cyber space and the attempts by elements suspected to be linked to Russia to gain and maintain access to US networks for potential military operations, or to exfiltrate data for criminal or other purposes. Part of the frustration of cyber security experts is the lack of transparency and timely reporting of those affected by malign cyber activities. Although some cyber activities may go on for multiple months, the exfiltration of data, or the emplacement of malware may only take a few seconds. Many networks lack the ability to detect penetration and mapping. Companies with large resources devoted to cyber security may have that investment negated if they have affiliations with other companies with lax cyber security which can allow for hostile intrusions into the connected network. Chart II-5Unlike Nuclear Doctrine, Cyber Lacks A Framework To Control Escalation
August 2020
August 2020
Unfortunately, public and open attribution for cyber attacks has lagged. As an example, although the attack on the Democratic National Committee email servers was noted in 2016, it was not until 2018 that specific Russian individuals were charged with the crime. Factors that cause lags in public and open attribution include the difficulty of tracing specific computer code through cyberspace; the disjointed nature of the internet; the lack of an easy and accepted mechanism for involvement of US intelligence agencies in providing assistance to private sector parties; and the reticence of individuals and organizations negatively affected by cyber attacks to publicly disclose their injuries. Doctrine for the use of nuclear weapons developed over a period of years in the US and the West and in the Soviet bloc. The Soviets developed a coherent doctrine for the use of nuclear weapons that was understandable to the West. Arms control agreements between nuclear powers established mechanisms for controlling escalation of tensions (Chart II-5). The Soviet doctrine was adopted by the Russians after the breakup of the Soviet Union. Russia and Western nations continue to have a common understanding of the role of nuclear weapons in military affairs that allows for discussion of escalation and de-escalation. In contrast to nuclear doctrine, there is no commonly accepted framework for cyber warfare between Russia and other nations that provides understandable signals for escalation, de-escalation, appropriate targets, or goals. This is reflected in the Russian information security doctrine of 2016 which notes “The absence of international legal norms regulating inter-State relations in the information space…” The US Director of National Intelligence also noted this lack of agreement in his annual threat assessment testimony of 2017. Chart II-6Rapid Growth Of Internet Raises Vulnerability To Harmful Actions
August 2020
August 2020
The rapid growth of the internet, and reliance on it by government and private sectors reflects its founding as an open system, vulnerable to negative actors and actions (Chart II-6). The intermingling of hardware and software, the information infrastructure used both by individuals and states, by the private sector and by government, makes separating doctrine and practice for cyberwar from legitimate use very difficult. Since non-cyber military capabilities, both conventional, and nuclear, rely upon the use of commercial information technology infrastructure, the use of offensive cyber is subject to the problem of blowback. As the NotPetya incident of 2018 indicated, damage from malware installed on one computer can rapidly spread across networks, industries, and international boundaries. The code for StuxNet and the code released by the more recent hack of CIA cyber tools have been noted in other cases of cyber attacks. The view of the international cyber environment by Russia is very similar to views in the US and the West. The Russian national security doctrine of 2015 notes “... An entire spectrum of political, financial-economic, and informational instruments have been set in motion in the struggle for influence in the international arena. Increasingly active use is being made of special services' potential … The intensifying confrontation in the global information arena caused by some countries' aspiration to utilize informational and communication technologies to achieve their geopolitical objectives, including by manipulating public awareness and falsifying history, is exerting an increasing influence on the nature of the international situation.” Although much of the Russian information security doctrine of 2016 is concerned with noting threats to Russia’s information space, what might be called counterintelligence in other documents, there are key comments that note the suitability of using attacks in the information space as an effective means of projecting Russian power, such as “… improving information support activities to implement the State policy of the Russian Federation …” As per usual Soviet and Russian state doctrinal documents, the 2016 doctrine notes all the negative activity of other actors in this field. This practice is consistent with historical Soviet and Russian open press documents which ascribe to other states the activities in which Russia engages or plans to engage. Chart II-7Cyber Attacks Are On The Rise
August 2020
August 2020
Unlike other forms of national security alliances, such as for intelligence, there is little public literature on cyber alliances, especially for offensive action. For example, the US and Israel have never publicly acknowledged a government alliance to emplace the StuxNet virus into the Iranian nuclear development program. Should there be offensive cyber alliances in the West, it is likely they fall along traditional intelligence and defense lines. There is no public reporting on any sort of offensive cyber alliances that involve Russia. There are public efforts at common standards for information technology security, but these efforts are foundering on citizen and government concerns over privacy, as well as commercial proprietary advantage. It is an open question as to whether cyber alliances among friendly nations would deter would-be cyber attackers or hackers. Certainly the growth of complaints to the FBI’s Internet Crime Complaint Center would indicate that statements of deterrence and even prosecutions are failing to reduce cyber attacks (Chart II-7). Both the US national intelligence community and private sector cybersecurity companies agree Russia has a sophisticated state sponsored effort to acquire intelligence via hacking and insert favorable themes into cyberspace via the use of social media. There is also agreement that Russia state elements have a close relationship with criminal elements which can provide a plausibly deniable means of engaging in cyber warfare activities favorable to Russia, as well as engaging in activities for illegal economic advantage. For example, see this quote from the CYBEREASON Intel team: “The crossing of official state sponsored hacking with cybercriminal outfits has created a specter of Russian state hacking that is far larger than their actual program. This hybridization of tools, actors, and missions has created one of the most potent and ill-defined advanced threats that the cybersecurity community faces. It has also created the most technically advanced and bold cybercriminal community in the world. When, as a criminal, your patronage is the internal security service that is charged with tracking and arresting cybercrime, your only concern becomes staying within their defined bounds of acceptable risk and not what global norms, laws, or even domestic Russian law states.” The US Department of Justice in June 2020 noted a Russian national was sentenced to prison for malicious cyber activities. Key points of his illegal activity were the operation of websites open only to Russian speakers, and the vetting or recommendation of other criminals before allowing entry to the websites. One analysis of this situation notes the ties to Russian state security organs and personnel which likely held up the Russian national’s extradition for trial in the US. Government leaders in the US have noted the potential for major cyber attacks in the US affecting physical infrastructure and causing significant economic and social damage, including further attacks on the political election process. However, they have been reticent to state any explicit sort of retaliation. The US Cyber Command notes it is actively combatting hostile cyber actors. Therefore, the question remains open as to what level of cyber attacks would be considered serious enough to be treated as an act of war by the US. There has been public speculation of both Russian and Chinese implants of malware into the US information technology infrastructure that might be activated in the case of open hostilities. US efforts to conduct military operations against Russia or China would likely be countered by Russian or Chinese cyber operations before any physical military operations could be initiated, especially since US based forces would have to transit oceans, taking many days, when cyber operations could happen in seconds. China, Russia, and Iran will also increasingly become victims of cyber attacks. Russian “gray zone” tactics, that is, actions short of large scale conventional war, many of which involve cyber attacks, active measures, and maskirovka, are the subject of much Department of Defense planning and action. To combat such gray zone activity analysis from the RAND Corporation notes the need for a spectrum of diplomatic, informational, military, and economic actions, which would involve commercial partners and allied nations. The difficulty of coordinating such counter action is one reason the Russians continue their gray zone efforts. Russia’s unique characteristics, some of which are weaknesses compared to the US and the West, are indicative of why Russia engages in state sponsored as well as criminal cyber activities (Chart II-8). Russian scientific history, the intertwining of state and criminal elements, and continent-spanning location are factors which promote the use of cyber. Russia’s economic position vis-à-vis the US, Russia’s relative lack of military power projection capability beyond the states on its borders (the Near Abroad), except for its nuclear forces, and Russia’s declining demographic situation are negative factors which push Russia to use cyber as a cost effective means of advancing national security and economic policy (Chart II-9). Despite US and Western imposed sanctions on Russia for past misdeeds, none of the factors noted above will be changed in the near future. Therefore, those factors, and published Russian doctrine should indicate to Western governments and businesses that Russia will continue to use cyber as a means to advance Russian national security objectives, as well as a means to siphoning off wealth from the West via criminal activities. Chart II-8Russia's Relative Weakness Drives Engagement In Cyber Activities
Russia's Relative Weakness Drives Engagement In Cyber Activities
Russia's Relative Weakness Drives Engagement In Cyber Activities
Chart II-9Deteriorating Demographics Also Drive Russia’s Cyber Activities
August 2020
August 2020
US preparedness for Russian cyber activity in the upcoming months should be greater given several factors. First, there is clearly awareness of a Russian cyber threat to US interests across government and in the private sector. Second, the US has established new organizations, shifted resources of money and people, and had practice defending against cyber attacks since the 2016 US election cycle. However, the US information technology infrastructure is vast and porous, making it hard to protect against every threat. Russian cyber actors, both state sponsored and criminal, are smart and persistent. Investment Takeaways Cyber security companies offer a way for investors to capitalize on major themes arising from the COVID-19 crisis and its aftermath. These themes include not only changes in worker behavior, e-commerce, corporate culture, and network security, but also our major geopolitical themes like nationalism and the retreat from globalization. Reports as we go to press that Russian hackers have targeted vaccine developers in the US, UK, and Canada underscore the point. The trend is not limited to Russia or COVID-19 vaccines. It is all too apparent from the actions of Russia and China – as well as the increasing efforts by the US and its allies to patrol their own cyber realms, IT systems, and ideological discourse – that governments view the Internet as a frontier to be conquered and fortified rather than as a free space of human exchange in which globalization can operate unfettered (Map II-1). Map II-1Governments View The Internet As A Frontier To Be Conquered
August 2020
August 2020
Formal measures of country risk are inadequate but provide some perspective as to which countries and companies are least prepared. The International Telecommunication Union (ITU) is the United Nations body charged with monitoring information technology and communications. It ranks countries according to their commitment to cyber security and their exposure to cyber security risks (Chart II-10). Chart II-10Countries Have An Imperative To Strengthen Cyber Security
August 2020
August 2020
We take these rankings with a grain of salt knowing that advanced countries like the US and UK rank near the top of the list, and yet are the prime targets of hackers and thus face enormous cyber security risks. What is clear is that no country is safe and every country has an economic and national security imperative to strengthen its cyber security. These indexes also suggest that several European countries are less well prepared than one would think and that emerging markets are grossly underprepared. China, Russia and Iran should not be thought of only as aggressors – they will increasingly become targets as the West seeks to counteract them. As Russia expands operations it becomes a target of cyber counter-strikes as well as economic sanctions. And as China accelerates its drive to become a high tech giant, it encourages economic decoupling from the West and retaliation for its use of cyber-theft and state-based hacking. There are two main cyber security equity indexes – the NASDAQ CTA Cybersecurity Index (NQCYBR) and NASDAQ ISE Cyber Security Index (HXR). These indexes trade in line with each other and have rallied extensively since the COVID-19 crisis (Chart II-11). Investors are aware that the surge in working from home and companies conducting operations off-site, as well as geopolitical great power struggle, have created extensive new vulnerabilities and capex requirements. On April 24, we recommended that investors go long the ISE index relative to the S&P 500 information technology sector. We are also going long the ISE index relative to the NASDAQ on a strategic horizon. Tech has been the prime beneficiary of the COVID-19 crisis while the necessary corollary of the tech companies’ continued success is the need for security of their information, property, and customers (Chart II-12). We also favor the ISE index because it has a slightly heavier cyclical component due to the fact that 13% of its companies are in the industrial sector, compared to 10% for the CTA index. The industrial side should benefit more as economies reopen and recover. Chart II-11Cyber Security Stocks Have Benefited From COVID-19 ...
Cyber Security Stocks Have Benefited From COVID-19 ...
Cyber Security Stocks Have Benefited From COVID-19 ...
Chart II-12... But Not So Much Relative To Broad Tech Sector
... But Not So Much Relative To Broad Tech Sector
... But Not So Much Relative To Broad Tech Sector
These indexes are tracked by two ETFs. The First Trust NASDAQ Cybersecurity ETF (CIBR) tracks the NASDAQ CTA index with an emphasis on larger companies, while the ETFMG Prime Cyber Security ETF (HACK) tracks the ISE index, companies with market capitalization lower than $250 million, and a slightly lower exposure to the communications sector as opposed to IT and software. The HACK ETF has lagged the CIBR this year so far and offers an opportunity for investors to invest in data protection and up-and-coming firms. Over the past ten years cyber security has proven to be a volatile investment space with rapidly increasing competition for market share. But the secular tailwinds are powerful and a diversified exposure to the sector will be rewarding for investors positioning for the post-COVID-19 world. Elmo Wright Consulting Editor Matt Gertken Vice President Geopolitical Strategy mattg@bcaresearch.com Appendix Appendix Table II-1Major Cyber-Attacks Over The Past Decade
August 2020
August 2020
Works Cited Coats, Dan. “Statement For The Record Worldwide Threat Assessment Of The Us Intelligence Community,” May 23, 2017. Coats, Dan. “Statement For The Record Worldwide Threat Assessment Of The Us Intelligence Community,” March 6, 2018. Coats, Dan. “Annual Threat Assessment Opening Statement,” January 29, 2019. CyberReason Intel Team, “Russia And Nation-State Hacking Tactics: A Report From Cybereason Intelligence Group,” cybereason.com, June 5, 2017. Department of Justice, “Russian National Sentenced To Prison For Operating Websites Devoted To Fraud And Malicious Cyber Activities”, June 26, 2020. Department of Justice, “U.S. Charges Russian FSB Officers And Their Criminal Conspirators For Hacking Yahoo And Millions Of Email Accounts, Fsb Officers Protected, Directed, Facilitated And Paid Criminal Hackers”, March 15, 2017. Gerasimov, Vasily. “The Value Of Science In Prediction,” Military Industrial Courier, Feb 27, 2013. Federal Bureau of Investigation, “Internet Crime Complaint Center Marks 20 Years From Early Frauds to Sophisticated Schemes, IC3 Has Tracked the Evolution of Online Crime,” May 8, 2020. Fedorov, Yuriy Ye. “Arms Control In The Information Age” Symposium “Emerging Challenges In The Information Age,” 23 January 2002, Arlington, Virginia. Galeotti, Mark. “The ‘Gerasimov Doctrine’ And Russian Non-Linear War,” In Moscow’s Shadows, July 6, 2014. Greenberg, Andy. “The Untold Story Of Notpetya, The Most Devastating Cyberattack In History,” Wired Magazine, August 22, 2018. Krebs, Brian. “Why Were the Russians So Set Against This Hacker Being Extradited?,” Krebs on Security, Nov 18, 2019. Lusthaus, Jonathan. “Cybercrime in Southeast Asia Combating a global threat locally,” May 20, 2020. Mattis, James. Department of Defense, “Summary Of The 2018 National Defense Strategy Of The United States Of America”. Meakins, Joss. “Living in (Digital) Denial: Russia’s Approach To Cyber Deterrence,” Russia Matters, July 2018. Ministry of Foreign Affairs of the Russian Federation. “Doctrine Of Information Security Of The Russian Federation,” Dec 5, 2016. Nakasone, Paul. “Cybercom Commander Briefs Reporters At White House,” Department of Defense video briefing, Aug 2, 2018. National Security Agency, “NSA/CSS Technical Cyber Threat Framework V2”, a report from: Cybersecurity Operations The Cybersecurity Products And Sharing Division, 29 November 2018. Pettijohn and Wasser. “Competing In The Gray Zone,” RAND Corporation, 2019. Putin, Vladimir. “Strategy of National Security of the Russian Federation,” Office of the President of the Russian Federation, Dec 31, 2015. Russian National Security Strategy 31 Dec 2015, Russia Matters. Snegovaya, Maria. “Putin’s Information Warfare In Ukraine: Soviet Origins Of Russia's Hybrid Warfare,” Institute for the Study of War, Sep 22, 2015. Tsygichko, V. N. “About Categories of “Correlation Of Forces” for Potential Military Conflicts in the New Era,” Symposium “Emerging Challenges In The Information Age,” 23 January 2002, Arlington, Virginia. Wiener, Norbert, Cybernetics: Or Control and Communication in the Animal and the Machine. Cambridge, Massachusetts: MIT Press, (1948). III. Indicators And Reference Charts We continue to favor stocks at the expense of bonds, but the risk of a tech-led correction has only grown. Moreover, the number of new COVID-19 cases in the US remains elevated and similarly disturbing trends are beginning to take shape in Europe. The recovery could hit a temporary pothole. Finally, as the November election approaches, political and geopolitical risks will come back on investors’ radar screens. Nonetheless, global monetary conditions remain highly accommodative and the risk of inflation in the short-term is minimal. Also, fiscal policy is extremely loose, and despite some procrastination, Congress will pass another large package by August 10, which will protect the economy against a violent relapse. Hence, the worst outcome over the coming three to five months is for the S&P 500 to retest of the 2800-2900 zone. On a cyclical basis, the same indicators that made us willing buyers of stocks since late March remain broadly in place. Stocks are expensive, but monetary conditions are extremely accommodative. Our Speculation Indicator continues to send a benign signal, which indicates that from a cyclical perspective, the market is not especially vulnerable. Finally, our Revealed Preference Indicator continues to flash a strong buy signal. Tactical indicators suggest that equities must digest the gains made since March 23. Both our Tactical Strength Indicator and the share of NYSE stocks trading above their 10-week moving average are elevated. Additionally, positioning in the derivatives market indicates some degree of vulnerability. Nonetheless, these risks must be put into perspective. Our Composite Sentiment Indicator is not flagging a top in the market and the AAII survey shows a predominance of bears over bulls. As a result, any correction should be limited to 10%. According to our Bond Valuation Index, Treasurys remain extremely expensive. Additionally, our Composite Technical Indicator continues to lose momentum. Guided by the FOMC’s communications, the market has decided that the recovery will lift inflation but that the Fed will stand pat. Consequently, yields are not moving up, but real rates are declining as inflation expectations inch higher. This trend is likely to be at a late stage, and the passage of additional fiscal support as well as a weak dollar will put a floor under real yields. In this context, Treasury yields should begin to rise in the closing months of 2020. The dollar breakdown has now fully taken shape. The greenback is expensive and its counter-cyclicality is a major handicap during a global economic recovery. Additionally, the US twin deficits are increasingly problematic. Fiscal deficits remain exceptionally wide and the household savings rate will not remain as elevated as it is today. The current account deficit is therefore bound to widen. The continued low level of real interest rates will complicate financing this deficit and to equilibrate the funding of US liabilities, the dollar will depreciate. Technically, our Composite Technical Indicator for the dollar has also broken down, which warns that a period of cyclical weakness has begun for the greenback. Nonetheless, our Dollar Capitulation Index is now in oversold territory, and a countertrend bounce is very likely in the coming weeks. Commodities are gaining traction. The Advance / Decline line for the Continuous Commodity Index has broken out to the upside, which suggests that the CCI could punch above its pre-COVID levels by yearend. A weak dollar, low real yields and a global industrial recovery are highly positive for natural resource prices. Within that asset class, gold has made new all-time highs. Gold is especially sensitive to lower real rates and a weak dollar. Sentiment and positioning for the yellow metal are stretched. Any rebound in economic sentiment could push real rates higher, which would cause gold to correct meaningfully in the near future, even if it remains in a cyclical uptrend. A dollar rebound is another tactical risk for gold. EQUITIES: Chart III-1US Equity Indicators
US Equity Indicators
US Equity Indicators
Chart III-2Willingness To Pay For Risk
Willingness To Pay For Risk
Willingness To Pay For Risk
Chart III-3US Equity Sentiment Indicators
US Equity Sentiment Indicators
US Equity Sentiment Indicators
Chart III-4Revealed Preference Indicator
Revealed Preference Indicator
Revealed Preference Indicator
Chart III-5US Stock Market Valuation
US Stock Market Valuation
US Stock Market Valuation
Chart III-6US Earnings
US Earnings
US Earnings
Chart III-7Global Stock Market And Earnings: Relative Performance
Global Stock Market And Earnings: Relative Performance
Global Stock Market And Earnings: Relative Performance
Chart III-8Global Stock Market And Earnings: Relative Performance
Global Stock Market And Earnings: Relative Performance
Global Stock Market And Earnings: Relative Performance
FIXED INCOME: Chart III-9US Treasurys And Valuations
US Treasurys And Valuations
US Treasurys And Valuations
Chart III-10Yield Curve Slopes
Yield Curve Slopes
Yield Curve Slopes
Chart III-11Selected US Bond Yields
Selected US Bond Yields
Selected US Bond Yields
Chart III-1210-Year Treasury Yield Components
10-Year Treasury Yield Components
10-Year Treasury Yield Components
Chart III-13US Corporate Bonds And Health Monitor
US Corporate Bonds And Health Monitor
US Corporate Bonds And Health Monitor
Chart III-14Global Bonds: Developed Markets
Global Bonds: Developed Markets
Global Bonds: Developed Markets
Chart III-15Global Bonds: Emerging Markets
Global Bonds: Emerging Markets
Global Bonds: Emerging Markets
CURRENCIES: Chart III-16US Dollar And PPP
US Dollar And PPP
US Dollar And PPP
Chart III-17US Dollar And Indicator
US Dollar And Indicator
US Dollar And Indicator
Chart III-18US Dollar Fundamentals
US Dollar Fundamentals
US Dollar Fundamentals
Chart III-19Japanese Yen Technicals
Japanese Yen Technicals
Japanese Yen Technicals
Chart III-20Euro Technicals
Euro Technicals
Euro Technicals
Chart III-21Euro/Yen Technicals
Euro/Yen Technicals
Euro/Yen Technicals
Chart III-22Euro/Pound Technicals
Euro/Pound Technicals
Euro/Pound Technicals
COMMODITIES: Chart III-23Broad Commodity Indicators
Broad Commodity Indicators
Broad Commodity Indicators
Chart III-24Commodity Prices
Commodity Prices
Commodity Prices
Chart III-25Commodity Prices
Commodity Prices
Commodity Prices
Chart III-26Commodity Sentiment
Commodity Sentiment
Commodity Sentiment
Chart III-27Speculative Positioning
Speculative Positioning
Speculative Positioning
ECONOMY: Chart III-28US And Global Macro Backdrop
US And Global Macro Backdrop
US And Global Macro Backdrop
Chart III-29US Macro Snapshot
US Macro Snapshot
US Macro Snapshot
Chart III-30US Growth Outlook
US Growth Outlook
US Growth Outlook
Chart III-31US Cyclical Spending
US Cyclical Spending
US Cyclical Spending
Chart III-32US Labor Market
US Labor Market
US Labor Market
Chart III-33US Consumption
US Consumption
US Consumption
Chart III-34US Housing
US Housing
US Housing
Chart III-35US Debt And Deleveraging
US Debt And Deleveraging
US Debt And Deleveraging
Chart III-36US Financial Conditions
US Financial Conditions
US Financial Conditions
Chart III-37Global Economic Snapshot: Europe
Global Economic Snapshot: Europe
Global Economic Snapshot: Europe
Chart III-38Global Economic Snapshot: China
Global Economic Snapshot: China
Global Economic Snapshot: China
Mathieu Savary Vice President The Bank Credit Analyst Footnotes 1 Please see Emerging Markets Strategy Weekly Report "EM Equities: Concentration And Mania Risks," dated July 16, 2020, available at ems.bcaresearch.com 2 Please see US Equity Strategy Special Report "Revisiting Equity Sector Winners And Losers When Inflation Climbs," dated June 1, 2020, available at uses.bcaresearch.com 3 Please see US Equity Strategy Special Report “US Dollar Bear Market: What To Buy & What To Sell," dated June 22, 2020, available at uses.bcaresearch.com 4 Please see The Bank Credit Analyst Monthly Report “January 2020," dated December 20, 2019, available at bca.bcaresearch.com 5 Please see Geopolitical Strategy Special Report "What Is The Risk Of A Contested US Election?," dated July 27, 2020, available at gps.bcaresearch.com 6 Please see US Equity Strategy Insight Report "S&P 5 Versus S&P 495," dated July 23, 2020, available at uses.bcaresearch.com 7 Please see The Bank Credit Analyst Monthly Report "July 2020," dated June 25, 2020, available at bca.bcaresearch.com 8 Please see The Bank Credit Analyst Monthly Report "June 2019," dated May 30, 2019, available at bca.bcaresearch.com