Technology

Highlights Social distancing makes it impossible to do jobs that require close personal interaction, yet these are the very job sectors that have kept jobs growth alive in recent decades. If social distancing persists, then AI will penetrate these job sectors too. Aggregate wage inflation is set to collapse – not just temporarily, but structurally. Structurally overweight US T-bonds versus the core European bonds in Germany, France, Netherlands, Switzerland and Sweden. Structurally overweight big technology, structurally underweight banks. Structurally overweight S&P 500 versus Euro Stoxx 50. Fractal trade: long Australian 30-year bond versus US 30-year T-bond. Feature Social distancing will feature large in our lives for the foreseeable future, and it carries a profound consequence. Social distancing really means physical distancing. And physical distancing diminishes the ways that we can interact with other humans – through the qualities of empathy, sympathy, the ability to recognise and respond to emotional cues, and to express ourselves through complex movements. You cannot hug someone on Facetime. Social distancing makes it impossible to do jobs that require close personal interaction. From an economic perspective, social distancing makes it impossible to do jobs that require close personal interaction. It follows that in the recent bloodbath of job losses, the biggest casualties have been in employment sectors that rely on this close personal interaction: food services and drinking places (waitresses, bartenders, and baristas), ambulatory healthcare services, hotels, and social assistance (Table I-1). Table I-1Social Distancing Is Destroying Jobs That Require Close Personal Interaction
Social Distancing Is Good For Robots, Bad For Humans
Social Distancing Is Good For Robots, Bad For Humans
A profound consequence arises because these are the very sectors that have kept jobs growth alive in recent decades (Table I-2). Millions of new jobs that rely on close personal interaction have more than offset the structural job destruction in manufacturing and finance. As well as being export-proof, jobs that require this close personal interaction have been ‘artificial intelligence (AI) proof’. That is, until now. Table I-2Jobs That Require Close Personal Interaction Have Been The Engine Of Jobs Growth
Social Distancing Is Good For Robots, Bad For Humans
Social Distancing Is Good For Robots, Bad For Humans
One UK doctor told the New York Times “we’re basically witnessing 10 years of change in one week”. Before the virus, online consultations made up only 1 percent of doctors’ appointments. But now, three in four UK patients are seeing their doctor remotely. Moravec’s Paradox + Social Distancing = A Very Tough Jobs Market Regular readers will know that one of our mega-themes is the far-reaching societal and economic implications of Moravec’s Paradox. Named after the professor of robotics, Hans Moravec, the paradox points out that: For AI the hard things are easy, but the easy things are hard. By the hard things, we mean things that require ‘narrow-frame pattern recognition’ within a defined body of knowledge. For example, playing chess, translating languages, diagnosing medical conditions, and analysing legal problems. We find these tasks hard, but AI finds them effortless. By the easy things, we mean our social skills: empathy, sympathy, the ability to recognise and respond to emotional cues, and to express ourselves through complex movements. To us, all these things are second nature, but AI finds them very hard to replicate. The reason, it turns out, is that the higher brain that enables us to learn and play chess and solve similar abstract problems evolved relatively recently. Whereas the ancient lower brain that enables complex movement and the associated giving and receiving of emotional signals took much longer to evolve. As AI is just reverse engineering the human brain, AI has found it easy to replicate the less-evolved higher brain functions, but very difficult to replicate the skills that emanate from the deeply evolved lower brain. Millions of new jobs that rely on close personal interaction have more than offset the structural job destruction in manufacturing and finance. The far-reaching societal and economic implication is that we have misunderstood and mispriced what is difficult and what is easy. By reverse engineering the brain, AI is correcting this mispricing. So far, AI has been most disruptive to high-paying jobs requiring abstract problem-solving skills, such as in finance. AI has been less disruptive to jobs requiring close personal interaction (Table I-3). But if social distancing persists, then AI will disrupt those jobs too, especially during a recession. Table I-3New Jobs That Require Close Personal Interaction Have Offset Lost Jobs In Manufacturing And Finance
Social Distancing Is Good For Robots, Bad For Humans
Social Distancing Is Good For Robots, Bad For Humans
Labour Market Disruption Intensifies During A Recession To paraphrase Ernest Hemingway, industries adopt labour-saving technologies gradually then suddenly. And the suddenly tends to be during a recession. This is because once an industry has already shed many workers, it is easier to restructure the industry with a new labour-saving technology that reduces labour input permanently. At the start of the Great Depression a substantial part of the US automobile industry was still based on skilled craftsmanship. These smaller, less productive craft-production plants were the ones that shut down permanently, while plants that had adopted labour-saving mass production had the competitive advantage that enabled them to survive. The result was a major restructuring of the auto productive structure. Likewise, until the late 1990s, the ‘typing pool’ was a ubiquitous feature of the office environment. But once the 2000 downturn arrived, these typing jobs became extinct to be replaced by the wholesale roll-out of Microsoft Word. After the 2008-09 recession, UK economic power became focussed in a few large firms that could access the finance to ensure their survival. As small firms went by the wayside, job growth came disproportionately from self-employment and the ‘gig economy’. In this case, the labour market disruption hurt productivity as an army of freelancers ended up doing their own sales, marketing and accounts in which they had no specialism (Chart I-1 and Chart I-2). Chart I-1The 1990s UK Recovery Produced No Increase In Self-Employment...
The 1990s UK Recovery Produced No Increase In Self-Employment...
The 1990s UK Recovery Produced No Increase In Self-Employment...
Chart I-2...But The 2010s UK Recovery Produced A Huge Increase In Self-Employment
...But The 2010s UK Recovery Produced A Huge Increase In Self-Employment
...But The 2010s UK Recovery Produced A Huge Increase In Self-Employment
The point is that all recessions produce major structural changes in the labour market and the current recession will be no different. If social distancing persists, it will nullify the social skill advantage that humans have over AI. Therefore, one structural change will be that AI disrupts the more ‘human’ job sectors that have so far escaped its penetration. All recessions produce major structural changes in the labour market. To repeat, labour market disruption arrives suddenly. Within the space of a few weeks, most UK patients have switched to receiving their medical care online or by telephone. Admittedly, the patients are still ‘seeing’ a human doctor, but the question and answer consultations are a classic example of narrow-frame pattern recognition. Meaning that it would be a small step to upgrade the human doctor to the superior diagnosis from AI. And if AI can produce a superior diagnosis to your human doctor, why can’t AI also produce a a superior legal analysis to your human lawyer? The Investment Implications Even when the labour market seemed to be humming and unemployment rates were at multi-decade lows, aggregate wage inflation was anaemic (Chart I-3 and Chart I-4). A major reason was the hollowing out of high paying jobs and substitution with low paying jobs. Now that unemployment rates are surging, and AI is penetrating even more job sectors, aggregate wage inflation is set to collapse – not just temporarily, but structurally. Chart I-3Unemployment Rates Have Been At Multi-Decade Lows...
Unemployment Rates Have Been At Multi-Decade Lows...
Unemployment Rates Have Been At Multi-Decade Lows...
Chart I-4...But Wage Inflation Has Been ##br##Anaemic
...But Wage Inflation Has Been Anaemic
...But Wage Inflation Has Been Anaemic
This leads to the following investment implications: 1. All bond yields will gravitate to their lower bound, so any bond yield that can go lower will go lower. 2. It follows that bond investors should continue to overweight US T-bonds versus the core European bonds in Germany, France, Netherlands, Switzerland and Sweden (Chart I-5). Chart I-5Any Bond Yield That Can Go Lower Will Go Lower
Any Bond Yield That Can Go Lower Will Go Lower
Any Bond Yield That Can Go Lower Will Go Lower
3. Underweight banks structurally. Depressed and flattening yield curves combined with shrinking demand for private credit constitutes a strong headwind. Banks are now underperforming in both up markets and in down markets (Chart I-6). Chart I-6Banks Are Underperforming In Both Up Markets And Down Markets
Banks Are Underperforming In Both Up Markets And Down Markets
Banks Are Underperforming In Both Up Markets And Down Markets
4. Overweight technology structurally. As AI penetrates even more job sectors, the superstar companies of big tech will continue to thrive. The duopoly of Apple and Google are designing proximity-tracking apps for every smartphone in the world. Big tech is laying down the law to governments, and there is not even a hint of antitrust suits. Tech is now outperforming in both up markets and in down markets (Chart I-7). Chart I-7Tech Is Outperforming In Both Up Markets And Down Markets
Tech Is Outperforming In Both Up Markets And Down Markets
Tech Is Outperforming In Both Up Markets And Down Markets
5. Finally, if big tech outperforms banks, the sector composition of the S&P 500 versus the Euro Stoxx 50 makes it inevitable that the US equity market will structurally outperform the euro area equity market (Chart I-8). Chart I-8If Big Tech Outperforms Banks, The S&P 500 Must Outperform The Euro Stoxx 50
If Big Tech Outperforms Banks, The S&P 500 Must Outperform The Euro Stoxx 50
If Big Tech Outperforms Banks, The S&P 500 Must Outperform The Euro Stoxx 50
Fractal Trading System* The steep decline in the US 30-year T-bond yield means that it has crossed below the Australian 30-year bond yield for the first time in recent history. Resulting from this dynamic, this week’s recommended trade is long the Australian 30-year bond versus the US 30-year T-bond. Set the profit target at 9 percent with a symmetrical stop-loss. Chart I-930-Year Govt. Bonds: Australia Vs. US
30-Year Govt. Bonds: Australia Vs. US
30-Year Govt. Bonds: Australia Vs. US
In other trades, long IBEX versus Euro Stoxx 600 hit its 3 percent stop-loss, while long nickel versus copper is half way to its 11 percent profit target. The rolling 12-month win ratio now stands at 63 percent. When the fractal dimension approaches the lower limit after an investment has been in an established trend it is a potential trigger for a liquidity-triggered trend reversal. Therefore, open a countertrend position. The profit target is a one-third reversal of the preceding 13-week move. Apply a symmetrical stop-loss. Close the position at the profit target or stop-loss. Otherwise close the position after 13 weeks. * For more details please see the European Investment Strategy Special Report “Fractals, Liquidity & A Trading Model,” dated December 11, 2014, available at eis.bcaresearch.com. Dhaval Joshi Chief European Investment Strategist dhaval@bcaresearch.com Fractal Trading System Cyclical Recommendations Structural Recommendations Closed Fractal Trades Trades Closed Trades Asset Performance Currency & Bond Equity Sector Country Equity Indicators Bond Yields Chart II-1Indicators To Watch - Bond Yields
Indicators To Watch - Bond Yields
Indicators To Watch - Bond Yields
Chart II-2Indicators To Watch - Bond Yields
Indicators To Watch - Bond Yields
Indicators To Watch - Bond Yields
Chart II-3Indicators To Watch - Bond Yields
Indicators To Watch - Bond Yields
Indicators To Watch - Bond Yields
Chart II-4Indicators To Watch - Bond Yields
Indicators To Watch - Bond Yields
Indicators To Watch - Bond Yields
Interest Rate Chart II-5Indicators To Watch - Interest Rate Expectations
Indicators To Watch - Interest Rate Expectations
Indicators To Watch - Interest Rate Expectations
Chart II-6Indicators To Watch - Interest Rate Expectations
Indicators To Watch - Interest Rate Expectations
Indicators To Watch - Interest Rate Expectations
Chart II-7Indicators To Watch - Interest Rate Expectations
Indicators To Watch - Interest Rate Expectations
Indicators To Watch - Interest Rate Expectations
Chart II-8Indicators To Watch - Interest Rate Expectations
Indicators To Watch - Interest Rate Expectations
Indicators To Watch - Interest Rate Expectations
Highlights Portfolio Strategy Our conservative dividend growth assumptions especially for the next three years – largely mimicking the GFC experience – result in an SPX 3,000 fair value target. Relative performance already reflects the jump in demand for packaged foods. A firm US dollar and an ongoing profit margin squeeze at a time when relative valuations have returned to the historical mean compel us to downgrade the S&P packaged foods index to neutral. An upward trending demand profile, a fortress of a balance sheet, exemplary recession resilience, and sustained M&A activity, all warrant an overweight stance in the S&P software index. Recent Changes Trim the S&P packaged foods index to neutral today, which pushes the S&P consumer staples sector to a benchmark allocation. Boost the S&P software index to overweight today, which lifts the S&P tech sector to a benchmark allocation. Table 1
New SPX Target
New SPX Target
Feature The SPX jumped to a five-week high last week, on the back of news that the economy will gradually reopen next month. In other news, GILD’s remdesivir drug showed some positive early signs in fighting off the coronavirus, sparking an impressive late-week rally in the SPX. From a macro perspective, flush monetary liquidity and extremely easy fiscal policy remain the dominant market forces. While we remain confident that equities will be higher on a 9-12 month cyclical time horizon, we believe that the easy money since the March 23 lows has already been made and a consolidation phase now looms. Thus, monetizing some of these gains would make sense at the current juncture. Keep in mind that the SPX, junk spreads and the CBOE’s put/call ratio have returned to their respective means since 2018 (horizontal lines denote the historical averages, Chart 1). Tack on the stiff resistance that the S&P 500 will face near the 50-day and 100-week moving averages, and a lateral move is likely in the coming weeks. Meanwhile, in our seminal report “SPX 3,000?” on July 10, 2017 we introduced our SPX dividend discount model (DDM) when we first came up with the SPX 3,000 target.1 It is now custom to update our DDM every April when the previous year’s annual S&P 500 dividend payment is finalized from the Standard & Poor’s. Chart 1Consolidation Mode
Consolidation Mode
Consolidation Mode
Chart 2Dividends Rule
Dividends Rule
Dividends Rule
As a reminder, we have been and remain very conservative in our DDM assumptions. Again this year we assume that no buybacks will occur, a long held assumption of ours, i.e. we pencil in a steady divisor in the coming five-year time frame. 2025 is our terminal year when dividend growth settles at 6.6%, 60bps below the long-term average (bottom panel, Chart 2). Our 8.2% discount rate mirrors the corporate junk bond yield historical average. This year we use two different dividend growth approaches: our own estimates and alternatively the S&P 500 dividend futures derived growth. In the spirit of conservatism, we pick the lowest point hit in early April across the different dividend futures expirations. Tables 2 & 3 summarize the results. In the dividend futures derived approach, SPX fair value is close to 2,110. Granted, such dividend contractions for two years running (33% in 2020 and 14% in 2021, Table 2) are extreme and highly unlikely. Moreover, dividend futures have since rebounded violently. However, we stick with them to derive our worst case SPX value. Table 2SPX Dividend Discount Model: Using S&P Dividend Futures Growth Assumptions
New SPX Target
New SPX Target
Our own dividend growth estimates result in an SPX 3,000 fair value target (Table 3). While our assumptions are not as dire as the nadir in dividend futures, they are slightly more conservative than the GFC experience. As a reminder, in the aftermath of the GFC dividends contracted by 20% in 2009 and then recovered rising by 1% and 16% in 2010 and 2011, respectively (please click here if you would like to receive our DDM and insert your own assumptions). Table 3SPX Dividend Discount Model: Using USES Dividend Growth Assumptions
New SPX Target
New SPX Target
Building up on this analysis, we want to identify sectors that are at risk of a dividend cut, and thus pose the greatest threat to our SPX dividend projections. Table 4 shows the 2019 sectorial dividends, profits, and the payout ratio along with indebtedness. While during the Great Recession financials cut their handsome dividends, the current recession is not a financial crisis and we doubt the financials sector will cut their dividends, at least not as aggressively as in the GFC (Table 5). Table 4S&P 500 GICS1 Sector Dividend Analysis
New SPX Target
New SPX Target
Table 5The GFC S&P 500 GICS1 Sector Dividend Experience
New SPX Target
New SPX Target
Energy is a clear standout, but neither XOM nor CVX will forego their dividend aristocrat status (minimum 25 consecutive years of rising dividends) and chop their dividends. In other words, these Oil Majors will do everything in their power including raising debt to ever so modestly increase their dividends and maintain their aristocrat status. Thus, $24bn of energy sector related dividends are safe or 55% of the overall energy sector’s dividend. Keep in mind that the energy sector increased their dividends in the GFC (Tables 4 & 5). Industrials (GE is no longer a big dividend payer), materials, real estate and select consumer discretionary are sore spots, but not large enough to undermine the SPX (Table 4). Tech, health care and consumer staples are in excellent shape and judging by JNJ’s and COST’s recent dividend hikes, these sectors that enjoy mostly pristine balance sheets may even increase their payouts as they did during the GFC (Tables 4 & 5). While utilities and telecom services are debt saddled, their defensive stature and stable cash flow streams along with their history of steady dividend payments also do not pose a real threat to the SPX’s dividend (Tables 4 & 5). This leaves financials as the key sector to monitor for a possible large inflicted wound to the SPX dividend. In the most adverse scenario where the Fed instructs banks to eliminate their dividends, as the BoE and the ECB recently did in Europe, then the SPX dividend will contract, but only by 15%, ceteris paribus. This is because last year the tech sector had the highest dividend weight in the SPX and also because the financials sector’s dividend weight has fallen from 30% in 2007 to 15% in 2019 (Tables 4 & 5). Netting it all out, we are comfortable with our dividend growth assumptions especially for the next three years – largely mimicking the GFC experience – and resulting in an SPX 3,000 fair value target. The path of least resistance for the SPX remains higher on a 9-12 month cyclical time horizon. However, given that the easy SPX gains from the March 23, 2020 lows – when we turned cyclically bullish2 – have been made, opportunistic/nimble investors could monetize at least a part of these massive one-month returns. As aforementioned the SPX may face resistance near the 50-day moving average where it attempts to consolidate its recent gains. This week we are downgrading a defensive group to neutral and boosting a deep cyclical group to an above benchmark allocation. Turning Stale Following up from last week’s report, we heed the message from our research to be wary of staples stocks at the depth of the recession and downgrade the S&P packaged foods index to neutral. This move also pushes the S&P consumer staples sector down to a benchmark allocation from previously overweight. While this defensive index had been severely bruised from the accounting scandal at Kraft/Heinz, it has really flexed its safe haven muscles year-to-date. We use this opportunity to trim exposure down to neutral as we deem that this relative advance has run out of steam, despite the once in a lifetime jump in a number of key demand indicators. Chart 3 shows that food & beverage store retail sales now garner 17% of total retail sales a percentage last hit in the early 1990s. Impressively, not only did industry sales rise in absolute terms, but also overall retail sales suffered a severe setback accentuating last month’s spike. Similarly, food output hit a high mark last month, outpacing overall industrial production that came to a standstill. Food products resource utilization also soared, outpacing overall capacity utilization by 10% (bottom panel, Chart 3). As a result, relative share price momentum came close to accelerating by triple digits on a short-term rate of change basis (Chart 4). While such euphoria is warranted, we reckon that most if not all the good news is already reflected in prices, especially given the early signs of a possible reopening of the US economy some time next month. Importantly, sell side analyst optimism has climbed to a similar height observed in late-2015/early-2016 when industry 12-month forward EPS were slated to outshine the broad market by over 10% (bottom panel, Chart 4). Chart 3Demand Boost…
Demand Boost…
Demand Boost…
Chart 4…Is Already Baked In
…Is Already Baked In
…Is Already Baked In
Worrisomely, despite the rising demand profile, operating margins have been drifting lower over the past decade and a further profit margin squeeze remains a high probability outcome (Chart 5). Finally, on the food export front, the rising US dollar is warning that volumes will remain in check in coming quarters (greenback shown inverted, middle panel, Chart 6). All of this is reflected in valuations that have returned to the 25-year mean with packaged food manufacturers now trading at a 9% forward P/E premium to the broad market (bottom panel, Chart 6). Chart 5Margin Trouble
Margin Trouble
Margin Trouble
Chart 6Past Expiry Date
Past Expiry Date
Past Expiry Date
In sum, relative performance already reflects the jump in demand for packaged foods. A firm US dollar and an ongoing profit margin squeeze at a time when relative valuations have returned to the historical mean compel us to downgrade the S&P packaged foods index to neutral. Bottom Line: Trim the S&P packaged foods index to neutral, today for a loss of 20% since inception. This downgrade also pushes the S&P consumer staples sector to neutral for a loss of 11% since inception. The ticker symbols for the stocks in this index are: BLBG: S5PACK – MDLZ, SJM, KHC, CPB, MKC, CAG, TSN, GIS, HSY, HRL, K, LW. Boost Software To Overweight We recently monetized over 50% relative gains in our overweight in the S&P software index, but today we are compelled to lift this heavyweight tech sub-index back to an overweight stance. One key reason for our renewed bullishness is that for the second time in the past 15 months, software stocks managed to eke out relative gains when the broad market fell peak-to-trough 20% and 35% in late-2018 and in Q1/2020, respectively (Chart 7). This resilience on the way down confirms both the defensive stature of this services tech subgroup and simultaneously our long held belief that when growth is scarce investors will flock to secular growth stocks. Chart 7Recession Proof
Recession Proof
Recession Proof
As a result and following up from our recent data processing upgrade, another defensive services tech group, we are compelled to augment exposure to the S&P software index to overweight. Last week we showed that the tech sector (along with financials and consumer discretionary) best the broad market from the recessionary troughs onward, signaling that the key software sub group will likely lead the recovery.3 Software investment is on a multi decade upward trajectory and is slated to rise further in coming quarters as overall spending takes the back seat, but defensive software capex remains resilient (Chart 8). Not only do corporate executives upgrade software in downturns as these upgrades yield near instantaneous return on investment and are immediately productivity enhancing, but also the push to cloud-based services will only accelerate during the ongoing recession (bottom panel, Chart 8). Tack on that the global coronavirus social distancing measures are also boosting demand for remote working services specifically, and software sales will continue to grind higher (Chart 9). Chart 8Capex Market Share Gains
Capex Market Share Gains
Capex Market Share Gains
Chart 9Rising Demand Buoys Sales
Rising Demand Buoys Sales
Rising Demand Buoys Sales
Meanwhile, industry M&A remains robust and both the number of deals are still rising at a brisk rate and the premia paid remain near historically high levels (Chart 10). Contrary to a slew of corporations that have announced dividend cuts and equity buyback suspensions, pristine software balance sheets underscore that shareholder friendly activities will remain in place, if not accelerate, during the current recession (bottom panel, Chart 10). Chart 10What’s Not To Like?
What’s Not To Like?
What’s Not To Like?
Chart 11Model Says Buy
Model Says Buy
Model Says Buy
Our macro-based software EPS growth model does an excellent job in capturing all these moving forces and it is signaling that industry profits will continue to expand at a healthy pace for the rest of the year, in marked contrast to the broad market’s expected profit contraction (Chart 11). Adding it all up, an upward trending demand profile, a fortress of a balance sheet, exemplary recession resilience, and sustained M&A activity, all bode well for an earnings-led outperformance phase in the S&P software index. Bottom Line: Boost the S&P software index to overweight, today. This upgrade also lifts the S&P tech sector to neutral for a loss of 5% since inception. The ticker symbols for the stocks in this index are: BLBG: S5SOFT – MSFT, ADBE, CRM, ORCL, INTU, NOW, ADSK, ANSS, SNPS, CDNS, FTNT, PAYC, CTXS, NLOK. Anastasios Avgeriou US Equity Strategist anastasios@bcaresearch.com Footnotes 1 Please see BCA US Equity Strategy Weekly Report, “SPX 3,000?” dated July 10, 2017, available at uses.bcaresearch.com. 2 Please see BCA US Equity Strategy Weekly Report, ““The Darkest Hour Is Just Before The Dawn”” dated March 23, 2020, available at uses.bcaresearch.com. 3 Please see BCA US Equity Strategy Weekly Report, “Fight Central Banks At Your Own Peril” dated April 14, 2020, available at uses.bcaresearch.com. Current Recommendations Current Trades Strategic (10-Year) Trade Recommendations
New SPX Target
New SPX Target
Size And Style Views June 3, 2019 Stay neutral cyclicals over defensives (downgrade alert) January 22, 2018 Favor value over growth May 10, 2018 Favor large over small caps (Stop 10%) June 11, 2018 Long the BCA Millennial basket The ticker symbols are: (AAPL, AMZN, UBER, HD, LEN, MSFT, NFLX, SPOT, TSLA, V).
Favor Defensive Tech
Favor Defensive Tech
In our latest Weekly Report we boosted the S&P data processing index to overweight from previously underweight. Data processing stocks are a services-based defensive tech index that typically thrive in deflationary and recessionary environments, according to empirical evidence (see chart). We are currently in recession, thus a deflationary impulse will grip the economy and investors will flock to defensive tech stocks when growth is scarce. Tack on the spike in the greenback, and the disinflationary backdrop further boosts the allure of these tech services stocks (third panel). Beyond the recessionary related tailwinds, data processing stocks should also enjoy firming relative demand. While the two bellwether stocks, V and MA, will suffer from the decrease in consumption that requires physical visits and from select services outlays that are severely affected by the coronavirus, online spending by households and corporations should at least serve as a partial offset. Bottom Line: We recently lifted the S&P data processing index to overweight from previously underweight. The ticker symbols for the stocks in this index are: BLBG: S5DPOS – ADP, V, MA, PYPL, FIS, FISV, GPN, PAYX, FLT, BR, JKHY, WU, ADS.
Highlights Recommended Allocation
Quarterly Portfolio Outlook: Playing The Optionality
Quarterly Portfolio Outlook: Playing The Optionality
The outlook for markets over the next few months is highly uncertain. On the optimistic side, new COVID-19 cases are probably close to peaking (for now), and so equities could continue to rally. But there are many risks too. Growth numbers will be horrendous for some months. Second-round effects (corporate defaults, problems in EM and with euro zone banks, for example) will emerge. We recommend a balanced portfolio, robust both for risk-on rallies and a further sell-off. We stay overweight equities versus bonds. Government bonds will not provide significantly positive returns even in a severe recession. Thus, over the next 12-months, equities are likely to outperform them. But we leaven the equity overweight with a “minimum volatility” strategy, overweight the low-beta US market, and more stable sectors such as Healthcare and Technology. Within bonds, we stay underweight government bonds, and raise Investment Grade credit to overweight, given the Fed’s backstop. Even in a risk-on rally, government yields will not rise quickly so we recommend a neutral stance on duration. The massive stimulus will eventually be inflationary, so we recommend TIPS, which are very cheaply valued. We are overweight cash and gold as hedges against further market turbulence. Among alternatives, macro hedge funds and farmland look attractively defensive now. We would start to look for opportunities in private debt (especially distressed debt) as the recession advances. Commodity futures are attractive as an inflation hedge. Overview Playing The Optionality From the start of the crisis, we argued that markets would bottom around the time when new cases of COVID-19 peaked. At the end of March, there were clear signs that this would happen in April, with Italy and Spain having probably already peaked and the US, if it follows the same trajectory, being only two or three weeks away (Chart 1). Chart 1Close To A Peak In New Cases?
Quarterly Portfolio Outlook: Playing The Optionality
Quarterly Portfolio Outlook: Playing The Optionality
But what happens next? A relief rally is likely, as often happens in bear markets – and indeed one probably started with the three-day 18% rise in US equities in the last week of March. Note, for example, the strong rallies in spring 2008 and summer 2000 before the second leg down in those bear markets (Chart 2). Chart 2Mid Bear Market Rallies Are Common
Mid Bear Market Rallies Are Common
Mid Bear Market Rallies Are Common
However, there is still a lot of potential bad news for markets to digest. Global growth has collapsed, as a result of people in many countries being forced to stay at home. US GDP growth in Q2 could fall by as much as 10% quarter-on-quarter (unannualized). Horrendously bad data will come as a shock to investors over the coming months. Despite the unprecedented stimulus measures from central banks and governments worldwide (Chart 3), nasty second-round effects are inevitable. Given the high level of corporate debt in the US, defaults will rise, to perhaps above the level of 2008-9 (Chart 4). EM borrowers have almost $4 trillion of foreign-currency debt outstanding, and will struggle to service this after the rise in the dollar and wider credit spreads. Euro area banks are poorly capitalized and have high non-performing debt levels left over from the last recession; they will be hit by a new wave of bankruptcies. Undoubtedly, there are some banks and hedge funds sitting on big trading losses after the drastic sell-off and stomach-churning volatility. Mid-East sovereign wealth funds will unload more assets to fill fiscal holes left by the collapsed oil price. Chart 3Massive Stimulus Everywhere
Quarterly Portfolio Outlook: Playing The Optionality
Quarterly Portfolio Outlook: Playing The Optionality
Chart 4Possible Second-Round Effects
Possible Second-Round Effects
Possible Second-Round Effects
There is also the question of when the pandemic will end. We are not epidemiologists, so find this hard to judge (but please refer to the answers from an authority in our recent Special Report1). The coronavirus will disappear only when either enough people in a community have had the disease to produce “herd immunity,” or there is a vaccine – which is probably 18 months away. Some epidemiologists argue that in the UK and Italy 40%-60% of the population may have already had COVID-19 and are therefore immune.2 But an influential paper from researchers at Imperial College suggested that repeated periods of lockdown will be necessary each time a new wave of cases emerges3 (Chart 5). Chart 5More Waves Of The Pandemic To Come?
Quarterly Portfolio Outlook: Playing The Optionality
Quarterly Portfolio Outlook: Playing The Optionality
At the end of March, global equities were only 23% off their mid-February record high – and were down only 34% even at their low point. That doesn’t seem like enough to fully discount all the potential pitfalls over coming months. This sort of highly uncertain environment is where portfolio construction comes in. We recommend that clients position their portfolios with optionality to remain robust in any likely outcome. There are likely to be rallies in risk assets over coming months, particularly when the coronavirus shows signs of petering out. There is significant asymmetric career risk for portfolio managers here. No portfolio manager will be fired for missing the pandemic and underperforming year-to-date (though some may because their firms go out of business or retrench). But a PM who misses a V-shaped rebound in risk assets over the rest of the year could lose their job. This will provide a strong incentive to try to pick the bottom. Chart 6Bond Yields Can't Go Much Lower
Bond Yields Can't Go Much Lower
Bond Yields Can't Go Much Lower
Government bond yields are close to their theoretical lows. The 10-year US Treasury yield is 0.6% and it unlikely to fall below 0% even in a severe recession (since the Fed has stated that it will not cut short-term rates below 0%). In other countries, the low for yields has turned out to be around -0.3% to -0.9% (Chart 6). The total return from risk-free bonds, therefore, will be close to zero even in a dire economic environment (Table 1). This means that the call between bonds and equities comes down to whether equity prices will be higher or lower in 12-months. Quite likely, they will be higher. Given this, and the optionality of participating in rebounds, we maintain our overweight on equities versus bonds. We would, however, be inclined to lower our equity weighting in the event of a big rally in stocks over the next few months. Table 1Not Much Room For Upside From Bonds
Quarterly Portfolio Outlook: Playing The Optionality
Quarterly Portfolio Outlook: Playing The Optionality
Table 2Bear Markets Are Often Much Worse
Quarterly Portfolio Outlook: Playing The Optionality
Quarterly Portfolio Outlook: Playing The Optionality
But there are also many downside risks. In the past two recessions, global equities fell by 50%-60% (Table 2). Despite the much worse economic environment this time, the peak-to-trough decline is so far much more limited. Moreover, valuations are not particularly compelling yet (Chart 7). To leaven our overall overweight on equities, we recommend a “minimum volatility” strategy, with tilts towards the low-beta US market, and some more defensive sectors such as Healthcare and Technology. China and China-related stocks also look somewhat attractive, since that country got over the coronavirus first, and is responding with a big increase in infrastructure spending (Chart 8). To hedge against downside risk, we also leave in place our overweights in cash and gold. Chart 7Equities Are Not Yet Super Cheap
Equities Are Not Yet Super Cheap
Equities Are Not Yet Super Cheap
Chart 8China Infra Spending To Rise
China Infra Spending To Rise
China Infra Spending To Rise
Garry Evans, Senior Vice President Chief Global Asset Allocation Strategist garry@bcaresearch.com What Our Clients Are Asking – About The Coronavirus Have We Seen The Bottom In Equity Markets? Chart 9Watch Closely COVID-19
Quarterly Portfolio Outlook: Playing The Optionality
Quarterly Portfolio Outlook: Playing The Optionality
After hitting a low on March 23, global equities have recovered more than one-third of their loss during this particularly rapid bear market, in response to the massive monetary and fiscal stimulus around the globe. It’s very hard to pinpoint the exact bottom of any equity bear market. The current one is particularly difficult in two ways: First, it was largely due to the exogenous shock from the COVID-19 pandemic. If history is any guide, we will first need to see a peak in infected cases globally before we can call a true bottom in equities (Chart 9). Second, the massive and coordinated response from central banks and governments around the world is unprecedented, as the global “lockdown” freezes the global economy. It’s encouraging to see the Chinese PMI bouncing back to 52 in March after a sharp drop to deep contraction level in February. However, the bounce back was mostly from production. Both export orders and imports remain weak. US initial jobless claims have skyrocketed to 3.3 million. If the peak of infection in the US follows similar patterns in China and Italy, then it would be another encouraging sign even if the US economic data continued to get worse. BCA Research’s base-case is for this recession to have a U-shaped recovery. This means that equity markets are likely to be range bound until we have a better handle on the future course of the pandemic. As such, we suggest investors actively manage risk by adding to positions when the S&P 500 gets close to 2250 and reducing risk when it gets close to 2750 during the bottoming process. What Will Be The Long-Term Consequences? Maybe it seems too early to think about this, but the coronavirus pandemic will change the world at least as profoundly as did the 1970s inflation, 9/11, and the Global Financial Crisis (GFC). Here are some things that might change: Chart 10Government Debt Will Rise Significantly
Government Debt Will Rise Significantly
Government Debt Will Rise Significantly
Government debt levels will rise dramatically, as a result of the huge fiscal packages being (rightly) implemented by many countries. In the US, after the $2 trillion spending increase and a fall in tax revenues, the annual fiscal deficit will rise from 6% of GDP to 15%-20%. Government debt/GDP could exceed the 122% reached at the end of WW2 (Chart 10). Ultimately, central banks will have to monetize this debt, perhaps by capping long-term rates or by buying a substantial part of issuance. This could prove to be inflationary. Households and companies may want to build in greater cushions and no longer live “on the edge”. US households have repaired their balance-sheets since 2009, raising the savings rate to 8% (Chart 11). But surveys suggest that almost one-third of US households have less than $1,000 in savings. They may, therefore, now save more. This could depress consumption further in coming years. Companies have maximized profitability over the past decades, under pressure from shareholders, by keeping inventories, spare cash, and excess workers to a minimum. Given the sudden stop caused by the pandemic (and who is to say that there will not be more pandemics in future), companies may want to protect themselves from future shocks. The inventory/sales ratio, which had been falling for decades, has picked up a little since the GFC (Chart 12). Inventory levels are likely to be raised further. Companies may also run less leveraged balance-sheets, rather than hold the maximum amount of debt their targeted credit rating can bear. This is all likely to reduce long-term profit growth. Chart 11Households May Become Even More Cautious
Households May Become Even More Cautious
Households May Become Even More Cautious
Chart 12Companies Will Run With Higher Inventories
Companies Will Run With Higher Inventories
Companies Will Run With Higher Inventories
The pandemic has highlighted the vulnerability of healthcare systems. China still spends only 5% of GDP on health, compared to 9% in Brazil and 8% in South Africa (Chart 13). The lack of intensive care beds and woefully inadequate epidemic plans in the US and other developed countries will also need to be tackled. Healthcare stocks should benefit. Chart 13Healthcare Spending Will Need To Rise
Healthcare Spending Will Need To Rise
Healthcare Spending Will Need To Rise
How Risky Are Euro Area Banks? Chart 14Euro Area Banks Are Quite Fragile
Euro Area Banks Are Quite Fragile
Euro Area Banks Are Quite Fragile
Banks in the euro area have underperformed their developed market peers by over 65% since the Global Financial Crisis (GFC) (Chart 14, panel 1). Their structural issues – many of which we highlighted in a previous Special Report – remain unsolved. Euro area banks remain highly leveraged compared to their US counterparts (panel 2). Their exposure to emerging economies is high (panel 3), and they continue to be a major provider of European corporate funding. US corporates, by contrast, are mainly funded through capital markets. The sector is also highly fragmented with both outward and inward M&A activity declining post the GFC. Profitability continues to be a key long-term concern, despite having recently stabilized (panel 4). The ECB’s ultra-dovish monetary stance and negative policy rates do not help banks’ performance either. Banks’ relative return has been correlated to the ECB policy rate since the GFC (panel 5). Following the coronavirus outbreak, the ECB is likely to remain dovish for a prolonged period. The ECB’s recently announced measures should, however, provide banks with ample liquidity to hold and spur economic activity through increased lending to households and corporates. Absent consolidation in the European banking sector, competition is likely to dampen banks’ profits. Additionally, the severity of the economic downturn caused by the coronavirus outbreak will determine if their significant exposure to emerging economies, the energy sector, and domestic corporates will hurt them further. For now, we would recommend investors underweight euro area banks. Where Can I Get Income In This Low-Yield World? Chart 15The Bear Market Has Unveiled Attractive Income Opportunities
The Bear Market Has Unveiled Attractive Income Opportunities
The Bear Market Has Unveiled Attractive Income Opportunities
For long-term investors who can tolerate price volatility, there is currently an opportunity to invest in high-income securities at relatively cheap prices. Below we list three of our favorite assets to obtain income returns: Dividend Aristocrats: The S&P 500 Dividend Aristocrats Index is composed of S&P 500 companies which have increased dividend payouts for 25 consecutive years or more. In order to provide such a steady stream of income through a such long timeframe, and even provide dividend increases in recessions, the companies in this index need to have a track record of running cashflow-rich businesses. Thus, the risk of dividend cuts is relatively low in these companies. Currently, the Dividend Aristocrat Index has a trailing dividend yield of 3.2% (Chart 15 – top panel). Fallen Angels: As we discussed in our November Special Report, fallen angels have attractive characteristics that separate them from the rest of the junk market. They tend to have longer maturities as well as a higher credit quality than the overall index. Crucially, fallen angels often enter the high-yield index at a discount, since certain institutional investors are forced to sell them when they are no longer IG-rated (middle panel). Thus, selected fallen angels which are not at a substantial risk of default could be a tremendous income opportunity. Currently fallen angels have a yield to worst of 10.65%. Sovereign US dollar EM debt: Our Emerging Markets Strategy service has argued that most EM sovereigns are unlikely to default on their debts, and instead will use their currencies as a release valve to ease financial conditions in their economies. Thus, hard-currency sovereign issues could prove to be attractive income investments if held to maturity. The bottom panel of Chart 15 (panel 3) shows the current yield-to-worst of the EM sovereign hard currency debt that has an overweight rating by our Emerging Markets service. Global Economy Chart 16The Collapse Begins
The Collapse Begins
The Collapse Begins
Overview: The global economy in early January looked on the cusp of a strong manufacturing pickup, driven by the natural cycle and by moderate fiscal stimulus out of China. The coronavirus changed all that. We now face a recession of a severity unseen since the 1930s. The fiscal and monetary response has been similarly rapid and radical. This will tackle immediate liquidity and even solvency risks. But, with consumers in many countries confined to their homes, a recovery is entirely dependent on when the number of new cases of COVID-19 peaks. In an optimistic scenario, this might be in late April or May. On a pessimistic one, the pandemic will continue in waves for several quarters. US: It is highly likely that the NBER will eventually declare that the US entered recession in March 2020. With many states in lockdown, consumption (which comprises 70% of GDP) will slump: only half of consumption is non-discretionary (rent, food, utility bills etc.); the other half is likely to shrink significantly while lockdowns continue. Judged by the 3.3 million initial claims in the week of March 16-21, unemployment will jump from its February level of 3.5% very rapidly towards 10%. Fiscal and monetary stimulus measures will cushion the downside (enabling households to pay rent and companies to service debt). But whether the recession is V-shaped or prolonged will be dependent on the length of the pandemic. Euro Area: European manufacturing growth was showing clear signs of picking up before the coronavirus pandemic hit (Chart 16 panel 1). But lockdowns in Italy, Spain and other countries will clearly push growth way into negative territory. The severity is clear from the first datapoints to reflect March activity, such as the ZEW survey. The ECB, after an initially disappointing response, has promised EUR750 billion (and more if needed) in bond purchases. The fiscal response so far has been more lukewarm, although Germany has now scrapped its requirement to run a budget surplus. One key question: will the stronger nothern European economies agree to “euro bonds”, joint and severally guaranteed, to finance fiscal spending in the weaker periphery? Chart 17...With Chinese Data Leading The Way
...With Chinese Data Leading The Way
...With Chinese Data Leading The Way
Japan: Japan’s economy was performing poorly even before the coronavirus pandemic, mainly because of the side-effects of last October’s consumption tax hike, and the slowdown in China (Chart 17, panel 2). So far, Japan has seen fewer cases of COIVD-19 than other large countries, but this may just reflect a lack of testing. Japan also has less room for policy response. Government debt is already 250% of GDP. The Bank of Japan has moderately increased purchases of equity ETFs and remains committed to maintaining government bonds yields around 0%. But Japan seems culturally and institutionally unable to roll out the sort of ultra-radical measures taken in other developed economies. Emerging Markets: China’s economy was severely disrupted in January and February, as reflected in an unprecedented collapse of the Caixin Services PMI to 26.5 (Chart 17, panel 3). However, big data (such as traffic congestion) suggest that in March people were gradually returning to work and companies restarting manufacturing operations. Q1 GDP growth will clearly be negative, and growth for the year may be barely above 0%. The authorities are ramping up infrastructure spending, which BCA expects to grow by 6-8% this year.4 Interest rates have also fallen below their 2015 levels, but not yet to their 2009 lows. Both fiscal and monetary policy are likely to be eased further. Elsewhere in Emerging Markets, the key question is whether central banks will cut rates to support rapidly weakening economies, or keep rates steady to prop up collapsing currencies. This is not an easy choice. Interest Rates: Central banks in developed markets have cut rates to their lowest possible levels with the Fed, for example, slashing from 1.25%-1.5% to 0%-0.25% within just 10 days in March. The Fed has signalled that it will not go below zero. Short-term policy rates globally, therefore, have essentially hit their lower bounds. Long-term rates have been volatile, with the 10-year US Treasury yield swinging down to 0.6% before jumping to 1.2%. While uncertainty continues, long-term risk-free rates are unlikely to rise substantially and, in the event of a prolonged severe recession, we would see the US 10-year yield falling to zero – but no lower. Global Equities Chart 18Is The V-Shaped Recovery Sustainable?
Quarterly Portfolio Outlook: Playing The Optionality
Quarterly Portfolio Outlook: Playing The Optionality
What’s Next? Global equities lost 32.8% year-to-date as of March 23, 2020. All countries and sectors in our coverage were in the red. Even the best performing country (Japan) and the best performing global sector (Consumer Staples) lost 26.7% and 23.2% respectively. From March 24 to March 26, however, equities made the best three-day gains since the Great Depression, recouping about one-third of the loss, even though US initial jobless claims came in at 3.3 million and also the US reported a higher number of cumulative infected people than China, with a much higher number of deaths per million people (Chart 18). So have we reached the bottom of the bear market? Is this “V-shaped” recovery sustainable? How should an investor construct a multi-asset global portfolio that’s sound for the next 9-12 months given the uncertainty associated with COVID-19 and the massive monetary and fiscal stimulus around the world? Based on our long-held philosophy of taking risks where risks will most likely be rewarded, we are most comfortable taking risk at the asset class level, by overweighting equities versus bonds, together with overweights in cash and gold as hedges. Within the equity portfolio, we are reducing risk by making the following adjustments: Upgrade US to overweight from underweight financed by downgrading the euro zone to underweight from overweight. Upgrade Tech to overweight, while closing two overweight bets on Financials and Energy and one underweight on consumer staples to benchmark weighting. Country Allocation: Becoming More Defensive Chart 19US And Euro Area: Trading Places
US And Euro Area: Trading Places
US And Euro Area: Trading Places
In December 2019 we added risk by upgrading the euro area to overweight and Emerging Markets to neutral based on our macro view that the global economy was on its way to recovery. Data releases in January did show signs of recovery in the global economy. However, the COVID-19 outbreak has changed the global landscape, and we are clearly in a recession now. When conditions change, we change our recommendations. We must make a judgment call because the economic data will not give us any timely, useful readings for some time to come. Back in December, the key reason to upgrade the euro area was the recovery of China which flows into the exports of the euro area. We think China will continue to stimulate its economy. However, given the global growth collapse, the “flow through” effect to the euro area will be delayed for some time. We prefer to play the China effect directly rather than indirectly. That’s why we maintain the neutral weighting of EM versus DM, but downgrade the euro area to underweight, and upgrade US to overweight. We also note the two following factors: First, as shown in Chart 19, panel 1, the relative performance between the euro area and the US is highly correlated with the relative performance between global Financials and Technology. This is not surprising given the sector composition of the two region’s equity indices. As such, this country adjustment is in line with our sector adjustment of upgrading Technology and downgrading Financials. Second, with a lower beta, US equities provide a better defense when economic uncertainty and financial market volatility are high. The risk to this adjustment, however, is valuation. As shown in panel 4, euro area valuation is extremely cheap compared to the US. However, PMI releases as well as forward earnings estimates are likely to get worse again before they get better, given the region’s reliance on exports to China and the structural issues in its banking system. Global Sector Allocation: Getting Closer To Benchmark Chart 20Reducing Sector Bets
Reducing Sector Bets
Reducing Sector Bets
We make four changes in the global sector portfolio to reduce sector bets, since we do not have a high conviction given market volatility and our house view that recovery out of this recession will be U-shaped. These are downgrading Financials to neutral, while upgrading Technology to overweight. We also close the overweight in Energy and underweight in Consumer Staples, leaving them both at benchmark weighting. Financials: We upgraded Financials in October last year as an upside hedge. This move did not pan out as bond yields plummeted. BCA Research’s US Bond Strategy service upgraded duration to neutral from underweight on March 10 as they do not see a high likelihood for yields to move significantly higher over the next 9-12 months. This does not bode well for Financials’ performance (Chart 20, panel 1). Even though the Fed and other central banks have come in as the lenders of last resort, loan growth could be weak going forward and non-performing loans could increase, especially in the euro area. Valuation, however, is very attractive. Technology: DRAM prices started to improve even before the COVID-19 outbreak. The global lockdown to fight against the pandemic is further spurring demand for both software and hardware, which should support better earnings growth (panel 2). The risk is that relative valuation is still not cheap, even though absolute valuation has come down after the recent selloff. Energy: The outlook for oil prices is too uncertain. The fight between Saudi Arabia and Russia is weighing on the supply side, while the global lockdown is denting demand prospect. The earnings outlook for energy companies is dire, while valuations are very attractive (panel 3). Consumer Staples: This is a classic defensive sector that does well in recessions. In addition, its relative valuation has improved to neutral from very expensive (panel 4). Government Bonds Chart 21Stay Aside On Duration
Stay Aside On Duration
Stay Aside On Duration
Upgrade Duration To Neutral. Global bond yields had a wild ride in Q1 as equities plummeted into bear market territory. The 10-year US Treasury yield made an historical low of 0.32% overnight on March 9, then quickly reversed back up to 1.27% on March 18, closing the quarter at 0.67%, compared to 1.88% at the beginning of the quarter (Chart 21). We are already in a recession and BCA’s house view is for a U-shaped recovery. This implies that global bond yields will likely follow a bottoming process similar to global equities, as new infections peak and high-frequency economic data start to recover. As such, we upgrade our duration call to neutral, to be in line with the position of BCA Research’s US Bond Strategy (USBS) service. Favor Linkers Vs. Nominal Bonds. The combined effect of the plummet in oil prices and the coronavirus outbreak has crushed inflation expectation to an extremely low level. As shown in Chart 22, the 10-year breakeven inflation rate is currently at 0.95%, 88 bps lower than its fair value. The fair value is estimated based on USBS’s Adaptive Expectations Model. Investors with a 12-month investment horizon should continue to favor TIPS over nominal Treasuries, but those with shorter horizons may be advised to stand aside and wait for the daily number of new COVID-19 cases to reach zero before re-initiating the position. Chart 22TIPS Offer A Ton Of Long-Run Value Extremely Cheap Inflation Protection
TIPS Offer A Ton Of Long-Run Value Extremely Cheap Inflation Protection
TIPS Offer A Ton Of Long-Run Value Extremely Cheap Inflation Protection
Corporate Bonds Chart 23High Quality Junk
High Quality Junk
High Quality Junk
It is undeniable that the dearth of cashflow caused by the lockdowns will spur a ferocious wave of defaults, particularly in the high-yield sector. It also is not clear that this risk is adequately compensated for. Currently, our US bond strategist believes that spreads are pricing an 11% default rate – in line with the default rate of the 2000/2001 recession. While it is not our base case, a default cycle like 2008, where 14% of companies in the index defaulted is a very clear possibility, as revenues have ground to a halt. However, several positive factors in the junk space must also be considered. Roughly 1% of the high-yield index matures in less than one year, which means that refinancing risk for junk credits should remain relatively subdued (Chart 23, top panel). Moreover, the quality of junk bonds is relatively high compared to previous periods of stress: when the market peaked in 2000 and 2007, Ba-rated credit (the highest quality of high yield) stood at 30% and 37% of the overall index respectively (middle panel). Today this credit quality stands at 49% of the high yield market, indicating a relatively healthier credit profile for junk. Additionally, the high-risk energy sector, which is likely to experience a substantial amount of defaults given the collapse in oil prices, now represents less than 8% of the market capitalization of the whole index (bottom panel). Taking these positive factors into consideration, we believe that a downgrade to underweight is not warranted, and instead we are downgrading high-yield credit from overweight to neutral. What about the investment-grade space? the massive stimulus package announced by the Fed, which effectively allows IG issuers to roll over their entire stock of debt, should provide a backstop to this market. One valid concern is that credit agencies can still downgrade a large number of issuers, making them ineligible to receive support. However, it seems that the credit agencies are aware of how much hinges on their ratings, and are communicating that they will factor the measures taken by various government programs into their credit analysis.5 Thus, considering that spreads are already extended, the Fed is providing unprecedent support and credit agencies are unlikely to knock out many companies out of investment-grade ratings, we are upgrading investment-grade credit from neutral to overweight. Commodities Chart 24Oil Prices & Politics Do Not Mix
Oil Prices & Politics Do Not Mix
Oil Prices & Politics Do Not Mix
Energy (Overweight): Oil markets were driven by supply/demand dynamics until a third factor, politics, shifted the market equilibrium. The recent clash between Saudi Arabia and Russia led to the breakdown of the OPEC 2.0 coalition and to Brent prices tanking by over 60% to $26 in March. The length of this breakdown is unknown. However, we believe the parties are likely to return to the negotiation table within the next months as the damage to countries which are dependent on oil begins to appear. The fiscal budget breakeven point remains much higher than the current oil price – it is around $83 for Saudi Arabia and $47 for Russia. Weakness in global crude demand will continue to put further downward pressure on prices, until economic activity recovers from the COVID-19 slowdown. Our Commodity & Energy Strategists expect the Brent crude oil price to average $36/bbl, with WTI trading some $3-$4 below that, in 2020 (Chart 24, panels 1 & 2). Industrial Metals (Neutral): Industrial metals prices were on track to pick up until the coronavirus hit global activity at the beginning of the year. Prices face further short-term headwinds as global manufacturing remains suppressed. Once the global social distancing ends and activity resumes, industrial metal prices should pick up as fiscal stimulus and infrastructure spending, especially in China, is implemented (panel 3). Precious Metals (Neutral): As the coronavirus spread, global risk assets have tumbled. Over the past 12 months, we have recommended investors increase their allocation to gold as both an inflation hedge and a beneficiary of accommodative monetary policy globally. However, we also recently highlighted that gold was reaching overbought territory and that a pullback was possible in the short-term. Nevertheless, investors should continue to maintain gold exposure to hedge against the eventuality that the pandemic is not contained within the coming weeks (panels 4 & 5). Currencies Chart 25Competing Forces Pushing The US Dollar In Different Directions
Competing Forces Pushing The US Dollar In Different Directions
Competing Forces Pushing The US Dollar In Different Directions
The USD has gone through a rollercoaster during the coronavirus crisis. Initially, the DXY fell by 4.8%, as rate differentials moved violently against the dollar when the Fed cut rates to zero. But this fall didn’t last long: as liquidity dried up, the cost for dollar funding surged, causing the dollar to skyrocket by almost 8.3%. Since then, the liquidity measures taken by monetary authorities have made the dollar reverse course once more. At this point there are multiple forces pulling the greenback in opposing directions. On the one hand, the collapse in global growth caused by the shutdowns should push the dollar higher. Moreover, momentum – one of the most reliable directional indicators for the dollar – continues to point to further upside (Chart 25, panels 1 and 2). However, the Fed’s generous USD swap lines with other major central banks as well as the massive pool of liquidity deployed have already stabilized funding costs in European and British currency markets, and look poised to do the same in others (Chart 25, panel 3). Thus, since there is no clarity on which force will prevail in this tug of war, we are remaining neutral on the US dollar. That being said, long-term investors can begin to buy some of the most depressed currencies, such as AUD/USD. This cross is currently trading at a 12% discount to PPP according to the OECD – the steepest discount that this currency has had in 17 years. Additionally, our China Investment Strategy projects that China will accelerate infrastructure investment this year to counteract the negative economic effects of the lockdown. This pick up in investment should increase base-metal demand, proving a boost to the Australian dollar in the process. Alternatives Chart 26Favor Macro Hedge Funds Over Private Equity During Recessions
Favor Macro Hedge Funds Over Private Equity During Recessions
Favor Macro Hedge Funds Over Private Equity During Recessions
Intro: The coronavirus outbreak caused tremendous market volatility and huge declines in liquid assets. Many clients have asked over the past few weeks which illiquid assets make sense in the current environment. To answer that, we stick to our usual recommendation framework, dividing illiquid assets into three buckets: Return Enhancers: Over the past year, we have been recommending clients to pare back private-equity exposure and increase allocation to hedge funds – particularly macro hedge funds, which often outperform other risky alternative assets during economic slowdowns and recessions (Chart 26, panel 1). Private debt – particularly distressed debt – could become a beneficiary of the current environment. The market turmoil will leave some assets heavily discounted, which can provide an opportunity for nimble funds to make investments at attractive valuations. In a previous Special Report, we highlighted Business Development Companies (BDCs) as a liquid alternative to direct private lending.6 They have taken a hit over the past month, even compared to equities and junk bonds. However, their recovery as markets bottom is usually significant (panels 2 & 3). Inflation Hedges: The coordinated “whatever-it-takes” stance implemented by global governments and central banks to mitigate the coronavirus crisis is likely to have inflationary consequences in the long-term. In that environment, investors should favor commodity futures over real estate (panel 4). As global growth reaccelerates in response to stimulus and resumed manufacturing activity over the next 12 months, the USD should weaken, and commodity prices should rise. Volatility Dampeners: Timberland and farmland remain our long-time favorite assets within this bucket. We have previously shown that both assets outperform other traditional and alternative assets during recessions and equity bear markets (panel 5). Farmland particularly should fare well in this environment, being more insulated from the economy, given food’s inelastic demand Risks To Our View Chart 27Dollar Would Fall In A Strong Recovery
Dollar Would Fall In A Strong Recovery
Dollar Would Fall In A Strong Recovery
Since our recommendations are based on a middle course, hedging both upside and downside risks, we need to consider how extreme these two eventualities could be. On the upside, the most optimistic scenario would be one in which the coronavirus largely disappears after April or May. The massive amount of fiscal and monetary stimulus would produce a jet-fuelled rally in risk assets. The dollar has soared over the past few weeks, as a risk-off currency (Chart 27), and would likely fall sharply. This would be very positive for commodities and Emerging Markets assets. The strong cyclical recovery would also help euro zone and Japanese equities relative to the more defensive US. Value stocks and small caps would outperform. Chart 28Could It Get Worse Than 2008 - Or Even 1932?
Could It Get Worse Than 2008 - Or Even 1932?
Could It Get Worse Than 2008 - Or Even 1932?
Downside risks are less easy to forecast. As Warren Buffet wrote in 2002: “you only find out who is swimming naked when the tide goes out.” The shock to the system caused by the coronavirus is certainly larger than the Global Financial Crisis of 2007-9 and could approach that caused by the Great Depression (Chart 28), though hopefully without the egregious policy errors of the latter. It is hard, therefore, to know where problems will emerge: US corporate debt, EM borrowers, and euro zone banks would be our most likely candidates. But there could be others. The oil price is another key uncertainty. Demand could collapse by at least 10% as a result of the severe recession. The breakdown of the production agreement between Saudi Arabia and Russia could produce a supply increase of 4-5%. Given this, Brent crude would fall to $20 a barrel. That would represent a strong tailwind to global recovery (Chart 29). On the other hand, a rapprochement between Saudi and Russia (and even with regulators in Texas) could push oil prices back up again – a positive for markets such as Canada and Mexico. Chart 29Cheap Oil Boosts Growth
Cheap Oil Boosts Growth
Cheap Oil Boosts Growth
Footnotes 1 Please see BCA Special Report, "Questions On The Coronavirus: An Expert Answers," dated 31 March 2020, available at bcaresearch.com 2 https://www.medrxiv.org/content/10.1101/2020.03.24.20042291v1 3 https://www.imperial.ac.uk/media/imperial-college/medicine/sph/ide/gida-fellowships/Imperial-College-COVID19-NPI-modelling-16-03-2020.pdf 4 Please see China Investment Strategy Weekly Report, “Chinese Economic Stimulus: How Much For Infrastructure And The Property Market,” dated 25th March 2020, available at cis.bcaresarch.com 5 A release by Moody’s on March 25 stated that their actions “will be more tempered for higher-rated companies that are likely to benefit from policy intervention or extraordinary government support.” 6 Please see Global Asset Allocation Special Report, “Private Debt: An Investment Primer,” dated June 6, 2018, available at gaa.bcaresearch.com GAA Asset Allocation
Dear client, Next Monday instead of sending you a Weekly Report we will be hosting a live webcast at 10am EST, addressing the recent market moves and discussing the US equity market outlook. Kind Regards, Anastasios Highlights Portfolio Strategy The passing of the mega fiscal package, turning equity market internals, the collapse in net earnings revisions all underscore that we may have already seen the recessionary equity market lows. Investors with higher risk tolerance and a cyclical 9-12 month time horizon will be handsomely rewarded. Firming operating metrics, the defensive nature of tech services at a time when macro data are about to nosedive, compel us to boost the S&P data processing index to overweight. Grim macro data, the rising threat of a debt deflation spiral, poor operating metrics and lofty valuations, all warn that the path of least resistance is lower for REITs. Recent Changes Boost the S&P data processing index to overweight today. Last week we obeyed our rolling stops in our cyclically underweight position in the S&P homebuilders index and cyclically overweight positions in the S&P hypermarkets and S&P household products indexes for gains of 41%, 26% and 5%, respectively.1 Feature The SPX had a streak of three green days last week as congress finally passed a $2tn fiscal easing bill. In fact the last time the S&P 500 had two consecutive green days was right before its February 19 peak. Our view remains that the risk/reward tradeoff for owning equities is favorable for investors with higher risk tolerance and a cyclical 9-12 month time horizon, as we highlighted last Monday in our “20 reasons to start buying equities” part of our Weekly Report.2 As a reminder, during the Great Recession, equities troughed 20 days after the American Recovery and Reinvestment Act of 2009 took effect on February 17, 2009. Thus if history rhymes, an equity market bottom is likely near if not already behind us. Does this mean the SPX has definitively troughed? Not necessarily, but our playbook/roadmap calls for a retest and hold of the recent lows as we have been highlighting in recent research.3 Keep in mind that S&P 500 futures (ES) have fallen over 36% from peak to trough. This is similar to the median fall during recession bear markets dating back to the Great Depression. Most importantly, comparing the two most recent iterations is instructive in attempting to figure out what is baked in the cake. Namely, in the 9/11 catalyzed recession and subprime mortgage collapse catalyzed recession, EPS got halved. Similarly, equities fell 50% from their respective peaks. If we use that assumption – i.e. a recessionary equity bear market fall predicts the eventual profit drubbing – then what the ES futures clocking in at 2174 discounted is that trailing EPS will fall from $162 to $104 and forward EPS from $177 to $113 (Chart 1). Chart 1Joined At The Hip
Joined At The Hip
Joined At The Hip
While we have no real visibility on EPS, our sense is that we will not fall further than what was already discounted in the broad market. If we are offside and a GFC or Great Depression ensues, then profits will get halved to $81 and the SPX will fall to 1700. Another simple way of looking at the EPS drawdown is by considering $162 as trend EPS. Then for every month that the economy is shut down roughly $13.5 get shaved off EPS. Thus, triangulating both approaches, a $104 EPS level has discounted a shutdown lasting 4 months and 10 days. This is a tall order and we would lean against such extreme pessimism. Meanwhile, analysts are scrambling to cut estimates the world over. Not only SPX net earnings revisions (NER) are at the lowest point since the GFC, but so is the emerging market NER ratio. The Eurozone and Japan are following close behind (Chart 2). Once again the speed of this downward adjustment suggests that a lot of bad news is already priced in now depressed NER. Chart 2Bad News Is Priced In
Bad News Is Priced In
Bad News Is Priced In
Chart 3Market Internals Ticking Higher
Market Internals Ticking Higher
Market Internals Ticking Higher
Moreover, equity market internals underscore that we may have already seen the recessionary equity market lows. Chart 3 shows that hypersensitive small caps have been outperforming their large cap peers of late, chip stocks are sniffing out a reflationary impulse and even emerging markets are besting the SPX. Finally, the best China proxy out there, the Aussie dollar, corroborates the bullish signal from all these indicators and suggests that this mini “risk-on” phase can last a while longer (third panel, Chart 3). Nevertheless, the spike in the TED spread (Treasury-EuroDollar spread, gauging default risk on interbank loans) was quite unnerving last week. While we have shown in the past that equity volatility and credit risk are joined at the hip, this parabolic move in the, up to very recently calm, TED spread disquieted us. We will keep on monitoring it closely as the coronavirus pandemic continues to unfold (Chart 4). Chart 4Disquieting
Disquieting
Disquieting
Another significant risk that this crisis has exposed is the massive non-financial business debt uptake that has taken root during the ten-year expansion (top panel, Chart 5). We deem investors will be more mindful of debt saddled companies going forward, despite the government’s sizable looming bailout of select severely affected industries from the coronavirus pandemic. Stock market reported data also corroborate the national accounts’ debt deterioration data (bottom panel, Chart 5). Chart 5Watch The Debt Burden…
Watch The Debt Burden…
Watch The Debt Burden…
The yield curve has already forewarned that a significant default cycle is looming (Chart 6) and this time is not different. Chart 6…A Default Cycle Looms
…A Default Cycle Looms
…A Default Cycle Looms
Importantly, both the equity and bond markets have been sending these debt distress signals for quite some time now (Chart 7). Chart 7Distress Signals Sent A long Time Ago
Distress Signals Sent A long Time Ago
Distress Signals Sent A long Time Ago
What interest us most from a US equity sector perspective is identifying weak spots that may come under intense pressure in the coming weeks as the economy remains shut down likely until Easter Sunday. Chart 8 shows the current level of net debt-to-EBITDA for the overall non-financial equity market, and the 10 GICS1 sectors (we use telecom services instead of communications services and exclude financials). In more detail, the bar represents the 25 year range of net debt-to EBITDA and the vertical line the current reading for each sector (Appendix 1 below showcases the net debt-to-EBITDA time series for the GICS1 sectors). Chart 8Mind The…
What Is Priced In?
What Is Priced In?
Chart 9 goes a step further and juxtaposes EV/EBITDA with net debt-to EBITDA on a two dimensional map. Real estate and utilities clearly stand out as the most debt burdened sectors, with a pricey valuation (For completion purposes Appendix 2 below delves deeper into sectors and shows net debt-to-EBITDA for the GICS2 sectors). Chart 9…Outliers
What Is Priced In?
What Is Priced In?
Frequent US Equity Strategy readers know that we believe the excesses this cycle have been in the commercial real estate (CRE) segment of the economy, where prices are one standard deviation above the previous peak and cap rates have collapsed to all-time lows fueled by an unprecedented credit binge (Chart 10). This week we reiterate our underweight stance in the S&P real estate sector and boost a defensive tech services index to an overweight stance. Chart 10CRE: The Epitome This Cycle’s Excesses
CRE: The Epitome This Cycle’s Excesses
CRE: The Epitome This Cycle’s Excesses
Reality Bites We continue to recommend investors avoid the S&P real estate sector. For investors seeking defensive protection we would recommend hiding in the S&P health care sector instead, as we highlighted in our mid-March report.4 Chart 11 shows a disturbing breakdown in the inverse correlation between the relative share price ratio and the 10-year Treasury yield. While it makes intuitive sense that this fixed income proxy sector (i.e. high dividend yielding) should move in the opposite direction of the competing risk free yielding asset, at times of tumult this correlation reverts to positive (top panel, Chart 11). In other words, fear grips investors and they frantically shed REITs despite the fact that interest rates collapse. Why? Because these are highly illiquid assets that these REITs are holding and investors demand the “return of” their capital instead of a “return on” their capital when volatility and credit risk soar in tandem (see TED spread, Chart 4). While CRE prices remain extended and vulnerable to a deflationary shock (bottom panel, Chart 11), there is no real price discovery currently as no landlord would dare put any properties for sale in this market starved for liquidity. With the exception of distressed sales, we deem that the “mark to model” mantra will make a comeback, eerily reminiscent of the GFC. Using an example of how all this may play out in the near-term is instructive. As the economy remains shut down, a tenant may forego a rent payment to a landlord and if the landlord is levered and starved of cash, he/she in turn may miss a debt payment to the outfit that holds his mortgage, typically a bank. Chart 11Breakdown
Breakdown
Breakdown
At first sight this may not seem as a big problem on a micro level as the bank may have enough liquidity to withstand a delinquent borrower’s no/late payment. If, however, the bank is itself scrambling for cash, it will foreclose and then put this asset for sale in order to recover some capital. This will put downward pressure on the underlying asset’s price that all borrowing was based upon and a debt deflation spiral ensues (Chart 12). Chart 12Debt Deflation Warning
Debt Deflation Warning
Debt Deflation Warning
The biggest problem however arises from the bond market. If these deflating assets are all in a CLO or concentrated in a select REIT, then our current financial system setup is not really equipped to handle a failure/delay of payment. This is especially true if some bond holders have hedged their bets and bought CDS on these bonds and demand payment as a “default clause” will in practice get triggered. The longer the economy remains shut down, the higher the credit, counterparty and default risks will rise. Therefore, given that the real estate sector has an extremely high reading on a net debt-to-EBITDA basis (Chart 8), we are concerned about the profit prospects of this niche sector in the coming months. Moreover, the economy is in recession and the recent Markit services PMI is a precursor of grim data to follow. Historically, REITs move in the opposite direction to the PMI services survey and the current message is to expect a catch down phase in the former (Chart 13). Adding insult to injury, the supply response especially on the multi-family construction side is perturbing. In fact, multi-family housing starts have gone parabolic hitting 619K recently, the highest reading since 1986! Such a jump in supply is deflationary and will weigh on the relative share price ratio (multi-family starts shown inverted, bottom panel, Chart 13). Chart 13Tiiimber
Tiiimber
Tiiimber
Finally, lofty valuations warn that if our bearish thesis pans out in the coming months, there is no cushion left to absorb a significant profit shock that likely looms (Chart 14). Chart 14No Valuation Cushion
No Valuation Cushion
No Valuation Cushion
In sum, grim macro data, the rising threat of a debt deflation spiral, poor operating metrics and lofty valuations, all warn that the path of least resistance is lower for REITs. Bottom Line: Shy away from the S&P real estate sector. The ticker symbols for the stocks in this index are: BLBG: S5RLST – CCI, AMT, PLD, EQIX, DLR, PSA, SBAC, AVB, EQR, FRT, SPG, WELL, ARE, CBRE, O, BXP, ESS, EXR, DRE, PEAK, HST, MAA, UDR, VTR, WY, AIV, IRM, PEG, VNO, SLG. Boost Data Processing To Overweight We have been offside on the data processing tech sub-index and today we are booking losses of 39% and boosting exposure to overweight. Data processing stocks are a services-based defensive tech index that typically thrive in deflationary and recessionary environments, according to empirical evidence (Chart 15). We are currently in recession, thus a deflationary impulse will grip the economy and investors will flock to defensive tech stocks when growth is scarce. Tack on the spike in the greenback, and the disinflationary backdrop further boosts the allure of these tech services stocks (third panel, Chart 15). Beyond the recessionary related tailwinds, data processing stocks should also enjoy firming relative demand. While the two bellwether stocks, V and MA, will suffer from the decrease in consumption that requires physical visits and from select services outlays that are severely affected by the coronavirus, online spending by households and corporations should at least serve as a partial offset. Chart 15Time To Buy Defensive Tech
Time To Buy Defensive Tech
Time To Buy Defensive Tech
Chart 16What’s not To Like?
What’s not To Like?
What’s not To Like?
Already, industry pricing power gains have been accelerating at a time when overall inflation has been tame. This will boost revenues – and given high operating leverage and high and rising profit margins – that will flow straight through to profits (Chart 16). While relative profit growth and sales estimates may appear uncharacteristically high and unrealistic to attain, this is what usually transpires in recessions: sell side analysts trim SPX profit and revenue forecasts more aggressively than they do for the defensive data processing index (Chart 17). In fact, given that we are still in the early stages of recession, we expect a further surge in relative EPS and sales estimates in the coming months. Chart 17Seeking Growth When Growth Is Scarce
Seeking Growth When Growth Is Scarce
Seeking Growth When Growth Is Scarce
Chart 18Risk: Lofty Valuations
Risk: Lofty Valuations
Risk: Lofty Valuations
However, there is a key risk to our bullish stance in this tech service index: valuations. Relative valuations are still pricey despite the recent fall from three standard deviations above the historical mean to half that, according to our relative valuation indicator. Technicals have also corrected from an extremely overbought reading, but a cleansing washout has yet to occur (Chart 18). Netting it all out, firming operating metrics and the defensive nature of tech services at a time when macro data are about to nosedive, compel us to boost the S&P data processing index to overweight. Bottom Line: Boost the S&P data processing index to overweight today from previously underweight for a loss of 39% since inception. The ticker symbols for the stocks in this index are: BLBG: S5DPOS – ADP, V, MA, PYPL, FIS, FISV, GPN, PAYX, FLT, BR, JKHY, WU, ADS. Anastasios Avgeriou US Equity Strategist anastasios@bcaresearch.com Appendix 1 Chart A1Appendix A1
Appendix A1
Appendix A1
Chart A2Appendix A2
Appendix A2
Appendix A2
Appendix 2 Chart A3
What Is Priced In?
What Is Priced In?
Chart A4
What Is Priced In?
What Is Priced In?
Footnotes 1 Please see BCA US Equity Strategy Daily Report, “Housekeeping” dated March 26, 2020, available at uses.bcaresearch.com. 2 Please see BCA US Equity Strategy Weekly Report, “The Darkest Hour Is Just Before The Dawn” dated March 23, 2020, available at uses.bcaresearch.com 3 Please see BCA US Equity Strategy Daily Report, “Gravitational Pull” dated March 12, 2020, available at uses.bcaresearch.com. 4 Please see BCA US Equity Strategy Weekly Report, “Inflection Point” dated March 16, 2020, available at uses.bcaresearch.com. Current Recommendations Current Trades Strategic (10-Year) Trade Recommendations
What Is Priced In?
What Is Priced In?
Size And Style Views June 3, 2019 Stay neutral cyclicals over defensives (downgrade alert) January 22, 2018 Favor value over growth May 10, 2018 Favor large over small caps (Stop 10%) June 11, 2018 Long the BCA Millennial basket The ticker symbols are: (AAPL, AMZN, UBER, HD, LEN, MSFT, NFLX, SPOT, TSLA, V).
Highlights China’s capital spending is likely to gradually recover in the second half of 2020. We project 6-8% growth in Chinese traditional infrastructure investment and a 30-50% increase in tech-related infrastructure investment by the end of 2020. There will not be much stimulus to boost housing demand. Commodities and related global equity sectors as well as global industrial stocks are approaching buy territory in absolute terms. Semiconductor stocks are attractive on a 12-month time horizon but still face near-term risks. Chinese property developer stocks remain at risk. Feature Chart I-1Chinese Growth Is Worse Now Than In 2008
Chinese Growth Is Worse Now Than In 2008
Chinese Growth Is Worse Now Than In 2008
Lockdowns during the Covid-19 outbreak have already caused much larger and more widespread damage to the Chinese economy than what occurred both in 2008 and in 2015 (Chart 1). Even though the spread of Covid-19 looks to be largely under control, China’s domestic economy is only in gradual recovery mode, and Chinese authorities are preparing to inject more stimulus to reinvigorate growth. The important questions are where and how large the stimulus will likely be. Infrastructure development will be the major focus this year, including both traditional and tech-related infrastructure. The former includes three categories: (1) Transport, Storage and Postal Services, (2) Water Conservancy, Environment & Utility Management, and (3) Electricity, Gas and Water Production and Supply. The latter encompasses Information Transmission, Software and Information Technology Services, such as 5G networks, industrial internet, and data centers. The current emphasis of stimulus differs from the 2009 one which was more broad-based and spanned across not only infrastructure but also the property and auto sectors. It also differs from the 2016 stimulus measures, which had a heavy emphasis on the property market. Overall, the scale of combined traditional infrastructure and property market stimulus in 2020 will be smaller than what was put forward in 2009, 2012 and 2015-‘16. We estimate Chinese traditional infrastructure investment will increase by about RMB1 trillion to RMB1.5 trillion (6-8% year-on-year), while tech-related new infrastructure investment will be boosted by RMB 240 billion to RMB400 billion (30-50% year-on-year) (Chart 2). Together, the infrastructure stimulus will be about RMB1.3 trillion to 1.9 trillion, amounting to 3.2-4.5% of nominal gross fixed capital formation (GFCF) and 1.3-1.9% of nominal GDP (Table 1). The Chinese property market is unlikely to receive much stimulus on the demand side this time as, “houses are for living in, not for speculation,” will remain the main policy mantra. That said, there will be some support for developers, helping somewhat ease extremely tight financing conditions. Chart 2Chinese Infrastructure Investment: A Boost Ahead
Chinese Infrastructure Investment: A Boost Ahead
Chinese Infrastructure Investment: A Boost Ahead
Table 1Projections Of Traditional And Tech Infrastructure Investment In 2020
Chinese Economic Stimulus: How Much For Infrastructure And The Property Market?
Chinese Economic Stimulus: How Much For Infrastructure And The Property Market?
Restarting The Infrastructure Engine Tech Infrastructure: The authorities recently repeatedly emphasized the importance of “new infrastructure”1 development. This includes 5G networks, the industrial internet, inter-city transit systems, vehicle charging stations, and data centers. Strategic investment in indigenously produced leading technologies, the ongoing geopolitical confrontation with the US and the need to boost growth are behind the government’s aim for an acceleration in “new infrastructure” investment this year. China will significantly boost the pace of its strategic 5G network deployment as well as other tech-related investment. The growth of total tech infrastructure investment was 30-40% during the 4G-network development ramp-up in 2014. As the 5G network is much more costly to build than 4G, we expect growth within tech infrastructure investment to be 30-50% this year. This translates to an increase of RMB 240 billion to RMB400 billion in tech infrastructure investment in 2020, equaling around 0.2% to 0.4% of the country’s 2019 GDP (Table 1 on page 3). Chart 3Components Of Traditional Infrastructure Investment
Components Of Traditional Infrastructure Investment
Components Of Traditional Infrastructure Investment
Traditional Infrastructure: Growth in traditional infrastructure has been weak at around 3% year-on-year in 2019, in line with our analysis last August. However, we are now expecting growth to accelerate to 6-8% by the end of this year, across all three categories of traditional infrastructure (Chart 3). In the past two months, the central government has clearly sped up the pace in reviewing and approving infrastructure projects related to power generation and distribution, transportation (railways, highways, waterways, airports, subways, etc.), and new energy. As the central government enforces increasingly stringent rules on environmental protection, investment in environmental management is likely to accelerate. Public utility management investment, which accounts for a massive 45% of overall infrastructure investment, includes sewer systems, sewer treatment facilities, waste treatment and disposal, streetlights, city roads construction, parks, bridges and tunnels. As the country’s urbanization process continues and more townships and city suburbs are developed, public utility management investment will register solid growth. The 6-8% year-on-year growth in traditional infrastructure investments by the end of this year equals to an increase of RMB1 trillion to RMB1.5 trillion in 2020. Adding up the increase of RMB 240 billion to RMB400 billion for tech-related infrastructure investment, total infrastructure spending will be RMB1.3 trillion to RMB1.9 trillion, or 1.3-1.9% of GDP (Table 1 on page 3). Bottom Line: We project 6-8% year-on-year growth in Chinese traditional infrastructure investment and a 30-50% year-on-year increase in tech-related infrastructure investment. Sources Of Infrastructure Financing Significant increases in special bond issuance, loosening public-private-partnerships (PPP) restrictions and possible Pledged Supplementary Lending (PSL) injections should enable local governments to provide sufficient funding for planned infrastructure investment projects. Net Special Bond Issuance Local government net special bond issuance, which is mainly used to fund infrastructure projects, has been one main source of financing. Last year, the amount of net special bond issuance was about RMB 2 trillion,2 accounting for about 11% of total infrastructure investment (both tech-related and traditional). This year, the annual quota on local government special bonds is still unknown, as the NPC meeting has been postponed due to the Covid-19 outbreak. Given that last year’s quota was RMB2.15 trillion, RMB 800 billion higher than in the previous year (25% growth over 2018), it is reasonable to expect the quota for 2020 will be set at RMB 3.15-3.65 trillion, a 30-35% increase from 2019. This increase alone will be able to finance 70-80% of the RMB1.3 trillion to RMB1.9 trillion additional funding required for the infrastructure investments planned for this year. Consequently, the share of special bonds in total infrastructure spending in 2020, if these projections materialize, will rise to 15-17% from 11% in 2019. Chart 4Public-Private-Partnerships Financing Will Recover This Year
Public-Private-Partnerships Financing Will Recover This Year
Public-Private-Partnerships Financing Will Recover This Year
Public-Private-Partnerships (PPP) PPPs involve a collaboration between local governments and private companies. The PPP establishment can allow the local governments to reduce local governments’ burden of financing infrastructure. Due to tightened regulations on PPP projects since late 2017, PPP financing plunged 75% from about RMB 5 trillion in 2017 to RMB 1.2 trillion in 2019. Its share of total infrastructure investment had also tumbled from nearly 30% in early 2017 to 6% in 2019 (Chart 4). However, in recent months, the Chinese government has started to loosen up the restrictions on PPP projects, by releasing three announcements within a month (Box 1). We believe recent government actions will lead to a pickup in PPP financing. Box 1 The Authorities: Loosening Up of PPP-Related Policies On February 12, the Finance Ministry released a notice demanding local governments “accelerate and strengthen PPP projects’ reserve management.” On February 28, the Finance Ministry released a contract sample of sewage water and garbage disposal projects, aiming to help local governments to more effectively proceed with such projects. On March 10, the website of the National Development and Reform Commission demanded local governments utilize the national PPP project information management and monitoring platform, actively attracting private capital and starting the projects as soon as possible. In addition, the government will likely make efforts to reduce financial and operating costs of some infrastructure projects in order to increase the risk-to-return attractiveness of such projects for private investors. The authorities may order both policy banks and commercial banks to give preferential loans to certain infrastructure projects (i.e., low-interest and long-term loans from policy banks). Moreover, the government can also provide tax breaks, offer land at a reduced cost, and other supportive policies to certain infrastructure projects. Putting it all together, we expect PPP financing to grow 10-20% and provide additional funding of RMB120 billion to RMB240 billion to China’s infrastructure development in 2020. Pledged Supplementary Lending Chart 5Possible Pledged Supplementary Lending Injections In Infrastructure Projects
Possible Pledged Supplementary Lending Injections In Infrastructure Projects
Possible Pledged Supplementary Lending Injections In Infrastructure Projects
Some Chinese government officials have hinted that policy banks may start using PSL injections to boost domestic infrastructure investment.3 Speculation among China watchers is that the scale of PSL injections will be RMB600 billion this year (Chart 5). In comparison, PSL net lending for the property market ranged from RMB 630 to 980 billion in the years 2015-2018. Bottom Line: Odds are that a significant increase in special bond issuance, loosening PPP restrictions and possible PSL injections will be sufficient to offset the decline in other funding sources. Consequently, a moderate acceleration in traditional infrastructure investment and very strong growth in tech-related infrastructure expenditures is likely. What About Stimulus In The Property Sector? Stimulus for the property sector this time will be less forceful than the ones in both 2009 and 2016. In addition, structural property demand in China has already entered a saturation phase, drastically different from previous episodes when demand still had strong underlying growth. Altogether, the outlook for property sales in China is not promising. “Houses are for living in, not for speculation” will remain the main policy focus in the Chinese property market. That said, authorities will help ease developers’ extremely tight financing conditions. No stimulus on demand: Three cities (Zhumadian, Baoji, Guangzhou) that had released policies to loosen up restrictions on the demand side (e.g., cutting down payment from 30% to 20%, allowing larger amounts of borrowing for homebuyers) were ordered to retract their announcements within a week. There will be very little PSL lending into the property market in 2020, in line with the government’s goal of curbing speculation in the property market. Some supportive polices for developers: Over 60 cities have released policies on the supply side (e.g., delaying developers’ land transaction payments, waiving fines for breaches of start and completion dates, etc.), mainly helping property developers overcome their extreme funding shortages. Given housing unaffordability and lack of demand, we expect floor space sold to contract slightly in 2020 (Chart 6, top panel). In the meantime, we expect a slight pickup in property starts (Chart 6, middle panel). In order to stay afloat, property developers have to maintain rising floor space starts for presales to gain some funding – a fund-raising scheme for Chinese real estate developers that we discussed in detail in prior reports. In addition, we also expect moderate growth in property completions in the commodity buildings market (Chart 6, bottom panel). The pace of property completion has to be accelerated as property developers are currently under increased pressure to deliver units that were pre-sold about two years ago. This will lift construction activity in the commodity buildings market (Chart 7). Chart 6Commodity Buildings: Divergences Among Sales, Starts And Completions
Commodity Buildings: Divergences Among Sales, Starts And Completions
Commodity Buildings: Divergences Among Sales, Starts And Completions
Chart 7Commodity Buildings: Construction Activities
Commodity Buildings: Construction Activities
Commodity Buildings: Construction Activities
Please note that commodity buildings are a small subset of total constructed buildings in China, and as a subset do not provide a full picture of construction activity. The official data show that commodity buildings account for only 24% of total constructed buildings in terms of floor space area completed. In terms of a broader measure of the Chinese property market, we still expect a continuing contraction – albeit less than last year – in “building construction” floor area started and completed (Chart 8). Bottom Line: There will not be much stimulus to boost housing demand. Yet authorities will ease financial constraints on property developers that will allow them to complete housing currently under construction. Chart 8Building Construction Versus Commodity Housing
Building Construction Versus Commodity Housing
Building Construction Versus Commodity Housing
Chart 9Commodities And Related Equity Sectors Are Approaching A Bottom
Commodities And Related Equity Sectors Are Approaching A Bottom
Commodities And Related Equity Sectors Are Approaching A Bottom
Investment Implications Traditional infrastructure spending in China will post a moderate recovery in 2020, with most gains occurring in the second half of the year. Consistently, we believe the segments of Chinese and global markets leveraged to the infrastructure cycle – commodities and related equity sectors as well as industrial stocks – are approaching buying territory in absolute terms. Prices of segments have collapsed, creating a good entry point in the coming weeks (Chart 9, 10 and 11). Chart 10A Buying Time May Be Not Far For Industrial Stocks…
A Buying Time May Be Not Far For Industrial Stocks...
A Buying Time May Be Not Far For Industrial Stocks...
Chart 11…And Machinery Stocks
...And Machinery Stocks
...And Machinery Stocks
China’s spending on itech-related infrastructure will post very strong growth in 2020. Even though global semiconductor stocks have sold off considerably, they have not underperformed the global equity benchmark. In the near term, we believe risks are still to the downside for technology and semi stocks (Chart 12). However, this down-leg will create a good buying opportunity. We are watching for signs of capitulation in this sector to buy. Finally, concerning Chinese property developers, their share prices will likely underperform their respective Chinese equity benchmarks in the next nine months (Chart 13). Meanwhile, the absolute performance of property stocks listed on the domestic A-share market remains at risk (Chart 13, bottom panel). Chart 12Semi Stocks: Final Down-leg Is Possible
Semi Stocks: Final Down-leg Is Possible
Semi Stocks: Final Down-leg Is Possible
Chart 13Chinese Property Developers Are Still At Risk
Chinese Property Developers Are Still At Risk
Chinese Property Developers Are Still At Risk
Ellen JingYuan He Associate Vice President ellenj@bcaresearch.com Footnotes 1 To gauge the scale of the “new infrastructure”, we are using the National Bureau of Statistics data of “investment in information transmission, software and information technology service”. This tech-related infrastructure investment measure includes 5G networks, industrial internet, and data centers, while inter-city transit systems and vehicle charging stations may be included in the transportation investment. 2 Please note that the amount of net special bond issuance was the actual amount of funding used in infrastructure projects. It was smaller than the RMB 2.15 trillion quota because a small proportion of issuance were used to repay some existing special bonds due in the year. 3 http://www.xinhuanet.com/money/2020-02/19/c_1125593807.htm
Dear Client, Next week we will be publishing a joint Special Report on the Chinese infrastructure investment outlook with our Emerging Markets Strategy service, authored by my colleague Ellen JingYuan He. Best regards, Jing Sima, China Strategist Feature Chart I-1Chinese Non-Financial Corporations Are Heavily Indebted
Chinese Non-Financial Corporations Are Heavily Indebted
Chinese Non-Financial Corporations Are Heavily Indebted
There are fears that the two-month hiatus in China’s business activities due to the COVID-19 epidemic has sparked acute cash shortages among Chinese companies. In turn, this has increased the danger that the highly leveraged Chinese corporate sector may be pushed into widespread insolvency (Chart I-1). The number of bankruptcies will undoubtedly climb, but small and micro firms are most at risk versus larger companies that have deeper cash reserves and easier access to financing. Our analysis shows that, before the outbreak hit China in January, companies listed in China’s onshore and offshore equity markets exhibited relatively healthy financial statements with adequate operating cash flows to cover debt obligations. This increases the probability that Chinese listed companies will survive the economic and financial shocks from the epidemic, and that their stock prices will rebound along with the expectations of a recovery in the Chinese economy. Chart I-2Both Chinese Economy And Corporate Profits Are Largely Driven By Domestic Demand
Both Chinese Economy And Corporate Profits Are Largely Driven By Domestic Demand
Both Chinese Economy And Corporate Profits Are Largely Driven By Domestic Demand
It also appears that China’s domestic economy is relatively insulated from the global financial market turmoil and impending global recession. China’s corporate profit outlook is dominated by domestic economic conditions rather than external demands. This view is also reflected in the relative performance of Chinese onshore and offshore stocks (Chart I-2). Moreover, the charts in the Appendix illustrate that corporate financial ratios in almost all sectors of China’s onshore and offshore equity markets have somewhat improved from the previous economic down cycle that began in 2014. This underscores our view that if reflationary measures overcompensate for the economic slowdown, as in the 2015/2016 easing cycle, then Chinese stocks will likely rally in absolute terms, as well as outperform global benchmarks. We selected three categories of financial ratios to monitor profitability, leverage and operating cash flow conditions of Chinese domestic and investable listed non-financial companies (Table I-1).1 The financial data in our exercise are from Refinitiv Datastream Worldscope. Its corresponding stock price indexes for China’s overall market and sectors most closely resemble the MSCI China Index and the MSCI China Onshore index. Table I-1
Monitoring Cash Flow Conditions In Chinese Listed Companies
Monitoring Cash Flow Conditions In Chinese Listed Companies
It is also noted that the Chinese investable index, excluding financial companies, is dominated by large technology companies such as Alibaba, Tencent, and Baidu.2 These tech companies generally have more adequate cash flows and lower debt ratios than the more capital intensive sectors such as industrial and energy. The analysis we present in this report on non-financial companies in the offshore market, therefore, is not indicative of China’s overall corporate financial health. Rather, our findings are indicative of how investors should view the listed companies and their sector performance within China’s investable market. Several observations from our analysis of the listed companies’ financial ratios are noteworthy: Chinese non-financial corporations are highly leveraged, and have not de-levered much despite the financial deleverage campaign that began in late 2017. Contrary to the belief that Chinese corporates’ financial health is significantly weaker than that in developed economies, the leverage ratio, profit margins, and debt-servicing ability among Chinese domestic and investable non-financial companies are actually in the range of their global peers (Chart I-3). Yet, Chinese companies trade at substantial discounts to global benchmarks. This is particularly evident in the offshore market, whereas domestic Chinese stocks were priced at a discount until the recent global market selloffs (Chart I-4). This underpins our view that, when China’s economy and corporate profits recover, Chinese stocks should outperform their global benchmarks on a cyclical time horizon. Importantly, with a stronger aggregate corporate financial health and a large price discount. Chinese investable non-financial stocks have more upside potential than their domestic counterparts. Chart I-3Financial Health Among Listed Chinese Companies Comparable With DMs
Financial Health Among Listed Chinese Companies Comparable With DMs
Financial Health Among Listed Chinese Companies Comparable With DMs
Chart I-4Chinese Investable Stock Prices Remain Deeply Discounted Relative To Global Benchmarks
Chinese Investable Stock Prices Remain Deeply Discounted Relative To Global Benchmarks
Chinese Investable Stock Prices Remain Deeply Discounted Relative To Global Benchmarks
Utilities, machinery, industrials and construction materials are among the sectors with the lowest cash flow-to-interest expense ratios, in both China’s domestic and investable markets. In particular, machinery, industrials and construction materials are pro-cyclical sectors and their profit growth is positively correlated with economic growth. Their low profitability and high leverage contribute to their poor cash flows. Those sectors have been severely impacted by the stoppages in manufacturing and construction activities due to the COVID-19 epidemic in China, making them vulnerable to cash shortages. However, there is a low risk of a broad-based default among these firms, because state-owned enterprises (SOEs) dominate these sectors in the Chinese equity market. The stock performance in these sectors is also extremely sensitive to shifts in China’s monetary and policy stance, and thus should benefit from the recent loosening in monetary conditions and the push for a substantial increase in infrastructure investment this year. Chart I-5Small Property Developers In China Are Much More Vulnerable To Cash Shortages Than Large Ones
Small Property Developers In China Are Much More Vulnerable To Cash Shortages Than Large Ones
Small Property Developers In China Are Much More Vulnerable To Cash Shortages Than Large Ones
The leverage ratio in the real estate sector has doubled in the past 10 years. The sector’s cash flow-to-total liabilities ratio has also declined sharply since 2017, when the authorities tightened lending standards to property developers. However, the sector’s aggregate cash flow situation is still an improvement from its lowest point in 2014, in both China’s domestic and investable markets. The countrywide lockdowns in January and February will undoubtedly have severe impacts on Chinese property developers’ cash flows. But the real estate sector is perhaps the best example in exhibiting a pronounced divergence in cash flow conditions between larger and smaller firms. Chart I-5 shows that, while the median ratio of cash-to-total liabilities tuned negative among 76 domestic listed real estate developers, the average ratio from total companies in the same sector suggests that the cash situation has actually improved since mid-2018. This divergence indicates that larger developers have more solid financial fundamentals and easier access to liquidity compared with their smaller counterparts, even before the lockdowns. We expect the divergence in cash flow conditions to widen in the coming months, and smaller property developers will face intensifying pressure to consolidate. China’s domestic healthcare companies have a much better cash balance than the investable healthcare sector, which has the lowest ratio of cash-to-interest expenses among all sectors. The poor cash flow conditions in investable healthcare companies are due to high leverage and low profitability, as well as high operating costs and R&D expenses. Chinese domestic healthcare sector has outperformed the broad market since the epidemic broke out in January. While we think the overall Chinese investable stocks have more upside than their domestic peers, domestic healthcare companies’ lower leverage ratio, stronger cash flows, and much higher profit margin make the sector a better bet than investable healthcare stocks on a cyclical time horizon (Chart I-6). Chart I-6Domestic Healthcare Sector Likely To Continue Outperforming The Broad Market
Domestic Healthcare Sector Likely To Continue Outperforming The Broad Market
Domestic Healthcare Sector Likely To Continue Outperforming The Broad Market
Chart I-7Energy Stocks Will Remain Depressed Until Oil Prices Rebound
Energy Stocks Will Remain Depressed Until Oil Prices Rebound
Energy Stocks Will Remain Depressed Until Oil Prices Rebound
Historically, there has been a strong positive correlation between the energy sector’s profitability, cash flow conditions, stock performance and crude oil prices (Chart I-7). In the past two years, the sector’s leverage ratio has risen, profit margins have thinned and the cash flow situation has sharply deteriorated to the same level as in 2014 when oil prices collapsed. The ongoing oil price rout will generate powerful deflationary forces in the energy sector and will likely further deteriorate energy firms’ profitability and cash flow. While we stay long cyclical stocks versus defensives on both a 0-3 month and a 6-12 month view, we recommend a cautious stance towards energy stocks until the evolving oil price war situation is clarified. Qingyun Xu, CFA Senior Analyst qingyunx@bcaresearch.com Jing Sima China Strategist jings@bcaresearch.com Appendix Overall Markets Excluding Financials
Overall Markets Excluding Financials Sector
Overall Markets Excluding Financials Sector
Consumer Discretionary Sector
Consumer Discretionary Sector
Consumer Discretionary Sector
Consumer Staples Sector
Consumer Staples Sector
Consumer Staples Sector
Real Estate Sector
Real Estate Sector
Real Estate Sector
Automobile Sector
Small Property Developers In China Are Much More Vulnerable To Cash Shortages Than Large Ones
Small Property Developers In China Are Much More Vulnerable To Cash Shortages Than Large Ones
Machinery Sector
Machinery Sector
Machinery Sector
Industrials Sector
Industrials Sector
Industrials Sector
Construction Materials Sector
Construction Materials Sector
Construction Materials Sector
Telecommunications Sector
Telecommunications Sector
Telecommunications Sector
Technology Sector
Technology Sector
Technology Sector
Healthcare Sector
Healthcare Sector
Healthcare Sector
Energy Sector
Energy Sector
Energy Sector
Utilities Sector
Utilities Sector
Utilities Sector
Footnotes 1 We exclude banks and financial institutions from this analysis, due to discrepancy in Chinese banks’ accounting measures from those of non-financial corporations’. 2 Alibaba, Tencent, Baidu, and JD together account for nearly 40% of the non-financial market cap in Chinese investable index. Cyclical Investment Stance Equity Sector Recommendations
Big Changes
Big Changes
Underweight Our intra-sector positioning shifts with the recent S&P tech hardware storage & peripherals downgrade to underweight1 and this Monday’s trimming of the S&P software index to neutral, reduce the S&P tech sector to a below benchmark allocation. Business investment in tech has been losing market share for the better part of the last year and according to the national accounts tech capex is contracting. Excluding the software industry, capital outlays are in dire straits (top & second panels). Meanwhile, lofty valuations, with the tech forward P/E trading at a 20% premium to the overall market, signal that there is no cushion for this deep cyclical sector that has 60% of sales originating abroad, the largest among its GICS1 peers (third panel). Tach on the coronavirus outbreak, and if supply chain breakdowns increase over the course of the next few weeks, then more tech profit warnings are looming and the resulting hit to still ultra-wide relative profit margins and EPS will likely be severe (bottom panel). Bottom Line: We trimmed the S&P tech sector to underweight. For more details, please refer to this Monday’s Weekly Report. Footnotes 1 Please see BCA US Equity Strategy Weekly Report, "Crosscurrents" dated February 3, 2020, available at uses.bcaresearch.com.
Crystallizing Gains
Crystallizing Gains
Neutral Market events last week compelled us to take profits of 51% in the S&P software index above and beyond the S&P 500’s return since the late-2017 inception and downgrade exposure to neutral. Last Monday we wrote that AAPL’s profit warning was the tip of the iceberg and an avalanche of warnings would ensue.1 MSFT followed suit and issued their own profit warning and this negative backdrop is not yet reflected in the sell side’s S&P software profit and revenue forecasts. Tack on the message from the contracting software sector deflator and odds are high that sales will underwhelm in the coming quarters (third panel). The latest GDP report also revealed that, up to recently bulletproof, software capex growth sunk to nil in Q4 (bottom panel). Not only in absolute, but also in relative terms software outlays have petered out and have been decreasing in intensity as measured by the decelerating contribution to GDP growth (second panel). Bottom Line: We took profits of 51% since inception in the S&P software index and downgraded to neutral. The ticker symbols for the stocks in this index are: BLBG: S5SOFT – MSFT, ADBE, CRM, ORCL, INTU, NOW, ADSK, ANSS, SNPS, CDNS, FTNT, PAYC, CTXS, NLOK. For more details, please refer to this Monday’s Weekly Report. 1 Please see BCA US Equity Strategy Weekly Report, "Vertigo" dated February 24, 2020, available at uses.bcaresearch.com.
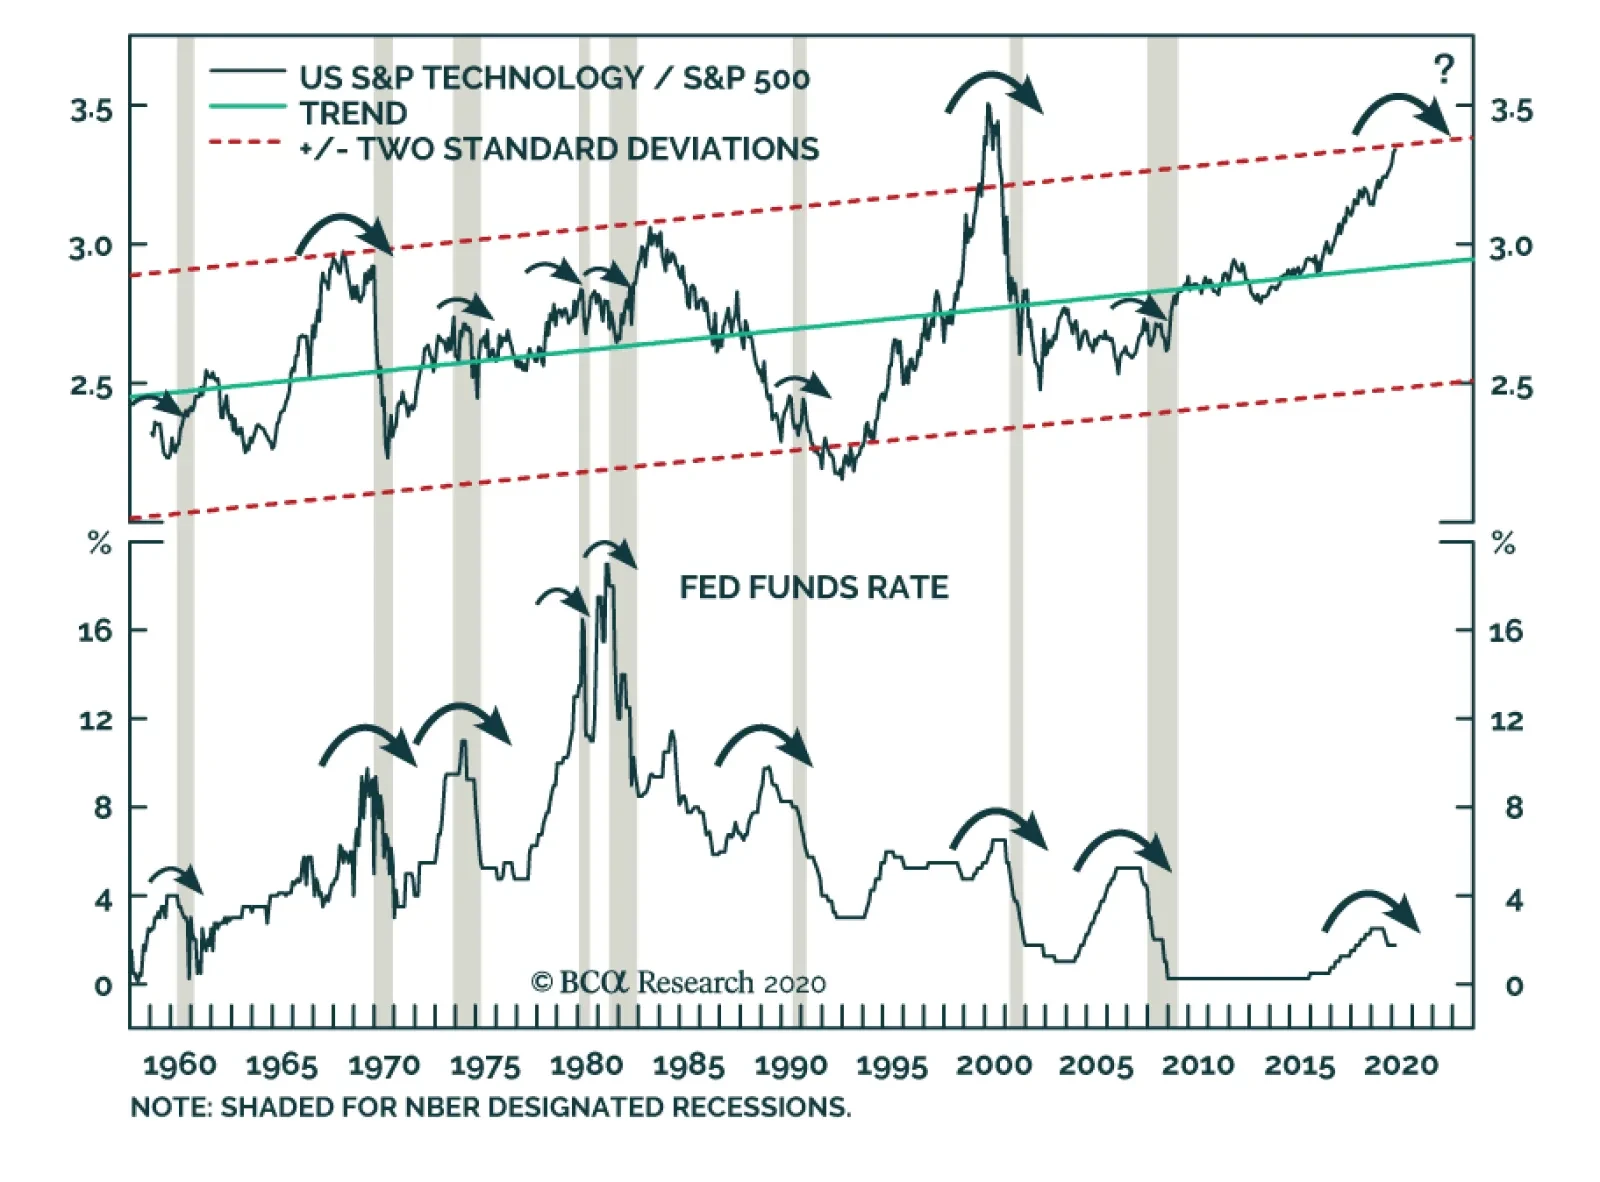
Yesterday, BCA Research's US Equity Strategy service downgraded the S&P tech sector to underweight. Tech stocks are stretched, trading near two standard deviations above the historical time trend, a level that has marked three previous peaks since…