Technology

Neutral (Downgrade Alert) Tech stocks have been on a tear with the sector besting the SPX by over 40% since 2015. While such a breakneck pace is unsustainable, what is missing from this outperformance is relative forward earnings participation. Specifically, on a sub sector level, our newly created S&P semiconductors earnings model is flashing a red light as it forecasts the steepest contraction in semi earnings since the GFC. Meanwhile, relative share prices have rallied ~15% since the mid-2019 lows highlighting the prevalent euphoria in semi equities. Bottom Line: We remain on the sidelines in the S&P semiconductors index, but we have entered into a tactical S&P semi equipment underweight position. Please see the recent Weekly Report for more details.
Semi Earnings Model
Semi Earnings Model
Disconnected
Disconnected
Underweight Bellwether CSCO’s latest guidance was weak and confirmed that the capex-laden S&P communications equipment tech sub-index is in for a rough ride. Worryingly, CSCO’s key enterprise segment has no pulse. Historically, this data series has been positively correlated with telecom carrier capital outlays and the current message is grim (second panel). Tack on the ongoing manufacturing recession with CEOs canceling/postponing capital spending plans and the outlook dims further for the revenue prospects of communications equipment vendors (third & bottom panels). Adding insult to injury, the US/China trade war is further complicating the picture as the ongoing tariffs have exacerbated the global growth slowdown, and global capex plans have come under intense scrutiny. Bottom Line: Continue to avoid the S&P communications equipment index. The ticker symbols for the stocks in this index are: BLBG – S5COMM – CSCO, JNPR, MSI, ANET, FFIV. Please refer to this Monday’s Weekly Report for more details.
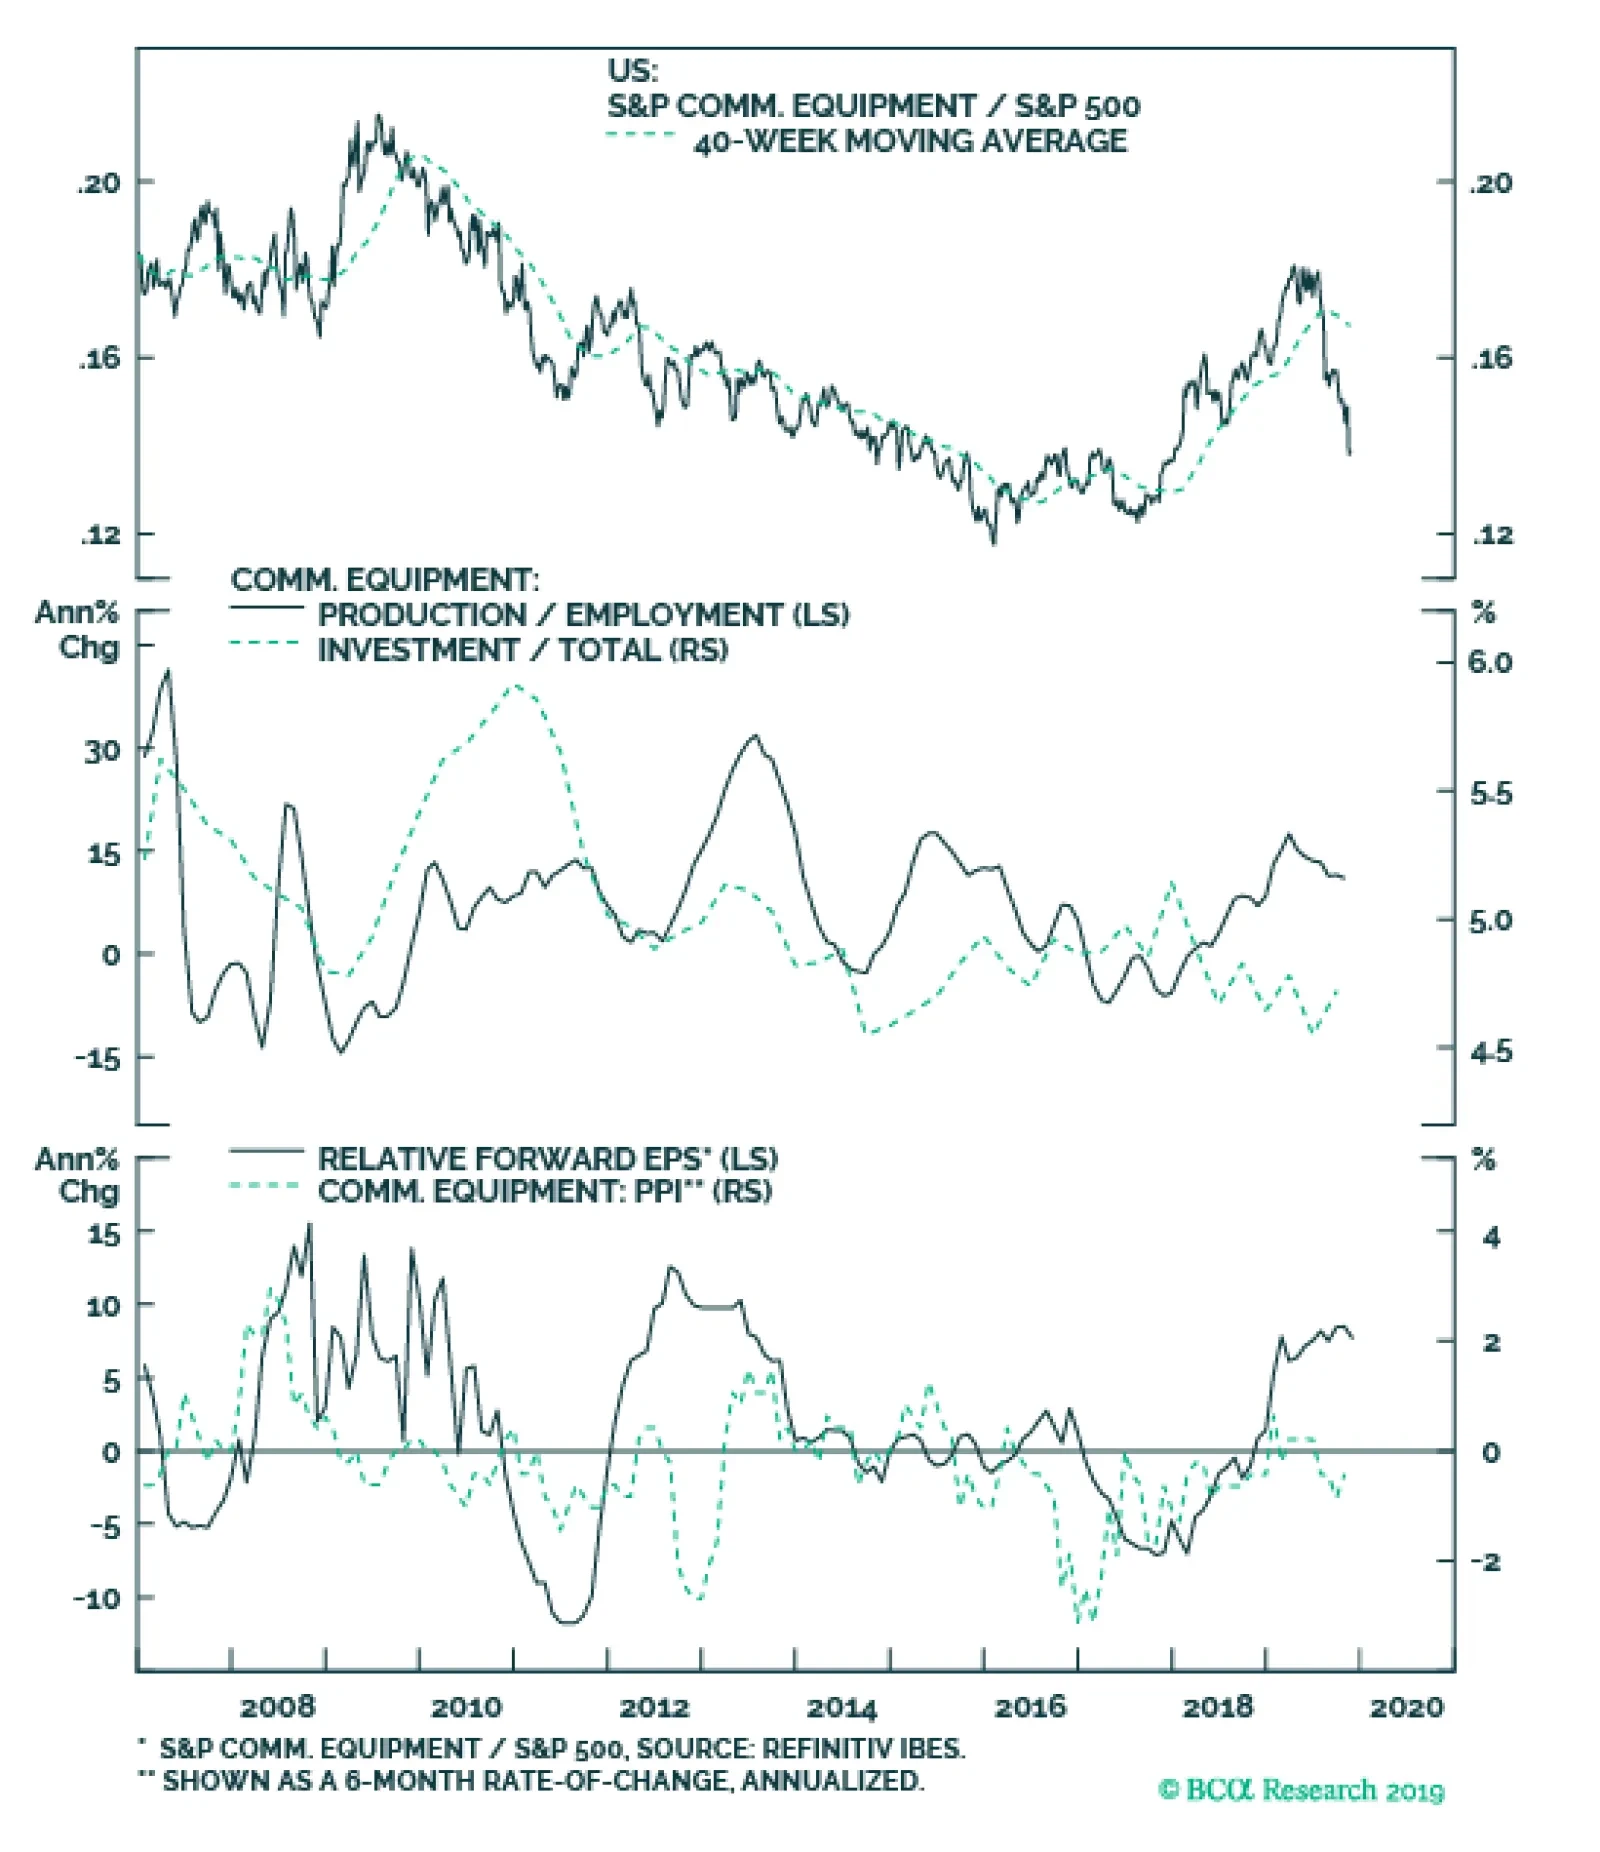
The communications equipment rally stalled early in the summer and has since morphed into a bear market. The darkening profit outlook for this niche tech sub-group warrants remaining underweight. Bellwether CSCO’s latest guidance was weak and confirmed…
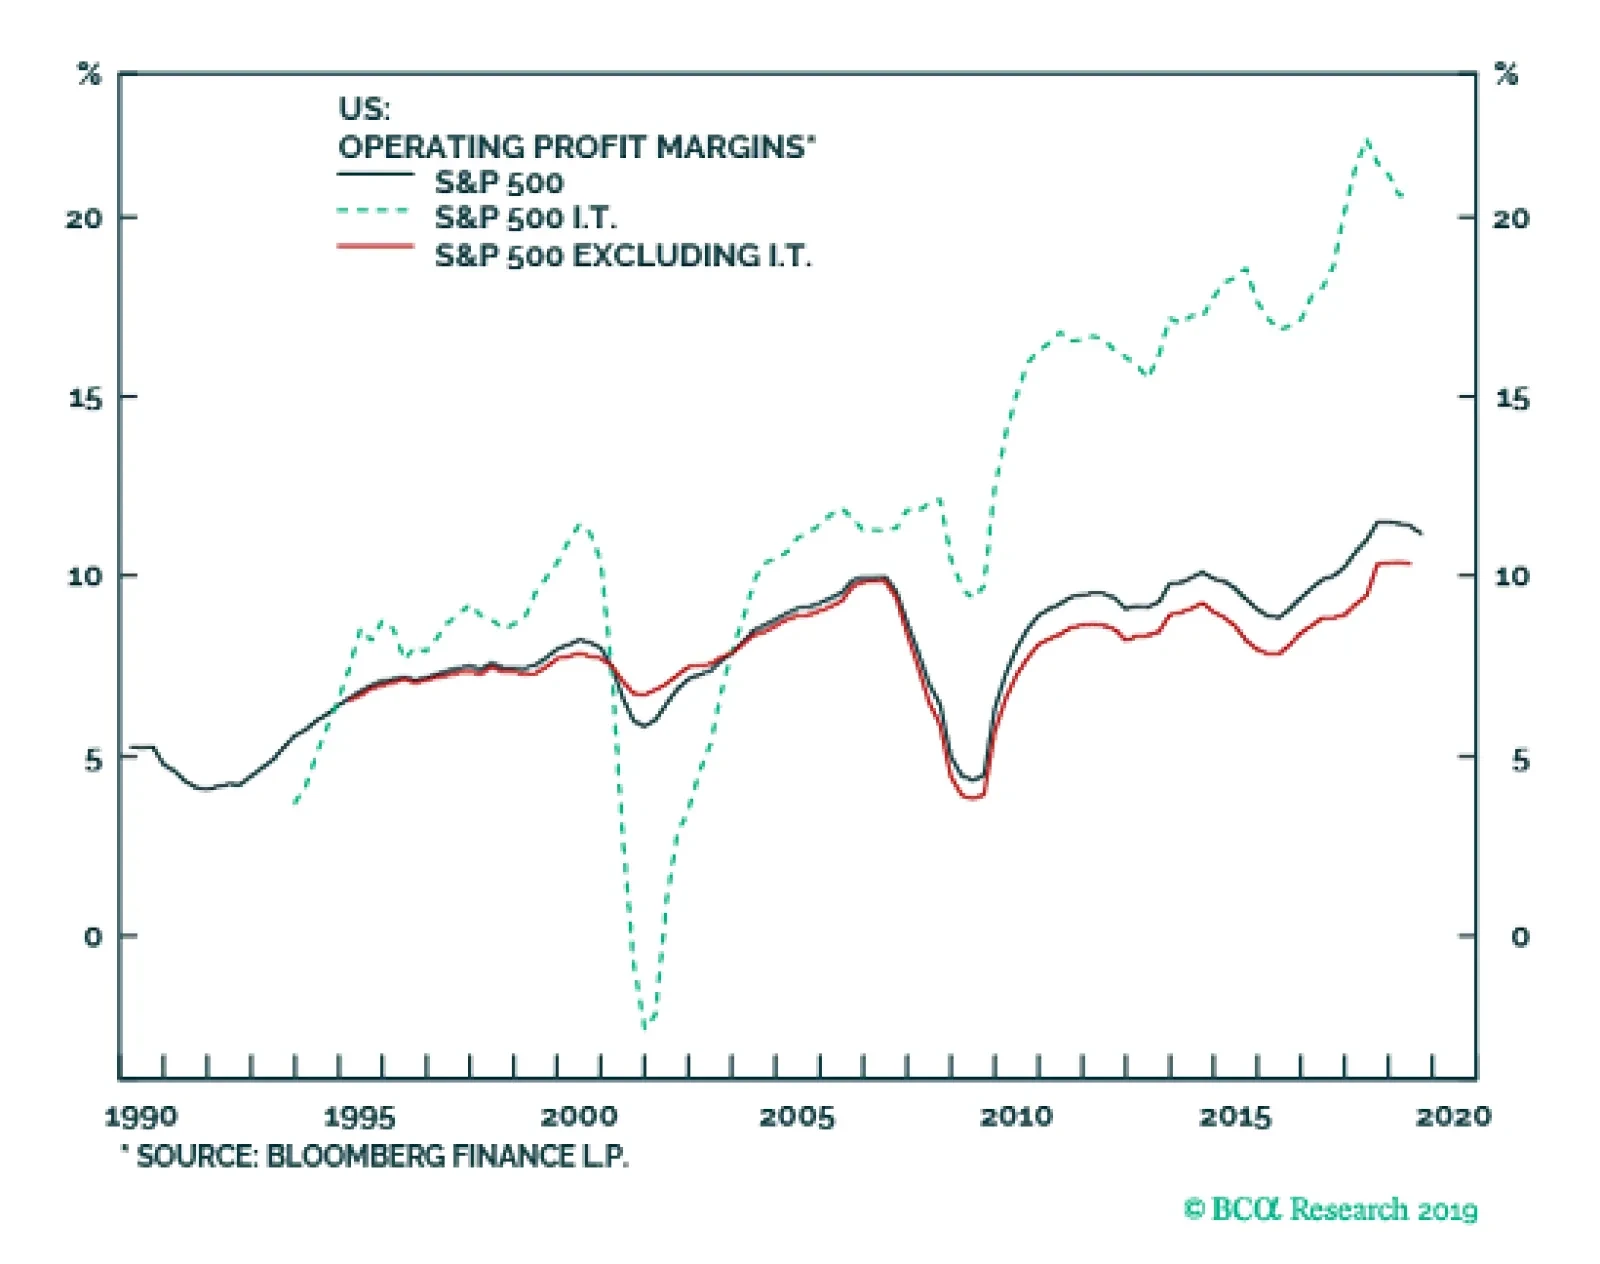
The large weight of the tech sector in the US stock market explains much of the superior performance of US stocks over the past decade. EPS in the I.T. sector has grown a lot more quickly than in other sectors. Looking out, there are four reasons why US…
Dear Client, Instead of our regular weekly report next Monday, this Friday November 22, you will receive our flagship publication “The Bank Credit Analyst” with our annual investment outlook. Our regular publication service will resume on December 2 with our high-conviction calls for 2020. Kind regards, Anastasios Avgeriou Highlights Portfolio Strategy Weakening supply/demand dynamics, pricing pressures, macro headwinds and pricey valuations are all warning that REITs are headed south. Global capex blues and the ongoing manufacturing recession, the resilient US dollar and weak operating metrics all confirm that an underweight stance is still warranted in the S&P communications equipment index. Recent Changes There are no changes to our portfolio this week. Table 1
Gasping For Air
Gasping For Air
Feature The S&P 500 made fresh all-time highs again last week, as investors focused on hopes of a US/China trade deal and continued to ignore negative data/news at their own peril. Domestically, unemployment insurance claims jumped to the highest level since June, and none of the major market and industry groups showed a gain in output on a month-over-month basis in October according to the latest Fed industrial production release. Internationally, Korean exports remain in the doldrums, Chinese data releases were weak across the board, and the mighty US dollar is making multi-decade highs versus a slew of EM currencies. Chart 1Disquieting Gap
Disquieting Gap
Disquieting Gap
All of this begs the question is global growth going to recover and aid the equity market grow into its lofty valuation? Our indicators suggest that a definitive earnings trough is now pushed out to Q2/2020. Thus, equity market caution is still warranted. Given all the recent equity market euphoria, we feel more and more like “the lone calf standing on the desolate, dangerous, wolf-patrolled prairie of contrary opinion” as – arguably the greatest trader of all time – Jesse Livermore mused roughly a century ago. Share buybacks have been a key pillar underpinning stocks since the GFC averaging roughly $500bn/annum since 2010. But, last year equity retirement jumped to nearly $1tn/annum. That is clearly unsustainable, warning that there is a disconnect between the S&P 500 and already steeply decelerating share buybacks. Our equity retirement estimate for next year is a return to the 10-year average, signaling that the market may hit a significant air pocket (top panel, Chart 1). Another perplexing recent phenomenon has been the lack of buying on margin that typically confirms SPX breakouts. While this episode may be similar to the 2015/16 episode, if margin debt does not recover soon it will exert downward pull on the broad market (bottom panel, Chart 1). Turning over to earnings, revenues, margins and the forward multiple is instructive. Turning over to earnings, revenues, margins and the forward multiple is instructive. Chart 2 highlights the S&P 500 earnings growth surprise factor. In more detail, this IBES/Refinitiv data show how accurate the sell side analysts’ 12-month forward EPS forecasts have been over time: a reading above zero implies the analyst community was too timid, while a fall below zero signals analysts were too optimistic. Chart 2Unhinged From The EPS Accuracy Signal
Unhinged From The EPS Accuracy Signal
Unhinged From The EPS Accuracy Signal
Equity market momentum moves with the ebb and flow of this factor and given the still downbeat message both from our SPX profit model (please refer to our recent webcast slides) and our simple liquidity indicator (please see Chart 4 from last week’s publication), we doubt 10% profit growth is even plausible for 2020. On the margin front, all four key profit margin drivers are on the brink of turning from tailwinds to headwinds as we recently highlighted in our “Peak Margins?” Special Report. Revenue growth is also at risk of a standstill. Domestic producer prices are deflating, and the ISM prices paid index has been clobbered. German, Japanese, Korean and Chinese wholesale prices are contracting and the OECD’s composite PPI measure is also sinking, suggesting that final demand is anemic at best. Under such a dire global pricing backdrop, it will be challenging for SPX sales to sustain their positive momentum, especially if the greenback remains well bid (Chart 3). Chart 3Top Line Growth Troubles
Top Line Growth Troubles
Top Line Growth Troubles
Forward multiples have slingshot higher despite a near 40bps increase in the 10-year yield since Labor Day. When the discount rate rises the multiple should come in and vice versa. Thus, we would lean against the recent spike in the S&P 500 forward P/E (10-year yield shown inverted, Chart 4). This week we are updating our negative views on a niche high-yielding sector and a tech subgroup. Finally, while sifting through market internals, we recently stumbled upon the GICS2 S&P consumer services index. Digging deeper into services was revealing. This relative share price ratio has gapped down of late. One of the reasons is that the services component of the personal consumption expenditure (PCE) data is decelerating (PCE services shown advanced, middle panel, Chart 5). The ISM non-manufacturing survey is also an excellent leading indicator of the S&P consumer services index, and warns that things will likely get worse before they get better (bottom panel, Chart 5). Chart 4Lofty Valuations
Lofty Valuations
Lofty Valuations
Chart 5Market Internals Signal: Sit This One Out
Market Internals Signal: Sit This One Out
Market Internals Signal: Sit This One Out
This week we are updating our negative views on a niche high-yielding sector and a tech subgroup. Getting Real With Real Estate We would refrain from chasing high yielding real estate stocks higher, and would rather avoid them altogether at the current juncture. Similar to utilities, REITs have come to the forefront lately as they have populated the top return sector ranks. However, real estate stocks, which have split out of the financials sector, are a niche GICS1 sector with a mere 3% market capitalization weight in the SPX, and have not driven the S&P 500 to all-time highs. Instead, tech stocks have, owing to their 23% market capitalization weight, as we have shown in recent research.1 Importantly, several key factors continue to signal that investors should shed public market real estate exposure. Namely, weakening supply/demand dynamics, pricing pressures, macro headwinds and still pricey valuations (primarily rock bottom cap rates) are all firing warning shots. The commercial real estate (CRE) sector is a bubble candidate that exemplifies this cycle’s excesses. As we have highlighted in the past, CRE prices sit at roughly two standard deviations above both the historical time trend and the previous cycle’s peak (not shown).2 Worryingly, CRE demand is waning. Not only our proprietary real estate demand indicator has sunk recently, but also the latest Fed Senior Loan Officer survey revealed that demand for CRE loans remains feeble (third & bottom panels, Chart 6). Simultaneously, fewer bankers are willing to extend CRE credit according to the same quarterly Fed survey (Chart 7). This tightening backdrop is weighing on CRE credit growth and CRE prices (second panel, Chart 6). In fact, absent credit growth providing the necessary fuel to sustain the CRE price inflation frenzy, there are rising odds that investors pull the plug on REITs (top panel, Chart 7). Chart 6Demand Ails
Demand Ails
Demand Ails
Chart 7Time To...
Time To...
Time To...
Already, occupancy rates have crested and there are increasing anecdotes of credit quality deterioration. As a result, CRE rents are also failing to keep up with inflation which eats into relative cash flow growth prospects (Chart 8). The supply side build up tilts this delicate balance further into deficit. Non-residential construction shows no signs of abating, with multi-family housing starts still running at an historically high rate of roughly 400K/annum (Chart 9). Such relentless overbuilding sows the seeds of the eventual felling in CRE prices and rents, which should also dent the S&P real estate sector. Chart 8...Lighten Up On Real Estate
...Lighten Up On Real Estate
...Lighten Up On Real Estate
Chart 9Supply Build Up Is Deflationary
Supply Build Up Is Deflationary
Supply Build Up Is Deflationary
Meanwhile, interest rate related headwinds will also weigh on this high-yielding sector in coming quarters, especially if the selloff in the bond market gains steam as BCA’s fixed income strategists continue to expect. While in the 2000s REITs were positively correlated with the 10-year Treasury yield, since 2010 this relationship has flipped and is now a tight inverse correlation (Chart 10). Chart 10Rising Yields = Sell REITs
Rising Yields = Sell REITs
Rising Yields = Sell REITs
Finally, our proprietary Valuation Indicator (VI) has enjoyed an impressive run since the 2017 trough and despite the recent relative selloff remains in overvalued territory. Our Technical Indicator (TI) hit a wall of late near one standard deviation above the historical mean and has only partially unwound the overbought reading since the early 2018 bottom. If our thesis pans out, we expect heightened selling pressure to weigh further on our VI and TI (Chart 11). Chart 11Still Too Pricey
Still Too Pricey
Still Too Pricey
Bottom Line: We reiterate our underweight rating in the S&P real estate sector. The ticker symbols for the stocks in this index are: BLBG – S5RLST – AMT, PLD, CCI, SPG, EQIX, WELL, PSA, EQR, AVB, SBAC, O, DLR, WY, VTR, ESS, BXP, CBRE, ARE, PEAK, MAA, UDR, EXR, DRE, HST, REG, VNO, IRM, FRT, KIM, AIV, SLG, MAC . Lost Signal The communications equipment rally stalled early in the summer and has since morphed into a bear market. We are sticking with our underweight recommendation, especially given a darkening profit outlook for this niche tech sub-group. Bellwether CSCO’s latest guidance was weak and confirmed that this capex-laden tech sub-index is in for a rough ride. Worryingly, CSCO’s key enterprise segment has no pulse. Historically, this data series has been positively correlated with telecom carrier capital outlays and the current message is grim (second panel, Chart 12). Tack on the ongoing manufacturing recession with CEOs canceling/postponing capital spending plans and the outlook dims further for the revenue prospects of communications equipment vendors (third & bottom panels, Chart 12). Chart 12Heed The CSCO Warning
Heed The CSCO Warning
Heed The CSCO Warning
Adding insult to injury, the US/China trade war is further complicating the picture. The ongoing tariffs have exacerbated the global growth slowdown and global capex plans have come under intense scrutiny. The IFO’s World Economic Outlook capex intentions survey has plunged, warning that global exports of telecom gear have ample downside (Chart 13). Chart 13Global Capex Blues
Global Capex Blues
Global Capex Blues
Chart 14US Dollar The Deflator
US Dollar The Deflator
US Dollar The Deflator
The greenback’s resilience is also sapping business purchasing power, especially in the emerging markets, denting final-demand. Therefore, the US dollar’s appreciation robs communications equipment manufacturers’ pricing power, makes their goods more expensive in the global market place, and as a consequence forces market share losses on them (Chart 14). The greenback’s resilience is also sapping business purchasing power, especially in the emerging markets, denting final-demand. The implication of weakening pricing power is that profits will likely underwhelm. Currently, the sell-side is penciling in roughly 10% EPS growth for the S&P communications equipment index over and above the SPX in the next twelve months. This is a tall order and we would lean against such extreme analyst optimism (bottom panel, Chart 15). Operating metrics are quickly losing steam, another harbinger of profit ails for this tech sub-group. In more detail, our productivity proxy has taken a steep turn for the worse and industry executives have also put investment projects on hold (middle panel, Chart 15). Moreover, the communication equipment new orders-to-inventories ratio is contracting and industry resource utilization is probing multi-year lows, according to the Fed’s latest industrial production release. Under such a backdrop, relative top line growth is on track to level off and likely flirt with the contraction zone (Chart 16). Chart 15Operating Metric...
Operating Metric...
Operating Metric...
Chart 16...Dysphoria
...Dysphoria
...Dysphoria
Netting it all out, global capex blues, the resilient US dollar and weak operating metrics all confirm that an underweight stance is still warranted in the S&P communications equipment index. Bottom Line: Continue to avoid the S&P communications equipment index. The ticker symbols for the stocks in this index are: BLBG – S5COMM – CSCO, JNPR, MSI, ANET, FFIV. Anastasios Avgeriou US Equity Strategist anastasios@bcaresearch.com Footnotes 1 Please see BCA US Equity Strategy Insight Report, “Deciphering Sector Returns” dated August 30, 2019, available at uses.bcaresearch.com. 2 Please see BCA US Equity Strategy Special Report, “10 Most FAQs From The Road” dated April 8, 2019, available at uses.bcaresearch.com. Current Recommendations Current Trades Size And Style Views Stay neutral cyclicals over defensives (downgrade alert) Favor value over growth Favor large over small caps (Stop 10%)
Dear Client, I will be visiting clients in Paris, Amsterdam, and London next week. In lieu of our regular report, we will be sending you a Special Report from Matt Gertken, BCA’s Chief Geopolitical Strategist. Matt argues that US politics and the 2020 election represent the greatest source of geopolitical risk over the coming year, and possibly beyond. Best regards, Peter Berezin Highlights Having underperformed for more than ten years, non-US stocks are set to gain the upper hand over their US peers. A reacceleration in global growth, a weaker US dollar, and favorable valuations should all support non-US stocks next year. Meanwhile, one of the greater drivers of US equity outperformance – the stellar returns of tech stocks – is likely to dissipate. Investors should remain overweight global equities relative to bonds, but start increasing allocations to non-US stocks at the expense of US stocks. US Stocks: From Leaders To Laggards? US equities have handily outperformed their global peers since 2008. About half of that outperformance was due to faster sales-per-share growth in the US, a third was due to faster growth in US margins, and the rest was due to relative P/E expansion in favor of the US (Chart 1). Looking ahead, non-US stocks are set to gain the upper hand over their US peers thanks to an improving global growth backdrop, a weaker US dollar, and an increasingly irresistible valuation tailwind. Chart 1Faster Sales Growth, Rising Margins, And Relative PE Expansion Helped Drive US Outperformance Over The Past Decade
A Window Of Opportunity For International Stocks
A Window Of Opportunity For International Stocks
Improving Global Growth Outlook Global growth should benefit next year from the dovish pivot by most central banks. The share of central banks cutting/raising rates leads global growth by about 6-to-9 months (Chart 2). Chart 2Lower Rates Should Help Spur Growth
Lower Rates Should Help Spur Growth
Lower Rates Should Help Spur Growth
Chart 3The Effects Of Easing Monetary Policy Should Soon Trickle Down To The Economy
The Effects Of Easing Monetary Policy Should Soon Trickle Down To The Economy
The Effects Of Easing Monetary Policy Should Soon Trickle Down To The Economy
The global manufacturing downturn is also coming to end as inventories continue to be run down. The auto sector, which has been at the forefront of the manufacturing slowdown, is finally showing signs of life. US banks stopped tightening lending standards for auto loans in the third quarter. They are also reporting stronger demand for vehicle financing (Chart 3). In Europe, the new orders-to-inventory ratio of the Markit Europe Automobile PMI has moved back to parity for the first time since the autumn of 2018. In China, vehicle production and sales are rebounding on a rate-of-change basis (Chart 4). Both automobile ownership and vehicle sales in China are still a fraction of what they are in most other economies (Chart 5). Chart 4Chinese Auto Sector Is Bottoming Out
Chinese Auto Sector Is Bottoming Out
Chinese Auto Sector Is Bottoming Out
Chart 5China: Structural Outlook For Autos Is Bright
China: Structural Outlook For Autos Is Bright
China: Structural Outlook For Autos Is Bright
The trade war is a clear and present danger to our bullish outlook on global growth. The good news is that President Trump has a strong incentive to make a deal. A resurgence in the trade war would hurt the economy, which is Trump’s best selling point (Chart 6). As a self-described master negotiator, Trump has to produce a “tremendous” deal for the American people. Had he negotiated an agreement a year or two ago, he would currently be on the hook for showing that it resulted in a smaller trade deficit with China. But with the presidential election only a year away, he can semi-credibly claim that the trade balance will improve only after he is re-elected. Assuming a “Phase 1” agreement is concluded, global business sentiment should improve. Chart 6Trump Gets Reasonably High Marks On His Handling Of The Economy, But Not Much Else
A Window Of Opportunity For International Stocks
A Window Of Opportunity For International Stocks
A détente in the trade war is unlikely to cause China to restart its deleveraging campaign. Credit growth is currently only a few points above trend nominal GDP growth, implying that the ratio of credit-to-GDP is barely increasing (Chart 7). The combined Chinese credit and fiscal impulse is still rising; it reliably leads global growth by about nine months (Chart 8). Chart 7China: The Deleveraging Campaign Has Been Put On The Backburner
China: The Deleveraging Campaign Has Been Put On The Backburner
China: The Deleveraging Campaign Has Been Put On The Backburner
Chart 8Chinese Stimulus Should Boost Global Growth
Chinese Stimulus Should Boost Global Growth
Chinese Stimulus Should Boost Global Growth
Faster Global Growth Should Disproportionately Benefit Non-US stocks The sector composition of international stocks is more skewed towards cyclicals than defensives compared to US stocks (Table 1). As a result, non-US stocks generally outperform their US peers when global growth accelerates (Chart 9). Table 1Cyclicals Are More Heavily Weighted Outside The US Stock Market
A Window Of Opportunity For International Stocks
A Window Of Opportunity For International Stocks
We would include financials in our definition of cyclical sectors. As global growth improves, long-term bond yields will increase at the margin (Chart 10). Since central banks are in no hurry to raise rates, yield curves will steepen. This will boost bank net interest margins, flattering profits and share prices (Chart 11). Chart 9Non-US Equities Usually Outperform When Global Growth Improves
Non-US Equities Usually Outperform When Global Growth Improves
Non-US Equities Usually Outperform When Global Growth Improves
Chart 10Stronger Economic Growth Will Put Upward Pressure On Government Bond Yields
Stronger Economic Growth Will Put Upward Pressure On Government Bond Yields
Stronger Economic Growth Will Put Upward Pressure On Government Bond Yields
The US Dollar Should Weaken Compared to most other economies, the United States has a large service sector and a small manufacturing base. This makes the US a “low beta” play on global growth. As a result, capital tends to flow from the US to the rest of the world when global growth picks up, putting downward pressure on the US dollar in the process (Chart 12). Chart 11Steeper Yield Curves Will Benefit Financials
Steeper Yield Curves Will Benefit Financials
Steeper Yield Curves Will Benefit Financials
Chart 12The Dollar Is A Countercyclical Currency
The Dollar Is A Countercyclical Currency
The Dollar Is A Countercyclical Currency
Interest-rate differentials have been moving against the dollar for most of this year (Chart 13). This makes the greenback more vulnerable to a correction. Chart 13The Dollar Has Been Diverging From Rate Differentials This Year
The Dollar Has Been Diverging From Rate Differentials This Year
The Dollar Has Been Diverging From Rate Differentials This Year
Chart 14Long Dollar Is A Crowded Trade
Long Dollar Is A Crowded Trade
Long Dollar Is A Crowded Trade
Bullish sentiment towards the dollar also remains somewhat stretched. Net long speculative positions are near the top of their historic range (Chart 14). Our tactical MacroQuant model, which has an excellent track record of predicting short-to-medium term moves in the dollar, has dropped its bullish bias towards the currency (Chart 15). Chart 15MacroQuant Has Soured On The US Dollar
A Window Of Opportunity For International Stocks
A Window Of Opportunity For International Stocks
A weaker dollar will help boost commodity prices, which is usually good news for cyclical stocks (Chart 16). A softer dollar will also raise the USD value of overseas shares, thus making international stocks more attractive in common-currency terms. Valuations Favor Non-US Stocks There is an old investment adage which says that valuations are useless as a short-term timing tool. That is only partially true. While valuations by themselves offer little guidance as to where the stock market is going in the short run, combined with a catalyst, valuations can make a big difference. When stocks are cheap, a bullish catalyst can cause prices to surge; whereas when stocks are expensive, a bearish catalyst can cause them to plunge. Looking ahead, non-US stocks are set to gain the upper hand over their US peers thanks to an improving global growth backdrop, a weaker US dollar, and an increasingly irresistible valuation tailwind. Non-US stocks are currently trading at 13.8-times forward earnings. This represents a significant discount to US stocks, which trade at a forward PE ratio of 17.7. The valuation discount is even greater if one looks at other measures such as the cyclically-adjusted PE, price-to-book, price-to-sales, and the dividend yield (Chart 17). Chart 16A Weaker Dollar Tends To Support Commodity Prices
A Weaker Dollar Tends To Support Commodity Prices
A Weaker Dollar Tends To Support Commodity Prices
Chart 17US Stocks Are More Expensive...
US Stocks Are More Expensive...
US Stocks Are More Expensive...
Differences in sector weights account for about a quarter of the valuation gap between the US and the rest of the world (Chart 18). The rest of the gap is due to cheaper valuations within sectors. Financials, utilities, and consumer discretionary stocks, in particular, are quite a bit more expensive in the US than elsewhere (Chart 19). Chart 18…Even When Adjusting For Sector Weights
A Window Of Opportunity For International Stocks
A Window Of Opportunity For International Stocks
Chart 19AEquity Sector Valuations: US Versus The Rest Of The World (I)
Equity Sector Valuations: US Versus The Rest Of The World (I)
Equity Sector Valuations: US Versus The Rest Of The World (I)
Chart 19BEquity Sector Valuations: US Versus The Rest Of The World (II)
Equity Sector Valuations: US Versus The Rest Of The World (II)
Equity Sector Valuations: US Versus The Rest Of The World (II)
The valuation gap between the US and the rest of the world is even starker if we compare earnings yields with bond yields. Since bond yields are lower outside the US, the implied equity risk premium is markedly higher for non-US stocks (Chart 20). An examination of the relative performance of US vs non-US companies over the past 50 years reveals two major tops, and one potential top. Some commentators have argued that the loftier valuations enjoyed by US stocks are warranted due to their superior growth prospects. While there may be some truth to that, it is worth noting that the IMF projects GDP growth (based on MSCI country weights) will be faster outside the US over the next five years (Chart 21). Chart 20Equity Risk Premia Remain Quite High
Equity Risk Premia Remain Quite High
Equity Risk Premia Remain Quite High
Chart 21Growth Prospects Brighter Outside The US
Growth Prospects Brighter Outside The US
Growth Prospects Brighter Outside The US
One should also keep in mind that relatively fast US earnings growth is a fairly recent phenomenon. Between 1970 and 2008, European EPS actually grew slightly faster than US EPS (Chart 22). Earnings in emerging markets also increased more rapidly than in the US during the two decades leading up to the Global Financial Crisis. Chart 22US Earnings Have Not Always Outperformed
US Earnings Have Not Always Outperformed
US Earnings Have Not Always Outperformed
The Role Of US Tech The large weight of the tech sector in the US stock market explains much of the superior performance of US stocks over the past decade. As Chart 23 illustrates, EPS in the I.T. sector has grown a lot more quickly than in other sectors. Chart 23US Earnings: Who Has Been Doing The Heaving Lifting?
A Window Of Opportunity For International Stocks
A Window Of Opportunity For International Stocks
Chart 24S&P 500: Much Of The Increase In Margins Has Occurred In The I.T. Sector
S&P 500: Much Of The Increase In Margins Has Occurred In The I.T. Sector
S&P 500: Much Of The Increase In Margins Has Occurred In The I.T. Sector
Looking out, there are four reasons why US tech stocks may be due for a breather. First, tech valuations have gotten stretched relative to the broader market. Second, tech margins have risen to unprecedented high levels. We estimate that about half of the increase in S&P 500 profit margins since 2007 has been due to I.T. (Chart 24). Even that understates the role of tech in the expansion of profit margins because Standard & Poor’s no longer classifies some large-cap behemoths such as Google and Facebook as I.T. companies. Third, tech companies may face increased regulatory scrutiny in the years ahead stemming from alleged privacy violations, perceived monopolistic behavior, and worries about the censorship of online speech. This could weigh on sales and earnings growth. Fourth, the growth in private equity funds is likely to limit the number of tech companies that go public at a very early stage. Stock market investors were very lucky that companies such as Microsoft, Cisco, Nvidia, Qualcomm, Oracle, Amazon, and Netflix issued shares to the public at a young stage in their development (Table 2). All seven had market caps below $1 billion when they went public. Such hidden gems are becoming less common: The number of publicly listed companies in the US has fallen by more than half over the past two decades (Chart 25). The median age of tech companies at the time of IPO has risen from around 7 in the 1990s to 12 years today (Chart 26). Table 2Big Gains From Once Small Companies
A Window Of Opportunity For International Stocks
A Window Of Opportunity For International Stocks
Chart 25The Number Of Publicly Listed Companies Fell
The Number Of Publicly Listed Companies Fell
The Number Of Publicly Listed Companies Fell
Chart 26Tech Companies Entering The Public Arena Are Now More Mature
A Window Of Opportunity For International Stocks
A Window Of Opportunity For International Stocks
Had Uber gone public as a small, upstart company not long after it was founded in 2009, it probably would have also made public shareholders a lot of money. Instead, it ended up going public this year with a market cap of $75 billion, only to see it shrink to as low as $40 billion in the ensuing six months. We won’t even mention what would have happened if WeWork had gone public. Investment Conclusions An examination of the relative performance of US vs non-US companies over the past 50 years reveals two major tops, and one potential top: The first during the “Nifty 50” era of the late 1960s, the second during the 1990s dotcom boom, and the third during the recent FAANG craze (Chart 27). It is too early to say whether FAANG stocks have peaked, but it is worth noting that the group has underperformed the S&P 500 since May (Chart 28). Chart 27Putting The Recent FAANG Craze Into Context
Putting The Recent FAANG Craze Into Context
Putting The Recent FAANG Craze Into Context
Chart 28FAANG Stocks And The Market
FAANG Stocks And The Market
FAANG Stocks And The Market
Chart 29Has The Underperformance Of Value Run Its Course?
Has The Underperformance Of Value Run Its Course?
Has The Underperformance Of Value Run Its Course?
Regardless of whether the secular outperformance of US equities is ending, the cyclical backdrop that we foresee over the next 12-to-18 months – characterized by faster global growth, a weakening dollar, and higher commodity prices – is likely to favor non-US stocks. As such, investors should remain overweight global equities relative to bonds, but start increasing allocations to non-US stocks at the expense of US stocks. Consistent with this, we are initiating a new recommendation to go long the MSCI ACWI ex USA index versus the MSCI USA index in dollar terms. Looking across the various stock markets outside the US, we are particularly fond of Europe. Net profit margins among companies in the STOXX Europe 600 index are about three percentage points below the S&P 500. This gives European companies greater scope to boost earnings. European banks are especially attractive, sporting a forward PE of 8.3, a price-to-book ratio of 0.6, and a dividend yield of 6.1%. Lastly, on the question of style investing, we would note that the relative performance of the MSCI value and growth indices closely tracks the performance of global financials versus I.T. (Chart 29). Given our preference for the former over the latter, we suspect that value will outperform growth next year. Peter Berezin Chief Global Strategist peterb@bcaresearch.com Footnotes Strategy & Market Trends MacroQuant Model And Current Subjective Scores
A Window Of Opportunity For International Stocks
A Window Of Opportunity For International Stocks
Tactical Trades Strategic Recommendations Closed Trades
Dear Client, Over the past two weeks, I have been in Asia visiting BCA’s clients. Next week’s Report, on November 20 will be a recap of my observations from the road. This week we are sending you a Special Report on global semiconductor stock performance published by our Emerging Markets Strategy service, authored by my colleague Ellen JingYuan He. This Special Report offers great insights on the development of 5G network industry, global demand beyond 5G smartphones, as well as investment implications derived from the research. I hope you find it interesting and insightful. Best regards, Jing Sima, China Strategist Highlights Since early this year, global semiconductor stock prices have been front-running a demand recovery that has not yet begun. There is strong industry optimism surrounding a potential demand boost for semiconductors from the rollout of 5G networks and phones in 2020. Yet we expect actual 2020 Chinese 5G smartphone shipments to fall considerably short of what industry observers expect, especially in the first half of the year. Global semiconductor stocks are over-hyped. Even though momentum could push them higher in the short term, we believe there will be a better entry point in the coming months. Given that Korean semiconductor stocks have lagged, we are upgrading Korean tech stocks and the KOSPI to overweight within the EM equity benchmark. Feature Global semiconductor stock prices have been rallying strongly, increasingly diverging from global semiconductor sales since early January. The former have risen to new highs, while the latter have remained in deep contraction (Chart 1). Chart 1A Puzzle: Semiconductors Stock Prices Skyrocketed When Sales Remain In A Deep Contraction
Global Semiconductor Market: Sales & Share Prices A Puzzle: Semiconductors Stock Prices Skyrocketed When Sales Remain In A Deep Contraction
Global Semiconductor Market: Sales & Share Prices A Puzzle: Semiconductors Stock Prices Skyrocketed When Sales Remain In A Deep Contraction
We are puzzled by such a dramatic divergence between share prices and the industry’s top line. After all, the ongoing contraction in worldwide semiconductor sales has been broad-based across both regions and the majority of top 10 semiconductor companies (Charts 2 and 3). Chart 2A Broad-Based Contraction Across All Regions…
A Broad-Based Contraction Across All Regions...
A Broad-Based Contraction Across All Regions...
Chart 3…And Most Top Semiconductor Companies
...And Most Top Semiconductor Companies
...And Most Top Semiconductor Companies
In our June1 report, we argued that world semiconductor sales would continue to shrink through the remainder of 2019. This view has played out, but global semiconductor share prices have surged and outperformed the global equity benchmark. Global semiconductor stock prices have been front-running a demand recovery that has not yet begun. It seems the market has been looking beyond the current weakness. It currently expects a potential demand boost for semiconductors from 5G phones in 2020 on the back of rising hopes of a US-China trade conflict resolution. Is such hype about 5G network and corresponding shipments justified? Our research leads us to contend that global semiconductor sales will likely post only low- to middle-single-digit growth in 2020, with most of the recovery back loaded in the second half of the year. Hype over 5G phones among industry participants and investors may continue pushing semiconductor share prices higher in the near term. However, the odds are that the reality of tepid semiconductor sales growth will likely set in early next year, and semiconductor stocks will correct considerably. In short, we do not recommend chasing the rally. There will be a better entry point in the months ahead. 5G-Smartphones: The Savior Of Semiconductor Demand? Chart 4Semiconductor Sales Are Still Contracting At A Double-Digit Rate
Strong Global 5G-Smartphone Shipments In 2020?
Strong Global 5G-Smartphone Shipments In 2020?
The primary driver behind the rally in semiconductor share prices is strong optimism among major semiconductor producers and investors about a rapid ramp-up of global 5G-smartphone adoption. In addition, the market is also holding onto a good amount of hope for a US-China trade conflict resolution, which will also facilitate the pace of global 5G deployment. Mobile phones account for the largest share (29%) of global semiconductor revenue. The industry expects strong global 5G-smartphone shipments in 2020 to spur a meaningful recovery in semiconductor demand (Chart 4). Table 1 shows a list of estimates for 2020 global 5G-smartphone shipments by major semiconductor companies, industry analysts and investors, ranging from 120 million to 225 million units, with a mean of 180 million units. Table 1Market Forecasts Of In 2020 Global 5G-Smartphone Shipments
Semiconductor Stocks: Is The 5G Hype Warranted?
Semiconductor Stocks: Is The 5G Hype Warranted?
In particular, Taiwan Semiconductor Manufacturing Company (TSMC), the world’s largest dedicated integrated circuit (IC) foundry, recently almost doubled its forecast for 5G smartphone penetration for 2020 to a mid-teen percentage from a single-digit percentage forecast made just six months ago. Given that global smartphone shipments currently stand at roughly 1.4 billion units per year, a 15% penetration rate would translate into 210 million units of 5G smartphone shipments in 2020. Meanwhile, Qualcomm, the world's largest maker of mobile application processors and baseband modems, last week predicted that 2020 global 5G smartphone shipments will range between 175 million units and 225 million units. We agree that 5G smartphone sales in 2020 will increase sharply from currently very low levels, but we also believe the penetration pace estimated by the industry is optimistic. The basis for our conclusion is as follows: Chart 5So Far, China 5G-Adoption Pace Has Been Much Slower Than Its 4G
So Far, China 5G-Adoption Pace Has Been Much Slower Than Its 4G
So Far, China 5G-Adoption Pace Has Been Much Slower Than Its 4G
5G-smartphone shipments in China will largely determine the pace of worldwide 5G-phone shipments. The country will be the world leader in the 5G smartphone market due to the government’s promotion of it and the advanced 5G technology held by China's largest telecom equipment producer, Huawei. China announced the debut of the 5G-era on June 6. Since then, total 5G-smartphone shipments have been only about 800,000 units through the end of September. In terms of the pace of penetration (5G-smartphone shipments as a share of total mobile phone shipments during the first three months of launch), the rate was a mere 0.3%. In comparison with the debut of the 4G-era in December 2013, shipments of 4G phones in China were significantly larger, and their adoption rate was much faster (Chart 5). During the first three months of the 4G launch, 4G phone shipments were 9.7 million units, reaching 10% of total smartphone shipments. Here are the most important reasons behind what will be a much slower penetration pace for 5G smartphones in China compared with the 4G rollout. We agree that 5G smartphone sales in 2020 will increase sharply from currently very low levels, but we also believe the penetration pace estimated by the industry is optimistic. Market saturation: The Chinese smartphone market has become much more saturated than it was six years ago when 4G was launched. Since then, there have been about 2.3 billion units of 4G smartphones sold, with 1.3 billion units sold in the past three years – nearly equaling the total Chinese population. This means the replacement need in China is low. High prices: 5G smartphones in China are currently much more expensive than 4G ones. 5G phone prices range from RMB 4000-7000 in China, while most of the 4G ones sell within the range of RMB 1000-3000. According to data from QuestMobile, a professional big data intelligence service provider in China's mobile internet market, in the first half of 2019, about 41% of smartphones were sold at RMB 1000-2000, about 30% at RMB 2000-3000, and only 10% at RMB 4000 and above. Functionality: At the moment, except for faster data download/upload speed, 5G smartphones do not offer much more functionality than 4G ones. Back in 2014, 4G phones had much more attractive features than 3G. For example, while 3G smartphones only allowed audio and picture transmission, those with 4G enabled video chatting and high-quality streaming video. In addition, for now, there are very few smartphone apps that can only be used for 5G phones. 5G Infrastructure: Presently, there is only very limited geographical coverage of 5G base stations. The number of 5G base stations is estimated to be 130 thousand units this year, only accounting for 1.6% of total base stations in China. In comparison, 65% of all Chinese base stations are 4G-enabled. Meanwhile, to cover the same region, the number of 5G base stations needs to at least double that of 4G ones. It will take at a minimum two or three years to develop decent coverage of 5G base stations. Besides, the cost of building 5G-enabled infrastructure is much more expensive than the deployment of the 4G ones. There are two types of 5G networks: Non-standalone (NSA) and Standalone (SA). The 5G data transmission speed is significantly faster in SA mode than in NSA mode. However, the deployment cost of the SA network is much higher than the cost for NSA networks, as the latter can be built from existing 4G networks, but the former cannot. Critically, the Chinese government recently announced only SA-compatible 5G smartphones will be allowed to have access to the 5G network in China, starting January 1, 2020. This signals that the focus of future 5G network development will be centered around SA mode instead of this year’s NSA mode. Over 90% of China’s 5G network was NSA mode in 2019. Building a 5G SA network will take longer and cost more. The market expects China to build as much as 1 million units of 5G base stations in 2020. Even if this goal is achieved, it only accounts for about 11% of total Chinese base stations. Chart 6Chinese Smartphone Sales: Still In Contraction
Chinese Smartphone Sales: Still In Contraction
Chinese Smartphone Sales: Still In Contraction
Lack of variety of SA-compatible 5G-phone models. There are also limited options for SA-compatible 5G smartphones models. So far, even though Huawei, Xiaomi, Vivo, Oppo, ZTE and Samsung have all released 5G smartphones, only models from Huawei work under SA networks.2 All others only work under the NSA network. Hence, the variety of SA-compatible 5G phone models is very limited. This will likely delay sales of 5G phones in China. Many more models of SA-compatible 5G smartphones will likely be released only in the second half of next year, which may both drive down 5G smartphone prices and attract more buyers. Consumer spending slowdown: 4G smartphones can meet the needs of the majority of users, and most users have purchased a new phone within the past three years. With elevated economic uncertainty and slowing income growth, a larger proportion of people in China may decide to delay upgrading from 4G-phones to much more expensive 5G ones. This echoes a continuing decline in Chinese smartphone sales (Chart 6). Overall, from Chinese consumers’ perspective, a 5G phone in 2020 will be a nice-to-have, but not a must-have. Given all the aforementioned factors, our best guess for 2020 Chinese 5G smartphone shipments is 40-60 million units, with a larger proportion occurring in the second half of the year. From Chinese consumers’ perspective, a 5G phone in 2020 will be a nice-to-have, but not a must-have. As China is much more aggressive in moving to 5G network adaptation than other large economies, we share industry experts’ forecasts that China will account for 50% of total global 5G shipments. Provided our estimate for China is about 50 million units, our global forecast for 5G phone shipments in 2020 comes to about 100 million units worldwide. This is substantially lower than industry and analyst average estimates of 180 million units (see Table 1 on page 4). Notably, rising 5G smartphone sales will cannibalize some 4G-phone demand. Consequently, aggregate demand for semiconductors will not grow, but the share of high-valued-added chips in the overall product mix will rise. Bottom Line: The penetration pace of 5G smartphones will be meaningfully slower than both the semiconductor producers and analysts expect. Most likely, a meaningful recovery in global aggregate smartphone sales will not occur over the next six months. We suspect the positive impact of 5G phone sales will be felt by global semiconductor producers largely in the second half of 2020. Semiconductor Demand Beyond 5G In terms of end usage, except smartphones, the top five end uses for semiconductors are personal computers (PCs) (12%), servers (11%), diverse consumer products (12%), automotive (10%), and industrial electronics (9%). Structural PC demand is down, but sales have been more or less flat in the past three years (Chart 7). Next year, commercial demand may accelerate as enterprises work through the remainder of their Windows 10 migration. However, household demand is still facing strong competition from tablets. Overall, we expect PC demand to remain stagnant. Global server shipments sank deeper into contraction in the second quarter of this year due to a slowdown in purchasing from cloud providers and hyperscale customers. They may stay in moderate contraction over the next six months as global economic uncertainty remain elevated, which may discourage enterprises’ investment plans (Chart 8). Chart 7Structural PC Demand Is Stagnant And Will Remain So In 2020
Global PCs Sales: Deeply Saturated Structural PC Demand: Remain Stagnant In 2020
Global PCs Sales: Deeply Saturated Structural PC Demand: Remain Stagnant In 2020
Chart 8Global Server Shipments: A Moderate Contraction In 2020
Global Server Shipment: Are In Contraction Global Server Shipments: Moderate Contraction In 2020
Global Server Shipment: Are In Contraction Global Server Shipments: Moderate Contraction In 2020
Chart 9Automotive-Related Semiconductor Demand: A Moderate Growth Ahead
Automotive-Related Semiconductor Demand: A Moderate Growth Ahead
Automotive-Related Semiconductor Demand: A Moderate Growth Ahead
Chinese auto sales – about 30% of the world total – will likely stage a rate-of-change improvement, moving from deep to mild contraction or stagnation over the next six months.3 Increasing penetration of new energy vehicles and continuing 5G deployment may still result in moderate growth in auto-related semiconductor demand (Chart 9). Semiconductor demand from diverse consumer products slightly declined in the third quarter, with robust growth in tablets, eReaders and portable navigation devices, and contraction in all other subsectors including TV sets, gaming, printers and images, cameras and set-top boxes (Chart 10). This may remain in slight contraction or stagnation over the next three to six months. Automation and 5G deployment will likely continue to increase semiconductor sales in the industrial sector (Chart 11). Chart 10Semiconductor Demand From Consumer Products: A Slight Contraction Or Stagnation Ahead
Semiconductor Stocks: Is The 5G Hype Warranted?
Semiconductor Stocks: Is The 5G Hype Warranted?
Chart 11Industrial Semiconductor Demand: More Upside Ahead
Industrial Semiconductor Demand: More Upside Ahead
Industrial Semiconductor Demand: More Upside Ahead
Chart 12Memory Prices Still Signal Sluggish Semiconductor Demand
Memory Prices Still Signal Sluggish Semiconductor Demand
Memory Prices Still Signal Sluggish Semiconductor Demand
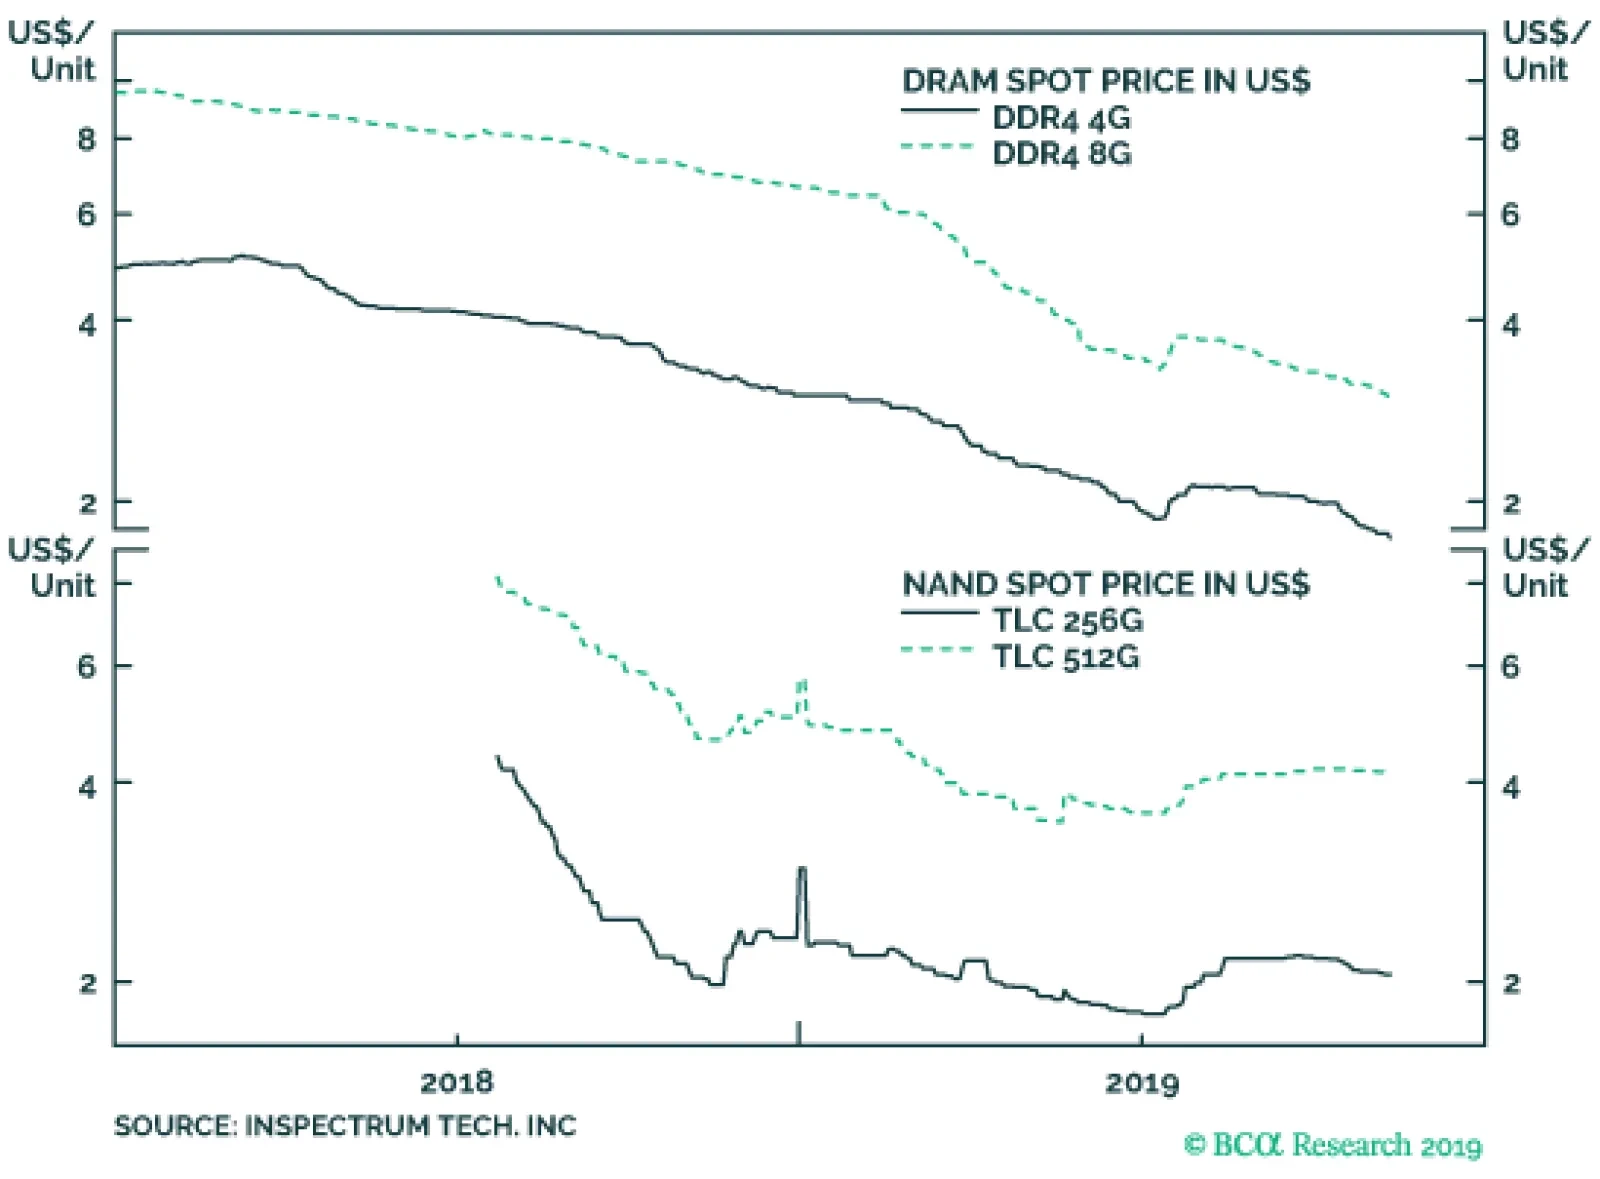
Overall, demand recovery has not yet begun. The lack of price recovery in DRAM prices after 18 months of declines and still-low NAND prices are also signaling sluggish semiconductor demand (Chart 12). Bottom Line: Odds are that global semiconductor demand in sectors other than smartphones will show improvement in terms of rate of change, but will still likely be flat in 2020. TSMC Sales: A Harbinger Of Industry Recovery? TSMC, the world’s biggest semiconductor company, posted a revival in sales over four consecutive months from June to September. Do TSMC sales lead global semiconductor sales? The answer is not always. TSMC sales do not always correlate well with global semiconductor sales (Chart 13). For example, TSMC sales diverged from global semiconductor sales in 2017-‘18 and 2013-‘14. So what are the reasons for strong increase in TSMC sales? First, it reflects market share rotation in the global smartphone market in favor of smartphone producers that use TSMC-fabricated chips. Chart 13TSMC Sales Do Not Always Lead Global Semiconductor Sales
TSMC Sales Do Not Always Lead Global Semiconductor Sales
TSMC Sales Do Not Always Lead Global Semiconductor Sales
Demand from the global smartphone sector contributes to almost half of TSMC’s total revenue. Apple and Huawei are TSMC’s two top customers. The most recent report from market research firm Canalys shows that while Apple’s smartphone shipments declined 7% year-on-year last quarter, Huawei’s shipments soared 29%.4 Combined, smartphone shipments from these two companies still jumped nearly 12% year-on-year in the third quarter of the year. This has increased their market share in the global smartphone market to 31% now from 28% a year ago. Second, rising TSMC sales also reflect market share rotation in the global server market, in particular rising shipments and growing market share of servers using AMD high-performing-computing (HPC) chips instead of Intel ones. AMD’s 7nm Epyc CPU, launched this August and manufactured by TSMC, has been taking share from Intel in the global server market. This has driven the increase in TSMC’s revenue from the HPC sector. Third, the share of value-added products (high-end chips) in TSMC’s product mix has been rising rapidly. TSMC’s share of revenue from 7nm technology jumped from 21% to 27% in the third quarter, as most of Apple’s and Huawei’s chips and all of AMD’s Epyc CPUs are 7nm-based. Back in the third quarter of 2018, TSMC’s 7nm business only accounted for 11% of its total revenue. Chart 14Both TSMC Sales And Taiwanese PMI Could Continue To Improve While Global Semiconductor Sales Remain In Contraction
Both TSMC Sales And Taiwanese PMI Could Continue To Improve While Global Semiconductor Sales Remain In Contraction
Both TSMC Sales And Taiwanese PMI Could Continue To Improve While Global Semiconductor Sales Remain In Contraction
Finally, although internet of things (IoT) and automotive chips only account for 9% and 4% of TSMC’s total share of revenue respectively, strong growth in both segments –33% year-on-year in IoT and 20% year-on-year in automotive – indeed shows exceptional demand in these two sectors in a weakening global economic environment. As IoT and automotive development will highly rely on global 5G infrastructure development, their impact will be meaningful once the global 5G network becomes well advanced and widely installed. To conclude, while a 40% boost in TSMC’s capital spending indeed paints a positive picture on global semiconductor demand over the longer term, rising TSMC sales do not mean an imminent and strong recovery in the global semiconductor sector is in the works. Huawei is the global 5G technology leader and the major supplier in both 5G-network equipment and 5G smartphones; the company will be a major revenue contributor to TSMC. As Huawei will likely place more orders to TSMC for chip fabrication, this will likely result in further improvement in TSMC’s sales (Chart 14). Bottom Line: Rising TSMC sales do not necessarily herald an imminent and robust cyclical recovery in the global semiconductor sector. Investment Conclusions Global semiconductor stock prices have been front running a recovery that has not yet begun. In addition, there is still uncertainty about the technology aspect of US-China trade negotiations. The US will likely continue to have Huawei and other Chinese high-tech companies on its trade-ban list – its so-called Entity List. TSMC sales do not always correlate well with global semiconductor sales. Notably, global semiconductor sales and profits are still in deep contraction, while share prices are at all-time highs (Chart 15). As a result, semiconductor stocks’ multiples have spiked to their previous highs (Chart 16). Chart 15Semiconductor Companies Profits: Still In Deep Contraction
Semiconductor Companies Profits: Still In Deep Contraction
Semiconductor Companies Profits: Still In Deep Contraction
Chart 16Elevated Semiconductor Stocks Multiples
Elevated Semiconductor Stocks Multiples
Elevated Semiconductor Stocks Multiples
While it is common for share prices to rally ahead of a business cycle/profit revival, we believe a true recovery will only emerge in spring 2020, and it will initially be much more subdued than industry watchers and investors expect. In the near term, strong momentum could still push semiconductor stock prices higher. However, the reality will then set in and there will be an air pocket before a more sustainable bull market emerges. Our US Equity Investment Strategy earlier this week downgraded S&P semiconductor equipment companies to underweight and put the S&P Semiconductors Index on a downgrade alert.5 Their newly created top-down semiconductor profit growth model warns that an earnings recovery is not yet imminent (Chart 17). For EM-dedicated equity managers, we have been neutral on Asian semiconductor sectors. We continue to recommend a market-weight allocation to Taiwan’s overall market, while we are upgrading the Korean technology sector from a neutral allocation to overweight. Korean semiconductor stocks have rallied much less than their global peers. Hence, the risk of a major relapse is lower. Given that we have been overweight non-tech Korean stocks, upgrading tech stocks to overweight means we will be overweight the KOSPI within the EM equity benchmark (Chart 18). Chart 17Semiconductor Earnings Recovery: Not Imminent
Semiconductor Earnings Recovery: Not Imminent
Semiconductor Earnings Recovery: Not Imminent
Chart 18Upgrade Korean Tech Stocks And Overweight KOSPI Within EM
Upgrade Korean Tech Stocks And Overweight KOSPI Within EM
Upgrade Korean Tech Stocks And Overweight KOSPI Within EM
Meanwhile, we remain long the Bloomberg Asia-Pacific Semiconductor Index and short the S&P 500 Semiconductor Index. This trade has produced a 7% gain since its initiation on June 13, 2019. The Bloomberg Asia-Pacific Semiconductor index has 12 stocks. Samsung and TSMC account for 38% and 37% of the index, respectively. The S&P 500 Semiconductor Index has 13 stocks. Intel, Broadcom, Texas Instruments and Qualcomm are the top five constituents, together accounting for nearly 77% of the index. Although the US and China may reach a temporary trade deal, the US will continue to restrict sales of tech products and high-end semiconductors to China. As a result, these US semiconductor companies, most of which are IC designing companies, will likely experience a more subdued than expected recovery in sales. Ellen JingYuan He Associate Vice President ellenj@bcaresearch.com Footnotes 1 Please see Emerging Markets Strategy Special Report "The Global Semiconductor Sector: Is A Cyclical Upturn Imminent?" dated June 13, 2019, available at ems.bcaresearch.com 2 https://www.guancha.cn/ChanJing/2019_09_21_518748.shtml http://www.cac.gov.cn/2019-10/23/c_1573361796389322.htm 3 Please see Emerging Markets Strategy Special Report "Chinese Auto Demand: Time For A Recovery?" dated October 17, 2019, available at ems.bcaresearch.com 4 https://www.canalys.com/analysis/smartphone+analysis 5 Please see US Equity Strategy Special Report "Defying Gravity," dated November 4, 2019, available at uses.bcaresearch.com Cyclical Investment Stance Equity Sector Recommendations
In terms of end usage, except smartphones, the top five end uses for semiconductors are personal computers (PCs) (12%), servers (11%), diverse consumer products (12%), automotive (10%), and industrial electronics (9%). Structural PC demand is down, but…
Highlights Since early this year, global semiconductor stock prices have been front-running a demand recovery that has not yet begun. There is strong industry optimism surrounding a potential demand boost for semiconductors from the rollout of 5G networks and phones in 2020. Yet we expect actual 2020 Chinese 5G smartphone shipments to fall considerably short of what industry observers expect, especially in the first half of the year. Global semiconductor stocks are over-hyped. Even though momentum could push them higher in the short term, we believe there will be a better entry point in the coming months. Given that Korean semiconductor stocks have lagged, we are upgrading Korean tech stocks and the KOSPI to overweight within the EM equity benchmark. Feature Global semiconductor stock prices have been rallying strongly, increasingly diverging from global semiconductor sales since early January. The former have risen to new highs, while the latter have remained in deep contraction (Chart 1). Chart 1A Puzzle: Semiconductors Stock Prices Skyrocketed When Sales Remain In A Deep Contraction
Global Semiconductor Market: Sales & Share Prices A Puzzle: Semiconductors Stock Prices Skyrocketed When Sales Remain In A Deep Contraction
Global Semiconductor Market: Sales & Share Prices A Puzzle: Semiconductors Stock Prices Skyrocketed When Sales Remain In A Deep Contraction
We are puzzled by such a dramatic divergence between share prices and the industry’s top line. After all, the ongoing contraction in worldwide semiconductor sales has been broad-based across both regions and the majority of top 10 semiconductor companies (Charts 2 and 3). Chart 2A Broad-Based Contraction Across All Regions…
A Broad-Based Contraction Across All Regions...
A Broad-Based Contraction Across All Regions...
Chart 3…And Most Top Semiconductor Companies
...And Most Top Semiconductor Companies
...And Most Top Semiconductor Companies
In our June1 report, we argued that world semiconductor sales would continue to shrink through the remainder of 2019. This view has played out, but global semiconductor share prices have surged and outperformed the global equity benchmark. Global semiconductor stock prices have been front-running a demand recovery that has not yet begun. It seems the market has been looking beyond the current weakness. It currently expects a potential demand boost for semiconductors from 5G phones in 2020 on the back of rising hopes of a US-China trade conflict resolution. Is such hype about 5G network and corresponding shipments justified? Our research leads us to contend that global semiconductor sales will likely post only low- to middle-single-digit growth in 2020, with most of the recovery back loaded in the second half of the year. Hype over 5G phones among industry participants and investors may continue pushing semiconductor share prices higher in the near term. However, the odds are that the reality of tepid semiconductor sales growth will likely set in early next year, and semiconductor stocks will correct considerably. In short, we do not recommend chasing the rally. There will be a better entry point in the months ahead. 5G-Smartphones: The Savior Of Semiconductor Demand? Chart 4Semiconductor Sales Are Still Contracting At A Double-Digit Rate
Strong Global 5G-Smartphone Shipments In 2020?
Strong Global 5G-Smartphone Shipments In 2020?
The primary driver behind the rally in semiconductor share prices is strong optimism among major semiconductor producers and investors about a rapid ramp-up of global 5G-smartphone adoption. In addition, the market is also holding onto a good amount of hope for a US-China trade conflict resolution, which will also facilitate the pace of global 5G deployment. Mobile phones account for the largest share (29%) of global semiconductor revenue. The industry expects strong global 5G-smartphone shipments in 2020 to spur a meaningful recovery in semiconductor demand (Chart 4). Table 1 shows a list of estimates for 2020 global 5G-smartphone shipments by major semiconductor companies, industry analysts and investors, ranging from 120 million to 225 million units, with a mean of 180 million units. Table 1Market Forecasts Of In 2020 Global 5G-Smartphone Shipments
Semiconductor Stocks: Is The 5G Hype Warranted?
Semiconductor Stocks: Is The 5G Hype Warranted?
In particular, Taiwan Semiconductor Manufacturing Company (TSMC), the world’s largest dedicated integrated circuit (IC) foundry, recently almost doubled its forecast for 5G smartphone penetration for 2020 to a mid-teen percentage from a single-digit percentage forecast made just six months ago. Given that global smartphone shipments currently stand at roughly 1.4 billion units per year, a 15% penetration rate would translate into 210 million units of 5G smartphone shipments in 2020. Meanwhile, Qualcomm, the world's largest maker of mobile application processors and baseband modems, last week predicted that 2020 global 5G smartphone shipments will range between 175 million units and 225 million units. We agree that 5G smartphone sales in 2020 will increase sharply from currently very low levels, but we also believe the penetration pace estimated by the industry is optimistic. The basis for our conclusion is as follows: Chart 5So Far, China 5G-Adoption Pace Has Been Much Slower Than Its 4G
So Far, China 5G-Adoption Pace Has Been Much Slower Than Its 4G
So Far, China 5G-Adoption Pace Has Been Much Slower Than Its 4G
5G-smartphone shipments in China will largely determine the pace of worldwide 5G-phone shipments. The country will be the world leader in the 5G smartphone market due to the government’s promotion of it and the advanced 5G technology held by China's largest telecom equipment producer, Huawei. China announced the debut of the 5G-era on June 6. Since then, total 5G-smartphone shipments have been only about 800,000 units through the end of September. In terms of the pace of penetration (5G-smartphone shipments as a share of total mobile phone shipments during the first three months of launch), the rate was a mere 0.3%. In comparison with the debut of the 4G-era in December 2013, shipments of 4G phones in China were significantly larger, and their adoption rate was much faster (Chart 5). During the first three months of the 4G launch, 4G phone shipments were 9.7 million units, reaching 10% of total smartphone shipments. Here are the most important reasons behind what will be a much slower penetration pace for 5G smartphones in China compared with the 4G rollout. We agree that 5G smartphone sales in 2020 will increase sharply from currently very low levels, but we also believe the penetration pace estimated by the industry is optimistic. Market saturation: The Chinese smartphone market has become much more saturated than it was six years ago when 4G was launched. Since then, there have been about 2.3 billion units of 4G smartphones sold, with 1.3 billion units sold in the past three years – nearly equaling the total Chinese population. This means the replacement need in China is low. High prices: 5G smartphones in China are currently much more expensive than 4G ones. 5G phone prices range from RMB 4000-7000 in China, while most of the 4G ones sell within the range of RMB 1000-3000. According to data from QuestMobile, a professional big data intelligence service provider in China's mobile internet market, in the first half of 2019, about 41% of smartphones were sold at RMB 1000-2000, about 30% at RMB 2000-3000, and only 10% at RMB 4000 and above. Functionality: At the moment, except for faster data download/upload speed, 5G smartphones do not offer much more functionality than 4G ones. Back in 2014, 4G phones had much more attractive features than 3G. For example, while 3G smartphones only allowed audio and picture transmission, those with 4G enabled video chatting and high-quality streaming video. In addition, for now, there are very few smartphone apps that can only be used for 5G phones. 5G Infrastructure: Presently, there is only very limited geographical coverage of 5G base stations. The number of 5G base stations is estimated to be 130 thousand units this year, only accounting for 1.6% of total base stations in China. In comparison, 65% of all Chinese base stations are 4G-enabled. Meanwhile, to cover the same region, the number of 5G base stations needs to at least double that of 4G ones. It will take at a minimum two or three years to develop decent coverage of 5G base stations. Besides, the cost of building 5G-enabled infrastructure is much more expensive than the deployment of the 4G ones. There are two types of 5G networks: Non-standalone (NSA) and Standalone (SA). The 5G data transmission speed is significantly faster in SA mode than in NSA mode. However, the deployment cost of the SA network is much higher than the cost for NSA networks, as the latter can be built from existing 4G networks, but the former cannot. Critically, the Chinese government recently announced only SA-compatible 5G smartphones will be allowed to have access to the 5G network in China, starting January 1, 2020. This signals that the focus of future 5G network development will be centered around SA mode instead of this year’s NSA mode. Over 90% of China’s 5G network was NSA mode in 2019. Building a 5G SA network will take longer and cost more. The market expects China to build as much as 1 million units of 5G base stations in 2020. Even if this goal is achieved, it only accounts for about 11% of total Chinese base stations. Chart 6Chinese Smartphone Sales: Still In Contraction
Chinese Smartphone Sales: Still In Contraction
Chinese Smartphone Sales: Still In Contraction
Lack of variety of SA-compatible 5G-phone models. There are also limited options for SA-compatible 5G smartphones models. So far, even though Huawei, Xiaomi, Vivo, Oppo, ZTE and Samsung have all released 5G smartphones, only models from Huawei work under SA networks.2 All others only work under the NSA network. Hence, the variety of SA-compatible 5G phone models is very limited. This will likely delay sales of 5G phones in China. Many more models of SA-compatible 5G smartphones will likely be released only in the second half of next year, which may both drive down 5G smartphone prices and attract more buyers. Consumer spending slowdown: 4G smartphones can meet the needs of the majority of users, and most users have purchased a new phone within the past three years. With elevated economic uncertainty and slowing income growth, a larger proportion of people in China may decide to delay upgrading from 4G-phones to much more expensive 5G ones. This echoes a continuing decline in Chinese smartphone sales (Chart 6). Overall, from Chinese consumers’ perspective, a 5G phone in 2020 will be a nice-to-have, but not a must-have. Given all the aforementioned factors, our best guess for 2020 Chinese 5G smartphone shipments is 40-60 million units, with a larger proportion occurring in the second half of the year. From Chinese consumers’ perspective, a 5G phone in 2020 will be a nice-to-have, but not a must-have. As China is much more aggressive in moving to 5G network adaptation than other large economies, we share industry experts’ forecasts that China will account for 50% of total global 5G shipments. Provided our estimate for China is about 50 million units, our global forecast for 5G phone shipments in 2020 comes to about 100 million units worldwide. This is substantially lower than industry and analyst average estimates of 180 million units (see Table 1 on page 4). Notably, rising 5G smartphone sales will cannibalize some 4G-phone demand. Consequently, aggregate demand for semiconductors will not grow, but the share of high-valued-added chips in the overall product mix will rise. Bottom Line: The penetration pace of 5G smartphones will be meaningfully slower than both the semiconductor producers and analysts expect. Most likely, a meaningful recovery in global aggregate smartphone sales will not occur over the next six months. We suspect the positive impact of 5G phone sales will be felt by global semiconductor producers largely in the second half of 2020. Semiconductor Demand Beyond 5G In terms of end usage, except smartphones, the top five end uses for semiconductors are personal computers (PCs) (12%), servers (11%), diverse consumer products (12%), automotive (10%), and industrial electronics (9%). Structural PC demand is down, but sales have been more or less flat in the past three years (Chart 7). Next year, commercial demand may accelerate as enterprises work through the remainder of their Windows 10 migration. However, household demand is still facing strong competition from tablets. Overall, we expect PC demand to remain stagnant. Global server shipments sank deeper into contraction in the second quarter of this year due to a slowdown in purchasing from cloud providers and hyperscale customers. They may stay in moderate contraction over the next six months as global economic uncertainty remain elevated, which may discourage enterprises’ investment plans (Chart 8). Chart 7Structural PC Demand Is Stagnant And Will Remain So In 2020
Global PCs Sales: Deeply Saturated Structural PC Demand: Remain Stagnant In 2020
Global PCs Sales: Deeply Saturated Structural PC Demand: Remain Stagnant In 2020
Chart 8Global Server Shipments: A Moderate Contraction In 2020
Global Server Shipment: Are In Contraction Global Server Shipments: Moderate Contraction In 2020
Global Server Shipment: Are In Contraction Global Server Shipments: Moderate Contraction In 2020
Chart 9Automotive-Related Semiconductor Demand: A Moderate Growth Ahead
Automotive-Related Semiconductor Demand: A Moderate Growth Ahead
Automotive-Related Semiconductor Demand: A Moderate Growth Ahead
Chinese auto sales – about 30% of the world total – will likely stage a rate-of-change improvement, moving from deep to mild contraction or stagnation over the next six months.3 Increasing penetration of new energy vehicles and continuing 5G deployment may still result in moderate growth in auto-related semiconductor demand (Chart 9). Semiconductor demand from diverse consumer products slightly declined in the third quarter, with robust growth in tablets, eReaders and portable navigation devices, and contraction in all other subsectors including TV sets, gaming, printers and images, cameras and set-top boxes (Chart 10). This may remain in slight contraction or stagnation over the next three to six months. Automation and 5G deployment will likely continue to increase semiconductor sales in the industrial sector (Chart 11). Chart 10Semiconductor Demand From Consumer Products: A Slight Contraction Or Stagnation Ahead
Semiconductor Stocks: Is The 5G Hype Warranted?
Semiconductor Stocks: Is The 5G Hype Warranted?
Chart 11Industrial Semiconductor Demand: More Upside Ahead
Industrial Semiconductor Demand: More Upside Ahead
Industrial Semiconductor Demand: More Upside Ahead
Chart 12Memory Prices Still Signal Sluggish Semiconductor Demand
Memory Prices Still Signal Sluggish Semiconductor Demand
Memory Prices Still Signal Sluggish Semiconductor Demand
Overall, demand recovery has not yet begun. The lack of price recovery in DRAM prices after 18 months of declines and still-low NAND prices are also signaling sluggish semiconductor demand (Chart 12). Bottom Line: Odds are that global semiconductor demand in sectors other than smartphones will show improvement in terms of rate of change, but will still likely be flat in 2020. TSMC Sales: A Harbinger Of Industry Recovery? TSMC, the world’s biggest semiconductor company, posted a revival in sales over four consecutive months from June to September. Do TSMC sales lead global semiconductor sales? The answer is not always. TSMC sales do not always correlate well with global semiconductor sales (Chart 13). For example, TSMC sales diverged from global semiconductor sales in 2017-‘18 and 2013-‘14. So what are the reasons for strong increase in TSMC sales? First, it reflects market share rotation in the global smartphone market in favor of smartphone producers that use TSMC-fabricated chips. Chart 13TSMC Sales Do Not Always Lead Global Semiconductor Sales
TSMC Sales Do Not Always Lead Global Semiconductor Sales
TSMC Sales Do Not Always Lead Global Semiconductor Sales
Demand from the global smartphone sector contributes to almost half of TSMC’s total revenue. Apple and Huawei are TSMC’s two top customers. The most recent report from market research firm Canalys shows that while Apple’s smartphone shipments declined 7% year-on-year last quarter, Huawei’s shipments soared 29%.4 Combined, smartphone shipments from these two companies still jumped nearly 12% year-on-year in the third quarter of the year. This has increased their market share in the global smartphone market to 31% now from 28% a year ago. Second, rising TSMC sales also reflect market share rotation in the global server market, in particular rising shipments and growing market share of servers using AMD high-performing-computing (HPC) chips instead of Intel ones. AMD’s 7nm Epyc CPU, launched this August and manufactured by TSMC, has been taking share from Intel in the global server market. This has driven the increase in TSMC’s revenue from the HPC sector. Third, the share of value-added products (high-end chips) in TSMC’s product mix has been rising rapidly. TSMC’s share of revenue from 7nm technology jumped from 21% to 27% in the third quarter, as most of Apple’s and Huawei’s chips and all of AMD’s Epyc CPUs are 7nm-based. Back in the third quarter of 2018, TSMC’s 7nm business only accounted for 11% of its total revenue. Chart 14Both TSMC Sales And Taiwanese PMI Could Continue To Improve While Global Semiconductor Sales Remain In Contraction
Both TSMC Sales And Taiwanese PMI Could Continue To Improve While Global Semiconductor Sales Remain In Contraction
Both TSMC Sales And Taiwanese PMI Could Continue To Improve While Global Semiconductor Sales Remain In Contraction
Finally, although internet of things (IoT) and automotive chips only account for 9% and 4% of TSMC’s total share of revenue respectively, strong growth in both segments –33% year-on-year in IoT and 20% year-on-year in automotive – indeed shows exceptional demand in these two sectors in a weakening global economic environment. As IoT and automotive development will highly rely on global 5G infrastructure development, their impact will be meaningful once the global 5G network becomes well advanced and widely installed. To conclude, while a 40% boost in TSMC’s capital spending indeed paints a positive picture on global semiconductor demand over the longer term, rising TSMC sales do not mean an imminent and strong recovery in the global semiconductor sector is in the works. Huawei is the global 5G technology leader and the major supplier in both 5G-network equipment and 5G smartphones; the company will be a major revenue contributor to TSMC. As Huawei will likely place more orders to TSMC for chip fabrication, this will likely result in further improvement in TSMC’s sales (Chart 14). Bottom Line: Rising TSMC sales do not necessarily herald an imminent and robust cyclical recovery in the global semiconductor sector. Investment Conclusions Global semiconductor stock prices have been front running a recovery that has not yet begun. In addition, there is still uncertainty about the technology aspect of US-China trade negotiations. The US will likely continue to have Huawei and other Chinese high-tech companies on its trade-ban list – its so-called Entity List. TSMC sales do not always correlate well with global semiconductor sales. Notably, global semiconductor sales and profits are still in deep contraction, while share prices are at all-time highs (Chart 15). As a result, semiconductor stocks’ multiples have spiked to their previous highs (Chart 16). Chart 15Semiconductor Companies Profits: Still In Deep Contraction
Semiconductor Companies Profits: Still In Deep Contraction
Semiconductor Companies Profits: Still In Deep Contraction
Chart 16Elevated Semiconductor Stocks Multiples
Elevated Semiconductor Stocks Multiples
Elevated Semiconductor Stocks Multiples
While it is common for share prices to rally ahead of a business cycle/profit revival, we believe a true recovery will only emerge in spring 2020, and it will initially be much more subdued than industry watchers and investors expect. In the near term, strong momentum could still push semiconductor stock prices higher. However, the reality will then set in and there will be an air pocket before a more sustainable bull market emerges. Our US Equity Investment Strategy earlier this week downgraded S&P semiconductor equipment companies to underweight and put the S&P Semiconductors Index on a downgrade alert.5 Their newly created top-down semiconductor profit growth model warns that an earnings recovery is not yet imminent (Chart 17). For EM-dedicated equity managers, we have been neutral on Asian semiconductor sectors. We continue to recommend a market-weight allocation to Taiwan’s overall market, while we are upgrading the Korean technology sector from a neutral allocation to overweight. Korean semiconductor stocks have rallied much less than their global peers. Hence, the risk of a major relapse is lower. Given that we have been overweight non-tech Korean stocks, upgrading tech stocks to overweight means we will be overweight the KOSPI within the EM equity benchmark (Chart 18). Chart 17Semiconductor Earnings Recovery: Not Imminent
Semiconductor Earnings Recovery: Not Imminent
Semiconductor Earnings Recovery: Not Imminent
Chart 18Upgrade Korean Tech Stocks And Overweight KOSPI Within EM
Upgrade Korean Tech Stocks And Overweight KOSPI Within EM
Upgrade Korean Tech Stocks And Overweight KOSPI Within EM
Meanwhile, we remain long the Bloomberg Asia-Pacific Semiconductor Index and short the S&P 500 Semiconductor Index. This trade has produced a 7% gain since its initiation on June 13, 2019. The Bloomberg Asia-Pacific Semiconductor index has 12 stocks. Samsung and TSMC account for 38% and 37% of the index, respectively. The S&P 500 Semiconductor Index has 13 stocks. Intel, Broadcom, Texas Instruments and Qualcomm are the top five constituents, together accounting for nearly 77% of the index. Although the US and China may reach a temporary trade deal, the US will continue to restrict sales of tech products and high-end semiconductors to China. As a result, these US semiconductor companies, most of which are IC designing companies, will likely experience a more subdued than expected recovery in sales. Ellen JingYuan He Associate Vice President ellenj@bcaresearch.com Footnotes 1 Please see Emerging Markets Strategy Special Report "The Global Semiconductor Sector: Is A Cyclical Upturn Imminent?" dated June 13, 2019, available at ems.bcaresearch.com 2 https://www.guancha.cn/ChanJing/2019_09_21_518748.shtml http://www.cac.gov.cn/2019-10/23/c_1573361796389322.htm 3 Please see Emerging Markets Strategy Special Report "Chinese Auto Demand: Time For A Recovery?" dated October 17, 2019, available at ems.bcaresearch.com 4 https://www.canalys.com/analysis/smartphone+analysis 5 Please see US Equity Strategy Special Report "Defying Gravity," dated November 4, 2019, available at uses.bcaresearch.com
Sell Semi Equipment Exuberance
Sell Semi Equipment Exuberance
Underweight The S&P semi equipment index has made the headlines reaching fresh cycle-highs. While bulls would buy this breakout, we are sticking our heads out and recommend selling the strength and warn that the S&P semi equipment cycle-high looks like a mania (please refer to Chart 8 from this Monday’s Weekly Report). Deflating DRAM prices, which also serve as our industry’s pricing power proxy, highlight that demand remains deficient both for semis and semi equipment. Historically, the sector’s relative profit expectations and pricing power have moved in lockstep and the current message is to fade sell-side analysts’ buoyancy (bottom panel). Moreover, the plunge in overall tech capex growth (especially excluding software) further dims an already bleak semi equipment profit outlook. Bottom Line: This week we downgraded the S&P semi equipment index to underweight, but given the industry’s volatility we also set a 10% stop loss. The ticker symbols for the stocks in this index are: BLBG – S5SEEQ – AMAT, LRCX, KLAC. For additional details, please refer to this Monday’s Weekly Report.