Technology
The contracting ISM manufacturing survey signals that relative share price momentum running at a 60%/annum clip is unwarranted and bound to return to earth. The same holds true for relative forward profit and revenue growth expectations, especially given the…
Tech stocks have been on a tear with the sector besting the SPX by over 40% since 2015. Such a breakneck pace is unsustainable without support from earnings. Despite the sector’s share price outperformance, expected tech profit growth has been no better…

Highlights Portfolio Strategy Lack of profit growth, deficient industry demand, perky valuations and extremely overbought conditions all suggest that the time is ripe for an underweight stance in the S&P semi equipment index. The chip down cycle is far from over, leading global semi sales indicators remain downbeat and our semi profit growth model is waving a yellow flag, compelling us to put the S&P semiconductors index on downgrade alert. Recent Changes Downgrade the S&P semiconductor equipment index to underweight, today. Table 1
Defying Gravity
Defying Gravity
Feature The S&P 500 made fresh all-time highs last week, despite the ongoing profit contraction and a well telegraphed hawkish Fed interest rate cut. The “hope rally” continues and the longer it lasts defying sagging profit fundamentals, the larger the snapback will be in the ensuing months. We remain cautious awaiting a turn in our proprietary four-factor macro SPX earnings growth model and in the meantime our strategy is to sell this strength and raise dry powder. Worrisomely, Chart 1 shows that analysts have thrown in the towel and are downgrading SPX long-term profit growth expectations at a faster pace than in the aftermath of the dotcom bubble. Historically, the S&P 500 and its five-year forward EPS growth estimates are joined at the hip, and the current message is bearish for the broad equity market. Chart 1Will Sinking Profit Growth Expectations Pull Stocks Lower?
Will Sinking Profit Growth Expectations Pull Stocks Lower?
Will Sinking Profit Growth Expectations Pull Stocks Lower?
Importantly, on the valuation front, in May of 2018 we first showed the SPX P/E/G ratio and at the time we accurately argued that “on this valuation measure the SPX appears cheap”.1 How times have changed since then. Following that trough, the P/E/G ratio has nearly doubled and is now sitting right at 1.5 or one standard deviation above the historical mean (we divide the 12-month forward price-to-earnings ratio by the long-term EPS growth rate using I/B/E/S data, second panel, Chart 2). We are clearly in overshoot territory and this valuation metric represents another yellow flag. Chart 2SPX P/E/G Ratio Is In Overshoot Territory
SPX P/E/G Ratio Is In Overshoot Territory
SPX P/E/G Ratio Is In Overshoot Territory
Moving on to the bond market, what caught our attention was a recent WSJ article detailing how investors are no longer paying up to own the lowest quality paper and while overall junk spreads were coming in, at the bottom of the pit investors were shunning CCC rated junk bonds.2 What is interesting is that this lowest quality corner of the junk market has some excellent forward looking properties and tends to lead not only the overall junk market, but also equities. Chart 3 shows the CCC rated option adjusted spread (OAS) versus the overall high yield OAS on a year-over-year change basis on inverted scale. This measure of bond market stress is moving in the opposite direction of S&P 500 momentum and we expect stocks to converge lower to this junk bond market stress indicator (JBMSI). Chart 3Bond Market Not Buying Stock Market Euphoria
Bond Market Not Buying Stock Market Euphoria
Bond Market Not Buying Stock Market Euphoria
This week we are downgrading a niche tech subgroup that has gone parabolic and updating another early-cyclical tech subindex. The overall corporate bond ratings migration data (defined as downgrades minus upgrades as a percent of total) corroborates the JBMSI message and warns that the steep divergence with stocks is unsustainable (corporate bond ratings migration data shown inverted, middle panel, Chart 4). Chart 4Unsustainable Divergences
Unsustainable Divergences
Unsustainable Divergences
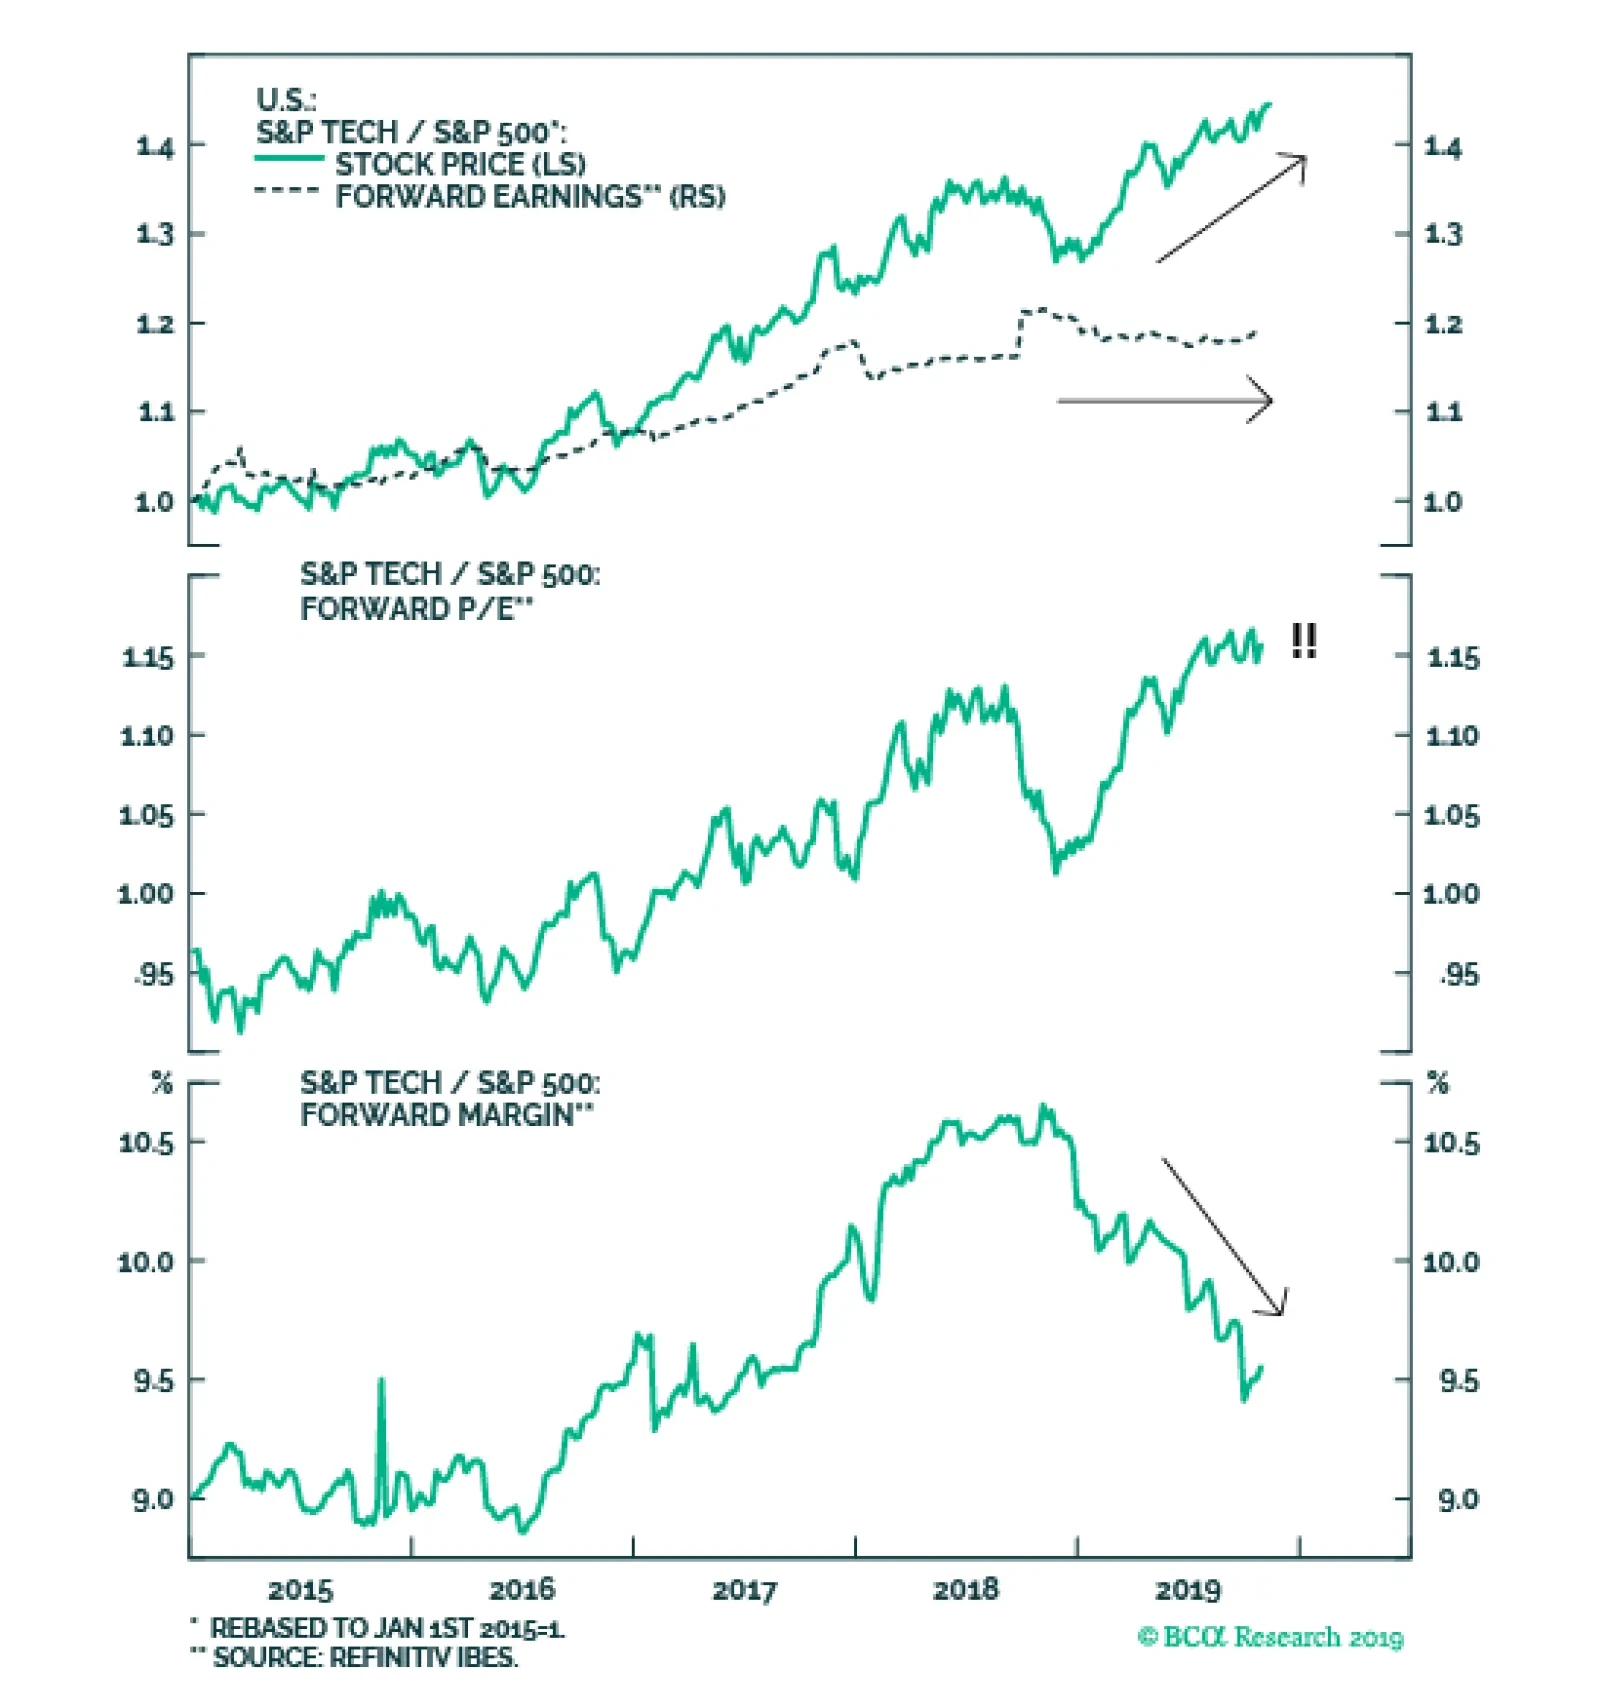
Similarly, the S&P 500’s net earnings revision ratio is also negative and before long it will exert downward pull on SPX momentum (bottom panel, Chart 4). Under such a backdrop, we continue to recommend investors avoid chasing the broad equity market higher and instead build up their cash coffers, at least until we get a definitive signal that the path of least resistance is higher for profits. This week we are downgrading a niche tech subgroup that has gone parabolic and updating another early-cyclical tech subindex. Sell The Semi Equipment Exuberance Tech stocks have been on a tear with the sector besting the SPX by over 40% since 2015. While such a breakneck pace is unsustainable, what is missing from this outperformance is relative forward earnings participation. In fact, tech profit expectations stalled versus the overall market in late-2018 and have not been able to keep up with relative share prices. In other words, the forward multiple has skyrocketed and is now trading at a 15% premium to the SPX, at a time when relative margins are sinking like a stone (Chart 5). Importantly, given that stock performance should follow profit performance we are perplexed by this dynamic with investors religiously bidding up the sector’s forward multiple. Tack on the recent news of a plunge in overall tech capex growth – especially excluding software – and the tech sector’s bleak profit outlook dims further (Chart 6). Worryingly, within the tech sector the semiconductor equipment space is even more puzzling. Chart 7 shows that relative forward profits are trailing relative share prices as investors have extrapolated the recent positive trade news far into the future. As a reminder this index has a 90% foreign sales exposure with roughly 30% of sales originating from China. As a result, the S&P semiconductor equipment forward P/E is just below the broad market, nearly doubling on a year-over-year basis (middle panel, Chart 7). Chart 5Mind The Gap
Mind The Gap
Mind The Gap
Chart 6Even Tech Investment Is Cracking
Even Tech Investment Is Cracking
Even Tech Investment Is Cracking
The last time we tried to lean against semi equipment exuberance on the back of deteriorating profit fundamentals was on July 8 when we downgraded this index to underweight. But, we were offside and thankfully our risk management metric (stop loss at -7%) limited our downside a mere ten days later. Chart 7Sell Semi Equipment Stocks
Sell Semi Equipment Stocks
Sell Semi Equipment Stocks
Since then, relative share prices have skyrocketed by 40% and we now have more confidence to re-enter our position. Today we recommend a downgrade in the S&P semi equipment index to a below benchmark allocation. This is a speculative/tactical downgrade and thus we also set a trailing stop loss near the -10% relative return mark. While bulls would buy this breakout, we are sticking our heads out and recommend selling the strength and warn that the S&P semi equipment all-time highs look more like a mania, eerily similar to the dotcom bubble era (Chart 8). Chart 8Chip Equipment Mania
Chip Equipment Mania
Chip Equipment Mania
The contracting ISM manufacturing survey signals that relative share price momentum running at a 60%/annum clip is unwarranted and bound to return to earth (second panel, Chart 9). The same holds true for relative forward profit and revenue growth expectations, especially given the ongoing contraction in global semi sales (third & bottom panels, Chart 9). This deficient demand for semis and therefore semi equipment manufacturers is also apparent in deflating DRAM prices, our industry pricing power proxy. Historically, relative profit expectations and pricing power have moved in lockstep and the current message is to fade sell-side analysts’ buoyancy. Net earnings revisions have slingshot from extreme pessimism to extreme optimism during the past quarter and are vulnerable to disappointment (Chart 10). Chart 9To The Moon…
To The Moon…
To The Moon…
Chart 10…And Back?
…And Back?
…And Back?
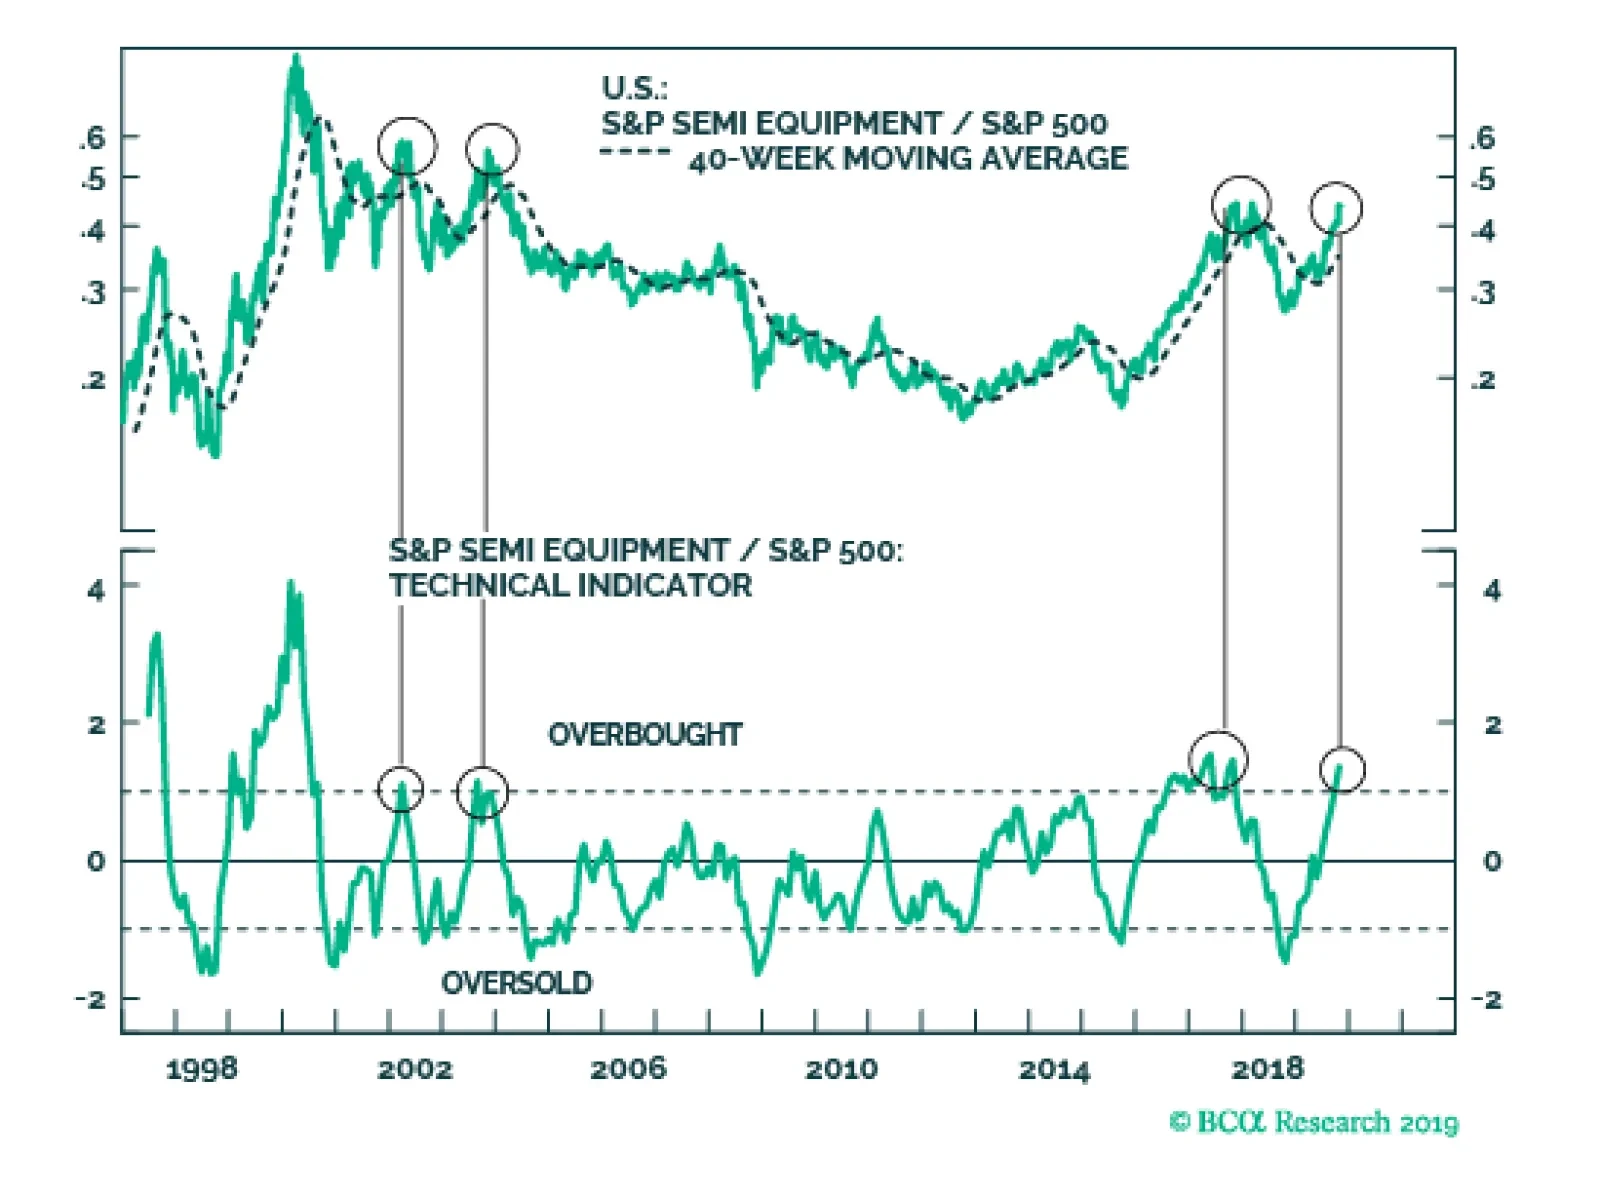
Not only is the relative share price momentum running at the fastest clip in 19 years, but our proprietary Technical Indicator is also signaling that it is a good time to shun away from these hyper-cyclical tech stocks. The last three times our TI spiked to over one standard deviation above the historical mean, relative share prices corrected on average by 36% in the ensuing 12-18 months (Chart 11). While we are confident to downgrade this index to underweight, there is a risk to our bearish view. Were the U.S. dollar to depreciate definitively from current levels, then it would reflate the global economy and put this position offside. In fact, there are some green shoots in the emerging markets that are appearing, but in order for them to blossom further and not get nipped in the bud the trade-weighted U.S. dollar has to fall (Chart 12). Chart 11Time To Be Contrarian
Time To Be Contrarian
Time To Be Contrarian
In sum, lack of profit growth, deficient industry demand, perky valuations and extremely overbought conditions all suggest that the time is ripe for an underweight stance in the S&P chip equipment index. Chart 12Risk To View: U.S. Dollar The Global Reflator
Risk To View: U.S. Dollar The Global Reflator
Risk To View: U.S. Dollar The Global Reflator
Bottom Line: Downgrade the S&P semi equipment index to underweight, today with a stop loss at the -10% relative return mark. The ticker symbols for the stocks in this index are: BLBG – S5SEEQ – AMAT, LRCX, KLAC. Is Semi Euphoria Warranted? Similar to the broad tech space and the S&P semiconductor equipment subgroup, semi producers are also showing signs of excess. Chart 13 shows that relative forward EPS are in a clear and steep downtrend with no end in sight, whereas relative share prices are near post GFC highs, pushing the semi forward P/E on a par with the SPX. While the relative margin squeeze in chip stocks has been a whopping 5%, semi forward margins are still projected to outpace overall market by an impressive 15% (bottom panel, Chart 13). Trailing semiconductor earnings are contracting and our newly created top-down chip profit growth model is sputtering, warning that more earnings pain lies ahead (semi pricing power, global exports and the greenback comprise our proprietary S&P semiconductors earnings model, Chart 14). While chip earnings season has been a mixed bag with INTC on the bullish side and TXN on the bearish camp, TXN’s CFO commentary really grabbed our attention musing that: “When there are tensions in trade and obstacles to trade, what do businesses do? They become more cautious. And they pull back. And we are at the very end of a long supply chain. And when the ones at the very front pull back, it becomes a traffic jam” (emphasis ours). Chart 13Falling Profits Should Exert Downward Pull On Stocks
Falling Profits Should Exert Downward Pull On Stocks
Falling Profits Should Exert Downward Pull On Stocks
Chart 14BCA Chip Profit Growth Model Is Bearish
BCA Chip Profit Growth Model Is Bearish
BCA Chip Profit Growth Model Is Bearish
Our global semi sales-to-inventories ratio is still contracting also warning that the path of least resistance is lower for chip profits (Chart 15). In other words, the inventory liquidation phase has just began and steep price concessions to rebalance the markets will continue to weigh on the sector’s profit prospects. With regard to chip final-demand, while 5G euphoria has gripped the sector, our proprietary global auto sales proxy and global capex indicator (using the IFO’s World Economic Survey dataset) underscore that the global chip down cycle is far from over (Chart 16). Chart 15Semi Down Cycle …
Semi Down Cycle …
Semi Down Cycle …
Chart 16… Is Far…
… Is Far…
… Is Far…
Netting it all out, the chip down cycle is ongoing and leading global semi sales indicators remain downbeat. Other macro variables confirm that semi end-demand remains feeble. The global manufacturing PMI is waning and our diffusion index is probing multi-year lows. Our in-house calculated Global ZEW survey is also heralding additional global semi sales weakness in the coming months as it is hovering near levels last hit during the Great Recession (middle panel, Chart 17). Chinese electronics imports remain in contractionary territory (bottom panel, Chart 17) and U.S. new orders for computers & electronic products are on the verge of contraction (not shown). Despite this souring backdrop, investors have given the semi industry the benefit of the doubt and are anticipating a swift final-demand recovery. Our indicators suggest otherwise, and we expect relative share prices to converge lower to still contracting relative profit and revenue estimates (Chart 18). Chart 17…From Over…
…From Over…
…From Over…
Chart 18…But Investors Are Mesmerized
…But Investors Are Mesmerized
…But Investors Are Mesmerized
Netting it all out, the chip down cycle is ongoing and leading global semi sales indicators remain downbeat. Moreover, our semi profit growth model is waving a yellow flag, compelling us to put the S&P semiconductors index on downgrade alert. Bottom Line: Stay on the sidelines in the S&P semiconductors index for now, remove the upgrade alert and put it on downgrade watch. Stay tuned. The ticker symbols for the stocks in this index are: BLBG – S5SECO – INTC, TXN, ADI, AMD, MXIM, XLNX, MCHP, NVDA, AVGO, QCOM, MU, SWKS, QRVO. Anastasios Avgeriou U.S. Equity Strategist anastasios@bcaresearch.com Footnotes 1. Please see BCA U.S. Equity Strategy Report, “Resilient” dated May 14, 2018, available at uses.bcaresearch.com. 2. https://www.wsj.com/articles/wave-of-financial-stress-hits-low-rated-companies-11571736606 Current Recommendations Current Trades Size And Style Views Stay neutral cyclicals over defensives (downgrade alert) Favor value over growth Favor large over small caps (Stop 10%)

Our technology model has predicted well periods of tech sector outperformance over the past several years. The model suggests that, in addition to being negatively related to prior overbought conditions, periods of technology sector outperformance are…
Highlights In this report, we build and present models designed to predict the odds of Chinese investable equity sector outperformance, based on a set of macroeconomic and equity market factors. BCA Research's China Investment Strategy service will aim to use our newly developed sector outperformance probability models to help investors to better understand the drivers of performance at any given moment, and to make more active equity sector recommendations in the future. Among the top six factors explaining historical periods of sector performance, three were macroeconomic in orientation, and two were directly related to the broad Chinese equity market. We see this as strongly supportive of the potential returns to be earned from active top-down sector rotation within China’s investable market. Cyclical stocks are very depressed relative to defensives, and we would favor them versus defensives over the coming year if China strikes a trade deal with the US and the Chinese economy incrementally improves, as we expect. Feature In our June 19 Special Report, we reviewed the predictability and cyclicality of equity sector earnings in China's investable & domestic markets, and examined the relevance of earnings in predicting relative sector performance over the past decade. We noted that a few sectors scored highly in terms of earnings predictability and the relevance of those earnings in predicting relative performance. But we also highlighted that most of China's equity sectors, in both the investable and domestic markets, either demonstrated earnings trends that were difficult to predict based on the trend in overall market earnings or exhibited relative performance that was difficult to explain based on the relative earnings profile. Our models are designed to predict equity sector relative performance using a series of macroeconomic and equity market factors. In short, our June report underscored that China’s equity sectors warranted a closer examination, with a particular emphasis on understanding the specific macroeconomic or equity market factors that have historically predicted relative sector performance. Today’s report examines this question in depth, focused on China’s investable equity market. We hope to extend our research to the A-share market in the near future. Our approach focuses on constructing and presenting models that quantify a checklist-based approach to determining the odds of equity sector performance. The aim is to use these models to better understand the drivers of performance at any given moment, and to make more active equity sector recommendations in the future. These recommendations will not mechanically follow the models; rather, we plan to use them as a stand in for what typically would be expected given the macro and financial market environment, and as a basis to investigate “abnormal” relative performance. We conclude by highlighting the substantial underperformance of cyclical vs defensives sectors over the past two years, and argue that it is highly unlikely that cyclicals will underperform defensives over the coming 12 months if China strikes a trade deal with the US and the economy incrementally improves, as we expect. We also explain the importance of monitoring the relative performance of health care & utilities stocks over the coming few months, and present a unique sector-based barometer for gauging China’s reflationary stance. The latter two relative performance trends are likely to assist investors in positioning for the big call: the outperformance of Chinese investable stocks vs the global benchmark. Detailing Our Approach In our effort to better understand historical periods of sector outperformance, we have chosen to model the probability of outperformance of each level 1 GICS sector (plus banks) based on a set of macro and equity market variables. Specifically, we use an analytical tool called a logistic regression, which forecasts the probability of a discrete event rather than forecasting the value of a dependent variable. We utilized this approach when building our earnings recession model for China (first presented in our January 16 Special Report1), and investors will often see it (in its conceptually different but practically similar probit form) employed when analyzing the likelihood of an economic recession. The New York Fed’s US recession model is a notable example of the latter,2 which has received much attention by market participants over the past year following the inversion of the US yield curve. The “events” that we modeled are historical periods of individual Chinese investable sector outperformance from 2010 to 2018, relative to the MSCI China index (the “broad market”). Charts I-1A and I-1B illustrate these periods with shading in each panel. We then attempt to explain these episodes of outperformance with the following macro predictors: Chart I-1AThis Report Builds Models Aimed At...
This Report Builds Models Aimed At...
This Report Builds Models Aimed At...
Chart I-1B...Predicting The Shaded Regions Of These Charts
...Predicting The Shaded Regions Of These Charts
...Predicting The Shaded Regions Of These Charts
Periods of accelerating economic activity, represented by our BCA's China Activity Index Periods of rising leading indicators of economic activity, represented by our BCA Li Keqiang Leading Indicator Episodes of tight monetary policy, defined as periods where China’s 3-month interbank repo rate is rising Periods of accelerating inflation, measured both by headline and core inflation We also include several equity market variables: uptrends in relative sector earnings, periods of rising broad market stock prices, uptrends in broad market earnings, and episodes of extreme technical conditions and relative over/undervaluation for the sector in question. In the case of energy stocks, we also include oil prices as a predictor. Charts I-2A and I-2B illustrate these periods as well as the macro & market variables that we have included as predictors. Chart I-2AWe Use These Macroeconomic And Equity Market Factors...
We Use These Macroeconomic And Equity Market Factors...
We Use These Macroeconomic And Equity Market Factors...
Chart I-2B...To Predict Periods Of Equity Sector Outperformance
...To Predict Periods Of Equity Sector Outperformance
...To Predict Periods Of Equity Sector Outperformance
Our approach also accounts for the existence of any leading or lagging relationships between the macro and market variables we have used as predictors and sector relative performance. In most cases the predictors lead relative sector performance, but in some cases it is the opposite. In the case of the latter, we have limited the lead of any variable in our models to 3 months in order to reduce the need to forecast. The link between tight monetary policy and industrial sector performance is one exception to this rule that we detail below. Finally, our approach also limits the extent to which we consider a leading relationship between our predictors and relative sector performance, in order to avoid picking up overlapping economic cycles. This issue, and the evidence supporting the existence of a 3½-year credit cycle in China, are detailed in Box 1. Box 1 Accounting For China’s 3½-Year Credit Cycle Over the course of the analysis detailed in this report, judgments concerning how much of a lead or lag to allow when accounting for any leading or lagging relationships between sector relative performance and either macroeconomic & stock market predictors were necessary. In cases where sector relative performance led any of our predictors, we capped the lead at 3-months to reduce the need to forecast the predictors when using the models. As explained below, the 8-month lead between industrial sector relative performance and tight monetary policy was the only exception to this rule. We also did not include any leading relationship between relative sector stock performance and the trend in relative sector EPS, and allowed at most a co-incident relationship. Limits were also required in the cases where our predictors led relative sector performance. While more lead time is usually better from the perspective of investment strategy, Chart I-B1 presents strong evidence of a 3½ -year credit cycle in China. Chart I-B2 illustrates the problem with including significant lags between predictors and relative sector performance when economic cycles are short. The chart shows the lead/lag correlation profile of the stylized cycle shown in Chart I-B1, and highlights that lags greater than 12-14 months risk picking up the impact of the previous economic cycle. Given this, we have limited the extent to which our predictors can lead relative sector performance in our models, and in practice lead times are generally less than one year. Chart I-B1Over The Past Decade, China Has Experienced A 3½-Year Credit Cycle
A Guide To Chinese Investable Equity Sector Performance
A Guide To Chinese Investable Equity Sector Performance
Chart I-B2With Short Cycles, Excessive Lags Risk Picking Up The Previous Cycle
With Short Cycles, Excessive Lags Risk Picking Up The Previous Cycle
With Short Cycles, Excessive Lags Risk Picking Up The Previous Cycle
The Key Drivers Of Chinese Investable Equity Sectors Pages 12-23 present the results of each sector’s outperformance probability model, along with a list of factors that were found to be useful predictors and a summary of the results. The importance of the factors included in the models is shown in each of the tables at the top right of pages 12-23 by a score of 1-3 stars, (loosely representing key levels of statistical significance) as well as each factor’s optimal lead or lag. A minus sign shows that the predictor leads sector relative performance, whereas a plus sign shows that it lags. Rising core inflation in China is the most important signal of sector performance that emerged from our analysis. Chart I-3China’s Sectors Linked Strongly To Core Inflation, Monetary Policy, And Growth
A Guide To Chinese Investable Equity Sector Performance
A Guide To Chinese Investable Equity Sector Performance
Chart I-3 summarizes the significance of the factors in predicting sector performance in general, by summing up each predictor’s number of stars across all of the models. The chart shows that rising core inflation in China is the most important signal of sector performance that emerged from our analysis, followed by tight monetary policy, rising economic activity, rising broad market stock prices, oversold technical conditions, and rising broad market earnings. Chart I-3 highlights two important points: If regarded through the lens of causality alone, the strong relationship between rising core inflation and sector performance is somewhat surprising: normally, pricing power is subordinate to revenue/sales/demand as the primary factor driving fundamental performance. However, given that inflation is a lagging economic variable, we suspect that the significance of inflation in our models actually reflects the middle phase of the economic cycle in which sectors tend to best exhibit meaningful out/underperformance. It is also a stronger predictor of periods of tight monetary policy in China than headline inflation.3 This is an encouraging result for investors, as it suggests good odds that future episodes of meaningful sector outperformance can be identified given a particular macro view. Among the top six factors explaining historical periods of sector performance, three were macroeconomic in orientation, and two were directly related to the broad Chinese equity market. While Chinese equity sector performance can sometimes be idiosyncratic, we see this as strongly supportive of the idea that investors can earn positive excess returns by actively shifting between China’s equity sectors using a top-down approach. Turning to the specific results of our sector models, we present the following big-picture findings of our research: Defining China’s Cyclical & Defensive Sectors From a top-down perspective, the most important element of sector rotation typically involves shifting from defensive to cyclical stocks when economic activity is set to improve (and vice versa). In China, it is clear from the results of our models that the investable energy, materials, industrials, consumer discretionary, and information technology sectors are cyclical sectors. The relative performance of these sectors exhibits a positive relationship to pro-cyclical macro variables, or broad market trends. Following last year’s GICS changes, we also include the media & entertainment industry group (within the new communication services sector) in this list. Correspondingly, investable consumer staples, health care, financials, telecom services, utilities, and real estate are defensive sectors in China. Chart I-4Cyclical Stocks Are Bombed Out Versus Defensives
Cyclical Stocks Are Bombed Out Versus Defensives
Cyclical Stocks Are Bombed Out Versus Defensives
Chart I-4 illustrates how these sectors have performed over the past decade by grouping them into equally-weighted cyclical and defensive stock price indexes, as well as the relative performance of cyclicals versus defensives. The chart makes it clear that cyclical stock performance is essentially as weak as it has ever been relative to defensives over the past decade, with the exception of a brief period in 2013. Panel 2 highlights that all of the underperformance of cyclicals over the past two years has been due to de-rating, rather than due to underperforming earnings. The Atypical Case Of Financials & Real Estate The fact that financial and real estate stocks are defensive in China is somewhat curious. In the case of financials, the abnormality is straightforward: most global equity portfolio managers would consider financials to be cyclical, and our work suggests that this is not true for the investable market. Our explanation for this apparent discrepancy is also straightforward: while small and medium banks in China have obviously grown in prominence over the past decade, large state-owned or state-affiliated commercial banks are still dominant in the provision of credit to China's old economy. In most cases China’s large banks lend to state-owned enterprises with implicit government guarantees, meaning that the earnings risk for Chinese banks has typically been lower than for the investable market in the aggregate. It remains to be seen whether this will remain true in a world where Chinese policymakers are keen to slow the pace at which China’s macro leverage ratio rises and to render the existing stock of debt more sustainable for the non-financial sector. Indeed, over a multi-year time horizon, the risk are not trivial that banks will be forced to recapitalize as a result of forced changes to loan terms (eg: significant increases in the amortization period of existing loans) or the recognition of sizeable loan losses, which would clearly increase the cyclicality of the Chinese investable financial sector. Chart I-5A Seeming Contradiction: Real Estate Is High-Beta, But Defensive
A Seeming Contradiction: Real Estate Is High-Beta, But Defensive
A Seeming Contradiction: Real Estate Is High-Beta, But Defensive
On the real estate front, the anomaly is not that real estate stocks respond defensively to macroeconomic and stock market variables, it is that real estate stock prices are considerably more volatile than this defensive characterization would suggest. Globally (and especially in the US), real estate stocks are often viewed as bond proxies and thus are typically low-beta, but Chart I-5 shows that this is not the case in China. In our view, this issue is reconciled by the fact that Chinese investable real estate stocks are also highly positively linked to Chinese house price appreciation, with relative performance typically leading a pickup in house prices by up to 1 year. This strongly leading relationship has meant that real estate stocks have often outperformed the broad market as economic activity is slowing, in anticipation that policy easing will lead to an eventual recovery in house prices. Chart I-6Still Following The Defensive Playbook This Year
Still Following The Defensive Playbook This Year
Still Following The Defensive Playbook This Year
In effect, investable real estate stocks are a high-beta sector that have acted counter-cyclically due to the historical interplay between economic activity, monetary policy, and the housing market. Real estate performance this year has not deviated from this playbook (Chart I-6), and so for now we are content to include real estate stocks in our defensive index. But similar to the case of financials, we can conceive of scenarios in which ongoing Chinese financial sector reform may change this relationship in the future. The Unique Monetary Policy Sensitivity Of Industrials And Consumer Staples Pages 14 and 16 highlight that industrials and consumer staples stocks have typically been sensitive to periods of tight monetary policy. In the case of industrials the relationship is negative, whereas consumer staples relative performance has been positively linked to these periods. In both cases, relative performance has led periods of tight monetary policy, significantly so in the case of industrials (by an average of 8 months). While the relative performance of banks, tech, and real estate stocks have also been linked to periods of tight monetary policy, industrials and consumer staples are the only sectors that have tended to lead these periods. Chart I-7Diverging Corporate Health Explains Industrials/Staples Monetary Policy Sensitivity
Diverging Corporate Health Explains Industrials/Staples Monetary Policy Sensitivity
Diverging Corporate Health Explains Industrials/Staples Monetary Policy Sensitivity
This is a revelatory finding, and in our view it is explained by divergences in corporate health and leverage for the two sectors. We reviewed Chinese corporate health in our August 28 Special Report,4 and noted that the food & beverage sub-industry was a clear (positive) outlier based on our corporate health monitors. In particular, Chart I-7 highlights that food & beverage corporate health is markedly better than that for machinery companies or for industrial firms in general, supporting the notion that high (low) leverage is impacting the relative performance of industrials (consumer staples). The Leading Nature Of Health Care & Utilities Health care and utilities exhibit similar key drivers of relative performance: in both cases, periods of rising economic activity, rising core inflation, and rising broad market stock prices are all negatively associated with performance. Health care and utilities relative performance also happens to lead all three of those predictors, by 1-3 months on average depending on the variable in question. Our modeling work highlights that these are the only sectors whose relative performance has led multiple factors, suggesting that health care & utilities stocks are particularly interesting market bellwethers to monitor. Core Inflation Matters More Than Headline, Except For Energy & Real Estate As highlighted in Chart I-3, rising core inflation has been a much more important signal about relative sector performance than headline inflation. Chart I-8In China, Food Prices (Not Energy) Account For Headline/Core Differences
In China, Food Prices (Not Energy) Account For Headline/Core Differences
In China, Food Prices (Not Energy) Account For Headline/Core Differences
The two exceptions to this rule relate to the energy and real estate sectors, with the former positively linked to headline inflation and the latter negatively linked. In both cases, we suspect that the relationship is a behavioral rather than a fundamental one. For energy, while rising headline inflation in developed countries is usually associated with rising energy prices, this is not true in the case of China. Chart I-8 highlights that differences between headline and core inflation over the past decade have almost always been driven by rising food prices. This implies that some investors (incorrectly) view energy stocks as a hedge against increases in consumer prices, even if those increases are not driven by rising fuel costs. In the case of real estate, investor expectations of eroding real disposable income and its impact on the housing market are likely the best explanation for the negative link between real estate relative performance and rising headline inflation. Whereas rising core inflation likely reflects a durable improvement in economic momentum (and thus would be positively correlated with income growth), episodes of rising Chinese headline inflation often reflect supply shocks that investors may perceive to be detrimental to household spending power (and thus expected housing demand). Investment Conclusions Our work aimed at explaining historical periods of Chinese investable sector outperformance has three investment implications in the current environment. Cyclicals will probably outperform defensives over the coming year if China strikes a trade deal with the US and the Chinese economy incrementally improves, as we expect. First, within China’s investable market, Chart I-4 illustrated that cyclical stocks are very depressed relative to defensives. Given our view that Chinese investable stocks are likely to outperform their global peers over a 6-12 month time horizon, we would also favor cyclicals to defensives over that period. For investors who are not yet overweight cyclical stocks in China, we would advise waiting for concrete signs that growth has bottomed (which should emerge sometime in Q1) before putting on a long position as we remain tactically neutral towards Chinese versus global stocks. But the key point is that it is highly unlikely that cyclicals will underperform defensives over the coming year if China strikes a trade deal with the US and the Chinese economy incrementally improves, as we expect. Second, the fact that investable health care and utilities stocks have particularly leading properties suggests that they should be monitored closely over the coming few months. A technical breakdown in the relative performance of these sectors would be an important sign that market participants are anticipating a bottoming in China’s economy, which may give investors a green light to position for a bullish cyclical stance. For now, both of these sectors continue to outperform (Chart I-9), supporting our decision to remain tactically neutral towards Chinese stocks. Third, the heightened negative sensitivity of industrials and positive sensitivity of consumer staples to monetary policy suggests that the relative performance trend between the two sectors may serve as a reflationary barometer for China’s economy. Chart I-10 shows that industrials outperformed staples last year once the PBOC shifted into easing mode, and anticipated the recovery in the pace of credit growth. However, industrials soon began to underperform staples, which also seems to have anticipated the fact that the recovery in credit was set to be less powerful than what has occurred during previous cycles. The fact that the relative performance trend is off its recent low is notable, and may suggest that China’s existing reflationary stance will be sufficient to stabilize economic activity if a trade deal with the US is indeed finalized in the near future. Chart I-9Key Defensive Sectors Are Still Outperforming, Supporting Our Neutral Tactical Stance
Key Defensive Sectors Are Still Outperforming, Supporting Our Neutral Tactical Stance
Key Defensive Sectors Are Still Outperforming, Supporting Our Neutral Tactical Stance
Chart I-10Industrials Vs. Staples Anticipated That Easing Would Only Be Measured
Industrials Vs. Staples Anticipated That Easing Would Only Be Measured
Industrials Vs. Staples Anticipated That Easing Would Only Be Measured
As a final point, BCA Research's China Investment Strategy service will aim to use our newly developed sector outperformance probability models to make more active equity sector recommendations in the future. These recommendations will not mechanically follow the models; rather, we plan to use the models as a stand in for what typically would be expected given the macro and financial market environment, and as a basis to investigate “abnormal” relative performance. We hope you will find these models to be a helpful quantification of the risk versus return prospects of allocating among China’s investable sectors. As always, we welcome any feedback that you may have about our approach. Energy Chart II-1
Energy
Energy
Table II-1
A Guide To Chinese Investable Equity Sector Performance
A Guide To Chinese Investable Equity Sector Performance
Unsurprisingly, our energy sector model highlights that periods of energy outperformance are strongly linked to periods of rising crude oil prices. However, what is surprising is that periods of accelerating headline inflation in China are even more closely linked to periods of energy sector outperformance than episodes of rising oil prices, and that these periods of accelerating inflation are not generally caused by rising energy prices. The lack of a clear economic rationale for this relationship implies that some investors (incorrectly) view energy stocks as a hedge against increases in consumer prices, even if those increases are largely driven by rising food prices. The model also highlights that periods of strong undervaluation have historically been significant in predicting future energy sector outperformance, with a lag of roughly 8 months. The probability of energy sector outperformance has fallen sharply according to our model, but for now we continue to recommend a long absolute energy sector position on a 6-12 month time horizon. BCA’s Commodity & Energy Strategy service expects oil prices to trade at $70/barrel on average next year,5 Chinese headline inflation continues to rise, and we noted in our October 2 Weekly Report that energy stocks are heavily discounted.6 Barring a durable decline in oil prices below $55/barrel, investors should continue to favor China’s energy sector. Materials Chart II-2
Materials
Materials
Table II-2
A Guide To Chinese Investable Equity Sector Performance
A Guide To Chinese Investable Equity Sector Performance
Our model highlights that the materials sector is one of the clearest plays on accelerating industrial activity within the investable universe. Among the macro variables that we tested, periods of investable materials outperformance are strongly positively linked with periods when our BCA Activity Index and our leading indicator for the index have been rising. Periods of materials sector outperformance have also been positively correlated with prior periods of oversold technical conditions and rising broad market stock prices, underscoring that materials are a strongly pro-cyclical sector. We currently maintain no active relative sector trades, but our model suggests that investors should be underweight the investable materials sector relative to the broad investable index. Industrials Chart II-3
Industrials
Industrials
Table II-3
A Guide To Chinese Investable Equity Sector Performance
A Guide To Chinese Investable Equity Sector Performance
Periods of industrial sector outperformance have historically been positively correlated with relative industrial sector earnings, broad market stock prices, and prior oversold technical conditions. They have been negatively correlated with periods of tight monetary policy, rising core inflation, and prior overbought technical conditions. Since 2010, periods of industrial sector performance have led periods of tight monetary policy by 8 months, the longest lead of relative equity performance to any macro variable that we tested in our model (and the longest lead that we allowed). Industrial sector performance has also been strongly negatively linked with periods of rising core inflation. These findings, and the fact that our Activity Index and its leading indicator have not been highly successful at predicting periods of industrial sector outperformance, strongly suggest that industrials, while pro-cyclical, are primarily driven by expectations of easy monetary policy. We noted in an August 2018 Special Report that state-owned enterprises have become substantially leveraged over the past decade,7 and in a more recent report we highlighted that industries such as machinery have experienced a significant deterioration in corporate health over the past decade.8 This helps explain why industrial sector performance is so negatively impacted by tight policy. Our model suggests that the best time to be overweight industrial stocks is the early phase of an economic rebound, when Chinese stock prices are rising but market participants are not yet expecting tighter policy. These conditions may present themselves sometime in Q1, but probably not over the coming 0-3 months. Consumer Discretionary Ex-Internet & Direct Marketing Retail Chart II-4
Consumer Discretionary Ex-Internet & Direct Marketing Retail
Consumer Discretionary Ex-Internet & Direct Marketing Retail
Table II-4
A Guide To Chinese Investable Equity Sector Performance
A Guide To Chinese Investable Equity Sector Performance
Besides materials, China’s investable consumer discretionary sector has historically been the most positively associated with coincident and leading measures of industrial activity. Rising core inflation is also highly positively related to consumer discretionary outperformance, which may reflect improved pricing power for the sector. The strong link with industrial activity is in contrast to depictions of China’s consumer sector as being less correlated to money & credit trends than the overall economy, and is supportive of our view that industrial activity forms one of the three pillars of China’s business cycle.9 We ended the estimation period of our model as of December 2018, in order to avoid including the distortive effects of last year’s changes to the global industry classification standard (which resulted in Alibaba’s inclusion and overwhelming representation in the investable consumer discretionary sector). As such, the results of our model apply today to consumer discretionary stocks ex-internet & direct marketing retail. For now, the absence of an uptrend in our Activity Index and in core inflation is signaling underperformance of discretionary stocks outside of internet & direct marketing retail. Outperformance this year largely reflects a significant advance in consumer durable and apparel: by contrast, automobiles & components have underperformed the broad market by roughly 14% year-to-date. Consumer Staples Chart II-5
Consumer Staples
Consumer Staples
Table II-5
A Guide To Chinese Investable Equity Sector Performance
A Guide To Chinese Investable Equity Sector Performance
Historically, periods of consumer staples outperformance have been predicted by a falling Activity Index, periods of tight monetary policy, and over/undervalued conditions. The impact of monetary policy is particularly heavy in the model, suggesting that consumer staples are somewhat the mirror image of industrials in terms of the impact of leverage on relative equity performance. This too is supported by our August 28 Special Report,10 which noted that corporate health for the food & beverage sector was the strongest among the sectors we examined. However, the model failed to capture what has been very significant staples outperformance this year, highlighting the occasional limits of a rule-of-thumb approach to sector allocation. Investable consumer staples are reliably low-beta compared with the broad market, and we are not surprised that investors have strongly favored the sector this year amid enormous economic and policy uncertainty. An eventual improvement in economic activity, coupled with fairly rich valuation, should work against consumer staples stocks sometime in the first quarter of 2020. Investors who are positioned in favor of China-related assets should also be watching closely for any signs of a technical breakdown in the relative performance trend of investable staples. Health Care Chart II-6
Health Care
Health Care
Table II-6
A Guide To Chinese Investable Equity Sector Performance
A Guide To Chinese Investable Equity Sector Performance
Among the macro variables tested in our model, periods of health care outperformance are negatively related to coincident and leading measures of industrial activity and strongly negatively related to rising core inflation. Health care outperformance is also strongly negatively related to periods of rising broad market stock prices, and positively related to prior oversold technical conditions. These results clearly signify that investable health care is a defensive sector, to be owned when the economy is slowing and when investable stocks in general are trending lower. Our model suggests that health care stocks are likely to continue to outperform, as they have been since the beginning of the year. A substantive US/China trade deal that meaningfully reduces economic uncertainty remains the key risk to health care outperformance over a 6- to 12-month time horizon. Financials Chart II-7
Financials
Financials
Table II-7
A Guide To Chinese Investable Equity Sector Performance
A Guide To Chinese Investable Equity Sector Performance
Our model highlights that periods of financial sector outperformance over the past decade have been negatively associated with periods of rising core inflation (a strong relationship), and with periods of rising index earnings. Oversold technical conditions have also helped explain future episodes of financial sector outperformance. The link between core inflation and the outperformance of financials appears to represent a behavioral rather than a fundamental relationship. When modeling periods of rising financial sector relative earnings, the trend in broad market EPS is more predictive than that of core inflation, highlighting that the latter’s explanatory power is due to investor behavior. The results of our model, and the fact that core inflation leads Chinese index earnings, suggests that financials are fundamentally counter-cyclical and that investors see rising Chinese core inflation as confirmation that an economic expansion is underway (and that broad market earnings are likely to rise). Our model is currently predicting financial sector outperformance, but investable financials have modestly underperformed since the beginning of the year. This appears to have been caused by the underperformance of financial sector earnings this year as overall index earnings growth has decelerated, contrary to what history would suggest. We suspect that the ongoing shadow banking crackdown is related to financial sector earnings underperformance, and we would advise against an overweight stance towards investable financials until signs of improving relative earnings emerge. Banks Chart II-8
Banks
Banks
Table II-8
A Guide To Chinese Investable Equity Sector Performance
A Guide To Chinese Investable Equity Sector Performance
Our model shows that periods of banking sector outperformance are more linked to macro variables than has been the case for the overall financial sector. Specifically, bank performance is negatively correlated with leading indicators of economic activity and rising core inflation, and especially negatively correlated with periods of tight monetary policy. Banks have also typically outperformed following periods of oversold technical conditions. Similar to financials, bank earnings are typically counter-cyclical, but relative bank earnings have not been good predictors of relative bank performance over the past decade. Still, the negative association of relative stock prices with leading economic indicators, rising core inflation and rising interest rates underscores that investors should normally be underweight banks if they expect overall Chinese stock prices to rise. Also similar to the overall financial sector, our model is currently predicting outperformance for bank stocks, but investable banks have underperformed year-to-date. The shadow banking crackdown is also likely impacting investable bank earnings, leading to a similar recommendation to avoid bank stocks until relative earnings look to be trending higher. “Tech+” Chart II-9
Tech+'
Tech+'
Table II-9
A Guide To Chinese Investable Equity Sector Performance
A Guide To Chinese Investable Equity Sector Performance
Our technology model has worked well at predicting periods of tech sector outperformance over the past several years, particularly from 2015 – 2017. The model suggests that, in addition to being negatively related to prior overbought conditions, periods of technology sector outperformance are associated with improving growth conditions, easy monetary policy, and rising prices. In other words, tech stocks are a growth & liquidity play. Owing to last year’s changes to the GICS, the results of our model apply today to Chinese investable internet & direct marketing retail, the media & entertainment industry group (within the new communication services sector), and the now considerably smaller information technology sector (the sum of which could be considered the “tech+” sector). The model has been predicting tech sector outperformance since May (in response to easier monetary policy), which has occurred for the official information technology sector. However, the BAT (Baidu, Alibaba, and Tencent) stocks are only up fractionally in relative terms from their late-May low. Our expectation that China’s economy is likely to bottom in Q1 means that we may recommend upgrading “tech+” stocks relative to the investable benchmark in the coming months. Telecom Services Chart II-10
Telecom Services
Telecom Services
Table II-10
A Guide To Chinese Investable Equity Sector Performance
A Guide To Chinese Investable Equity Sector Performance
Our model for telecommunication services (now a level 2 industry group within the communication services sector) illustrates that telecom stocks have historically been counter-cyclical. Periods of telecom outperformance have been negatively associated with periods of rising core inflation, rising broad market stock prices, and rising broad market EPS. It is notable that telecom services stocks are driven more by cycles in overall stock prices than by cycles in economic activity. This suggests that investors tend to focus on the fact that telecom stocks are reliably low-beta compared with the overall investable market, causing out(under)performance of telecoms when the broad market is falling(rising). Similar to financials & banks, telecom stocks have not outperformed this year, in contrast to what our model would suggest. Earnings also appear to be the culprit, with the level of 12-month trailing earnings having fallen nearly 10% since the summer. China Mobile accounts for a sizeable portion of the telecom services index, and the company’s recent earnings weakness seems to be due to depreciation charges stemming from forced investment on 5G spending (mandated by the Chinese government). Our sense is that this will have only a temporary effect on telecom services EPS, meaning that investors should continue to expect the sector to behave in a counter-cyclical fashion over the coming year. Utilities Chart II-11
Utilities
Utilities
Table II-11
A Guide To Chinese Investable Equity Sector Performance
A Guide To Chinese Investable Equity Sector Performance
The early performance of our utilities model was mixed, as it generated several false sell signals during the 2011 – 2013 period despite recommending, on average, an overweight stance. However, over the past five years, the model has performed extremely well in terms of explaining periods of relative utilities performance. The model highlights that utilities are straightforwardly counter-cyclical. The relative performance of utilities stocks is positively related to its relative earnings trend, and negatively related to economic activity, rising core inflation, and broad market stock prices. Consistent with a decline in the overall MSCI China index, the model has correctly predicted utilities outperformance this year. We expect utilities to underperform over a 6-12 month time horizon, but would advise against an aggressive underweight position until hard evidence of a bottom in Chinese economic activity emerges. Real Estate Chart II-12
Real Estate
Real Estate
Table II-12
A Guide To Chinese Investable Equity Sector Performance
A Guide To Chinese Investable Equity Sector Performance
Our model for the relative performance of investable real estate has been among the most successful of those detailed in this report, which is somewhat surprising given the macro factors that the model shows drive real estate performance. While periods of relative real estate performance are modestly (negatively) associated with periods of tight monetary policy, rising headline inflation is the most important macro predictor of real estate underperformance. Among market factors driving performance, real estate stocks reliably underperform when broad market EPS are trending higher, and they historically outperform for a time after becoming relatively undervalued. Real estate relative performance is also strongly linked to periods of rising house prices, but the former tends to significantly lead the latter. Given that core inflation has better predicted episodes of tight monetary policy than headline inflation, investor expectations of eroding real disposable income is likely the best explanation for the negative link between real estate relative performance and rising headline inflation. Whereas rising core inflation likely reflects a durable improvement in economic momentum (and thus would be positively correlated with income growth), episodes of rising Chinese headline inflation often reflect supply shocks that investors may perceive to be detrimental to household spending power (and thus expected housing demand). Beyond the negative link between higher inflation and interest rates on investable real estate performance, the strong negative association with broad market earnings underscores that investors treat real estate as a defensive sector. We thus expect real estate stocks to continue to outperform in the near term, but underperform over a 6-12 month time horizon. Jonathan LaBerge, CFA Vice President jonathanl@bcaresearch.com Footnotes 1. Please see China Investment Strategy, "Six Questions About Chinese Stocks," dated January 16, 2019. 2. Please see Federal Reserve Bank of New York, The Yield Curve as a Leading Indicator at https://www.newyorkfed.org/research/capital_markets/ycfaq.html 3. This is despite frequent concerns among investors that the PBOC is inclined to tighten in response to detrimental supply shocks. 4. Please see China Investment Strategy, "Messages From BCA’s China Industry Watch," dated August 28, 2019. 5. Please see Commodity & Energy Strategy, "Policy Uncertainty Lifts USD, Stifles Global Oil Demand Growth," dated October 17, 2019. 6. Please see China Investment Strategy, "China Macro & Market Review," dated October 2, 2019. 7. Please see China Investment Strategy, "Chinese Policymakers: Facing A Trade-Off Between Growth And Leveraging," dated August 29, 2018. 8. Please see China Investment Strategy, "Messages From BCA’s China Industry Watch," dated August 28, 2019. 9. Please see China Investment Strategy, "The Three Pillars Of China’s Economy," dated May 16, 2018. 10. Please see China Investment Strategy, "Messages From BCA’s China Industry Watch," dated August 28, 2019. Cyclical Investment Stance Equity Sector Recommendations
The Message From The Cloud
The Message From The Cloud
Overweight The S&P software index’s – dominated by MSFT – frenetic year-to-date run has lost steam lately, and pure play cloud stocks are sending an unambiguous negative signal. Worryingly, cloud stocks may be sniffing out a services slowdown. Put differently, cloud stocks may be anticipating that the manufacturing sector’s ills are infiltrating services. We have created the U.S. Equity Strategy Cloud Index, comprising five cloud stocks, and their recent drubbing warrants caution for the rest of the software complex (top panel). As a reminder, these stocks troughed in October last year, prior to the SPX and S&P software’s Christmas Eve bottom. Today, we are heeding the leading properties that cloud stocks appear to possess. Bottom Line: Stay overweight the heavyweight S&P software index but sustain the trialing stop at the 27% relative return mark since inception. The ticker symbols in the BCA USES Cloud Index and the S&P Software index are: VEEV, WDAY, NOW, TWLO, SPLK, and BLBG: S5SOFT – MSFT, ORCL, ADBE, CRM, INTU, ADSK, CDNS, SNPS, ANSS, SYMC, CTXS, FTNT, respectively.
Highlights A recovery in Chinese auto sales is not imminent. Car sales will likely stage only a rate-of-change improvement, moving from deep to mild contraction or stagnation over the next three-to-six months. Low-speed electric vehicles are a cheap substitute for regular low-end cars. Their production requires fewer inputs and parts compared to cars. Hence, their rising penetration will be negative for economic activity at the margin. Auto ownership will continue to rise in China in the years to come. However, this does not necessitate rising car sales. In fact, auto ownership can increase with car sales contracting in each consecutive year. This scenario represents a major risk to auto stock prices. Feature Chart 1Chinese Auto Sales: An Extended Downturn
Chinese Auto Sales: An Extended Downturn
Chinese Auto Sales: An Extended Downturn
Chinese automobile sales have been deep under water for 15 consecutive months. The magnitude of the contraction has been even worse than the one that occurred in 2008-‘09. Annualized sales1 have declined from a peak of nearly 30 million units in June 2018 to 26 million this September (Chart 1). To put this 4-million-unit decline into perspective, only about 5 million units of automobiles were produced in Germany last year. Given the already long and deep contraction, does this mean Chinese auto sales and production are about to stage an imminent recovery? Although a revival sometime next year is plausible, we are not positive in the near term. Car sales will stage a rate-of-change improvement only, moving from deep to mild contraction or stagnation (i.e. zero growth) the next three to six months (Chart 1, bottom panel). Gauging The Demand Outlook Chart 2Marginal Propensity To Spend Is Falling
Marginal Propensity To Spend Is Falling
Marginal Propensity To Spend Is Falling
Reluctance to purchase a car and curtailed financing are the causes of the deep auto sales contraction in China. The factors that have weighed on consumers’ willingness to purchase cars remain intact. First, our indicator for household marginal propensity to spend continues to fall, indicating no immediate signs of a turnaround (Chart 2). Cyclically, decelerating economic activity is weighing on income expectations, prompting consumers to delay their discretionary spending. Besides, the growth rate of disposable income per capita is at the lower end of its historical range and is falling in real (inflation-adjusted) terms (Chart 3). In addition, Chinese households are more leveraged now than their U.S. counterparts (Chart 4). Their debt levels have reached over 120% of annual disposable income. Chart 3Real Disposable Income Growth Is Weakening
Real Disposable Income Growth Is Weakening
Real Disposable Income Growth Is Weakening
Chart 4Chinese Households Are Increasingly Indebted
Chinese Households Are Increasingly Indebted
Chinese Households Are Increasingly Indebted
Meanwhile, the U.S.-China confrontation continues to foster uncertainty among consumers and businesses in the Middle Kingdom. Although some sort of agreement was reached last week, the future of longer-term U.S.-China relations remains highly uncertain. Hence, the potential “phase-one” trade agreement is unlikely to shift Chinese consumers’ and businesses’ overall cautious sentiment. These factors will continue to weigh on consumers’ purchasing behavior, especially on big-ticket items like automobiles. Reluctance to purchase a car and curtailed financing are the causes of the deep auto sales contraction in China. Second, Chinese auto financing penetration rate – measured as the proportion of autos bought using borrowed funds – has risen from 20% in 2014 to about 48%2 last year. This remains well below the 70%-plus penetration rate in major western countries (the U.S., Germany and France), but is not far from the 50% rate in Japan. The rapid increase in the use of auto financing has facilitated auto sales in China over the past several years. Financing for auto purchases has been provided by banks via loans and credit cards, dealer/manufacturer loans and peer-to-peer lending (P2P). While banks contribute about 40% of auto financing and auto dealers/manufacturers account for about 30%, the peer-to-peer platform has become the third major source of auto loans in recent years. Chart 5Limited Auto Financing From Peer-To-Peer Platforms
Limited Auto Financing From Peer-To-Peer Platforms
Limited Auto Financing From Peer-To-Peer Platforms
However, since early last year, bankruptcies and closures of P2P platforms have significantly reduced available auto financing. P2P financing continues to shrink, further depressing loans for auto purchases (Chart 5). Third, there is an ongoing structural decline in consumers’ willingness to purchase cars due to greater traffic congestion, limited parking and improved public transportation. In addition, greater use of ride-sharing and car-sharing services, which the government is aiming to promote, will also continue to reduce the need to buy a car. Concerning government incentives for auto buyers, auto sales have failed to recover, so far this year, despite policy support and significant auto price cuts (Box 1). Although the government recently loosened some restrictive auto sales policies in certain cities,3 the scale was much smaller than what was done earlier this year. As in any market, production decisions are driven by sales, not inventories. Box 1 Policy Support And Auto Price Cut During January-September 2019 Since late January, Chinese authorities have released a set of pro-auto-consumption measures aimed at spurring auto sales. These measures include the approval of 100,000 new license plates in Guangzhou province and an additional 80,000 in Shenzhen. Since May, auto dealers in China have slashed prices of their Emission Standard 5 cars in order to liquidate inventories, as 15 provinces/provincial level cities have been implementing the new emissions standards since July 1, 2019 – one year earlier than the national implementation deadline. According to the law, vehicles that do not meet the new standard will not be allowed to be sold or registered once the new standard is implemented. Another pertinent question to address is whether inventories can be used to identify a bottom in this industry. This is difficult to gauge in China, as inventories at different stages of the supply chain are currently sending conflicting signals. Manufacturers’ inventories have dropped to low levels (Chart 6). Yet, dealers’ inventories remain elevated according to the newly released inventory data for September (Chart 7). Chart 6Auto Manufacturers Inventories Are Low...
Auto Manufacturers Inventories Are Low...
Auto Manufacturers Inventories Are Low...
Chart 7...But Dealers Inventories Remain Elevated
...But Dealers Inventories Remain Elevated
...But Dealers Inventories Remain Elevated
Chart 8Auto Demand Drives Production
Auto Demand Drives Production
Auto Demand Drives Production
As in any market, production decisions are driven by sales, not inventories. The chain reaction always starts from demand: rising sales lead to rising production. Producers do not typically ramp up output when sales are falling, even if inventories are low (Chart 8). Without a strong and durable rise in demand, manufacturers will not significantly increase their inventories. In short, low car inventories among manufacturers could lead to a short-term rise in output. A sustainable and lasting recovery in production, however, is contingent on a cyclical revival in auto sales. Bottom Line: A cyclical recovery in auto sales is not imminent in the next three-to-six months. A Threat From A Cheap Substitute In many small cities (from Tier 3 to Tier 6 cities), towns and villages where auto buyers are more sensitive to prices, consumers are opting to purchase low-speed electric vehicles (LSEVs) – a cheap substitute for regular autos. Last year, LSEV makers sold about 1.5 million units in China, accounting for about 6% of passenger vehicle sales for the year. In comparison, even with massive government subsidies, total new energy vehicle (NEV, mainly including pure electric vehicles and plug-in hybrids) sales only reached 1.2 million units in 2018, 20% lower than LSEV sales. In many small cities, towns and villages consumers are opting to purchase low-speed electric vehicles (LSEVs) – a cheap substitute for regular autos. LSEVs are small, short-range electric vehicles (three- or four-wheeled cars) with top driving speeds below 80km per hour and with a similar look to regular cars.4 They have much lower technical and safety standards: LSEVs are not considered automobiles by the country’s motor vehicle management system. Consequently, official auto production and sales data released by authorities do not include LSEV figures. Chart 9Significant Output Expansion In Low-Speed Electric Vehicles
Significant Output Expansion In Low-Speed Electric Vehicles
Significant Output Expansion In Low-Speed Electric Vehicles
Technically, these vehicles are within some sort of grey area of Chinese regulations, but that has not stopped the industry's remarkable growth. Shandong province accounts for about 40% of the country’s LSEV output. The dramatic LSEV production expansion in the province gives a glimpse into the booming LSEV industry in China (Chart 9). Last year’s LSEV production drop was due to the government’s tightening of LSEV output policies and greater competition from small-size pure electric vehicles, which benefited from government subsidies. Both factors have diminished this year due to policy changes and the termination of subsidies for the small-size pure electric vehicle. Looking forward, consumers will continue purchasing LSEVs as a substitute for lower-end cars. They will have negative effect on low-end car sales, especially when household budgets tighten. Table 1 lays out the main differences between an LSEV and a lower-end passenger car. Clearly, the most attractive feature of an LSEV is its price, which can be as cheap as 10,000 RMB (less than US$2,000) with a big proportion of LSEVs ranging from 20,000 RMB to 30,000 RMB. In comparison, prices of lower-end passenger vehicles in general range from 50,000RMB to 80,000 RMB, more expensive than LSEVs. As nearly half of Chinese households already own an automobile, the potential of future auto sales clearly lies in lower-income households. However, the 2018 NBS household survey showed the annual household disposable income for the lowest 60% percentile rural households was lower than the low-end price of regular auto – 50,000 RMB (US$ 7,050) (Chart 10). In comparison, a much cheaper LSEV will be affordable for them. Given that they are inferior goods, LSEVs could become even more attractive at times of weak disposable income growth. In addition to cheap prices, Box 2 reveals other attractive features that will make LSEVs the most convenient and affordable form of transportation for many potential auto buyers. This will also help promote the popularity of the LSEVs in small cities and rural areas. Table 1The Comparison Between LSEVs And Lower-End Passenger Cars
Chinese Auto Demand: Time For A Recovery?
Chinese Auto Demand: Time For A Recovery?
Chart 10Low-Speed Electric Vehicles: Affordable For Lower-Income Households
Chinese Auto Demand: Time For A Recovery?
Chinese Auto Demand: Time For A Recovery?
Further, this year’s regulatory changes are also favorable for the LSEV industry (Box 3). This marked a clear policy reversal from last year when the government executed a crackdown on LSEV production and issued a policy prohibiting new capacity of LSEVs. Box 2 The Non-Price Reasons For The Increasing Popularity Of The LSEVs The LSEV is more convenient as it is easy to drive and to park because of its small size. The drive range of 100 km per charge of the battery is sufficient for a person who only uses it to go to work or pick up the kids from school. It is particularly useful in small cities and rural areas where the public transportation network is poor. The speed of 40-60 km per hour is also fast enough to drive in small cities and rural area where there are not much road traffic and the roads are often designed for low driving speed. LSEVs also have the benefit of being able to charge from home electrical outlets, eliminating the need to use public charging/fueling infrastructure. Box 3 Policy On LSEV Industry: More Favorable In 2019 Than In 2018 In March, the Ministry of Industry and Information Technology announced that by 2021 the national standards of the “Technical Conditions of Four-Wheel Low-Speed Electric Vehicles” would be established. This will eventually bring the LSEV market under the government’s supervision while giving LSEV makers two years to improve their technology. This will help improve the quality and safety measures of LSEVs. In May and June, over 20 cities started to issue car plates for LSEVs and approved of the LSEVs right to be on the road. This signals that the government is aiming to regulate the LSEV sector in a positive way, rather than simply banning production. Bottom Line: Cheap LSEVs will be a low-cost substitute for regular low-end cars. Their production requires fewer inputs and parts compared to cars. Hence, their rising penetration will be negative for economic activity at the margin. What About NEV Demand? New Electric Vehicle (NEV) sales were a bright spot among all categories of auto sales in China last year, with year-on-year growth of 62%. However, NEV sales growth has decelerated considerably this year as the government began cutting subsidies (Chart 11). NEV sales will remain under pressure. Table 2 shows the timeline of China’s NEV subsidy exit plan, which was released in late March. The subsidy is set to be phased out by 2021. Chart 11New Electric Vehicle Sales Growth Will Slow But Remain Positive
New Electric Vehicle Sales Growth Will Slow But Remain Positive
New Electric Vehicle Sales Growth Will Slow But Remain Positive
Table 2The China’s New Electric Vehicle Subsidy Exit Plan
Chinese Auto Demand: Time For A Recovery?
Chinese Auto Demand: Time For A Recovery?
In comparison to last year, there will be no subsidy at all for pure electric vehicles (PEVs) with recharge mileage of 250 kilometers and lower. This will make it more difficult for mini-PEVs to compete with LSEVs with respect to price. For PEVs with recharge mileage of 250 kilometers and above, the subsidy has also been cut significantly. However, we still expect NEV demand growth to remain positive. The government will continue to maintain zero sales tax on NEVs until the end of 2020. This gives it a major advantage over non-NEV vehicles, which carry the 10% sales tax. In addition, NEVs are exempt from license restrictions on car sales and time or area restrictions on on-road autos, in cities where such policies apply. This is an attractive privilege for car buyers to consider. Current NEVs that can achieve recharge mileage of 300-450 kilometers, sell at a price of RMB 100,000 to RMB 150,000 per unit. They are both affordable and appealing for upper-middle-income and high-income urban households who prefer either green options or energy cost savings. The recharge mileage is sufficient for most daily use, and prices are in line with prices of traditional gasoline or diesel cars. If and as auto sales fail to stage a notable recovery in the next several months, Chinese auto stock prices will likely break down. Bottom Line: With the gradual phasing out of subsidies, the period of exponential NEV sales growth is over. Nevertheless, NEV demand growth will likely remain positive. Investment Implications Chart 12Chinese Auto Stock Prices Could Break Down
Chinese Auto Stock Prices Could Break Down
Chinese Auto Stock Prices Could Break Down
There are three pertinent investment implications to consider. First, Chinese auto stock prices in the domestic A-share market have dropped by 60% from their 2017 highs, and have lately been moving sideways (Chart 12). Notably, these listed automakers’ per-share earnings have plunged, and the companies have cut dividends by more than the drop in their share prices (Chart 13). As a result, their trailing P/E ratio has risen and the dividend yield has dropped (Chart 14). This implies that investors are looking through the current sales contraction and expecting an imminent recovery. Chart 13A Major Contraction In Corporate Earnings And Dividends
A Major Contraction In Corporate Earnings And Dividends
A Major Contraction In Corporate Earnings And Dividends
Chart 14Rising Trailing P/E And Falling Dividend Yield
Rising Trailing P/E And Falling Dividend Yield
Rising Trailing P/E And Falling Dividend Yield
If and as auto sales fail to stage a notable recovery in the next several months, these share prices will likely break down. Second, petroleum demand growth from the transportation sector will be decelerating in China over the coming years. Rising NEV sales as a share of total auto sales, substituting autos for LSEVs and a slower pace of growth in the number of vehicles on roads imply diminishing demand for gasoline in the coming years (Chart 15). Today BCA’s Emerging Markets Strategy service is also publishing a Special Report discussing India’s demand for oil. The report argues for slowing growth in Indian oil demand. Combined, China and India make up 19% of the world’s oil consumption (slightly lower than the 21% accounted for by the U.S.), and weaker demand growth in these economies is negative for oil prices. Third, investors should differentiate between a long-term economic view and investment strategy. We do not disagree with the economic viewpoint that auto ownership will rise in China in the years to come. But this will happen even if auto sales decline on an annual basis over the next 10 years. Chart 16 illustrates this point: if annual auto sales drop by 2% during each consecutive year over the next decade, and the scrap rate is around 3%, car ownership, defined as the share of households owning one car, will continue to rise from the current 50% level, reaching 80% by 2030. Chart 15Falling Growth In Existing Vehicles Entails Slower Growth In Gasoline Demand
Falling Growth In Existing Vehicles Entails Slower Growth In Gasoline Demand
Falling Growth In Existing Vehicles Entails Slower Growth In Gasoline Demand
Chart 16Stimulation: Car Ownership Can Rise With Shrinking Auto Sales
Stimulation: Car Ownership Can Rise With Shrinking Auto Sales
Stimulation: Car Ownership Can Rise With Shrinking Auto Sales
Nevertheless, such a scenario – a 2% annual drop in car sales in each consecutive year over the next decade - is bearish for automakers’ share prices. Any stock price is very sensitive to long-term growth expectations for corporate earnings.5 A 2% recurring annual drop in car sales will be disastrous for auto stock valuations. This is a case when the long-term economic view on rising prosperity and car ownership in China stands in contrast with a negative investment outcome for the auto sector and its shareholders. Ellen JingYuan He, Associate Vice President ellenj@bcaresearch.com Footnotes 1 Sales of total automobiles, including passenger vehicles and commercial vehicles. 2 From Chinese Banking Association Report on June 18, 2019. https://www.china-cba.net/Index/show/catid/14/id/26688.html 3 Guangzhou further added 10,000 car plates open to the public while Guiyang eliminated cap on new-vehicle sales. 4 https://www.wsj.com/video/big-in-china-tiny-electric-cars/CF7E986A-7C70-4EE3-8F7B-441621F10C94.html 5 The reason is that both interest rates and earnings long-term growth rate are present in the denominator of any cash flow discount model (Stock Price = Expected Dividends / (Interest rate – Earnings long-term growth rate)). Hence, they have the potential to affect share prices exponentially while dividends/profits are present in the numerator so their impact on equity prices is linear.
Highlights New structural recommendation: long GBP/USD. The substantial Brexit discount in the pound makes it a long-term buy for investors who can tolerate near-term volatility. The most powerful equity play on a fading Brexit discount would be the U.K. homebuilders. Specifically, Persimmon still has a further 25 percent of upside. Take profits in long Euro Stoxx 50 versus Shanghai Composite. Within Europe, close the overweight to Switzerland and the underweight to the Netherlands. Stay overweight banks versus industrials. Stay overweight the Euro Stoxx 50 versus the Nikkei 225. Fractal trade: long NZD/JPY. Feature Chart of the WeekThe Pound Has Substantial Upside If The Brexit Discount Fades
The Pound Has Substantial Upside If The Brexit Discount Fades
The Pound Has Substantial Upside If The Brexit Discount Fades
Carnival Says The Pound Is Cheap Carnival, the world’s largest cruise liner company, lists its shares on both the London and New York stock exchanges. But there is an apparent riddle: in London the shares trade on a forward PE of 8.8, while in New York they trade on 9.4. How can Carnival trade at different valuations on the two sides of the Atlantic when the market should instantly arbitrage the difference away? The answer to the riddle is that the London listing is quoted in pounds, the New York listing is quoted in dollars, while Carnival’s sales and profits are denominated in a mix of international currencies. Neither Brexit developments nor a potential Jeremy Corbyn led government will prevent the pound from rallying in the longer term. Carnival is trading on a higher valuation in New York versus London because the market is expecting its mixed currency earnings to appreciate more in dollar terms than in pound terms. Put another way, the valuation differential is expecting the pound to appreciate versus the dollar to a ‘fair value’ of around $1.40 (Chart I-2). Likewise, BHP Billiton shares are trading on a higher valuation in their Sydney listing compared to their London listing. This valuation differential is expecting the pound to appreciate versus the Australian dollar to around A$2.00 (Chart I-3). Chart I-2Carnival Says The Pound Is Cheap
Carnival Says The Pound Is Cheap
Carnival Says The Pound Is Cheap
Chart I-3BHP Billiton Says The Pound Is Cheap
BHP Billiton Says The Pound Is Cheap
BHP Billiton Says The Pound Is Cheap
In other words, the market believes that neither Brexit developments nor a potential Jeremy Corbyn led government will prevent the pound from rallying in the longer term. We tend to agree. The Wrong Way To Pick Stock Markets… And The Right Way Before continuing with the pound’s prospects, let’s wander into the wider investment landscape. One important lesson from dual-listed companies like Carnival and BHP Billiton is that a multinational’s valuation will appear attractive in a market where the currency is structurally cheap.1 This lesson has deep ramifications. Today, multinationals dominate all the major stock markets, meaning that the entire stock market will appear cheap if its currency is cheap. The stock market will also appear cheap if it is skewed towards lower-valued sectors. But sectors trade on a low valuation for a reason – poor long-term growth prospects. Through the past decade, Japanese banks seemed a relative bargain, trading on a forward PE of less than half of that on personal products companies (Chart I-4). Yet Japanese banks were not a relative bargain. Quite the contrary. Through the past decade Japanese personal products have outperformed the banks by 500 percent! (Chart I-5) Chart I-4Japanese Banks Seemed A Relative Bargain...
Japanese Banks Seemed A Relative Bargain...
Japanese Banks Seemed A Relative Bargain...
Chart I-5...But Japanese Banks Were Not A Relative Bargain
...But Japanese Banks Were Not A Relative Bargain
...But Japanese Banks Were Not A Relative Bargain
Hence, beware of picking stock markets on the basis of observations such as ‘European stocks are cheaper than U.S. stocks’. Given that a stock market valuation is the result of its currency valuation and its sector composition, assessing relative value across major stock markets is extremely difficult, if not impossible. To repeat, Carnival appears to be trading at a valuation discount in London versus New York, but the cheapness is illusory. Here’s the right way to pick major stock markets. Identify your preferred sectors and currencies, and then pick the regional and country stock markets that are skewed to these preferred sectors and currencies. In this regard, large underweight sector skews also matter. For example, China and EM have a near-zero exposure to healthcare equities, so their performances tend to correlate negatively with that of the global healthcare sector – albeit the causality could run in either direction. Identify your preferred sectors and currencies, and then pick the regional and country stock markets that are skewed to these preferred sectors and currencies. In early May, we noticed that the extreme outperformance of technology versus healthcare was at a critical technical point at which there was a high probability of a trend reversal. This high conviction sector view implied overweight Europe versus China, as well as overweight Switzerland and underweight Netherlands within Europe (Chart I-6 and Chart I-7). Chart I-6When Tech Underperforms Healthcare, China Underperforms Switzerland
When Tech Underperforms Healthcare, China Underperforms Switzerland
When Tech Underperforms Healthcare, China Underperforms Switzerland
Chart I-7When Tech Underperforms Healthcare, The Netherlands Underperforms Switzerland
When Tech Underperforms Healthcare, The Netherlands Underperforms Switzerland
When Tech Underperforms Healthcare, The Netherlands Underperforms Switzerland
Given that this sector trend reversal has played out exactly as anticipated, it is time to bank the profits: Close long Euro Stoxx 50 versus Shanghai Composite. And within Europe, close the overweight to Switzerland and the underweight to the Netherlands. Right now, it is appropriate to overweight banks versus industrials. It is the pace of the bond yield’s decline that has weighed on bank performance this year. But if the sharpest decline in bond yields is behind us, as seems likely, then banks should fare better versus other cyclicals (Chart I-8). Chart I-8If The Sharpest Decline In Bond Yields Is Over, Banks Will Outperform Industrials
If The Sharpest Decline In Bond Yields Is Over, Banks Will Outperform Industrials
If The Sharpest Decline In Bond Yields Is Over, Banks Will Outperform Industrials
Once again, this sector view carries an equity market implication: stay overweight the Euro Stoxx 50 versus the Nikkei 225 (Chart I-9). Chart I-9Euro Stoxx 50 Vs. Nikkei 225 = Global Banks In Euros Vs. Global Industrials In Yen
Euro Stoxx 50 Vs. Nikkei 225 = Global Banks In Euros Vs. Global Industrials In Yen
Euro Stoxx 50 Vs. Nikkei 225 = Global Banks In Euros Vs. Global Industrials In Yen
The Pound Is A Long-Term Buy Back to the pound. The message from the dual listings of Carnival and BHP Billiton is that the pound is cheap, and this is neatly corroborated by the relationship between relative interest rates and the pound versus the euro and dollar. Based on the pre-Brexit relationship between relative real interest rates and the pound’s exchange rate, we can quantify the ‘Brexit discount’. Absent this discount, the pound would now be trading close to €1.30 and well north of $1.40 (Chart of the Week and Chart I-10). Chart I-10The Pound Has Substantial Upside If The Brexit Discount Fades
The Pound Has Substantial Upside If The Brexit Discount Fades
The Pound Has Substantial Upside If The Brexit Discount Fades
In the Brexit psychodrama, we do not claim to know exactly how the next few days or weeks will play out. In the short term, Brexit is a classic non-linear system, and non-linear systems are inherently unpredictable. However, in the longer term we expect the Brexit discount to fade in any sort of transitioned resolution that allows the U.K. to adapt to a new trading relationship with the world, or alternatively to stay in a relationship broadly similar to the current one. Whatever the eventual endpoint is, the key requirement to remove the Brexit discount is to avoid a cliff-edge. We expect the Brexit discount to fade in any sort of transitioned resolution. The stumbling block to a resolution is that the three key actors – the EU, the U.K. government, and the U.K. parliament – have conflicting red lines, so the Brexit ‘Venn diagram’ has had no overlap. The EU will not countenance a customs border that divides Ireland; the current U.K. government wants a Free Trade Agreement, which implies casting away Northern Ireland into the EU customs union; and the current U.K. parliament – unless its intentions suddenly change – wants the whole of the U.K., including Northern Ireland, to remain in the EU customs union. Given that the EU will not budge its red line, the only way to a lasting resolution is for the government and parliament red lines to realign, This could happen via parliament being willing to sacrifice Northern Ireland, via a second referendum, or via a general election in which the government’s intentions and/or the composition of parliament changed. Given a long enough investment horizon – 2 years or more – it is likely that the government and parliament will realign their red lines to a Free Trade Agreement or to a customs union, one way or another. On this basis, the substantial Brexit discount in the pound makes it a long-term buy for investors who can tolerate near-term volatility. Accordingly, today we are initiating a new structural recommendation: long GBP/USD. For equity investors, the most powerful play on a fading Brexit discount would be the U.K. homebuilders (Chart I-11). Specifically, if the pound reached $1.40, Persimmon still has a further 25 percent of upside. Chart I-11U.K. Homebuilders Have Substantial Upside If The Brexit Discount Fades
U.K. Homebuilders Have Substantial Upside If The Brexit Discount Fades
U.K. Homebuilders Have Substantial Upside If The Brexit Discount Fades
Fractal Trading System* Based on its collapsed fractal structure, we anticipate a countertrend rally in NZD/JPY within the next 130 days. Accordingly, go long NZD/JPY setting a profit target of 3 percent and a symmetrical stop-loss. Chart I-12
NZD VS. JPY
NZD VS. JPY
For any investment, excessive trend following and groupthink can reach a natural point of instability, at which point the established trend is highly likely to break down with or without an external catalyst. An early warning sign is the investment’s fractal dimension approaching its natural lower bound. Encouragingly, this trigger has consistently identified countertrend moves of various magnitudes across all asset classes. The post-June 9, 2016 fractal trading model rules are: When the fractal dimension approaches the lower limit after an investment has been in an established trend it is a potential trigger for a liquidity-triggered trend reversal. Therefore, open a countertrend position. The profit target is a one-third reversal of the preceding 13-week move. Apply a symmetrical stop-loss. Close the position at the profit target or stop-loss. Otherwise close the position after 13 weeks. Use the position size multiple to control risk. The position size will be smaller for more risky positions. * For more details please see the European Investment Strategy Special Report “Fractals, Liquidity & A Trading Model,” dated December 11, 2014, available at eis.bcaresearch.com. Dhaval Joshi, Chief European Investment Strategist dhaval@bcaresearch.com Footnotes 1 There are also several companies with dual listings in the U.K. and the euro area. Unfortunately, these valuation differentials have been temporarily distorted by the risk of a no-deal Brexit, in which EU27 investors may have been forbidden from trading in the U.K. listed shares. Fractal Trading System Cyclical Recommendations Structural Recommendations Fractal Trades
The Pound Is A Long-Term Buy (And So Are Homebuilders)
The Pound Is A Long-Term Buy (And So Are Homebuilders)
The Pound Is A Long-Term Buy (And So Are Homebuilders)
The Pound Is A Long-Term Buy (And So Are Homebuilders)
The Pound Is A Long-Term Buy (And So Are Homebuilders)
The Pound Is A Long-Term Buy (And So Are Homebuilders)
The Pound Is A Long-Term Buy (And So Are Homebuilders)
The Pound Is A Long-Term Buy (And So Are Homebuilders)
The Pound Is A Long-Term Buy (And So Are Homebuilders)
The Pound Is A Long-Term Buy (And So Are Homebuilders)
The Pound Is A Long-Term Buy (And So Are Homebuilders)
The Pound Is A Long-Term Buy (And So Are Homebuilders)
Asset Performance Currency & Bond Equity Sector Country Equity Indicators Bond Yields Chart II-1Indicators To Watch - Bond Yields
Indicators To Watch - Bond Yields
Indicators To Watch - Bond Yields
Chart II-2Indicators To Watch - Bond Yields
Indicators To Watch - Bond Yields
Indicators To Watch - Bond Yields
Chart II-3Indicators To Watch - Bond Yields
Indicators To Watch - Bond Yields
Indicators To Watch - Bond Yields
Chart II-4Indicators To Watch - Bond Yields
Indicators To Watch - Bond Yields
Indicators To Watch - Bond Yields
Interest Rate Chart II-5Indicators To Watch - Interest Rate Expectations
Indicators To Watch - Interest Rate Expectations
Indicators To Watch - Interest Rate Expectations
Chart II-6Indicators To Watch - Interest Rate Expectations
Indicators To Watch - Interest Rate Expectations
Indicators To Watch - Interest Rate Expectations
Chart II-7Indicators To Watch - Interest Rate Expectations
Indicators To Watch - Interest Rate Expectations
Indicators To Watch - Interest Rate Expectations
Chart II-8Indicators To Watch - Interest Rate Expectations
Indicators To Watch - Interest Rate Expectations
Indicators To Watch - Interest Rate Expectations
Trade War-Hedged Pair Trade: Higher Octane Pair (Part II)
Trade War-Hedged Pair Trade: Higher Octane Pair (Part II)
A more speculative and higher octane vehicle to explore the trade war-related mispricing from Part I of this Insight is via a long S&P machinery/short S&P semiconductors pair trade. Most of the drivers mentioned in Part I also hold true in this subsector market-neutral trade, but we have to introduce another key driver: China. Encouragingly, China’s fiscal and credit impulse signals that a bottom in relative share prices is likely already in place. If this leading indicator proves accurate in the coming months, then relative share prices can spike 20%, near the late-2018 highs (top panel). Moreover, Chinese money supply growth is showing some signs of life and capital committed to infrastructure spending is coming out of hibernation (second & bottom panels). Goldman Sachs’ China current activity indicator is on a similar upward trajectory, underscoring that the path of least resistance is higher for relative share prices (third panel). Bottom Line: We have initiated a long S&P industrials/short S&P tech pair trade and a long S&P machinery/short S&P semiconductors pair trade in yesterday’s Weekly Report.
Trade War-Hedged Pair Trade (Part I)
Trade War-Hedged Pair Trade (Part I)
In this Monday’s Weekly Report we initiated a new long/short trade idea that will generate alpha regardless of the pair trade war outcome: long industrials/short tech. If the U.S. and China manage to iron out their differences and strike a deal, industrials should benefit from a greater catch-up phase because they have been depressed over the past two years, while tech stocks are near relative all-time highs. In contrast, a “no deal” scenario, should also re-concentrate investors’ minds and lead to relative selling in tech stocks versus their already beaten-down deep cyclical peers: industrials. Three key macro forces will be driving the rebound in the price ratio. First, were the deal to get struck, growth expectations will pick up pushing rates higher, which are a boon for industrials and a bane for high P/E tech stocks (top panel). Second, we expect the ISM manufacturing survey to outshine the San Francisco Fed’s Tech Pulse Index (middle panel). Finally, relative capital expenditure outlays should also veer in favor of industrials as previously mothballed infrastructure projects will come out of hibernation (bottom panel). On the other hand, should a “no-deal” scenario occur, we doubt that these three macro forces that we identified would sink further (please see the next Insight).