Technology
If the U.S. and China cannot reach an agreement the metrics depicted in the previous Insight will not sink much further. There is an element of exhaustion and industrials would jump relative to tech on news of a breakdown in trade talks as a tech sector fire…
Ever since the Sino-American trade war started in March 2018, the market has punished industrials, but tech has escaped unscathed. The Fed’s tightening cycle and the Chinese policymakers’ brake slamming prompted global growth to soften ahead of the U.S./China…

Highlights Portfolio Strategy The trade-weighted U.S. dollar’s appreciation along with the still souring manufacturing data are weighing on SPX profit growth, at a time when heightened geopolitical uncertainty and a looming reversal in financial conditions has the potential to wreak havoc on stock prices. Stay cautious on the prospects of the broad equity market on a cyclical 9-12 month time horizon. Firming operating metrics, the resilient U.S. dollar, compelling valuations and depressed technicals, all signal that there is an exploitable tactical trading opportunity in a long S&P industrials/short S&P tech pair trade, irrespective of the trade war outcome. A tentative tick up in EM and China data along with improving relative operating metrics signal that the time is ripe to initiate a long machinery/short semis pair trade. Recent Changes Initiate a long S&P Industrials/short S&P Tech pair trade on a tactical three-to-six month time horizon, today. Initiate a long S&P Machinery/short S&P Semiconductors pair trade on a tactical three-to-six month time horizon, today.
Follow The Profit Trail
Follow The Profit Trail
Feature The S&P 500 oscillated violently again last week, as the barrage of declining economic data, heightened trade war-related volatility and political upheaval dominated the news flow. While the Fed remains the backstop of last resort, we doubt additional interest rate cuts, which are already aggressively priced in the bond market, will boost lending and entice CEOs to invest in capital expenditure projects. Investors have to stay patient and disciplined, let this economic slowdown play out and allow for the natural healing of the economy. As a reminder, the ISM manufacturing index has been decelerating for twelve months and only been below the boom bust line for two. If history is an accurate guide, an additional three-to-six months of manufacturing pain are in store before a definitive bottom is in place (bottom panel, Chart 1). Such a macro backdrop, still warrants caution on the prospects of the broad equity market. Chart 1Allow Time For Economic Healing
Allow Time For Economic Healing
Allow Time For Economic Healing
Beginning in August, a number of BCA publications became a tad more cautious on risk assets. Following our October editorial view meeting last week, this cautiousness was cemented with a tactical downgrade of global equities to neutral from previously overweight in the BCA House View matrix. While this marks a clear shift toward this publication’s less sanguine view of the U.S. equity market adopted during the summer, BCA's cyclical 12-month House View remains overweight global equities. Worryingly, the majority of the indicators we track continue to emit distress signals and warn that the SPX has further downside (Chart 2), especially absent profit growth. Importantly, we first correctly posited last May that the back half of the year global growth reacceleration was in jeopardy and would go on hiatus courtesy of rising policy uncertainty.1 Such a backdrop would boost the U.S. dollar and simultaneously take a bite out of SPX EPS.2 Chart 2Soft Data Red Flag
Soft Data Red Flag
Soft Data Red Flag
Last week we highlighted that the U.S. dollar is the most important indicator to monitor given its global deflationary/reflationary properties. Were the greenback to maintain its year-to-date gains, it will continue to dent SPX profitability via P&L translation loss effects and likely sustain the profit recession into early 2020 (trade-weighted U.S. dollar shown inverted, bottom panel, Chart 3). Chart 3Greenback Weighing On Profits
Greenback Weighing On Profits
Greenback Weighing On Profits
U.S. Equity Strategy’s S&P 500 four-factor macro EPS growth model remains downbeat (middle panel, Chart 4). Were we to isolate the U.S. dollar as a single variable and re-run the regression it is clear that additional greenback appreciation will further weigh on SPX profit growth (bottom panel, Chart 4). Meanwhile, the easing in financial conditions and drubbing of the 10-year Treasury yield since the Christmas Eve lows is already reflected in the 23% jump in the forward PE multiple, which explains over 90% of the SPX’s rise since the Dec 24, 2018 trough (top & middle panels, Chart 5). In other words, for multiples to expand anew, financial conditions would have to further ease, which in our view is a tall order (bottom panel, Chart 5). Chart 4EPS Model Warrants Caution
EPS Model Warrants Caution
EPS Model Warrants Caution
Chart 5Financial Conditions Are The Forward P/E
Financial Conditions Are The Forward P/E
Financial Conditions Are The Forward P/E
This week we are initiating two related pair trades to exploit the mispricing of the trade war within the deep cyclical sector universe. Thus, we would lean against the narrative that easy financial conditions are not fully reflected into stocks. In contrast, our worry is that junk spreads are on the verge of a breakout and such a backdrop would tighten financial conditions and aggravate an SPX drawdown (junk OAS shown inverted, Chart 6). Adding it all up, the trade-weighted U.S. dollar’s appreciation along with the still souring manufacturing data are weighing on SPX profit growth, at a time when heightened geopolitical uncertainty and a looming reversal in financial conditions has the potential to wreak havoc on stock prices. Stay cautious on the prospects of the broad equity market on a cyclical 9-12 month time horizon. This week we are initiating two related pair trades to exploit the mispricing of the trade war within the deep cyclical sector universe. Chart 6Watch Junk Spreads
Watch Junk Spreads
Watch Junk Spreads
Initiate A Long Industrials/Short Tech Pair Trade… Ever since the Sino-American trade war started in March 2018, the market has punished industrials, but tech has escaped unscathed. While the global growth soft patch preceded the U.S./China trade spat, courtesy of the Fed’s tightening cycle and Chinese policymakers’ slamming on the brakes, the trade war has served as a catalyst to aggressively shed deep cyclical equities except for tech stocks (Chart 7). We think this misalignment presents a playable opportunity to generate alpha by going long industrials/short tech, irrespective of the trade war’s outcome. In other words, this market neutral trade will be in the black either because the trade spat gets resolved or because there will effectively be no “real” deal including intellectual property and the tech sector. If the two sides manage to iron out their differences and strike a deal, industrials stocks should benefit from a greater catch-up phase because they have been depressed over the past two years, while tech stocks are near relative all-time highs. In contrast, a “no deal” scenario, should also re-concentrate investors’ minds and lead to a relative selling in tech stocks versus their already beaten-down deep cyclical peers: industrials. Chart 7Bifurcated Deep Cyclicals Market
Bifurcated Deep Cyclicals Market
Bifurcated Deep Cyclicals Market
Chart 8Lots Of Bad Trade War News Reflected In Prices
Lots Of Bad Trade War News Reflected In Prices
Lots Of Bad Trade War News Reflected In Prices
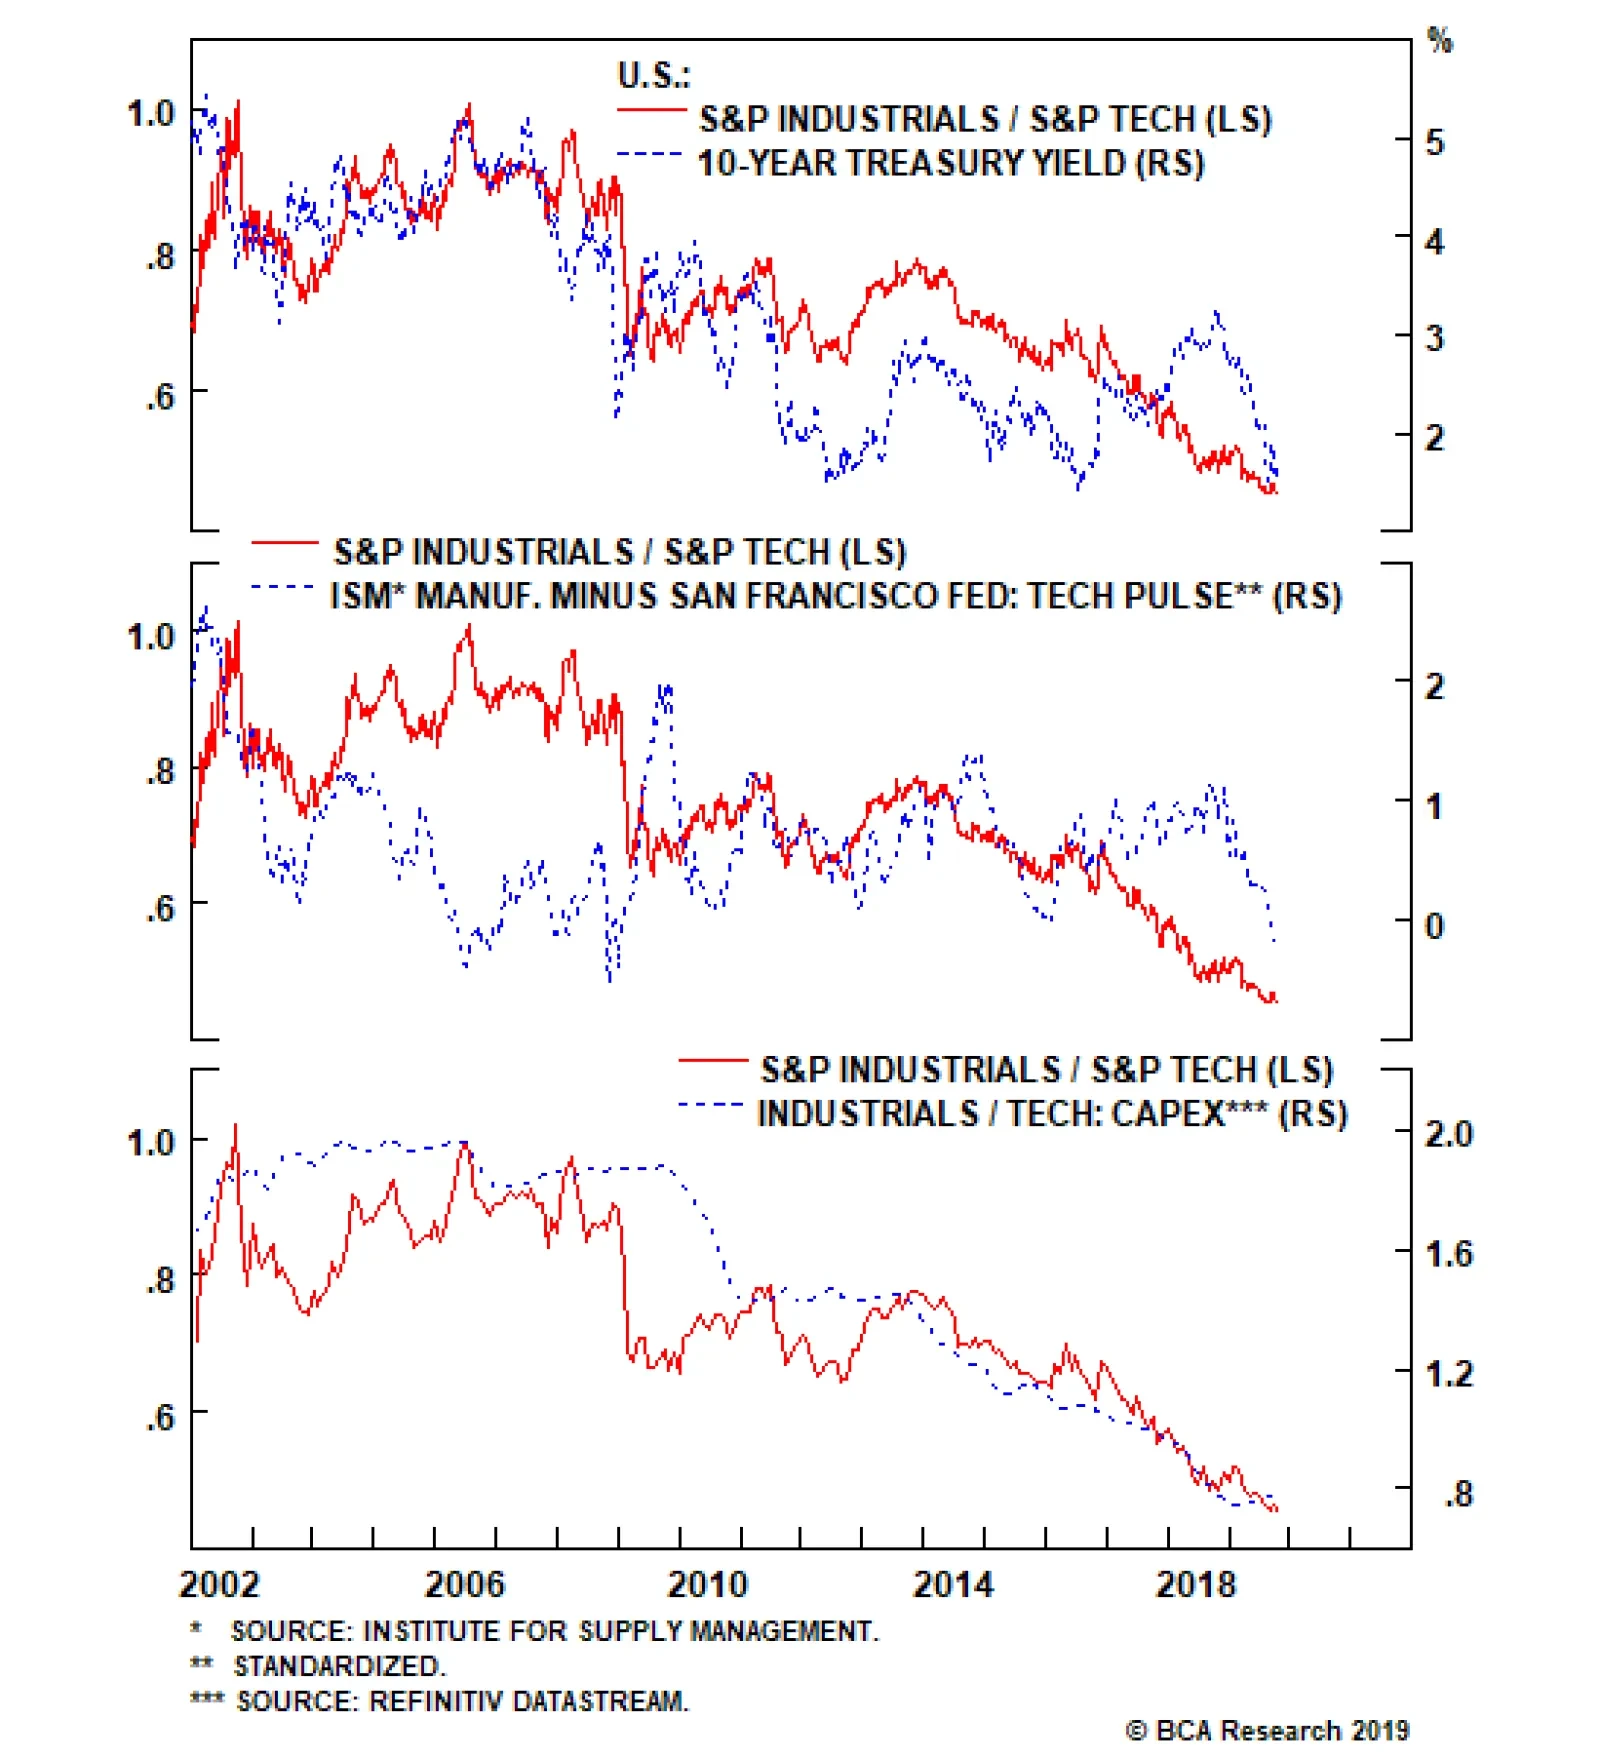
Chart 8 shows the drubbing in relative share prices as three key macro drivers have felt the trade war’s wrath. In more detail, were a deal to get struck, growth expectations will reverse course and a bond market sell-off will almost immediately reflect such an improvement in the global macro backdrop. Rising interest rates on the back of a reflationary/inflationary impulse are a boon for industrials and a bane for high growth tech stocks (top panel, Chart 8). Similarly, the middle panel of Chart 8 highlights that the ISM manufacturing survey should climb above the boom/bust line and outshine the San Francisco Fed’s Tech Pulse Index (that comprises “coincident indicators of activity in the U.S. information technology sector”3) on news of a successful deal. Finally, relative capital expenditure outlays should also veer in favor of industrials as previously mothballed infrastructure projects will come out of hibernation (bottom panel, Chart 8). In contrast, tech capex has been resilient of late with analytics, security and cloud computing being the most defensive capex corner, leaving little room for additional relative capex gains. Taking the opposite side i.e. a “no deal”, we doubt the metrics we depict in Chart 8 would sink that much further. If anything we believe that there is an element of exhaustion and relative share prices would jump on news of a breakdown in trade talks as tech sector fire sales would trump the sell-off in already depressed industrials. Meanwhile, the U.S. dollar and relative share prices have been steeply diverging recently and this gap will likely narrow via a catch-up phase in the latter (top & middle panels, Chart 9). According to Factset’s latest data the S&P industrials sector garners 37% of its sales from abroad, whereas the S&P information technology sector’s foreign exposure stands at 57% of total revenues.4 Therefore, given this 20% delta, a rising greenback should be beneficial to the more domestically geared industrials stocks (bottom panel, Chart 9). On the operating front, industrials also have the upper hand. The relative wage bill is sinking like a stone (shown inverted, middle panel, Chart 10) at a time when relative selling price inflation is holding its own (top panel, Chart 10). The upshot is that a relative profit margin jump is in store in the coming months which should boost the relative share price ratio (bottom panel, Chart 10). Chart 9Unsustainable Divergence
Unsustainable Divergence
Unsustainable Divergence
Chart 10Industrials Have The Upper Hand
Industrials Have The Upper Hand
Industrials Have The Upper Hand
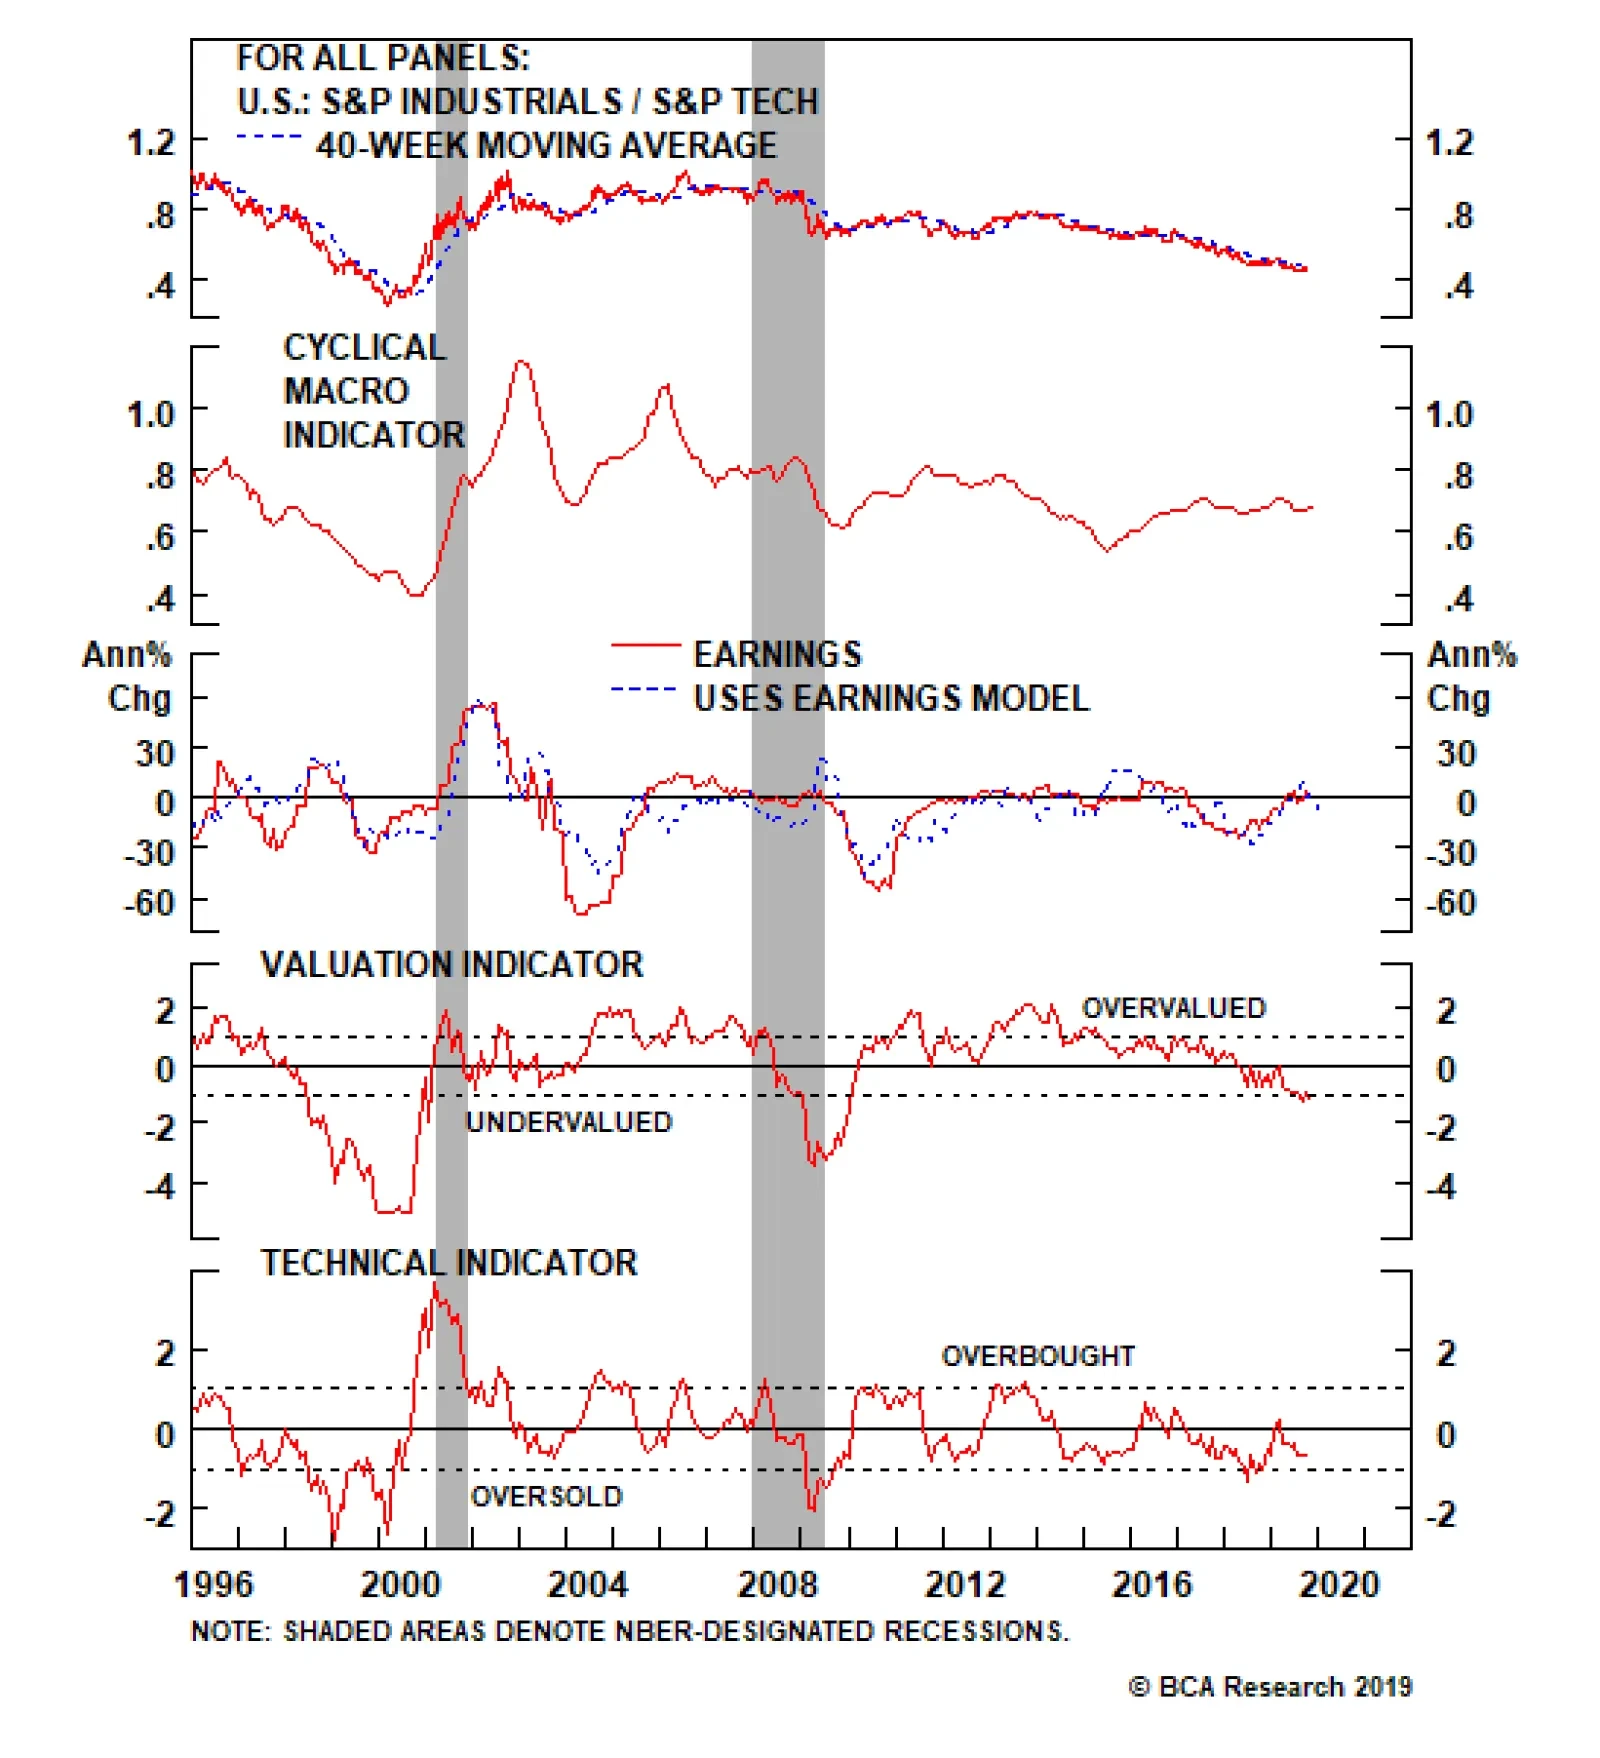
U.S. Equity Strategy’s proprietary relative Cyclical Macro Indicators and relative profit growth models capture all these drivers and both signal that an industrials versus tech earnings-led outperformance phase looms into year end (Chart 11). Chart 12 shows that the relative earnings breadth and relative net earnings revisions are both deep in negative territory. In terms of technicals, the relative percentage of groups trading with a positive 52-week rate of change has hit the lowest level in the past two decades (second panel, Chart 12) and our composite relative technical indicator is roughly one standard deviation below the historical mean (bottom panel, Chart 11). Chart 11Profit Models And...
Profit Models And...
Profit Models And...
Chart 12...Washed Out Breadth Say Buy Industrials At The Expense Of Tech
...Washed Out Breadth Say Buy Industrials At The Expense Of Tech
...Washed Out Breadth Say Buy Industrials At The Expense Of Tech
Finally, relative valuations are also bombed out. Our relative valuation indicator has been in a six-year uninterrupted drop, falling from two standard deviations above the mean to one standard deviation below the mean (fourth panel, Chart 11). Such entrenched bearishness in relative value is unwarranted. Bottom Line: Firming operating metrics, the resilient U.S. dollar, compelling valuations and depressed technicals, all signal that there is an exploitable tactical trading opportunity in a long S&P industrials/short S&P tech pair trade, irrespective of the trade war outcome. …And A Long Machinery/Short Semis Pair Trade A more speculative and higher octane vehicle to explore this trade war-related mispricing is via a long S&P machinery/short S&P semiconductors pair trade. Most of the drivers mentioned above also hold true in this subsector market-neutral trade. However, in this section we will drill deeper in the China/EM drivers. The Emerging Asia leading economic indicator (EALEI) has plummeted to levels last hit around the 1998 LTCM bailout (top panel, Chart 13). While more pain is likely in the coming months as global trade has ground to a halt, we doubt the carnage in the EALEI can continue indefinitely. In fact, a tentative trough in the Emerging Markets (EM) manufacturing PMI heralds a brighter outlook for relative share prices (bottom panel, Chart 13). Chart 13Same Trade War Theme, Different Vehicles To Play It
Same Trade War Theme, Different Vehicles To Play It
Same Trade War Theme, Different Vehicles To Play It
Chart 14China...
China...
China...
Encouragingly, China’s fiscal and credit impulse also signals that a bottom in relative share prices is likely already in place. If this leading indicator proves accurate in the coming months, then relative share prices can spike 20% near the late-2018 highs (Chart 14). Chinese money supply growth is showing some signs of life and capital committed to infrastructure spending is coming out of hibernation. Goldman Sachs’ China current activity indicator is on a similar upward trajectory, underscoring that the path of least resistance is higher for relative share prices (Chart 15). Chart 15...Holds The Key
...Holds The Key
...Holds The Key
Chart 16Firming Final Demand...
Firming Final Demand...
Firming Final Demand...
On the operating front, relative new orders and relative shipment growth have both ticked higher (top & middle panels, Chart 16). Importantly, our relative demand proxy suggests that the relative end-demand backdrop is also firming. Using Caterpillar’s global sales to dealers data compared with global chip sales reveals that a wide gap has formed between relative share prices and our relative demand gauge (bottom panel, Chart 16). If our thesis pans out in the upcoming three-to-six months then machinery will trounce semis. Finally, relative pricing power corroborates that machinery demand has the upper hand versus semiconductor final demand. The Commodity Research Bureau’s raw industrials index is climbing relative to Asian DRAM prices. The upshot is that the compellingly valued relative share price ratio will gain steam in the months ahead (Chart 17). In sum, a tentative up-tick in EM and China data along with improving relative operating metrics signal that the time is ripe to initiate a long machinery/short semis pair trade. Bottom Line: Initiate a long S&P machinery/short S&P semiconductors pair trade today. The ticker symbols for the stocks in the S&P machinery and S&P semis indexes are: BLBG – S5MACH – CAT, DE, ITW, IR, CMI, PCAR, PH, SWK, FTV, DOV, XYL, IEX, WAB, SNA, PNR, FLS, and BLBG – S5SECO – INTC, TXN, NVDA, AVGO, QCOM, MU, ADI, AMD, XLNX, QRVO, MCHP, MXIM, SWKS, respectively. Chart 17...Is A Boon To Relative Pricing Power
...Is A Boon To Relative Pricing Power
...Is A Boon To Relative Pricing Power
Key Risk To Monitor One important risk to both of our newly recommended market-neutral trades is China. We recently touched base with our ex-Chief Geopolitical Strategist and currently Chief Strategist at the Clocktower Group, Marko Papic. He warned us that all bets would be off because: “I think we will look back at the recession of 2020 and it will be known as the “China recession”. Basically, China just decided to stop playing, pick up its toys, and go home”. If Marko’s wise words were to ring true, then such a Chinese policy shift will truly be a game changer with negative global economic growth implications. With regard to our pair trades, they would both be offside. Anastasios Avgeriou, U.S. Equity Strategist anastasios@bcaresearch.com Footnotes 1 Please see BCA U.S. Equity Strategy Weekly Report, “Consolidation” dated May 21, 2019, available at uses.bcaresearch.com. 2 Please see BCA U.S. Equity Strategy Weekly Report, “On Edge” dated May 13, 2019, available at uses.bcaresearch.com. 3 https://www.frbsf.org/economic-research/indicators-data/tech-pulse/ 4 https://www.factset.com/hubfs/Resources%20Section/Research%20Desk/Earnings%20Insight/EarningsInsight_100419A.pdf Current Recommendations Current Trades Size And Style Views Stay neutral cyclicals over defensives (downgrade alert) Favor value over growth Favor large over small caps (Stop 10%)
Overweight (maintain cyclical trailing stop at 27% relative return since inception) The latest ISM services report followed its sibling ISM manufacturing survey lower as we have been expecting, given the leading properties and extreme economic sensitivity of the U.S. manufacturing sector. The bond market’s knee jerk reaction was a near certainty of a Fed cut in the October 30 meeting and a 54% probability of an additional cut in the December 11 meeting, on hopes that the Fed will save the day and stave off recession. As a result, equities recovered and growth stocks (software included) that are hyper-responsive to interest rate movements led the advance. We remain overweight the S&P software index since the late-2017 cyclical inception, however, from a risk management perspective we will obey our trailing stop near the 27% relative return mark. As a reminder, we recently booked relative tactical gains of 10% in this index and removed it from the high-conviction overweight list.
Software Yellow Flags
Software Yellow Flags
While the secular drivers for the S&P software index remain intact, the latest ISM services survey drop was a warning shot that even mighty software demand may suffer a small setback (second panel). Moreover, recent losses in the IPO exchange traded fund also warn that gravity can pull skyrocketing growth stocks back to earth (bottom panel), especially given this year’s sizable rise in IPO supply (third panel). Bottom Line: Stick with a cyclical overweight stance on the S&P software for now, but remain prepared to pull the trigger and monetize gains by obeying the trailing stop at the 27% mark.
In late-summer 2010, we published a Special Report overviewing long-term U.S. equity sector relative performance during deflationary periods. Since then, inflation – core PCE deflator to be more specific – only briefly flirted with the Federal Reserve’s 2% target in mid-2018, while long-term inflation expectations never managed to re-anchor higher. Worrisomely, there are now budding signs that inflation will weaken in the coming quarters rather than rear its ugly head. Pundits – us included – are still waiting for inflationary pressures to finally pass-through. Worrisomely, there are now budding signs that inflation will weaken in the coming quarters rather than rear its ugly head (Chart 1). The late-2018 tightening in financial conditions will exert downward pressure on year-over-year CPI growth, albeit with a slight lag (top panel, Chart 1). More broadly, the ongoing deceleration in the U.S. economy, as evidenced by the sharp decline in the ISM manufacturing PMI (and most of its subcomponents), represents a serious headwind for inflation (second panel, Chart 1). Given weak global growth, the appreciating U.S. dollar – a countercyclical currency – will also weigh on inflation going forward (not shown). Further, we don’t view the recent perky inflation prints as sustainable. In fact, core goods CPI – which accounts for 25% of core CPI and has been the main driver lately – is expected to roll over and contract over the next 18 months (third panel, Chart 1). Chart 1Still Looking For Inflation?
Still Looking For Inflation?
Still Looking For Inflation?
U.S. Equity Strategy’s corporate pricing power proxy has also sharply sunk corroborating that the path of least resistance is lower for core inflation (bottom panel, Chart 1). In other words, if Marty McFly could ride the DeLorean to travel back in time once more, he would certainly approve of deflation/disinflation being a major equity theme at BCA, and would even ask us to delve deeper into our prior analysis. That is precisely what we do in this Special Report. We acknowledge the current disinflationary trend and provide more details on the historical relative performance of the different equity sectors in such periods. We introduce a simple trading rule based on these deflationary episodes, which we define as two or more consecutive quarters of negative corporate sector price deflator growth (Chart 2). We treat single quarters of positive growth within broader deflationary trends as outliers, which translate into the occasional quarterly rebounds within the shaded areas. Chart 2Deflationary Periods
Deflationary Periods
Deflationary Periods
The next pages provide some more color on the sectors historical relative performance. Notably, we add a brief overview of the annualized returns realized by heeding the signals from two consecutive quarters of negative corporate sector price deflator growth. Since 1960, there have been 27 such signals, with a median duration of 15 months and the shortest one being six months. As such, we feel comfortable using 6-, 12- and 24-month horizons to go long (short) the sectors we identified did well during deflationary (inflationary) periods, whenever signaled. Table 1 summarizes the results of this empirical exercise. Table 1 Sector Relative Performance And Deflation (From 1960 To Present)
Sector Performance In A Deflationary World: Back To The Future?
Sector Performance In A Deflationary World: Back To The Future?
Our hypothesis during disinflationary periods is that defensives outshine cyclicals. The results for the GICS11 relative sector performance are consistent with our hypothesis. Specifically, following our deflationary signal, defensives are up 1.4% on a 6-month horizon, while cyclicals are down 2.5%. We also note an inflection point around the 12-month mark as cyclicals start to recover their losses moving from -2.5% to just -0.21%, while defensives are giving up their gains moving from 1.38% to 0.76%. This finding is consistent with the median deflation period duration of 15 months, as highlighted earlier. Similarly, if we look 24 months out, we observe that cyclicals are outperforming the market by 0.5% (largely driven by tech), and defensives are lagging the market by -1.2% (dragged by telecom and utilities) signaling that the market has recovered. Diagram 1Performance Time Line
Sector Performance In A Deflationary World: Back To The Future?
Sector Performance In A Deflationary World: Back To The Future?
Importantly, we are currently in a deflationary environment as defined by our two-quarter signal that commenced mid-2018, and U.S. Equity Strategy has been actively reducing cyclical exposure over the past six months and highlighting that investors should be cautious on the prospects of the broad equity market. Turning back to Table 1, we also see some divergences in the GICS1 sector performance vs. some of our expectations. Utilities should outperform during disinflation periods, owing to two factors: (1) steady cash flow growth, (2) falling interest rates boost the allure of high yielding competing assets. Another notable outlier is the S&P consumer discretionary index. Specifically, the roughly 2% underperformance in the six months following our deflationary signal took us by surprise, as discretionary spending should at the margin get a boost from declining interest rates. To conclude, we also present a time line that summarizes results from Table 1 as well as the sector specific comments. Importantly, the time line is a road map that should be only used “as a rule of thumb” guide to navigate a deflationary environment. Keep in mind, that even though the median duration for a deflationary period is 15 months, it can still last anywhere from just under a year to over four years. As always, context is key. Finally, stay tuned for an update on our traditional U.S. equity sector profit margin outlook report that is due in the upcoming months. What follows are additional details of our analysis on a per sector basis, along with charts on sector specific pricing power and revenue turnover. Jeremie Peloso, Research Analyst JeremieP@bcaresearch.com Arseniy Urazov, Research Associate ArseniyU@bcaresearch.com Consumer Staples (Overweight)
Consumer Staples
Consumer Staples
The S&P consumer staples index performs well during deflationary periods. Likely explanatory variables are the safe haven status of this index along with an ongoing industry consolidation. Our sector pricing power proxy reveals that staples have not experienced a contraction in pricing power since 2003. While relative share prices are staging a recovery, they are still one standard deviation below the historical time trend. Further gains are likely given impressive returns on a 6-, 12-, and 24-month time horizon following our deflationary signal. We remain overweight the S&P consumer staples index.
Consumer Staples
Consumer Staples
Energy (Overweight)
Energy
Energy
Among the cyclical sectors, S&P energy is the second largest underperformer, declining 3.4% on average in relative terms in the six months following our deflationary signal. The underperformance is also evident in our PP proxy. Energy companies’ PP declines right as the economy enters deflation, which is consistent with our expectations, as oil plays a key role in virtually any inflation/deflation measure. One caveat at the current juncture is the recent oil price spike that may serve as a catalyst to unlock excellent value in bombed out energy equities. As a result of the drone attacks on Saudi Arabia’s production and refining facilities we expect geopolitical premia to get built into crude oil prices on a sustained basis. We are currently overweight the S&P energy index.
Energy
Energy
Health Care (Overweight)
Health Care
Health Care
During deflationary periods the S&P health care sector has outperformed the broad market, similar to its defensive sibling, the S&P consumer staples sector. On top of the safe haven nature of the health care industry, pricing power has never crossed below the zero line during the entire history of the data series. This remarkable feat also applies to the sector’s sales growth. We are currently overweight the S&P health care index.
Health Care
Health Care
Industrials (Overweight)
Industrials
Industrials
On the eve of deflation, industrials equities start wrestling with two opposing forces: cheapened raw materials versus slowing economic activity. In the end, economic softness wins the tug-of-war as this deep cyclical index underperforms the market on 6-, 12- and 24-month time horizon by -1.4%, -1.0% and -0.5%, respectively. The sector’s pricing power usually displays a sharp decline as we enter a deflationary zone weighing on industrials revenue prospects and thus relative performance. We are currently overweight the S&P industrials sector.
Industrials
Industrials
Financials (Overweight)
Financials
Financials
Being an early cyclical sector, it is not surprising that the S&P financials sector tends to underperform the broad market on 6-, 12- and 24-month horizon following our two-quarter deflation signal. The largest underperformance for financials comes late into the deflationary period. In fact, had we excluded utilities from our analysis, the S&P financials sector would have been the worst performing sector across the board on a 12- and 24-month time horizon. The heavyweight banks subgroup accounting for roughly 42% of the S&P financials market capitalization weight explains the underperformance. As a reminder banks underperform when the price of credit is falling owing to deflation/disinflation. Given that our fixed income strategists expect a selloff in the bond market, we remain overweight the S&P financials index.
Financials
Financials
Technology (Neutral – Downgrade Alert)
Technology
Technology
Back in 2010, we reiterated that tech equities were deflationary winners, a fact that has not changed since then. The frenetic pace of innovation in and of itself, has prepared the sector to cope with episodes of deflation. Within cyclicals, technology is by far the best performing sector in our Table 1, but the present-day geopolitical and trade tensions compel us to be neutral on the sector with a potential downgrade coming down the line via a software subgroup downgrade. Tech pricing power is resilient during deflationary episodes. However, tech sales growth, which appears to have peaked for the cycle, swings violently, warning of potential turbulence ahead if a down oscillation is looming. We are neutral the S&P technology sector, which is also on our downgrade watch list.
Technology
Technology
Telecommunication Services (Neutral)
Telecommunication Services
Telecommunication Services
Traditionally defensive telecom services stocks have been struggling recently, saddled with rising debt, fighting to remain relevant and avoid becoming a “dumb pipe”. The industry’s pricing power proxy also highlights the point as telecom companies never managed to regain their footing since the GFC. Another important point is that the index materially underperforms the market across all the time horizons we examined returning: -1.5%, -2.0% and -4.4%. Our hypothesis was that telecom carriers should outperform during deflationary periods owing to stable cash flow growth generation and a high dividend yield profile. But, empirical evidence shows the opposite. Likely, the four decades-long sustained underperformance of this now niche safe haven industry suggests that sector specific dynamics are at fault. We are currently neutral the S&P telecommunication services index.
Telecommunication Services
Telecommunication Services
Materials (Underweight)
Materials
Materials
Despite the massive demand from China and, more generally, from the EM complex for commodities over the past several years, the S&P materials sector never actually managed to break free from its structural downtrend. The sector is one of the major disinflationary losers as evident from the chart. Importantly, since the mid-70s, most of the periods when materials managed to outperform the broad market occurred outside the shaded areas and recessions. On average, materials sector pricing power also tends to decline sharply when global growth weakens, as is currently the case. And, with a slight delay, materials sector revenue growth will likely suffer a setback, warning that revenue growth has crested for the cycle. We reiterate our recent downgrade of the S&P materials sector to underweight.
Materials
Materials
Consumer Discretionary (Underweight – Upgrade Alert)
Consumer Discretionary
Consumer Discretionary
Contrary to our hypothesis, S&P consumer discretionary stocks underperform during disinflationary periods that weigh on interest rates. Likely decelerating economic activity trumps that fall in interest rates and consumers gravitate toward staple goods and services and away from discretionarfy purchases. Table 1 reveals that consumer discretionary stocks actually suffer the most early in a deflationary period (-2.0%), and then sharply recover 12 months out and turn marginally positive (0.1%). We are currently underweight the S&P consumer discretionary index, but have it on upgrade alert as a potential buying opportunity.
Consumer Discretionary
Consumer Discretionary
Utilities (Underweight)
Utilities
Utilities
As for the final sector of this Special Report, we had highlighted that the S&P utilities is a notable outlier in our analysis as it does not behave according to our expectations. Likely, some industry specific dynamics are at play as high-yielding safe haven utilities stocks severely underperform during deflationary periods. The sector returns -3.5%, -4.3%, and -4.5% versus the broad marekt on a 6-, 12, and 24-month time horizon, respectively. In theory, two factors should have pushed the relative share price higher: (1) steady cash flow growth and (2) falling interest rates, both of which boost the allure of high yielding competing assets. Neither one was sufficient to break away from the structural downtrend that has been haunting the sector over the years. We are currently underweight the S&P utilites index.
Utilities
Utilities
Footnotes 1 We are using GICS 2 Telecommunication Services index instead of the parent GICS 1 Communication Services index due to the lack of data as the index was only recently introduced.
Remain Cyclically Overweight, But Remove from High-Conviction Overweight List Our 10% stop on the S&P software high-conviction call got triggered and we are obeying it, booking gains and removing this index from the high-conviction overweight list. As a reminder, we are still overweight the S&P software index on a cyclical basis since November 2017, with a trailing stop at a the 27% relative return mark that has yet to get hit (bottom panel). Software stocks have offered bulletproof returns for investors as they are mostly insulated from direct impacts of the U.S./China trade war. In addition, these secular growth stocks are also perceived as immune to a growth slowdown and the drubbing in interest rates since the November 2018 peak in the 10-year Treasury yield has been more than reflected in high-flying multiples. Now that interest rates are trying to bottom, investors have been quick to rein in some of their enthusiasm on the largest tech subsector. We still believe that artificial intelligence, augmented reality, SaaS and the push to the cloud have staying power and are not fads, however from a risk management perspective we are compelled to act and protect profits for our portfolio.
Software Is No Longer A High-Conviction Buy
Software Is No Longer A High-Conviction Buy
Bottom Line: Crystalize 10% gains in S&P software index and remove it from the high-conviction overweight list. We are still cyclically overweight the S&P software index and remain prepared to book profits at the 27% relative return mark and downgrade this key tech subgroup to neutral. Such a downgrade will push the S&P tech sector to an underweight stance and also give our portfolio a defensive over cyclical tilt. Stay tuned.
Continue Playing Defense
Continue Playing Defense
Neutral Downgrade Alert This Monday we published a summary of our portfolio allocation changes that we made over the past couple of months. They key underlying theme running through most of our recent moves was to reduce our cyclical exposure and pocket in some profits. Today we highlight one of the major moves we are preparing to make: downgrade the S&P technology sector. The downgrade will be executed via the S&P software index. As a reminder, we have a stop at the 27% relative return mark and once it’s triggered, we will go neutral on software pushing the overall tech sector to a below benchmark allocation. Our EPS model for the overall tech sector is on the verge of contraction on the back of sinking capex and a seemingly invincible U.S. dollar (middle panel). The San Francisco Fed’s Tech Pulse Index is also closing in on the expansion/contraction line warning that tech stocks are in for a rough ride (bottom panel). Bottom Line: We reiterate our defensive stance on the U.S. equity market as the risk/reward remains to the downside. For the full summary of our recent moves, please see this Monday’s Weekly Report.
Highlights Portfolio Strategy Despite the Fed’s supra natural powers, the deep rooted global growth slowdown will likely win the tug of war versus flush liquidity, especially if the trade war spat stays unresolved and the U.S. dollar remains well bid, both of which undermine U.S. corporate sector profitability. Recent Changes There are no changes to the portfolio this week. Table 1
The Fed Apotheosis
The Fed Apotheosis
Feature Equities hit all-time highs last week, eagerly anticipating this Wednesday’s Fed decision to commence an easing interest rate cycle and save the day. The looming global liquidity injection is the sole reason that stocks are holding near their all-time highs. While markets are treating the Fed as a deity, empirical evidence suggests that risks are actually lurking beneath the surface. Over the past two decades the correlation between stocks and the fed funds rate has been tight and positive. Given the bond market’s view of four fed cuts in the coming year, equity gains are likely running on fumes (Chart 1). Chart 1Mind The Positive Correlation
Mind The Positive Correlation
Mind The Positive Correlation
As we highlighted recently, we remain perplexed that stocks are diverging from earnings.1 Anticipating a flush global liquidity backdrop (i.e. global central banks increasing their reflationary efforts) likely explains this dynamic as the former should ultimately rekindle economic growth, which in turn should boost profit growth. However, the disinflationary fallout from the ongoing manufacturing recession and the petering out in the global credit impulse signal that the liquidity pipes remain clogged. We recently read and re-read the Bank For International Settlements (BIS) Hyun Song Shin’s “What is behind the recent slowdown” speech where he eloquently argues that the global trade deceleration predates last spring’s U.S./China trade dispute.2 Shin has a compelling argument blaming the growth deceleration on the drop in manufactured goods global value chains (GVC) and he depicts this as global trade trailing global GDP (top panel, Chart 2). Interestingly, despite the V-shaped recovery following the Great Recession, global trade never really regained its footing, failing to surpass the 2007 peak. Shin then links this slowdown in global supply chains to financial conditions and the role that banking plays in global trade financing. The middle panel of Chart 2 shows that the GVC move with the ebbs and flows of global banks. In other words, healthy banks tend to boost global trade and vice versa. Finally, given that most trade financing is conducted in U.S. dollars, the greenback’s recent appreciation also explains trade blues. Simply put, decreased availability of U.S. dollar denominated bank credit as a result of a rising greenback is another culprit (U.S. dollar shown inverted, bottom panel, Chart 2). Ergo, there is no miracle cure for the sputtering world economy, especially given the recent re-escalation in global trade tensions and the stubbornly high U.S. dollar, and the gap between buoyant share prices and poor profit performance is likely to narrow via a fall in the former. Two weeks ago we highlighted that foreign sourced profits for U.S. multinationals are under attack as BCA’s global ex-U.S. ZEW survey ticked down anew (top panel, Chart 3). Tack on the global race to ZIRP (and in some cases further into NIRP) and it is crystal clear that the profit recession has yet to run its course. Chart 2Grim Trade Backdrop...
Grim Trade Backdrop...
Grim Trade Backdrop...
Chart 3...Will Continue To Weigh On Foreign Sourced Profits
...Will Continue To Weigh On Foreign Sourced Profits
...Will Continue To Weigh On Foreign Sourced Profits
Meanwhile, China is likely exporting its deflation to the rest of the world and until its business sector regains pricing power, U.S. profits will continue to suffer (bottom panel, Chart 3). Turning over to U.S. shores and domestic corporate pricing power, the news is equally grim. Our pricing power proxy is outright contracting and warns that revenue growth is also under duress for U.S. corporates. Similarly, the ISM manufacturing prices paid subcomponent fell below the 50 boom/bust line and steeply contracting raw industrials commodities are signaling that 6%/annum top line growth for the SPX is unsustainable (Chart 4). On a cyclical 3-12 month time horizon we remain cautious on the broad equity market. Chart 4Sales Pressures...
Sales Pressures...
Sales Pressures...
Chart 5...Are Building Rapidly
...Are Building Rapidly
...Are Building Rapidly
Melting inflation expectations and the NY Fed’s softening Underlying Inflation Gauge (UIG) best encapsulate this softening revenue backdrop and warn that any further letdown in inflation risks sinking S&P 500 sales growth below the zero line (Chart 5). Netting it all out, despite the Fed’s supra natural powers, the deep rooted global growth slowdown will likely win the tug of war versus flush liquidity, especially if the trade war spat stays unresolved and the U.S. dollar remains well bid, both of which undermine U.S. corporate sector profitability. On a cyclical 3-12 month time horizon we remain cautious on the broad equity market. This is U.S. Equity Strategy’s view, which stands in contrast to the more sanguine equity BCA House View. What follows is a recap of recent (mostly) defensive moves in the health care, consumer staples, materials, tech, consumer discretionary and communication services sectors. Anastasios Avgeriou, U.S. Equity Strategist anastasios@bcaresearch.com S&P Health Care (Overweight) Upgraded from Neutral S&P Health Care Equipment (Overweight) Upgraded from Neutral Fear-based sell-off created a buying opportunity in the U.S. health care equipment index as fundamentals remain upbeat. Rising U.S. medical equipment exports are a tailwind for this health care subgroup as 60% of its revenues are generated outside the United States (second panel). The EM demographic shift (not shown) represents yet another boost to the sector as U.S. companies are the technology leaders and often the only source for equipping hospitals/clinics around the globe. Our move to upgrade the S&P health care equipment index also pushed the entire health care sector from neutral to overweight (bottom panel). S&P Health Care
S&P Health Care
S&P Health Care
S&P Managed Health Care (Overweight) Upgraded from Neutral The Bernie Sanders “Medicare For All” bill reintroduction created a buying opportunity in the S&P managed health care index and we were swift to act on it in mid-April. Contained industry cost factors including wages staying at the 2% mark help preserve industry margins (bottom panel). Melting medical cost inflation signals that HMO profit margins will likely expand (third panel). Overall healthy labor market conditions with unemployment insurance claims probing 60-year lows should underpin managed health care enrollment (top & second panels). S&P Managed Health Care
S&P Managed Health Care
S&P Managed Health Care
S&P Hypermarkets (Overweight) Upgraded from Neutral S&P Soft Drinks (Neutral) Upgraded from Underweight A deteriorating macro landscape reflected in the steep fall in U.S. economic data surprises, the drubbing of the 10-year U.S. Treasury yield and melting inflation make a compelling case for an overweight stance in the S&P Hypermarkets index (top & second panels). Similarly, safe haven soft drinks stocks shine when economic conditions are deteriorating (third panel). This defensive pure-play consumer goods sub-sector is also enjoying a rebound in operating metrics, and thus it no longer pays to stay bearish. We lifted exposure to neutral last week, locking in gains of 5.5% since inception. S&P Hypermarkets
S&P Hypermarkets
S&P Hypermarkets
S&P Materials (Neutral) Downgraded from Overweight S&P Chemicals (Underweight) Downgraded from Neutral Global macro headwinds continue to weigh on this deep cyclical sub-index as the risks of a full-blown trade war will likely take a bite out of final demand (third panel). Chemical producers garner 60% of their revenues from abroad and falling U.S. chemical exports are troublesome for this index (top & second panels). Given that chemicals have a 74% market cap weight in the S&P materials index, our move to underweight on the sub-index level also pushed the entire S&P materials index to neutral from overweight. S&P Materials
S&P Materials
S&P Materials
S&P Technology (Neutral) Downgrade Alert S&P Software (Overweight) Lifted trailing stops As a part of our portfolio de-risking measures, we put a 27% profit-taking stop loss on our overweight S&P software index call on June 10. Once triggered, a downgrade to neutral in the S&P software index would also push our S&P tech sector weight to a below benchmark allocation. Meanwhile, our EPS model for the overall tech sector is on the verge of contraction on the back of sinking capex and a firming U.S. dollar (middle panel). The San Francisco Fed’s Tech Pulse Index is also closing in on the expansion/contraction line warning that tech stocks are in for a rough ride (bottom panel). S&P Technology
S&P Technology
S&P Technology
S&P Technology Hardware, Storage & Peripherals (Neutral) Downgraded from Overweight As nearly 60% of the revenues for the S&P technology hardware, storage & peripherals (THS&P) index are sourced from abroad, deflating EM currencies sap foreign consumer purchasing power and weigh on the industry’s exports (third panel). Global export volumes have sunk into contractionary territory, to a level last seen during the Great Recession (not shown) and underscore that industry exports will remain under pressure. The IFO World Economic Survey confirms this challenging export backdrop as it is still pointing toward sustained global export ails (second panel). As a result, all of this has shaken our confidence in an overweight stance in the S&P THS&P and we were compelled to move to the sidelines in early June for a modest relative loss since inception. S&P Technology Hardware, Storage & Peripherals
S&P Technology Hardware, Storage & Peripherals
S&P Technology Hardware, Storage & Peripherals
S&P Consumer Discretionary (Underweight) Upgrade Alert S&P Home Improvement Retail (Neutral) Upgraded from underweight In the July 8 Weekly Report, we put the S&P consumer discretionary sector on an upgrade alert as this early-cyclical sector benefits the most from lower interest rates (bottom panel). The way we will execute this upgrade will be by triggering the upgrade alert on the S&P internet retail index. Melting interest rates and rebounding lumber prices are a boon for home improvement retailers (HIR, second & third panels). Tack on profit-augmenting industry productivity gains and it no longer pays to be bearish HIR. S&P Consumer Discretionary
S&P Consumer Discretionary
S&P Consumer Discretionary
S&P Homebuilders (Neutral) Downgraded from overweight Long S&P Homebuilders / Short S&P Home Improvement Retail Booked Profits Lumber represents an input cost to homebuilders (we booked profits of 10% in our overweight recommendation on May 22 and downgraded to neutral) whereas it is an important selling item in Big Box building & supply retailers that make a set margin on it (third panel). On June 18, as part of our de-risking strategy, we locked in 10% gains in the long S&P homebuilders/short S&P home improvement retail trade that hit our stop loss and we moved to the sidelines. S&P Homebuilders
S&P Homebuilders
S&P Homebuilders
S&P Telecommunication Services (Neutral) Upgraded from Underweight The recent escalation of the trade spat has pushed July’s Markit’s flash U.S. manufacturing PMI reading to 50 - the lowest level since the history of the data. Historically, relative S&P telecom services share price momentum has moved inversely with the manufacturing PMI and the current message is to expect a sustained rebound in the former (bottom panel). Rock bottom profit expectations and firming industry operating metrics signal that most of the grim news is priced in bombed out telecom services valuations (middle panel), and it no longer pays to be underweight. In late-May, we lifted exposure to neutral for 6% relative gains since inception. S&P Telecommunication Services
S&P Telecommunication Services
S&P Telecommunication Services
S&P Movies & Entertainment (Overweight) Upgraded from Neutral Structural shifts in the streaming services industry marked a start of a pricing war with incumbents and new entrants fighting for market share, as evidenced by DIS’s pricing of their upcoming Disney+ service. Consumer confidence remains glued to multi-decade highs and there are high odds that the big gulf that has opened up between confidence and relative S&P movies & entertainment share prices will narrow via a rise in the latter (top panel). Moreover, more dollars spent on recreation is synonymous with a margin expansion in the S&P movies & entertainment index (bottom panel). This consumer spending backdrop is also conducive to a rise in relative profitability, the opposite of what the sell-side currently expects. S&P Movies & Entertainment
S&P Movies & Entertainment
S&P Movies & Entertainment
Arseniy Urazov, Research Associate ArseniyU@bcaresearch.com Footnotes 1 Please see BCA U.S. Equity Strategy Weekly Report, “Beware Profit Recession” dated July 8, 2019, available at uses.bcaresearch.com. 2 https://www.bis.org/speeches/sp190514.pdf Current Recommendations Current Trades Size And Style Views Favor value over growth Favor large over small caps
Housekeeping
Housekeeping
Last Thursday we were stopped out from our tactical S&P semi equipment underweight position as it hit our -7% stop loss (bottom panel). We are obeying the stop loss and are returning this index to a neutral weighting as better than expected profits from both ASML and TSMC lifted all chip-related equities. In marked contrast, our long global gold miners/short S&P oil & gas exploration & production trade initiated just last week has gone parabolic, spiking to 17% (top panel). While our thesis has not changed in this high beta tactical pair trade, from a risk management perspective, we are moving our stop loss from -10% to +12% in order to protect profits. Bottom Line: Stick with the counter-cyclical long global gold miners/short S&P oil & gas exploration & production trade via the long GDX:US/short XOP:US exchange traded funds. For additional details on the rationale behind this trade, please refer to last Monday’s Weekly Report.
Fade Semi Equipment Strength
Fade Semi Equipment Strength
Underweight A tactical trading opportunity has re-emerged in semi equipment stocks. This week we recommended trimming the S&P semi equipment index to underweight on a three-to-six month time horizon, but with a tight stop at the -7% relative return mark. Semi equipment stocks are capital intensive and require precision manufacturing, which makes their sales cycle a carbon copy of the broad manufacturing cycle. The middle panel of the chart shows this tight positive correlation with the ISM manufacturing index and sends a grim message for semi equipment manufacturers. With regard to industry operating metrics, the news is equally glum. Global semi cycles typically last four-to-five quarters and we only just passed the half way mark. Thus, there is more downside to industry sales momentum and we would lean against recent analyst relative revenue euphoria (bottom panel). Bottom Line: Downgrade the S&P semiconductor equipment index to underweight on a tactical – three-to-six month horizon – basis, but set a tight stop at the -7% relative return mark. For additional details please refer to this Monday’s Weekly Report. The ticker symbols for the stocks in this index are: BLBG – S5SEEQ – AMAT, LRCX, KLAC.