Technology

Highlights Portfolio Strategy The ongoing capex upcycle, resurgent credit growth, easy Chinese policy trifecta, upbeat signals from high frequency financial market data and depressed technicals, all suggest that a re-rating phase looms in the S&P industrials sector. Leading indicators of chip end-demand are flashing green, at a time when the chip liquidation phase is clearing excess supplies. It no longer pays to be bearish the S&P semiconductors index. Recent Changes Lift the S&P semiconductors index to neutral today; it is now also on upgrade alert. Table 1
Reflationary Or Recessionary?
Reflationary Or Recessionary?
Feature The SPX continued to grind higher last week, and is now within reach of the key 2,800 level. We expect stiff resistance to persist at that mark; 2,800 has served as a barrier on several occasions last year as we highlighted in recent research (please refer to Chart 1 from the January 28 Weekly Report).1 Year-to-date, we have identified three pillars that would propel the market higher – a more dovish Fed alongside a softer U.S. dollar, a year-over-year increase in SPX EPS for calendar 2019 and a positive resolution to the U.S./China trade spat. As the S&P 500 has come full circle and returned to the early December level, this slingshot recovery suggests that there is positive progress on all three pillars. However, our sense is that the bond market now has to remain tamed in order to cement these equity market gains and vault to fresh all-time highs, likely in the back half of the year. Chart 1 highlights this goldilocks macro backdrop. Chart 1Staying Divorced For A While
Staying Divorced For A While
Staying Divorced For A While
In other words, as U.S. GDP downshifts from last year’s fiscal easing-induced sugar-high back down to trend growth and most importantly avoids recession, equities should excel. Why? Not only will this entice the Fed to stand pat for longer, but the 10-year Treasury yield will also remain on a lower trajectory than previously anticipated. Crudely put, a neither too-hot nor too-cold economic backdrop will allow equities to reflate away. As such, there are high odds that stocks stay divorced from bond yields for a while longer, and we interpret this bond market backdrop as reflationary rather than recessionary. Meanwhile on the Chinese front, following news of the PBoC’s quasi QE that we highlighted in early February as a positive SPX and cyclicals over defensives catalyst,2 it appears that Chinese authorities could not stomach a below 50 print in the Chinese manufacturing PMI for long and are aggressively opening the fiscal taps anew (Chart 2). Chart 2Chinese reflation...
Chinese reflation...
Chinese reflation...
This enormous lending/fiscal stimulus complements ongoing monetary easing and the recent PBoC’s quasi QE, and should ensure that the Chinese economy at least steadies. The upshot is that global growth should also stabilize and put an end to its yearlong deceleration (Chart 3). Chart 3... Should Aid Global Growth
... Should Aid Global Growth
... Should Aid Global Growth
In addition, as U.S. and Chinese negotiation teams race to the finish line in order to get some sort of a deal done before the March 1st deadline, it is clear that a positive outcome is already discounted by the stock market as the SPX enjoys one of the best starts to the year in recent memory. Once this trade policy uncertainty permanently dies down, then last year’s worst performing sectors that were hit hard by the trade dispute will turn into this year’s stock market champions (Chart 4). Chart 4Trade War Hit Deep Cyclicals The Most
Trade War Hit Deep Cyclicals The Most
Trade War Hit Deep Cyclicals The Most
In that light, we reiterate our cyclical over defensive portfolio bent and this week we highlight that a deep cyclical sector stands to benefit greatly from China’s reflation and the apparent resolution of the U.S./China trade spat; another tech subsector weighed down by the trade tussle is also going to enjoy a reversal of fortune and it no longer pays to be bearish. Don’t Write Off Mighty Industrials Year-to-date, industrials stocks are the best performing GICS1 sector, outperforming the SPX by a massive 650bps (Chart 5). While such a breakneck pace is unsustainable and a short term breather is likely, from a cyclical perspective more gains are in store in this still underowned sector. In this report we highlight the top five reasons it still pays to be overweight this deep cyclical sector.
Chart 5
Capex upcycle. The capex upcycle theme remains intact and while there has been some softness recently in the national accounts reported investment outlays, it is highly unlikely that spending plans will grind to a halt similar to the late-2015/early-2016 episode (third panel, Chart 6). Capital goods producers have since replenished their cash coffers and remain committed to develop their capital expenditure projects. Importantly, leading indicators of capex corroborate this backdrop; regional Fed surveys suggest that capital outlays will remain firm for the rest of the year (second panel, Chart 6). Chart 6Capex Upcycle Supports Industrials
Capex Upcycle Supports Industrials
Capex Upcycle Supports Industrials
Resurgent credit growth. Loan growth is on fire in the U.S. and commercial and industrial loan growth is leading the pack, galloping higher and breaching the 10%/annum mark. Bankers are providing the needed fuel to bring to fruition industrials capex plans and, given that historically loan growth and relative profit growth have been positively correlated, the current message is upbeat (Chart 7). Chart 7Loan Growth Fueling The Fire
Loan Growth Fueling The Fire
Loan Growth Fueling The Fire
Chinese easy policy trifecta: credit, fiscal & monetary. Beyond the positive resolution in the U.S./China trade dispute, China has opened up its central bank liquidity tap to complement ongoing easy monetary policy. Tack on the recent monster loan origination and reaccelerating infrastructure spending and factors are falling into place for a pick up in end demand, which is a boon for U.S. capitals goods producers (Chart 8). Chart 8Heed The Chinese Reflation Message...
Heed The Chinese Reflation Message...
Heed The Chinese Reflation Message...
Upbeat signal from high frequency EM related financial market data. Emerging market stocks have been outperforming the MSCI ACW Index since early-October and even in absolute terms have troughed in late-October. The ultimate leading EM indicator, EM FX, put in a bottom in early September, sniffing out some sort of reflationary impulse. Meanwhile, momentum in the CRB raw industrials commodity index has also troughed, confirming the high-frequency EM data points. As a reminder, industrials stocks and the global commodity complex move in lockstep, and we heed the positive message all these financial market indicators are emitting (Chart 9). Chart 9...EM Financial Variables Concur
...EM Financial Variables Concur
...EM Financial Variables Concur
Downtrodden sector sentiment and compelling valuations. Despite this year’s rebound in industrial equities, sour investor sentiment appears deeply ingrained. Relative EPS breadth and oversold technical conditions are contrarily positive. Relative valuations are also beaten down and still offer a compelling entry point (Chart 10). Even on a forward P/E basis industrials are trading at a 4% discount to the broad market and below the historical average. Finally, industrials profit and revenue expectations for the coming 12-months are forecast to trail the broad market according to the sell-side community. Were our thesis to pan out, these would represent low hurdles for capital goods producers to surpass. Chart 10Underowned And Unloved
Underowned And Unloved
Underowned And Unloved
Nevertheless, there is a key macro variable, the U.S. dollar, that is a risk to our sanguine S&P industrials sector view. Chart 11 shows that the greenback and industrials sector fortunes are tightly inversely correlated. Not only is an appreciating U.S. dollar deflationary for global commodities that are priced in the reserve currency, but it also weighs on industrials P&Ls via negative translation effects. As a reminder, roughly 40% of industrials sales are international. Chart 11Rising Greenback Is A Risk
Rising Greenback Is A Risk
Rising Greenback Is A Risk
Netting it all out, the ongoing capex upcycle, resurgent credit growth, easy Chinese policy trifecta, upbeat signals from high frequency EM related financial markets and depressed technicals, all suggest that a re-rating phase looms in the S&P industrials sector. Bottom Line: Stay overweight the S&P industrials sector. The Chip Cycle Is Turning It no longer pays to be bearish chip stocks; lift the S&P semiconductors index to neutral from underweight today. There are high odds that the chip cycle will soon take a turn for the better. Global chip sales have been decelerating for 17 months and are now on the cusp of contraction (Chart 12). Over the past two decades, steep contractions have been associated with recession. Given that BCA’s view does not call for recession this year, it is highly unlikely for global semi sales to suffer a major setback. While we do not rule out a brief and shallow dip below zero similar to the 2011/12 and 2015/16 parallels, leading indicators of global semi sales suggest that a trough is near. Chart 12Global Semi Cycle...
Global Semi Cycle...
Global Semi Cycle...
Namely, BCA’s Global Leading Economic Indicator (GLEI) diffusion index is in a V-shaped recovery signaling that global growth is close to a nadir (middle panel, Chart 12). Similarly the U.S. dollar is decelerating which is a boon to global growth and conducive to higher global chip sales (trade-weighted U.S. dollar shown inverted, bottom panel, Chart 12). With regard to U.S. domiciled semi producers, a depreciating currency provides tremendous leverage to profits as foreign sourced revenues are roughly 80% of the total or twice as high compared with the SPX. Table 2, shows the one year trailing internationally- and China-derived revenues of the ten largest firms in the S&P semiconductors index, representing over 95% of the index. On a weighted basis, 80% of sales are sourced from overseas, including 36% of total sales coming from China. Clearly, global growth in general and Chinese growth in particular are key drivers of semi top line growth. Thus, any positive U.S./China trade dispute resolution would provide more relief for the S&P semi index. Table 2Semi Sales Geographical Exposure
Reflationary Or Recessionary?
Reflationary Or Recessionary?
Moreover, electronics activity is an excellent gauge for semi end-demand. The all-important Chinese electronics imports have ticked up recently. In the U.S., consumer outlays on electronics are firing on all cylinders. Taken together, there is tentative evidence that global semi demand will soon bottom (Chart 13). Chart 13...Is Turning
...Is Turning
...Is Turning
Importantly, the global semi inventory liquidation is ongoing and this supply backdrop should help balance the market. Already Asian DRAM prices, our pricing power gauge for the semi industry, are contracting, underscoring that the semi market is clearing (second & third panels, Chart 14). Importantly, global semi billings that tend to lead global semi sales by a few months have also ticked higher of late (top panel, Chart 14). Chart 14Improving Supply/Demand Dynamics
Improving Supply/Demand Dynamics
Improving Supply/Demand Dynamics
Unfortunately, none of these positive catalysts are picked up by sell-side analysts. In fact, despite the recent rebound in relative share prices, 12-month forward EPS and revenue expectations remain in free fall. Net EPS revisions are as bad as they get, and have sunk near previous troughs that have coincided with durable relative share price rallies (second panel, Chart 15). Chart 15Analysts Have Thrown In The Towel
Analysts Have Thrown In The Towel
Analysts Have Thrown In The Towel
On the relative technical and valuation fronts, pessimism reigns supreme. Our Technical Indicator hovers near one standard deviation below the historical mean and our Valuation Indicator is probing all-time lows. Interestingly, the S&P semi index sports a higher dividend yield than the SPX currently, underscoring that semi stocks are cheap (Chart 16). Chart 16Compelling Valuations And Technicals
Compelling Valuations And Technicals
Compelling Valuations And Technicals
Our Chip Stock Timing Model (CSTM) does an excellent job in capturing all these moving parts and is currently sending a bullish signal (Chart 17). We heed the signal from our CSTM and are compelled to lift exposure to neutral. Chart 17Prepare To Deploy Capital
Prepare To Deploy Capital
Prepare To Deploy Capital
Bottom Line: Lift the S&P semiconductors index to neutral and it is now also on our upgrade watch list; we are looking for an opportunity to boost to overweight on a pullback, stay tuned. Finally, from a risk management perspective we are enticed to increase our trailing stop to 15% in our tactical overweight in the S&P semi equipment index, in order to protect gains. The ticker symbols for the stocks in the S&P semiconductors index are: BLBG: S5SECO – INTC, AVGO, TXN, NVDA, QCOM, MU, ADI, XLNX, AMD, MCHP, MXIM, SWKS, QRVO. Anastasios Avgeriou, Vice President U.S. Equity Strategy anastasios@bcaresearch.com Footnotes 1 Please see BCA U.S. Equity Strategy Weekly Report, “Trader’s Paradise” dated January 28, 2019, available at uses.bcaresearch.com. 2 Please see BCA U.S. Equity Strategy Weekly Report, “Don’t Fight The PBoC” dated February 4, 2019, available at uses.bcaresearch.com. Current Recommendations Current Trades Size And Style Views Favor value over growth Favor large over small caps
Key Portfolio Highlights The S&P 500 has started 2019 with a bang as dovish cooing from the Fed has proven a tonic for equities. While we have not entirely retraced the path to the early-autumn highs, our strategy of staying cyclically exposed, based on our view of an absence of a recession in 2019, has proven a profitable one as investor capitulation reached extreme levels (Charts 1 & 2). Chart 1Capitulation
Capitulation
Capitulation
Chart 2Selling Is Exhausted
Selling Is Exhausted
Selling Is Exhausted
Importantly, risk premia have been deflating as the end-of-year spike in volatility has subsided and junk spreads have narrowed from the fear-induced heights in December (Chart 3). Chart 3Risk Premia Renormalization
Risk Premia Renormalization
Risk Premia Renormalization
Nevertheless, in order for the reflex rebound since the late-December lows to morph into a durable rally, the macro/policy backdrop has to turn from a headwind to a tailwind. We are closely monitoring three potential positive catalysts: A definitively more dovish Fed, which would help restrain the greenback A continuation of the earnings juggernaut A positive U.S./China trade resolution With respect to the first of these, the S&P 500 convulsed following the December 19 Fed meeting and suffered a cathartic 450 point peak-to-trough fall two months ago. The Fed likely made a policy error, and Fed Chair Powell’s resolve is getting tested as has happened with every Chair since Volcker (Charts 4 & 5). Chart 4Powell's Resolve Getting Tested
Powell's Resolve Getting Tested
Powell's Resolve Getting Tested
Chart 5Fed Policy Mistake
Fed Policy Mistake
Fed Policy Mistake
The rising odds of a pause in the Fed tightening cycle, at least for the first half of the year, will likely serve as a welcome respite for equities. Our second catalyst has been gaining steam through the Q4 earnings season which has seen continuation of the double-digit earnings growth of the prior three quarters. Our earnings model points to a moderation of earnings growth in the year to come, in line with sell-side expectations (Chart 6). Our 2019 year-end target remains 3,000 for the SPX, based on $181 2020 EPS and a 16.5x multiple.1 This represents a 6% EPS CAGR, assuming 2018 EPS ends near $162. Chart 6EPS Growth > 0
EPS Growth > 0
EPS Growth > 0
Chart 7
In Chart 7, we show that financials, health care and industrials are responsible for 61% of the SPX’s expected profit growth in 2019 while technology’s contribution has fallen to a mere 7.2%. While the risk of disappointment encompases financials, health care and industrials, there are high odds that tech surprises to the upside as it has borne the brunt of recent negative earnings revisions (Charts 8 & 9). Chart 8Earnings Revisions...
Earnings Revisions...
Earnings Revisions...
Chart 9...Really Weigh On Tech
...Really Weigh On Tech
...Really Weigh On Tech
Lastly, the negativity surrounding the slowdown in China is likely fully reflected in the market (Chart 10), implying an opportunity for a break out should a positive resolution to the U.S./China trade spat be delivered. China’s reflation efforts suggests that the Chinese authorities remain committed to injecting liquidity into their economy (Chart 11). Chart 10China Slowdown Baked In The Cake
China Slowdown Baked In The Cake
China Slowdown Baked In The Cake
Chart 11Reflating Away
Reflating Away
Reflating Away
Already, the PBOC balance sheet, with over $5.5tn in assets, is expanding anew. Empirical evidence suggests that SPX momentum and the ebb and flow of the PBOC balance sheet are joined at the hip, and the current message is positive (Chart 12). All of these underlie our style preferences for cyclicals over defensives2 and international large caps over domestically-geared small caps. Chart 12Heed The PBoC Message
Heed The PBoC Message
Heed The PBoC Message
Chris Bowes, Associate Editor chrisb@bcaresearch.com S&P Financials (Overweight) The divergence between the directions for our CMI and valuation indicator (VI) for S&P financials has reached stunning levels, with the former accelerating into pre-GFC territory and the latter falling to two standard deviations below fair value. Our technical indicator (TI) is sending a relatively neutral message, though this does not diminish the most bullish signal in our cyclical indicator’s history (Chart 13). Chart 13S&P Financials (Overweight)
S&P Financials (Overweight)
S&P Financials (Overweight)
The ongoing strength of the U.S. economy is the driver of such a positive indicator, particularly with respect to the key S&P banks sub index. Our total loans & leases growth model and BCA’s C&I loan growth model (second & bottom panels, Chart 14) are in positive territory. The latter is significant given that C&I loans are the single biggest credit category in bank loan books. Importantly, C&I loans have gone vertical recently topping the 10.5% growth mark despite softening capex intentions and CEO confidence. Further, multi-decade highs in consumer confidence are offsetting the Fed’s tightening cycle and suggest that consumer loans, another key lending category, will also gain traction (third panel, Chart 14). In the context of the generationally high employment rate, the implied lower defaults should drive amplified profit improvement from this credit growth. We reiterate our overweight recommendation. Chart 14Loan Growth Drives Profits
Loan Growth Drives Profits
Loan Growth Drives Profits
S&P Industrials (Overweight) The still-solid domestic footing has maintained our industrials CMI close to its cyclical highs, which are also some of the most bullish in the history of the indicator. However, stock prices have not responded accordingly and our VI has descended mildly from neutral to undervalued. Our TI sends a much more definitive message and stands at a full standard deviation into oversold territory (Chart 15). Chart 1515. S&P Industrials (Overweight)
15. S&P Industrials (Overweight)
15. S&P Industrials (Overweight)
While their cyclical peers S&P financials are almost exclusively a domestic play, S&P industrials have been weighed down by trade flare ups for most of the past year (bottom panel, Chart 16). Accordingly, much of the benefit of positive domestic capex indicators and the more tangible capital goods orders maintaining a supportive trajectory has failed to show up in relative EPS growth (second & third panels, Chart 16), though the latter has recently hooked much higher. Chart 16Industrial Earnings Growth Has Recovered
Industrial Earnings Growth Has Recovered
Industrial Earnings Growth Has Recovered
S&P Materials (Overweight) Our materials CMI has made a turn, rising off its lowest level in 20 years. This has coincided with our VI bouncing off its cyclical low, though it remains in undervalued territory. The signal is shared by our TI which has only recently recovered from a full standard deviation into the oversold zone, a level that has historically presaged S&P materials rallies (Chart 17). Chart 17S&P Materials (Overweight)
S&P Materials (Overweight)
S&P Materials (Overweight)
When we upgraded the S&P materials sector to overweight earlier this year, we noted that China macro dominates the direction of U.S. materials stocks. On the monetary front, the Chinese monetary easing cycle continues unabated and the near 150bps year-over-year drop in the 10-year Chinese Treasury yield will soon start to bear fruit (yield change shown inverted and advanced, bottom panel, Chart 18). The renminbi also moves in lockstep with relative share prices. The apparent de-escalation in the U.S./China trade tensions has boosted the CNY/USD and is signaling that a playable reflation trade is in the offing in the S&P materials sector (top panel, Chart 18). Chart 18Chinese Data Drives Materials Performance
Chinese Data Drives Materials Performance
Chinese Data Drives Materials Performance
S&P Energy (Overweight) Our energy CMI has moved horizontally for the past six quarters, though this followed a snap-back recovery from the extremely depressed levels of 2016 and 2017. Meanwhile both our VI and TI have descended steeply into buying territory with the former approaching two standard deviations below fair value (Chart 19). Chart 19S&P Energy (Overweight)
S&P Energy (Overweight)
S&P Energy (Overweight)
As with the CMI, the relative share price ratio for the S&P energy index has moved laterally since our mid-summer 2017 upgrade to overweight. Interestingly, the integrated oil & gas energy subindex neither kept up with the steep oil price advance until the end of September, nor with the recent drubbing in crude oil prices (top panel, Chart 20). Put differently, oil majors never discounted sustainably higher oil prices, and are also refraining from extrapolating recent oil prices weakness far into the future. Chart 2020. The Stage Is Set For A Recovery In Crude Prices
20. The Stage Is Set For A Recovery In Crude Prices
20. The Stage Is Set For A Recovery In Crude Prices
Nevertheless, the roughly 30% per annum growth in U.S. crude oil production is unsustainable and, were production to remain near all-time highs and move sideways in 2019, then the growth rate would fall back to the zero line. Such a paring back in the growth rate would likely balance the oil market and pave the way for an oil price recovery (oil production shown inverted, bottom panel, Chart 20). This echoes BCA’s Commodity & Energy Strategy service, which continues to forecast higher oil prices into 2019, a forecast which should set the stage for a sustainable rebound next year in S&P energy profits, the opposite of what analysts currently expect (Chart 7). S&P Consumer Staples (Overweight) An improving macro environment is reflected in our consumer staples CMI that has vaulted higher in recent months. However, the strong recent relative outperformance has also shown up in our VI which, though still in undervalued territory, has recovered significantly. Our TI has fully recovered and now sends a neutral message (Chart 21). Chart 21S&P Consumer Staples (Overweight)
S&P Consumer Staples (Overweight)
S&P Consumer Staples (Overweight)
The surging S&P household products sector has been carrying the S&P consumer staples index on its back as solid pricing efforts have been dragging results and forward guidance higher. While household product sales have been enjoying a multi-year growth phase (second panel, Chart 22), it has largely been driven by volumes. However, the recent resurgence in pricing power (third panel, Chart 22) has given volume gains an added kick, pushing sales further. Meanwhile, exports have continued their two-year ascent despite the tough currency environment and the upshot is that relative EPS growth will likely remain upbeat (bottom panel, Chart 22). In light of challenged EM consumer spending growth, this signal is very encouraging. Chart 22Household Products Is Carrying Staples
Household Products Is Carrying Staples
Household Products Is Carrying Staples
S&P Health Care (Neutral) Our health care CMI has been treading water recently. Further, a recovery in pharma stocks has taken our VI from undervalued to a neutral position, while our TI sends a distinctly bearish message as health care stocks have been overbought (Chart 23). Chart 23S&P Health Care (Neutral)
S&P Health Care (Neutral)
S&P Health Care (Neutral)
Healthcare stocks have outperformed in the back half of 2018. Recently a merger mania that has swept through the pharma and biotech spaces has underpinned relative share prices. The last three months have seen an explosion of deals, including the largest biopharma deal ever (Bristol-Myers Squibb buying Celgene for approximately $90 billion) with other global deals falling not too far behind (Takeda buying Shire for $62 billion mid-last year). Such exuberance has clearly confirmed that merger premia are alive and well in the S&P pharma index. It is not merely rising premia that have taken pharma higher either. Pricing power has entered the early innings of a recovery (top panel, Chart 24) while the key export channel points to increasingly bright days ahead (second panel, Chart 24). However, the rise of regulatory pressure from the Trump administration may cause better pricing to prove fleeting. Chart 24Merger Mania In Pharma
Merger Mania In Pharma
Merger Mania In Pharma
Further, pharma’s consolidation phase has come at a cost to sector leverage ratios that have dramatically expanded (bottom panel, Chart 24). Such profligacy may come to haunt the sector should the pricing power recovery falter. S&P Technology (Neutral) Our technology CMI has been moving laterally for the better part of the last three years, though the S&P technology index has ignored the macro headwinds and soared higher over that time. Our VI remains on the overvalued side of neutral, despite the recent tech selloff while our TI has been retrenching into oversold territory (Chart 25). Chart 25S&P Technology (Neutral)
S&P Technology (Neutral)
S&P Technology (Neutral)
Until the end of last year, we maintained a barbell portfolio within the sector by recommending an overweight position in the late-cyclical and capex-driven technology hardware, storage & peripherals and software indexes while recommending an underweight position in the early-cyclical semi and semi equipment indexes. However, we recently upgraded the niche semi equipment to overweight for three reasons. First, trade policy uncertainty has dealt a blow to this tech subindex. Not only are 90% of sales foreign sourced, but a large chunk is also China-related sales. Second, emerging market financial indicators are showing some signs of life, underscoring that semi equipment demand may turn out to be marginally less grim than currently anticipated (second panel, Chart 26). Third, long term semi equipment EPS growth estimates have recently collapsed to a level far below the broad market, indicating that the sell side has thrown in the towel on this niche sector (third panel, Chart 26). Chart 26A Bottom In Semi Equipment
A Bottom In Semi Equipment
A Bottom In Semi Equipment
Overall, and despite our more bullish view on semi equipment, we continue to recommend a neutral weighting in S&P technology. S&P Utilities (Underweight) Our utilities CMI has recovered recently, bouncing off its 25-year low, driven by the modest easing in interest rates, (Chart 27). This has also manifested in a recovery in the S&P utilities index as this fixed income proxy has reacted to the recent fall in Treasury yields (change in yields shown inverted, top panel, Chart 28) and jump in natural gas prices. Further, utilities are typically seen as a domestic defensive play and the recent trade troubles have made utilities soar in a flight to safety. Chart 27S&P Utilities (Underweight)
S&P Utilities (Underweight)
S&P Utilities (Underweight)
We think the tailwinds lifting utilities are transitory and likely to shift to headwinds. First, one of our key themes for the back half of the year is rising interest rates; a move higher in yields will have a predictably negative impact on these high-dividend paying equities. Second, a flight to safety looks fleeting; the ISM manufacturing new orders index usually moves inversely in lock step with utilities and the most recent message is negative for the S&P utilities index (ISM manufacturing new orders index shown inverted, second panel, Chart 28). Meanwhile, S&P utilities earnings estimates have continued to trail the broad market, having taken a significant step down this year (third panel, Chart 28). Chart 28Rising Rates In Late-2019 Will Be A Headwind For Utilities
Rising Rates In Late-2019 Will Be A Headwind For Utilities
Rising Rates In Late-2019 Will Be A Headwind For Utilities
Our VI and TI share this bearish message as the VI is deeply overvalued and the TI is in overbought territory (Chart 27). S&P Real Estate (Underweight) Our real estate CMI has recently started to turn up, though this is off the near decade-low set last year and remains deeply depressed relative to history (Chart 29). This is principally the result of the backup in interest rates since late last year and the lift they have given to the sector, which has been a relative outperformer over the past six months (top panel, Chart 30). Much like the S&P utilities sector in the previous section, and in the context of BCA’s higher interest rate view, we continue to avoid this sector. Chart 29S&P Real Estate (Underweight)
S&P Real Estate (Underweight)
S&P Real Estate (Underweight)
Along with the modest reprieve in borrowing rates, multi family construction continues unabated (second panel, Chart 30), likely driven by all-time highs in CRE prices (third panel, Chart 30). In the absence of an outright contraction in construction, recent weakening in occupancy (bottom panel, Chart 30) will likely prove deflationary to rents, and thus profit prospects. Chart 30Falling Occupancy Will Hurt REIT Profits
Falling Occupancy Will Hurt REIT Profits
Falling Occupancy Will Hurt REIT Profits
Our VI suggests that REITs are modestly overvalued, though the recent outperformance has driven our TI to an overbought condition (Chart 29). S&P Consumer Discretionary (Underweight) Our consumer discretionary CMI has ticked up recently, pushed higher by resiliency in consumer data. However, the S&P consumer discretionary index has clearly responded, pushing against 40-year highs relative to the S&P 500 and taking our VI to two standard deviations above fair value (Chart 31). Much of this should be attributed to Amazon (roughly 30% of the S&P consumer discretionary index) and their exceptional 12% outperformance relative to the broad market over the past year. Chart 31S&P Consumer Discretionary (Underweight)
S&P Consumer Discretionary (Underweight)
S&P Consumer Discretionary (Underweight)
While we have an underweight recommendation on the S&P consumer discretionary index, we have varying intra-segment preferences, highlighted by the recent inception of a pair trade going long homebuilders and short home improvement retailers (HIR). Housing starts and building permits are extremely sensitive to interest rates, depend on first time home buyers and move in lockstep with the homeownership rate. Currently, interest rates are easing, the homeownership rate is coming out of its GFC funk and first time home buyers are slated to make a comeback this spring selling season. This is a boon for homebuilders at the expense of HIR (top & middle panels, Chart 32). Further, the price of lumber is a key determinant of relative profitability: lumber represents an input cost to homebuilders whereas it is an important selling item in Big Box building & supply retailers that make a set margin on it. The recent drubbing in lumber prices should ease margin pressures on homebuilders but eat into HIR profits (momentum in lumber prices shown inverted and advanced in bottom panel, Chart 32). Chart 32Long Homebuilders / Short Home Improvement Retailers
Long Homebuilders / Short Home Improvement Retailers
Long Homebuilders / Short Home Improvement Retailers
S&P Communication Services (Underweight) As the newly-minted communication services has little more than four months of existence, we do not have adequate history to create a cyclical macro indicator. However, we have created Chart 33 with a number of valuation indicators, though we caution that they too are less reliable than the other indicators presented in the preceding pages, owing to a dearth of history. Chart 33S&P Communication Services (Underweight)
S&P Communication Services (Underweight)
S&P Communication Services (Underweight)
Rather, we refer readers to our still-fresh initiation of coverage on the sector3 and look forward to being able to deliver something more substantive in the future. Size Indicator (Favor Large Vs. Small Caps) Our size CMI has been hovering near the boom/bust line, as it has for most of the last two years (Chart 34). Despite the neutral CMI reading, we downgraded small caps in the middle of last year,4 and moved to a large cap preference, based on the diverging (and unsustainable) debt levels of small caps vs. their large cap peers (bottom panel, Chart 35). This size bias remains a high conviction call for 2019. Chart 34Favor Large Vs. Small Caps
Favor Large Vs. Small Caps
Favor Large Vs. Small Caps
Macro data too has turned against small caps. Recent NFIB surveys have shown that small business optimism has continued to fall through the end of the year, albeit from a very high level (top panel, Chart 35). This has coincided with the continued slide of small cap stocks relative to their large cap peers. Chart 35Small Caps Have A Big Balance Sheet Problem
Small Caps Have A Big Balance Sheet Problem
Small Caps Have A Big Balance Sheet Problem
Further, the percentage of small businesses with planned labor compensation increases continues to set new all-time highs and deviates substantially from the national trend (second panel, Chart 35). This divergence becomes more worrying when plotted against those same firms increasing prices (third panel, Chart 35), which has trailed for some time and recently flattened. The inference is that margin pressure is intensifying and likely to continue for the foreseeable future. In the context of the absence of small cap balance sheet discipline during the past five years, ongoing large cap outperformance seems ever more likely. Footnotes 1 Please see BCA U.S. Equity Strategy Weekly Report, “ Catharsis,” dated January 14, 2019, available at uses.bcaresearch.com. 2 Please see BCA U.S. Equity Strategy Weekly Report, “ Don't Fight The PBoC,” dated February 4, 2019, available at uses.bcaresearch.com. 3 Please see BCA U.S. Equity Strategy Daily Insight, “New Lines Of Communication,” dated October 1, 2018, available at uses.bcaresearch.com. 4 Please see BCA U.S. Equity Strategy Daily Insight, “Small Caps Have A Big Balance Sheet Problem,” dated May 10, 2018, available at uses.bcaresearch.com.

These high-octane, highly-cyclical tech stocks move in lockstep with other volatile assets. Rebounding emerging market (EM) stocks and FX not only confirm the S&P semi equipment breakout, they also signal additional gains in the coming months. Like these…
Highlights Portfolio Strategy Chinese reflation, the ongoing global capex upcycle, and the Fed induced cap on the greenback with the knock-on effect of higher commodity prices, all signal that it still pays to overweight S&P cyclicals at the expense of S&P defensives. Sustained EM stock outperformance, a soft U.S. dollar, improving semi equipment operating metrics, along with compelling relative valuations and technicals, all suggest that there are high odds that the recent semi equipment run up has more upside. Recent Changes There are no changes in the portfolio this week. Feature The SPX consolidated the 350 point advance since the Christmas Eve trough last week, setting the stage for a durable advance in the coming months. The Fed stood pat last Wednesday, and signaled a much more dovish policy stance going forward. Chairman Powell was clearly humbled by last December’s convulsing equity market and abrupt tightening in financial conditions. On that front, in the latest FOMC statement the explicit mention of patience is significant: “the Committee will be patient as it determines what future adjustments to the target range for the federal funds rate may be appropriate”. A definitively more dovish Fed, which will help restrain the greenback, remains one of the three key catalysts for a durable equity market advance as we have highlighted in recent research.1 Encouragingly, our proprietary Equity Capitulation Indicator (ECI) has bottomed at two standard deviations below the historical mean (Chart 1). Over the past two decades, such a depressed level in our ECI has marked previous equity market troughs including the early-2016, 2011, 2002 and 1998 iterations. Only the GFC episode was lower, falling to three standard deviations below the mean. Clearly the late-December selling frenzy registers as another investor capitulation point and, if history at least rhymes, more gains are in store for the broad equity market. Chart 1Capitulation
Capitulation
Capitulation
Chart 2 shows some other measures of breadth that corroborate our ECI’s message: investors hit the panic button and exited equities in droves in Q4. The upshot is that with selling exhausted, stocks can now stage a durable recovery as long as profits continue to expand. As a reminder, the continuation of the earnings juggernaut is the second key catalyst we identified two weeks ago.2 Midway through earnings season, SPX EPS have held up well with growth approaching 16%. For calendar 2019 we expect mid-single digit EPS growth in line with the signal from our macro driven S&P 500 EPS growth model (please refer to Chart 4 from the mid-January Weekly Publication).3 Chart 2Selling Is Exhausted
Selling Is Exhausted
Selling Is Exhausted
A positive resolution to the U.S./China trade spat is the third catalyst we highlighted recently in order for equities to break out to fresh all-time highs.4 Related to this, China’s reflation efforts are equally important. On that front, news of quasi QE from the PBOC suggests that the Chinese authorities remain committed to injecting liquidity into their economy.5 Already, the PBOC balance sheet, with over $5.5tn in assets, is expanding anew. Empirical evidence suggests that SPX momentum and the ebb and flow of the PBOC balance sheet are joined at the hip, and the current message is positive (second panel, Chart 3). Chart 3Heed The PBoC Message
Heed The PBoC Message
Heed The PBoC Message
Beyond the PBOC balance sheet expansion, the Chinese six-month credit impulse is also in a sling shot recovery. This Chinese credit backdrop is enticing and moves more or less in tandem with the SPX six-month impulse (top panel, Chart 4). Chart 4Reflating Away
Reflating Away
Reflating Away
Two forces explain these relationships. First, China’s rise to become the second largest economy in the world along with its insatiable appetite for commodities and durable goods. Second, 40% of S&P 500 sales are international and an increasing share now originates in emerging markets in general and in China in particular. Keep in mind that the S&P cyclicals/defensives ratio is not only a high beta play on the SPX itself (top panel, Chart 3), but also an S&P global versus domestic gauge. Thus, both of these Chinese indicators also enjoy a positive correlation with the cyclicals vs. defensives tilt (bottom panels, Charts 3 & 4). With that in mind, this week we are drilling deeper into why we continue to prefer S&P cyclicals over S&P defensives and also highlight a highly cyclical index we went overweight in mid-December that has gone parabolic. Double Down On Cyclicals Vs. Defensives Early-October 2017 marks the initiation of our cyclical vs. defensive preference. Initially, this tilt jumped and peaked in mid-2018 returning 18% since inception. Since then, it has given up all of those gains and then some before troughing with the market on Christmas Eve, suffering a 6% drop since inception. Currently, the ratio has moved full circle and is back to where it was when we first recommended this portfolio bent (Chart 5). Chart 5Full Circle
Full Circle
Full Circle
Should investors commit capital to this tilt at this stage of the cycle and given the current global macro backdrop? The short answer is yes. Charts 3 & 4 show that China’s reflation efforts and the fate of the S&P cyclicals/defensives ratio are closely correlated. In addition to the PBOC’s expanding balance sheet and rising Chinese credit impulse, Chinese monetary easing also benefits S&P cyclicals at the expense of S&P defensives. The Chinese reserve requirement ratio (RRR) has plummeted to the lowest point since the GFC and Chinese interest rates are also plumbing multi-year lows (RRR shown inverted, top panel, Chart 6). Chart 6China Flashing Green
China Flashing Green
China Flashing Green
Tack on a resurgent currency with the CNY briefly breaking 6.70 with the U.S. dollar, and factors are falling into place for a playable rally in the cyclicals/defensive ratio. Likely, the Chinese are trying to appease President Trump by underpinning the yuan, but the Fed’s recent more dovish stance on interest rate hikes is also pushing the greenback lower. Taken together, this is a boon for the commodity exposed U.S. cyclicals that also garner a significant share of their sales from abroad (bottom panel, Chart 6). Commodity prices troughed last September, staying true to their leading properties and have been in recovery mode ever since (top panel, Chart 7). Now that the Fed has capped the U.S. dollar, more gains are in store for commodities and that is a boon for commodity producers’ top line growth prospects. Chart 7Capex Remains Healthy
Capex Remains Healthy
Capex Remains Healthy
The demand backdrop is also enticing at the current stage of the business cycle, not only domestically, but also in China. Capital outlays remain upbeat and despite some recent turbulence, U.S. capex intentions are near multi-year highs (third panel, Chart 7). In China, recent piece meal fiscal easing announcements are far from negligible; already infrastructure spending has jumped after contracting late last year (second panel, Chart 7). Were these announcements to get supplemented by a bigger and more comprehensive package, then commodity-levered equities will excel further. A look at the relative balance sheet health of cyclicals versus defensives is revealing. Cyclicals are paying down debt and their cash flow continues to improve, still recovering from the late-2015/early 2016 global manufacturing recession. On the flipside, defensives are piling on debt. All four safe haven sectors have been degrading their balance sheets (relative net debt-to-EBITDA shown inverted, middle panel, Chart 8). Interest coverage sends a similar message: cyclicals are in excellent health both in absolute terms and compared with defensives (top panel, Chart 8). Chart 8B/S Improvement Continues
B/S Improvement Continues
B/S Improvement Continues
Sell-side analysts have not yet taken notice of the macro tide that is turning in favor of cyclicals over defensives. Relative forward profit growth has collapsed to nil and net EPS revisions are at previous nadirs (fourth & fifth panels, Chart 9). Chart 9Oversold And Unloved
Oversold And Unloved
Oversold And Unloved
In sum, if our thesis pans out that China will continue to reflate, global capex will remain vibrant, the greenback will drift lower (U.S. dollar shown inverted, top panel, Chart 9) courtesy of a dovish Fed that will push the broad commodity complex higher, then a significant valuation rerating looms for the cyclicals/defensives tilt (second panel, Chart 9). Bottom Line: Continue to the prefer S&P cyclicals to S&P defensives. We also reiterate our recent long S&P materials/short S&P utilities pair trade.6 Semi Equipment: Buy Into Strength In mid-December we boosted the S&P semi equipment index to overweight from underweight and since then this niche chip subindex has outperformed the broad market by 17%.7 Semi equipment stocks are high beta (bottom panel, Chart 10) and, while we are recommending to buy into strength, from a portfolio risk management perspective, today we are also setting a trailing stop at the 10% return mark in order to protect profits in this tactical (three-to-six month time horizon) position. Chart 10Buy Into Strength...
Buy Into Strength...
Buy Into Strength...
These high-octane highly-cyclical tech stocks move in lockstep with other volatile asset classes. Rebounding emerging market (EM) stocks and FX confirm the S&P semi equipment breakout, and signal additional gains in the coming months (Chart 11). Not only do they share the high-beta status, but also semi equipment stocks garner 90% of their sales outside U.S. shores and 21% of total revenues come from China (please refer to Table 3 in our December 17, 2018 Weekly Report). Thus, the tight inverse correlation with the greenback and positive correlation with the outperforming EM stocks comes as no surprise (Chart 11). Chart 11...But Expect Heightened Vol
...But Expect Heightened Vol
...But Expect Heightened Vol
Importantly, Taiwan and Korea are chip manufacturing hubs and semi equipment stocks are levered plays on the macro backdrops of these two economies. Recent data suggests that a turn is in the making in two key indicators in these countries, respectively. Taiwanese tech capex has likely troughed at a depressed level (middle panel. Chart 12), and Korean electronic components manufacturing capacity is now contracting for the first time since late-1997 (bottom panel, Chart 12). The latter is significant as this abrupt and sizable reining in of productive capacity will soon help arrest the fall in chip prices, which serves as an excellent pricing power proxy for the semi equipment industry. Chart 12Green Shoots
Green Shoots
Green Shoots
Historically, relative forward profit growth and DRAM price momentum are joined at the hip. Therefore, were DRAM prices to exit deflation on the back of constrained Korean capacity, that would be a boon for relative profit prospects (second panel, Chart 13). Chart 13Analysts Have Thrown In The Towel
Analysts Have Thrown In The Towel
Analysts Have Thrown In The Towel
Despite these marginal positive developments, sell-side analysts’ pessimism reigns supreme. Industry revenue and profit growth expectations trail the broad market by a wide margin and net EPS revisions remain as bad as they get. The upshot is that these lowered profit and sales growth bars will be easy to surpass in 2019 (Chart 13). With regard to technicals and valuations, oversold conditions bounced, as we posited in mid-December using history as a guide, but still remain depressed (middle panel, Chart 14). Valuations are compelling with the S&P semi equipment forward P/E trading at a roughly 40% discount to the overall market (fourth panel, Chart 13). Chart 14Technicals Remain Depressed
Technicals Remain Depressed
Technicals Remain Depressed
Finally, earnings season has revealed that the bifurcated semiconductor market has staying power with semi equipment stocks (we are overweight) outperforming their ailing semi producer brethren (we remain underweight). Netting it out, sustained EM stock outperformance, a soft U.S. dollar, improving industry operating metrics, along with compelling relative valuations and technicals, all suggest that there are high odds that the recent semi equipment run up has more upside. Bottom Line: Maintain the overweight stance in the S&P semi equipment index for a while longer, but set a trailing stop at the 10% relative return mark in order to protect profits in this tactical (three-to-six month time horizon) position. The ticker symbols for the stocks in this index are: BLBG: S5SEEQ – AMAT, LRCX, KLAC. Anastasios Avgeriou, Vice President U.S. Equity Strategy anastasios@bcaresearch.com Footnotes 1 Please see BCA U.S. Equity Strategy Weekly Report, “Dissecting 2019 Earnings” dated January 22, 2019, available at uses.bcaresearch.com. 2 Ibid. 3 Please see BCA U.S. Equity Strategy Report, “Catharsis” dated January 14, 2019, available at uses.bcaresearch.com. 4 Please see BCA U.S. Equity Strategy Weekly Report, “Dissecting 2019 Earnings” dated January 22, 2019, available at uses.bcaresearch.com. 5 Please see Bloomberg Article, “PBOC Sets Up Swap Tool to Aid Bank Capital via Perpetual Bonds” dated January 24, 2019, available at www.bloomberg.com. 6 Please see BCA U.S. Equity Strategy Report, “Trader’s Paradise” dated January 28, 2019, available at uses.bcaresearch.com. 7 Please see BCA U.S. Equity Strategy Report, “Signal Vs. Noise” dated December 17, 2018, available at uses.bcaresearch.com. Current Recommendations Current Trades Size And Style Views Favor value over growth Favor large over small caps
The S&P tech hardware, storage & peripherals (THSP) index bounced yesterday on the back of index heavyweight Apple’s results. While the relatively weak results had long been telegraphed to the market and the upcoming quarter’s guidance was…
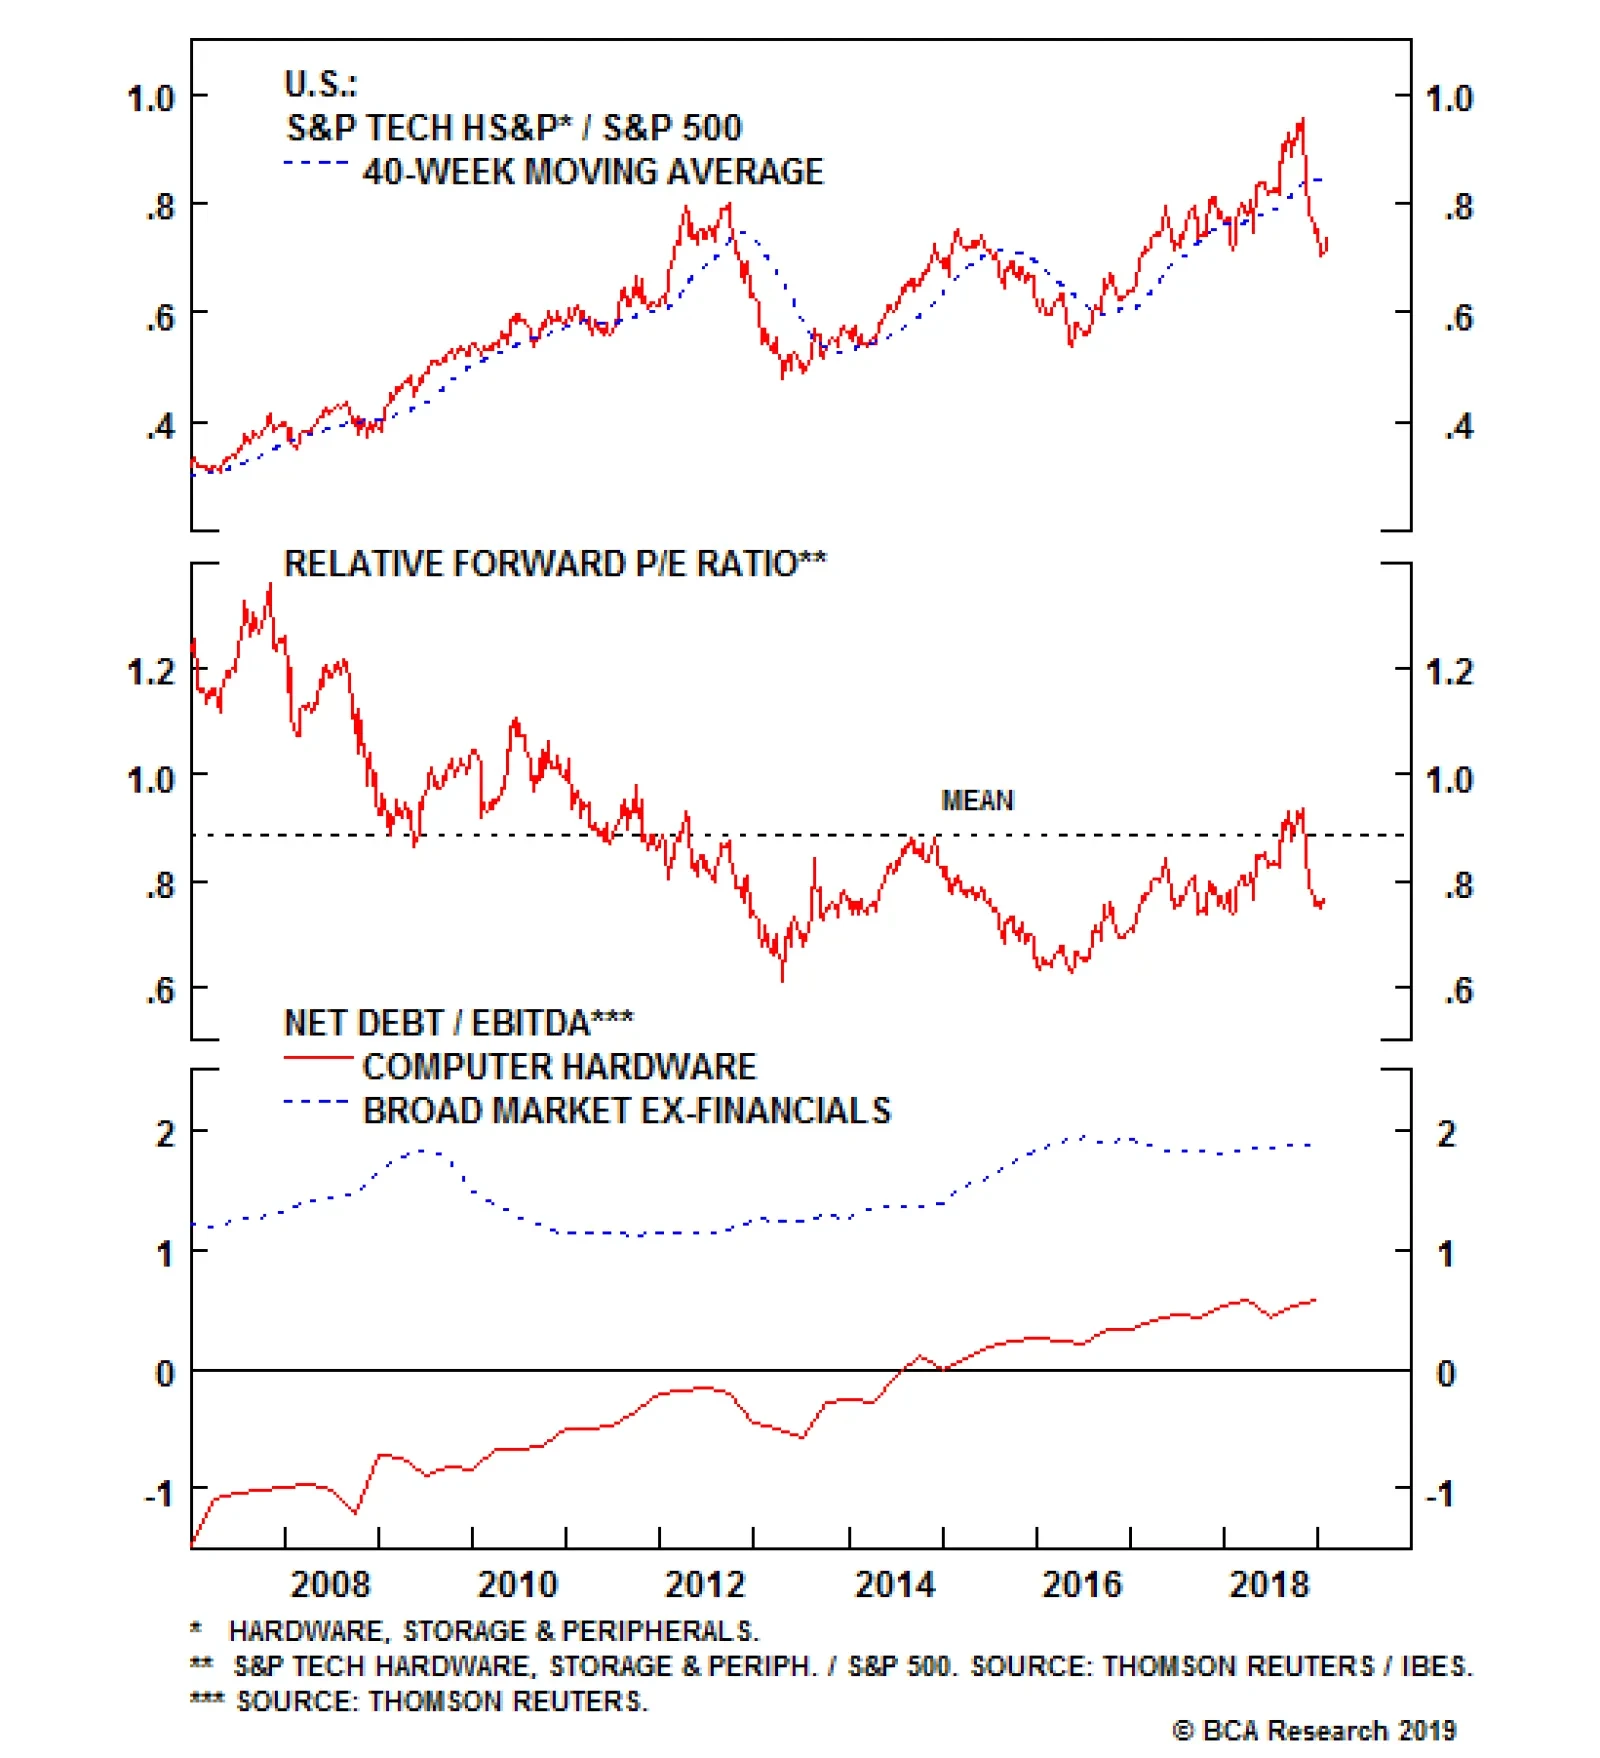
Overweight The S&P tech hardware, storage & peripherals (THSP) index bounced yesterday on the back of index heavyweight Apple’s results. While the relatively weak results had long been telegraphed to the market and the upcoming quarter’s guidance was underwhelming, the company’s stock saw a relief rally based on the absence of a further deterioration in results. Importantly, the index’s valuation continues to trail the broad market by more than 20% (second panel), though dissecting this is significant. Apple’s net cash position is well known by the market which, as of the most recent quarter, stood at more than $27/share. While the overall S&P THSP index has moved to a net debt positive position, the spread versus the broad market ex-financials remains close to 1.5 turns of EBITDA (bottom panel). Adjusting for this would bias the P/E ratio even lower, creating in our view an unreasonable discount. Bottom Line: With the slowdown in China being a known known and resolution of the trade dispute a potential positive catalyst,1 the worst case appears to be priced in to Apple. We reiterate our overweight recommendation for the S&P THSP index and are removing our downgrade alert. The ticker symbols for the stocks in the S&P THSP index are: BLBG: S5CMPE - HPQ, WDC, STX, XRX, AAPL, HPE, NTAP.
Is This The Bottom For Apple
Is This The Bottom For Apple
1 Please see BCA U.S. Equity Strategy Weekly Report, “Trader’s Paradise” dated January 28, 2019, available at uses.bcaresearch.com.
Highlights The Eurostoxx600’s short bursts of outperformance require either global technology to underperform or the euro to underperform. EM’s short bursts of outperformance usually coincide with the global healthcare sector’s short bursts of underperformance. Remain tactically overweight to Europe and EM, but expect to reverse position later in the year. The ECB is justified in setting an accommodative monetary policy, but it is not justified in setting an ultra-accommodative monetary policy. Soft inflation prints will cap the extent to which bond yields can rise in the near term. Italian BTPs are an attractive long-term proposition, especially relative to other euro area bonds. Feature Chart of the WeekEuro Area Inflation Appears To Be Underperforming...
Euro Area Inflation Appears To Be Underperforming... ...But Adjusted For Its 'Negative Space' It Is Not
Euro Area Inflation Appears To Be Underperforming... ...But Adjusted For Its 'Negative Space' It Is Not
...But Adjusted For Its 'Negative Space' It Is Not
Euro Area Inflation Appears To Be Underperforming... ...But Adjusted For Its 'Negative Space' It Is Not
Euro Area Inflation Appears To Be Underperforming... ...But Adjusted For Its 'Negative Space' It Is Not
“The music is not in the notes, but in the silence between” – Wolfgang Amadeus Mozart As Mozart pointed out, true awareness lies not in appreciating what is there, but in appreciating what is not there. This is the concept of ‘negative space’: to understand an object, you have to understand the empty space that defines it. This week’s report extends the concept of negative space into the fields of investment and economics to make more sense of Europe’s recent past and its future. The Negative Space In Stock Markets Picking stock markets is a relative game. This means that what a stock market does not contain – its negative space – is often more important than what it does contain (Table I-1). This is not an abstract proposition, it is a mathematical truth. When a major global sector is strongly outperforming, a stock market’s zero or near-zero exposure to that sector will create a strong headwind to relative performance. And when the major sector is underperforming, its absence in the stock market will necessarily create a strong tailwind to relative performance.
Chart I-
For the European stock market, the negative space is technology, a sector in which European equities have a near-zero exposure. But there is another factor to consider: the currency. The technology sector’s global profits are mostly translated into shares quoted in dollars, while European equities’ global profits are mostly translated into shares quoted in euros. It follows that the Eurostoxx600’s short bursts of outperformance require at least one of the following two conditions (Chart I-2): Chart I-2The Eurostoxx600 Usually Outperforms When Technology Underperforms
The Eurostoxx600 Outperforms When Technology Underperforms
The Eurostoxx600 Outperforms When Technology Underperforms
Technology to underperform. Or: The euro to underperform. For emerging market (EM) equities, the negative space is healthcare, a sector in which EM has a near-zero exposure. Therefore unsurprisingly, EM’s short bursts of outperformance usually coincide with the healthcare sector’s short bursts of underperformance (Chart I-3). Sceptics will raise an obvious question: what is the cause and what is the effect? The answer is that sometimes EM is the driver of healthcare relative performance, and at other times vice-versa. Chart I-3EM Usually Outperforms When Healthcare Underperforms
EM Outperforms When Healthcare Underperforms
EM Outperforms When Healthcare Underperforms
A sharp slowdown emanating from emerging economies would undoubtedly drag down global equities. In the ensuing bear market, the more defensive healthcare sector would almost certainly outperform the financials. Under these circumstances the direction of causality would clearly be from EM to healthcare’s relative performance. On the other hand, absent a major bear market, in a common or garden reassessment of sector relative valuations versus their growth prospects, the causality would run in the other direction: sector rotation would drive the relative performance of equity markets: healthcare’s underperformance would help EM to outperform; and technology’s underperformance would help European equities to outperform. As we have explained in recent reports, the major sectors – and therefore the major stock markets – are now in this latter configuration in a brief countertrend burst before reverting to their structural trends later this year (Chart I-4 and Chart I-5). So for the time being, remain tactically overweight to Europe and to EM.1 Chart I-4The Eurostoxx600 Outperformance Is A Countertrend Burst
The Eurostoxx600 Outperformance Is A Countertrend Burst
The Eurostoxx600 Outperformance Is A Countertrend Burst
Chart I-5The EM Outperformance Is A Countertrend Burst
The EM Outperformance Is A Countertrend Burst
The EM Outperformance Is A Countertrend Burst
The Negative Space In European Inflation And Unemployment On the face of it, inflation is structurally underperforming in the euro area versus the U.S. But on closer examination this is only because of what the euro area harmonised index of consumer prices (HICP) does not contain: owner occupied housing costs – which tend to rise faster than other items in the price basket. Adjusting for this negative space in the HICP, the euro area and the U.S. have both achieved the exact same modest structural inflation, which their central banks define as ‘price stability’ (Chart of the Week). In a similar vein, the unemployment rate disregards changes in the labour participation rate. When people join the labour force – as they are in their tens of millions in Europe (Chart I-6) – the joining cohort tends to have a slightly higher unemployment rate given its inexperience in the formal labour market. So the joiners tend to lift the overall unemployment rate too. The paradox is that the percentage of the working age (15-74) population in employment also rises at the same time. Looking at this alternative measure of labour market health, the euro area employment market is in a structural uptrend and much healthier than it was at the peak of the last cycle in 2008 (Chart I-7). Chart I-6Europeans Are Joining The Labour Force In Their Tens Of Millions
Europeans Are Joining The Labour Force In Their Tens Of Millions
Europeans Are Joining The Labour Force In Their Tens Of Millions
Chart I-7The European Employment To Population Ratio Is In A Structural Uptrend
The European Employment To Population Ratio Is In A Structural Uptrend
The European Employment To Population Ratio Is In A Structural Uptrend
Hence, once we adjust for what is missing in euro area inflation and the euro area unemployment rate, neither inflation nor employment market performance appear to be too cold or too hot. This means that the ECB is justified in setting an accommodative monetary policy, but it is not justified in setting an ultra-accommodative monetary policy. The Negative Space In Monetary Policy The negative space in monetary policy is literally the negative space, by which we mean that interest rates cannot go deeply into negative territory. With the deposit rate already at -0.4 percent, the ECB’s room for manoeuvre in the dovish direction is limited. On the other hand, neither can monetary policy get meaningfully hawkish in the near term. The simple reason is that the ECB, like other central banks, is now even more wedded to ‘data-dependency’. The problem with this is that the data on which the central banks depend is always backward-looking. So policy will reflect what was happening one or two months ago, rather than what is happening now. Specifically, the plunge in the price of crude oil will depress both headline and core inflation rates (Chart I-8). And the recent wobble in risk-asset prices has weighed down some sentiment surveys (Chart I-9). Having promised to be data-dependent, the central banks have effectively created ‘an algorithm’ for their policy setting, an algorithm which everyone can see and read. It follows that the data, especially soft inflation prints, will cap the extent to which bond yields can rise in the near term. Chart I-8The Plunge In The Price Of Crude Will Subdue Inflation
The Plunge In The Price Of Crude Will Subdue Inflation
The Plunge In The Price Of Crude Will Subdue Inflation
Chart I-9The Stock Market Sell-Off Hurt Sentiment
The Stock Market Sell-Off Hurt Sentiment
The Stock Market Sell-Off Hurt Sentiment
However, core euro area bonds are an unattractive long-term proposition. When yields are so close to their lower bound, there is little scope for a capital gain, even in a crisis. Whereas the scope for a capital loss is considerably greater. By contrast, Italian BTPs are an attractive long-term proposition, especially relative to other euro area bonds. Almost all of the 2.75 percent yield on 10-year BTPs is a premium for euro break-up risk. Yet the populists in Italy do not want to break up the euro. And despite their rhetoric, neither do the populists in the core countries. To understand why, we must explain the negative space of ECB QE. When the ECB bought BTPs from Italian investors, what the Italian investors did not do was deposit the cash in Italian banks. Instead, they deposited it in German banks – something that we can see very clearly in the euro area’s mirror-image Target2 imbalances (Chart I-10). Chart I-10ECB QE Has Exacerbated The Target2 Imbalances
ECB QE Has Exacerbated The Target2 Imbalances
ECB QE Has Exacerbated The Target2 Imbalances
In effect, the core countries, through their equity in the Eurosystem, are holding a huge quantity of Italy’s €2.7 trillion of BTPs. Meaning that if the euro broke up, the core countries would be the ones picking up the tab. For the euro area’s future, this is the most important negative space of all. Dhaval Joshi, Senior Vice President Chief European Investment Strategist dhaval@bcaresearch.com Fractal Trading System* There are no new trades this week. But all four of our open trades – long PKR/INR, industrials versus utilities, litecoin and ethereum, and MIB versus Eurostoxx – are in profit. For any investment, excessive trend following and groupthink can reach a natural point of instability, at which point the established trend is highly likely to break down with or without an external catalyst. An early warning sign is the investment’s fractal dimension approaching its natural lower bound. Encouragingly, this trigger has consistently identified countertrend moves of various magnitudes across all asset classes. The post-June 9, 2016 fractal trading model rules are: When the fractal dimension approaches the lower limit after an investment has been in an established trend it is a potential trigger for a liquidity-triggered trend reversal. Therefore, open a countertrend position. The profit target is a one-third reversal of the preceding 13-week move. Apply a symmetrical stop-loss. Close the position at the profit target or stop-loss. Otherwise close the position after 13 weeks. Use the position size multiple to control risk. The position size will be smaller for more risky positions. * For more details please see the European Investment Strategy Special Report “Fractals, Liquidity & A Trading Model,” dated December 11, 2014, available at eis.bcaresearch.com Footnotes 1 Please see the European Investment Strategy Weekly Report, “Why 2019 Is The Mirror-Image Of 2018”, dated January 10, 2019, available at eis.bcaresearch.com. Fractal Trading Model Recommendations Asset Allocation Equity Regional and Country Allocation Equity Sector Allocation Bond and Interest Rate Allocation Currency and Other Allocation Closed Fractal Trades Trades Closed Trades Asset Performance Currency & Bond Equity Sector Country Equity Indicators Bond Yields Chart II-1Indicators To Watch - Bond Yields
Indicators To Watch - Bond Yields
Indicators To Watch - Bond Yields
Chart II-2Indicators To Watch - Bond Yields
Indicators To Watch - Bond Yields
Indicators To Watch - Bond Yields
Chart II-3Indicators To Watch - Bond Yields
Indicators To Watch - Bond Yields
Indicators To Watch - Bond Yields
Chart II-4Indicators To Watch - Bond Yields
Indicators To Watch - Bond Yields
Indicators To Watch - Bond Yields
Interest Rate Chart II-5Indicators To Watch - Interest Rate Expectations
Indicators To Watch - Interest Rate Expectations
Indicators To Watch - Interest Rate Expectations
Chart II-6Indicators To Watch - Interest Rate Expectations
Indicators To Watch - Interest Rate Expectations
Indicators To Watch - Interest Rate Expectations
Chart II-7Indicators To Watch - Interest Rate Expectations
Indicators To Watch - Interest Rate Expectations
Indicators To Watch - Interest Rate Expectations
Chart II-8Indicators To Watch - Interest Rate Expectations
Indicators To Watch - Interest Rate Expectations
Indicators To Watch - Interest Rate Expectations
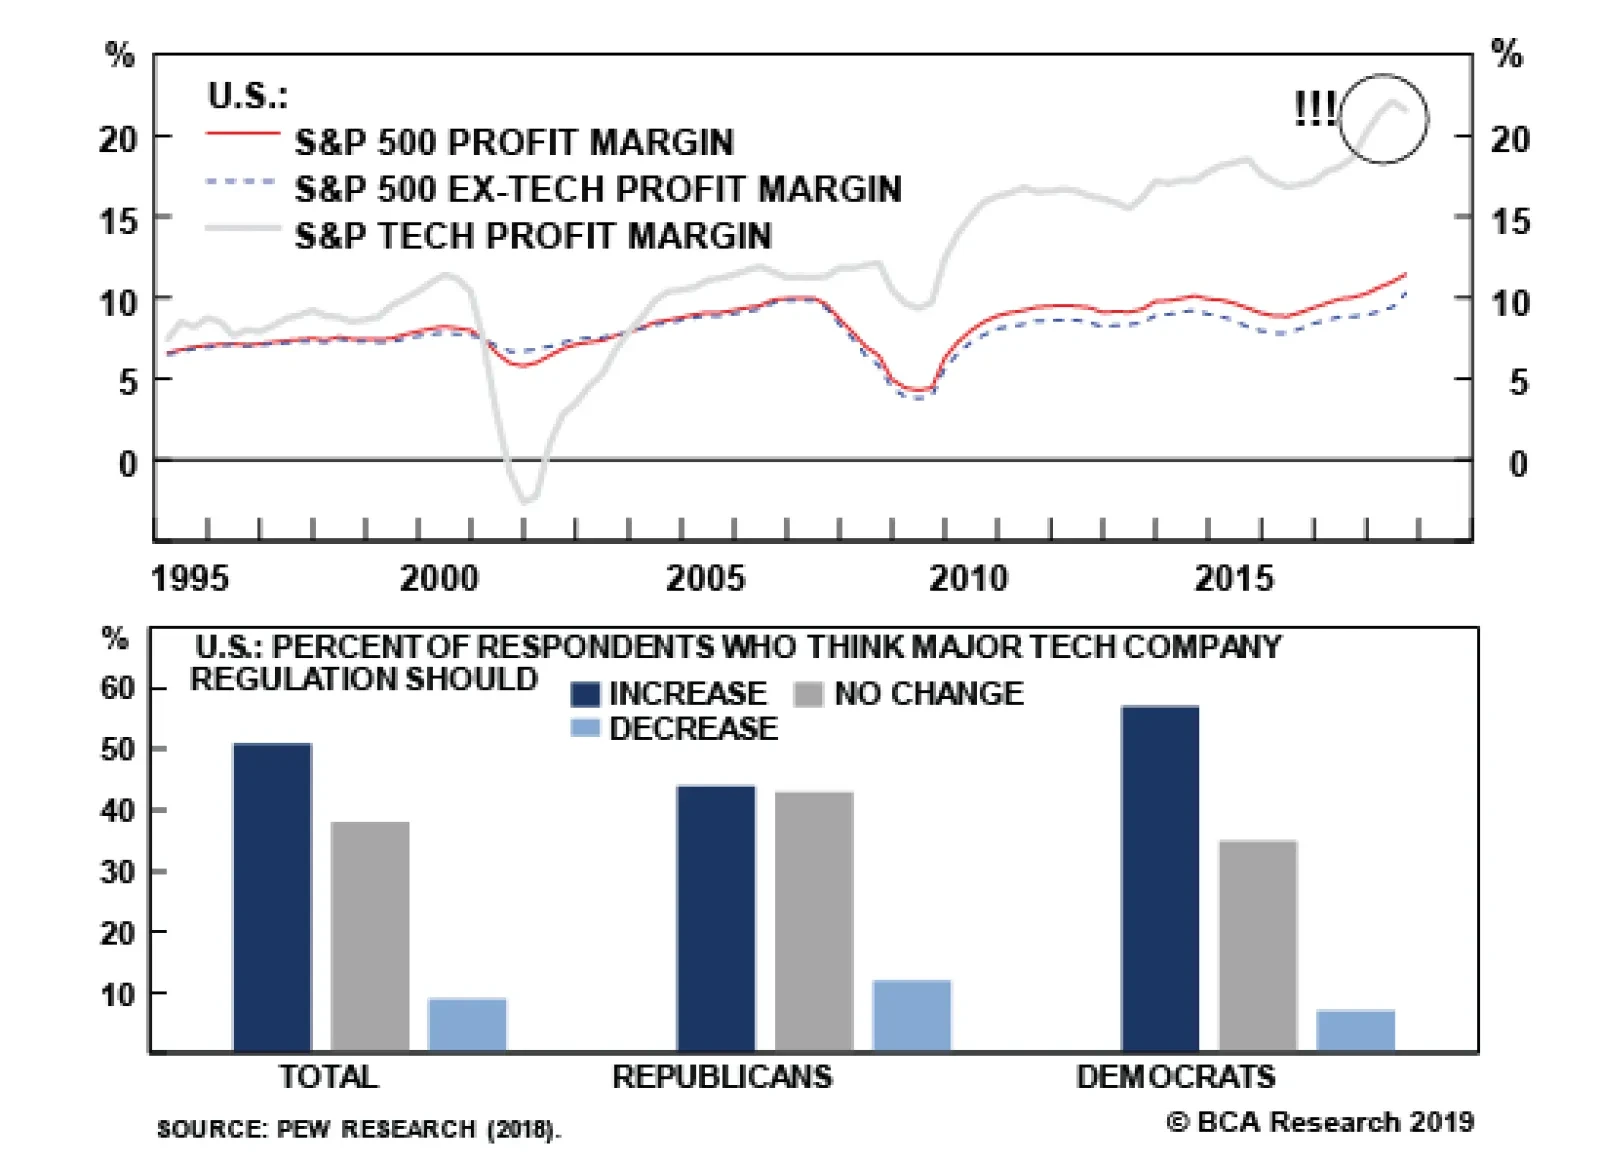
Populism > Profits: Watch Out Tech
…
Overweight (downgrade alert) The S&P tech hardware, storage & peripherals (THSP) index has been falling from its late-summer peak, caused first by weak quarterly guidance from Apple (which comprises close to 90% of the index) and since worsened by last week’s announcement that softness from the key China market would see revenues miss even that lowered bar. This hardly seems surprising in the context of currencies that have not performed to Apple’s benefit as the decline in the RMB (shown inverted in the bottom panel) would mean that even if unit sales held flat, translation would see a fall in Chinese sales. Further, growth in Asian exports and sentiment on Apple’s earnings are tied at the hip (second panel); with a trade war compounding a clearly softer Chinese consumer, a step down in earnings estimates seems logical. Still, the news is not all bad as the core domestic market remains resilient. U.S. consumer spending on electronics is at a multi-year high (third panel) and the currency headwinds to top line growth should prove to be tailwinds to margins, considering the imported content of Apple’s products. Bottom Line: We view the recent pullback in the S&P THSP index as the reset button being pressed and accordingly we reiterate our overweight recommendation. However, we note our existing downgrade alert on the index;1 further deterioration in China would be a likely catalyst to trigger such a move. The ticker symbols for the stocks in this index are: BLBG: S5CMPE - HPQ, WDC, STX, XRX, AAPL, HPE, NTAP. 1 Please see BCA U.S. Equity Strategy Insight Report, “The Falling Apple And The Law Of Gravity,” dated November 13, 2018, available at uses.bcaresearch.com.
Chinese Sales Fall Flat For Apple
Chinese Sales Fall Flat For Apple
Semi Equipment - Enough Is Enough
Semi Equipment - Enough Is Enough
Overweight In this week’s Weekly Report, we highlight three macro factors that, should they sustain their recent trajectories, would serve to catalyze the semi equipment group. First, trade policy uncertainty has dealt a blow to this tech subindex (trade policy uncertainty shown inverted, top panel). Not only are 90% of sales foreign sourced, but a large chunk is also China-related sales. Second, emerging market manufacturing PMIs are showing some signs of life, underscoring that semi equipment demand may turn out to be marginally less grim than currently anticipated (second panel). Third, while global semi sales will continue to decelerate for the next three-to-six months, the semi market is functioning as if the inventory liquidation cycle is in the later innings (third and bottom panel). Net, we think the drubbing in the S&P semi equipment index is overdone and even a modest improvement on either the trade policy, industry demand or currency fronts could result in a reflex rebound. Bottom Line: We lifted the S&P semi equipment index from underweight to overweight on Monday, as a tactical move for the next three-to-six months; please see Monday’s Weekly Report for more details. The ticker symbols for the stocks in this index are: BLBG: S5SEEQ – AMAT, LRCX and KLAC.